California Setback Analyses Summary
FracTracker Alliance has conducted numerous spatial analyses concerning the proximity of oil and gas extraction infrastructure to sensitive receptors, including healthcare centers, locations where children congregate, locations where the elderly congregate, as well sensitive habitat for endangered and threatened wildlife. In this article, we summarize the results of a handful of these analyses that are most relevant to the impact a 2,500’ minimum setback would have on oil and gas extraction in California, discussed here in our recent article. We are providing these summaries as useful references for creating materials and crafting documents in support of establishing policies to protect public health and Frontline Communities, such as setbacks regulations. For further readings on the health threats oil and gas poses for Frontline Communities see PSE Healthy Energy’s literature review of the negative impacts of oil and gas extraction (2009-2015)1, FracTracker Alliance’s literature review of negative health impacts (2016-2019)2, and Stand-LA’s review of literature showing health impacts at multiple distances with reference to 2,500’.3
California Population Counts
In the 2018 The Sky’s Limit report by Oil Change International (OCI),4 FracTracker’s analysis showed that 8,493 active or newly permitted oil and gas wells were located within a 2,500’ buffer of sensitive sites including occupied dwellings, schools, hospitals, and playgrounds. At the time, it was estimated that over 850,000 Californians lived within the setback distance of at least one of these oil and gas wells.
An assessment of the number of California citizens living proximal to active oil and gas production wells was also conducted for the CCST State Bill 4 Report on Well Stimulation in 2016.5 The analysis calculated the number of California residents living within 2,500’ of an active (producing) oil and gas well, and based estimates of demographic percentages on 2015 ACS data at the census block level. The report found that:
- 859,699 individuals in California live within 2,500’ of an active oil and gas well
- Of this, a total of 385,067 are “Non-white” (45%)
- Of this, a total of 341,231 are “Hispanic” (40%) *[as defined by the U.S. Census Bureau]
Population counts within the setbacks were calculated for smaller census designated areas including counties and census tracts. The results of the calculations are presented in Table 1 and the analysis is shown in the maps in Figure 1 and Figure 2 below.
Data for the City of Los Angeles was also aggregated. Results showed:
- 215,624 individuals in the City of Los Angeles live within 2,500’ of an active oil and gas well
- Of this, a total of 114,593 are “Non-white” (53%)
- Of this, a total of 119,563 are “Hispanic” (55%) *[as defined by the U.S. Census Bureau]
Table 1. Population Counts by County. The table presents the counts of individuals living within 2,500’ of an active oil and gas well, aggregated by county. The top 12 counties with the highest population counts are shown. “Impacted Population” is the count of individuals estimated to live within 2,500’ of an oil and gas well. The “% Non-white” and “% Hispanic” columns report the estimated percentage of the impacted population of said demographic.
| County | Total Pop. | Impacted Pop. | Impacted % Non-white | Impacted % Hispanic |
| Los Angeles | 9,818,605 | 541,818 | 0.54 | 0.46 |
| Orange | 3,010,232 | 202,450 | 0.25 | 0.19 |
| Kern | 839,631 | 71,506 | 0.34 | 0.43 |
| Santa Barbara | 423,895 | 8,821 | 0.44 | 0.71 |
| Ventura | 823,318 | 8,555 | 0.37 | 0.59 |
| San Bernardino | 2,035,210 | 6,900 | 0.42 | 0.59 |
| Riverside | 2,189,641 | 5,835 | 0.46 | 0.33 |
| Fresno | 930,450 | 2,477 | 0.34 | 0.50 |
| San Joaquin | 685,306 | 2,451 | 0.55 | 0.42 |
| Solano | 413,344 | 2,430 | 0.15 | 0.15 |
| Colusa | 21,419 | 1,920 | 0.39 | 0.70 |
| Contra Costa | 1,049,025 | 1,174 | 0.35 | 0.30 |
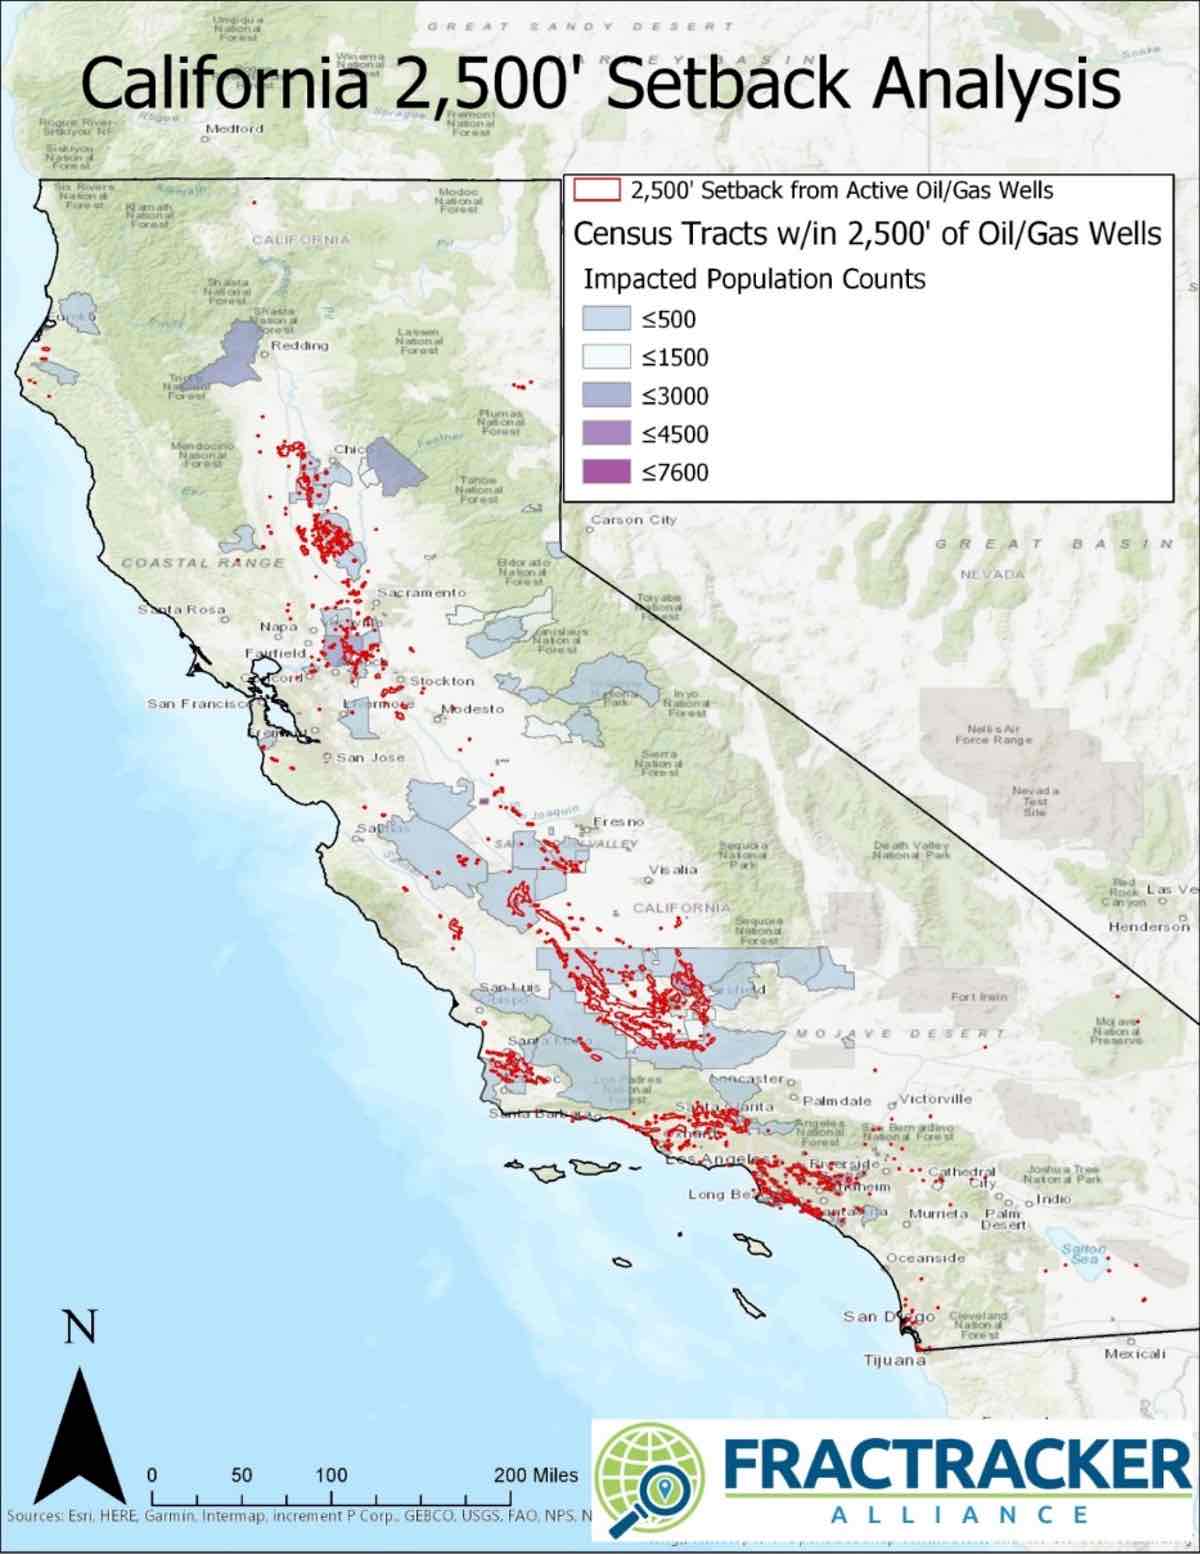
Figure 1. Map of impacted census tracts for a 2,500’ setback in California. The map shows areas of California that would be impacted by a 2,500’ setback from active oil and gas wells in California.
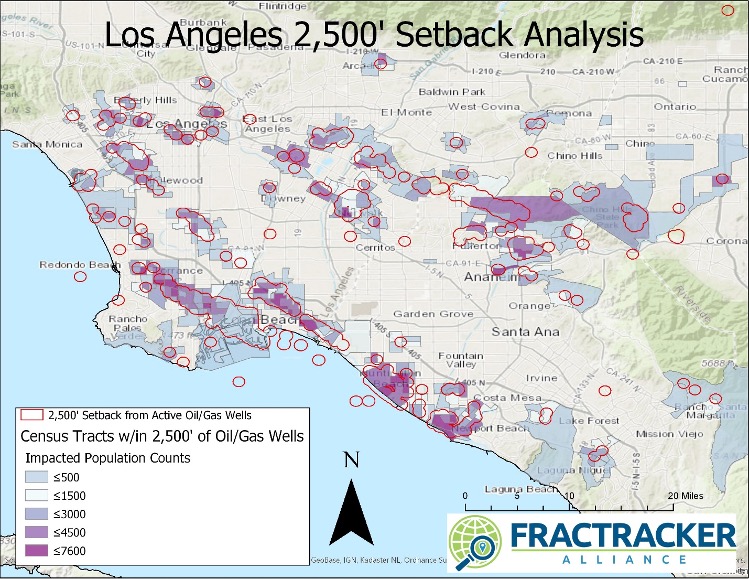
Figure 2. Map of impacted census tracts for a 2,500’ setback in Los Angeles. The map shows areas of California that would be impacted by a 2,500’ setback from active oil and gas wells in Los Angeles.
From the analysis we find that the majority of California citizens living near active production wells are located in Los Angeles County. This amounts to 61% of the total count of individuals within 2,500’ in the full state. Additionally, the well sample population is limited to only wells that are reported with an “active” status. Including wells identified as idle or support wells such as Class II injection or EOR wells would increase both the total numbers and the demographical percentages because of the high population density in Los Angeles.
Well Counts – Updated Data
Using California Geologic Energy Management Division (CALGEM) data published March 1, 2020, we find that there are 105,808 wells reported as Active/Idle/New in California. There are 16,690 are located within 2,500′ of a sensitive receptor (15.77%). Of the 74,775 active wells in the state, 9,835 fall within the 2,500’ setback distance.6
There are 6,558 idle wells that fall within the 2500’ setback distance, of nearly 30,000 idle wells in the state. Putting these idle wells back online would be blocked if they required reworks to ramp up production. For the most part operators do not intend for most idle wells to come back online. Rather they are just avoiding the costs of plugging.
Of the 3,783 permitted wells not yet in production, or “new wells,” 298 are located within the 2,500’ buffer zone (235 in Kern County).
In Los Angeles, Rule 1148.2 requires operators to notify the South Coast Air Quality Management District of activities at well sites, including permit approvals for stimulations and reworks. Of the 1,361 reports made to the air district since the beginning of 2018 through April 1, 2019; 634 (47%) were for wells that would be impacted by the setback distance; 412 reports were for something other than “well maintenance” of which 348 were for gravel packing, 4 for matrix acidizing, and 65 were for well drilling.
We also analyzed data reported to DOGGR under the well stimulation requirements of SB4. From 1/1/2016 to 4/1/19 there were 576 well stimulation treatment permits granted under the SB4 regulations. Only 1 hydraulic fracturing event, permitted in Goleta, would have been impacted by a 2,500’ setback.
Production
Also part of the OCI The Sky’s Limit report,4 we approximated the amount of oil produced from wells within 2,500’ of sensitive receptors. Using the API numbers of wells identified as being within the buffer area, we pulled production data for each well from the Division of Oil, Gas, and Geothermal Resources (DOGGR) database. The results are based on 2016 production data, the latest complete data available at the time of the analysis. The data indicated that 12% of statewide production came from wells within the buffer zone in 2016. Looking at the production data for a full 6 year period (2010 – 2016), production from wells within the buffer zone was 10% on average statewide. Limiting the analysis to only Kern County, the result was actually smaller. About 5% of countywide production in 2016 (6.1 million barrels) was found to come from wells in the buffer zone.
Low Income Communities
FracTracker conducted an analysis in Kern County for the California Environmental Justice Alliance’s 2018 Environmental Justice Agency Assessment.7 We assessed the proportions of wells near sensitive receptors that are located in low-income communities (at or below 80% of the Kern County Average Median Income). We found that 5,229 active/idle/new oil and gas wells were within 2,500’ from sensitive receptors in low-income communities, including 3,700 active, 1,346 idle, and 183 newly permitted “new” oil and gas wells. The maps in Figures 3 and 4 below show these areas of Kern County and specifically Bakersfield, California.
FracTracker’s analysis of low income communities in Kern County showed the following:
- There are 16,690 active oil and gas production wells located in census blocks with median household incomes of less than 80% of Kern’s area median income (AMI).
- Therefore about 25% (16,690 out of 67,327 total) of Kern’s oil and gas wells are located within low-income communities.
- Of these 16,690 wells, 5,364 of them are located within the 2,500′ setback distance from sensitive receptor sites such as schools and hospitals (32%), versus 13.1% for the rest of the state.
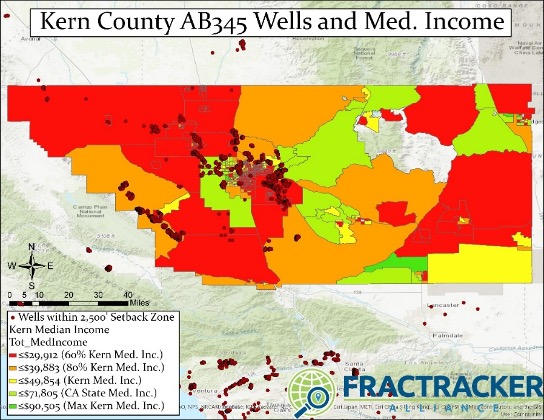
Figure 3. Map of Kern County census tracts with wells impacted by a 2,500’ setback, with median income brackets.
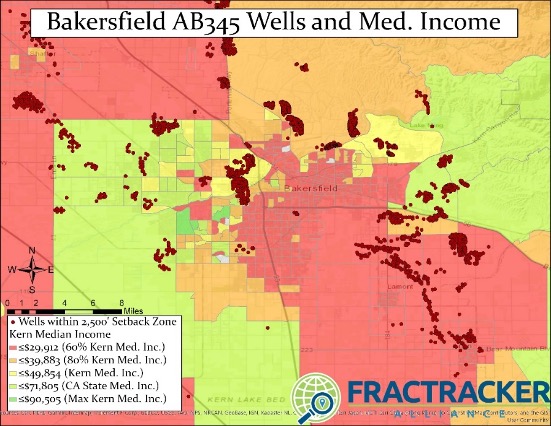
Figure 4. Map of Kern County census tracts with wells impacted by a 2,500’ setback, with median income brackets.
Schools and Environmental Justice
FracTracker conducted an environmental justice analysis to investigate student demographics in schools near oil and gas drilling in California.8 The school enrollment data is from 2013 and the oil and gas wells data is from June 2014. For the analysis we used multiple distances, including 0.5 miles (about 2,500’). Based on the statistical comparisons in the report, we made the following conclusions:
- Students attending school near at least one active oil and gas well are 10.5% more likely to be Hispanic.
- Students attending school near at least one active oil and gas well are 6.7% more likely to be a minority.
- There are 61,612 students who attend school within 1 mile of a stimulated oil or gas well, and 12,362 students who attend school within 0.5 miles of a stimulated oil or gas well.
- School districts with greater Hispanic and non-white student enrollment are more likely to house wells that have been hydraulically fractured.
- Schools campuses with greater Hispanic and non-white student enrollment are more likely to be closer to more oil and gas wells and wells that have been hydraulically fractured.
- Students attending school within 1 mile of oil and gas wells are predominantly non-white (79.6%), and 60.3% are Hispanic.
- The top 11 school districts with the highest well counts are located the San Joaquin Valley with 10 districts in Kern County and the other just north of Kern in Fresno County.
- The two districts with the highest well counts are in Kern County: Taft Union High School District, host to 33,155 oil and gas wells; and Kern Union High School District, host to 19,800 oil and gas wells.
- Of the schools with the most wells within a 1 mile radius, 8/10 are located in Los Angeles County.
- There are 485 active/new oil and gas wells within 1 mile of a school and 177 active/new oil and gas wells within 0.5 miles of a school. This does not include idle wells.
- There are 352,784 students who attend school within 1 mile of an oil or gas well, and 121,903 student who attend school within 0.5 miles of an oil or gas well. This does not include idle wells
Permits
In collaboration with Consumer Watchdog,9 we counted permit applications that were approved in 2018 during Governor Brown’s administration, as well as in 2019 and 2020 under Governor Newsom. The analysis included permits for drilling new wells, well reworks, deepening wells and well sidetracks. Almost 10% of permits issued during the first two months of 2020 have been issued within 2,500’ of sensitive receptors including homes, hospitals, schools, daycares, and nursing facilities. This is slightly lower than the average for all approved permits in 2019 (12.2%). In 2018, Governor Brown approved 4,369 permits, of which 518 permits (about 12%) were granted within the proposed 2,500’ setback.
Conclusion
FracTracker Alliance’s body of work in California provides a summary of the population demographics of communities most impacted by oil and gas extraction. It is clear that communities of color in Los Angeles and Kern County make up the majority of Frontline Communities. New oil and gas wells are not permitted in equitable locations and setbacks from currently active oil and gas extraction sites are an environmental justice necessity. Putting a ban on new permits and shutting down existing wells located within 2,500’ of sensitive receptors such as schools, hospitals, and homes would have a very small impact on overall production of oil in California. It is clear that the public health and environmental equity benefits of a 2,500’ setback far outweigh any and all drawbacks. We hope that the resources summarized in this article provide a useful source of condensed information for those that feel similarly.
References
- Hays J, Shonkoff SBC. 2016. Toward an Understanding of the Environmental and Public Health Impacts of Unconventional Natural Gas Development: A Categorical Assessment of the Peer-Reviewed Scientific Literature, 2009-2015. PLOS ONE 11(4): e0154164. https://doi.org/10.1371/journal.pone.0154164Ferrar, K.
- Ferrar,K., Jackson, E. 2019. Categorical Review of Health Reports on Unconventional Oil and Gas Development; Impacts in Pennsylvania. FracTracker Alliance, Delaware Riverkeeper. https://www.delawareriverkeeper.org/sites/default/files/FracTrackerAlliance_DRKHealthReview_Final_4.25.19.pdf.
- Wong, Nicole. 2017. Existing scientific literature on setback distances from oil and gas development sites. Stand Together Against Neighborhood Drilling Los Angeles. https://www.stand.la/uploads/5/3/9/0/53904099/2500_literature_review_report-final_jul13.pdf.
- Trout, K. 2018. The Sky’s Limit. Oil Change International. http://priceofoil.org/content/uploads/2018/05/Skys_Limit_California_Oil_Production_R2.pdf.
- Shonkoff et al. 2016. Potential Impacts of Well Stimulation on Human Health in California; Well Stimulation in California Chapter Six. California Council on Science and Technology. https://www.ccst.us/wp-content/uploads/160708-sb4-vol-II-6-1.pdf.
- Ferrar, Kyle. 2020. California Setback Analyses Summary. FracTracker Alliance. FracTracker.org. https://www.fractracker.org/2020/04/california-setback-analysis-summary/
- California Environmental Justice Alliance. 2018. Environmental Justice Agency Assessment. https://caleja.org/wp-content/uploads/2019/06/CEJA-Agency-Assessment-FULL-FINAL-Web.pdf.
- Ferrar, Kyle. 2014. Hydraulic Fracturing Stimulations and Oil Drilling Near California Schools and within School Districts Disproportionately Burdens Hispanic and Non-White Students. FracTracker Alliance. https://www.fractracker.org/a5ej20sjfwe/wp-content/uploads/2014/11/Fractracker_SchoolEnrollmentReport_11.17.14.pdf.
- Ferrar, K. 2019. Permitting New Oil and Gas Wells Under the Newsom Administration. FracTracker Alliance. https://www.fractracker.org/2019/07/permitting-more-oil-gas-newsom/.
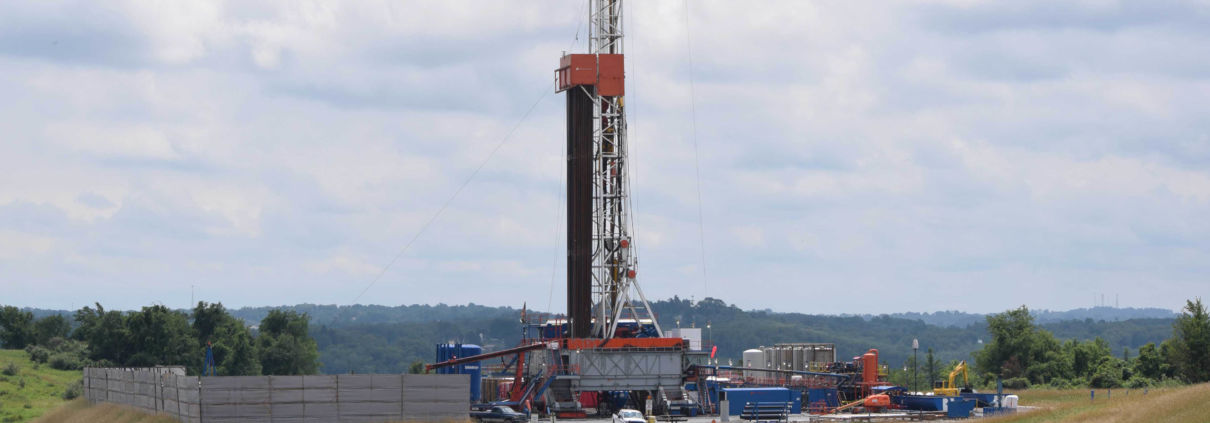
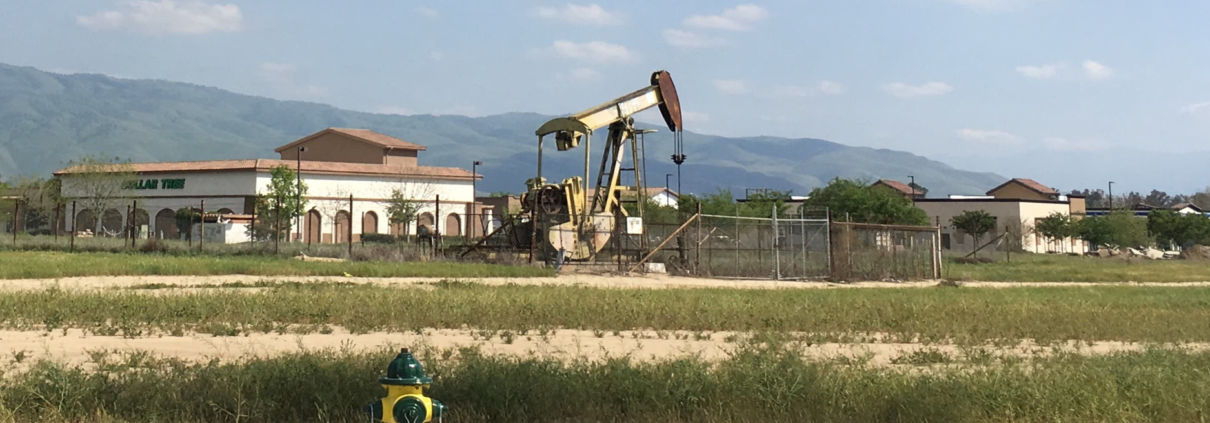
Feature photo of a well pad in California in April 2018, by Brook Lenker, FracTracker Alliance.
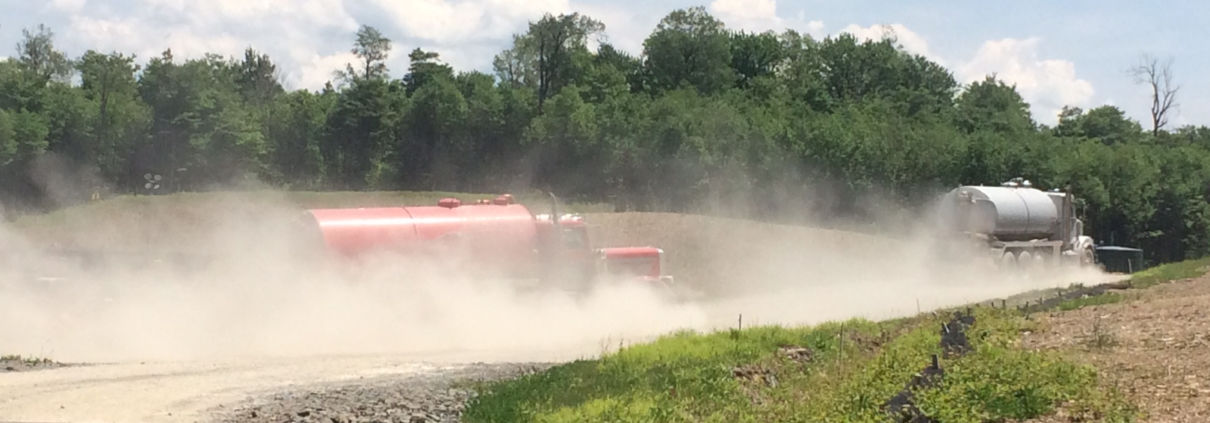
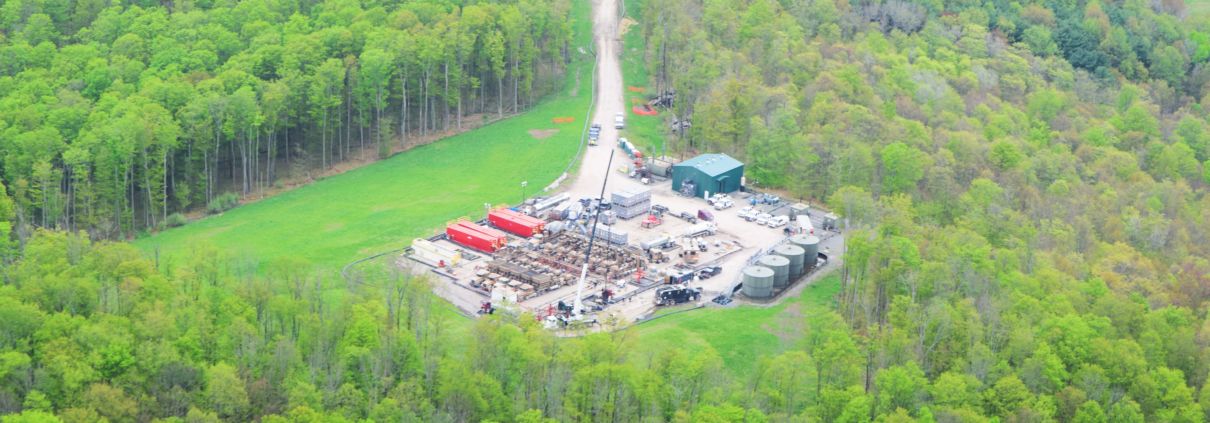
 Photo by Ted Auch, FracTracker Alliance, with aerial support by LightHawk