Pennsylvania Conventional Well Map Update
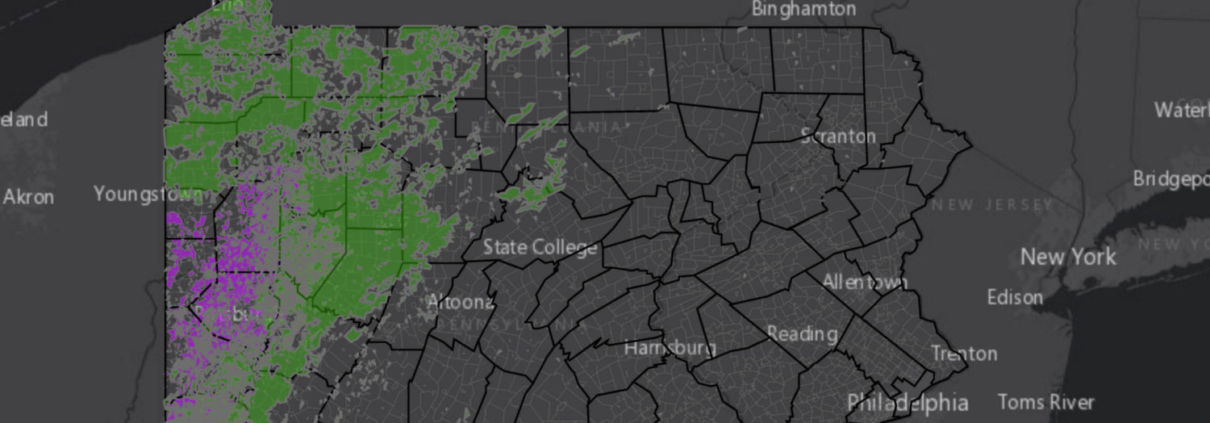
There are over 100,000 active conventional wells in PA, with more permitted each year. Most are unplugged, posing serious threats to the climate.
There are over 100,000 active conventional wells in PA, with more permitted each year. Most are unplugged, posing serious threats to the climate.
In August 2020, the Colonial Pipeline ruptured, spilling an estimated 1.2 million gallons of gasoline—18 times more than originally reported.
The Mi’kmaq First Nations people are facing threats to their lands and water due to plans in Nova Scotia proposed by AltaGas.
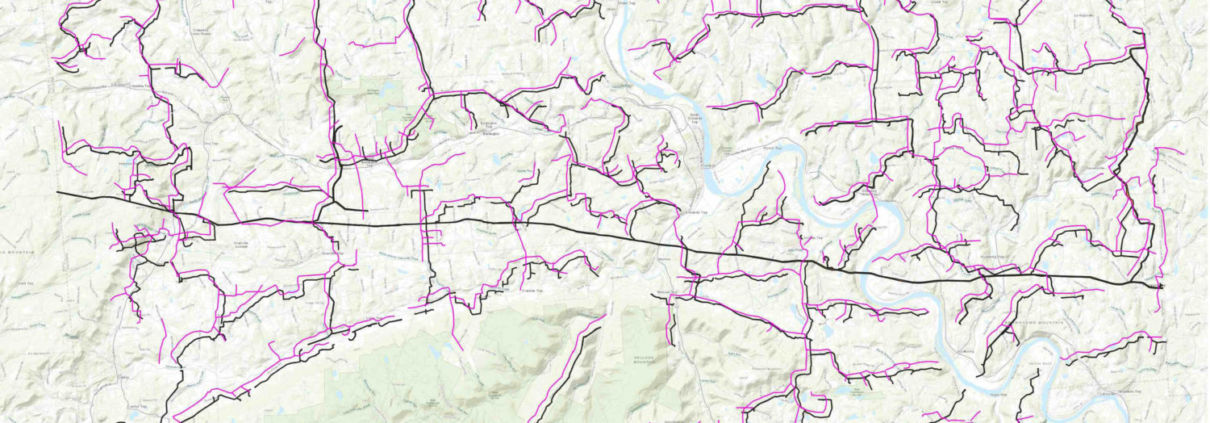
FracTracker mapped gathering lines in Bradford County, PA. Public data on gathering lines are incomplete, leaving us to fill in the gaps.
Over the past decade, New York State has seen a steep decline in the quantity of waste products from the fracking industry sent to its landfills for disposal. Explore FracTracker’s 2020 updated data.
The map below shows 6,950 total incidents since 2010, translating to 1.7 incidents per day. Pipelines are dangerous, in part because regulation around them is ineffective.
New York State Department of Environmental Conservation (DEC) Oil and Gas Database includes records for nearly 45,000 wells in the state, nearly all of which are related to the oil and gas industry. Of these records, only 19,600 include drilling dates; some records simply reflect drilling permits that were applied for and expired, or were cancelled for other reasons. Of the records listed, 99% of those drilled are vertical, “conventional” wells.
Research by Bishop (2013) indicates that there could be more than 30,000 additional oil and gas wells that are not documented in the DEC’s database, and potentially not adequately plugged.
Over the past half-century, drilling activity in New York State has ebbed and flowed. In that period of time, drilling interest in oil and gas saw two main peaks: between 1975 and 1985, and — especially for gas — between 2004 and 2010. Gas drilling activity has currently tailed off to practically nothing since the ban on high-volume hydraulic fracturing was passed in late 2014.
In 2018 and 2019, there was a brief flurry of oil drilling, but that too has dropped off. The causes for the decline in new wells are complicated, but likely reflect a combination of reduced consumption of fossil fuels, as well as steady decreases in the price of oil and gas. Prices in the past several years are up to half what they were previously. In addition, the impact of COVID on the industry has also contributed to this decline, although other sources assert that the fossil fuel industry has benefited from the global pandemic.
In this article we’ll look specifically at spatial and temporal patterns in oil and gas drilling across New York State.
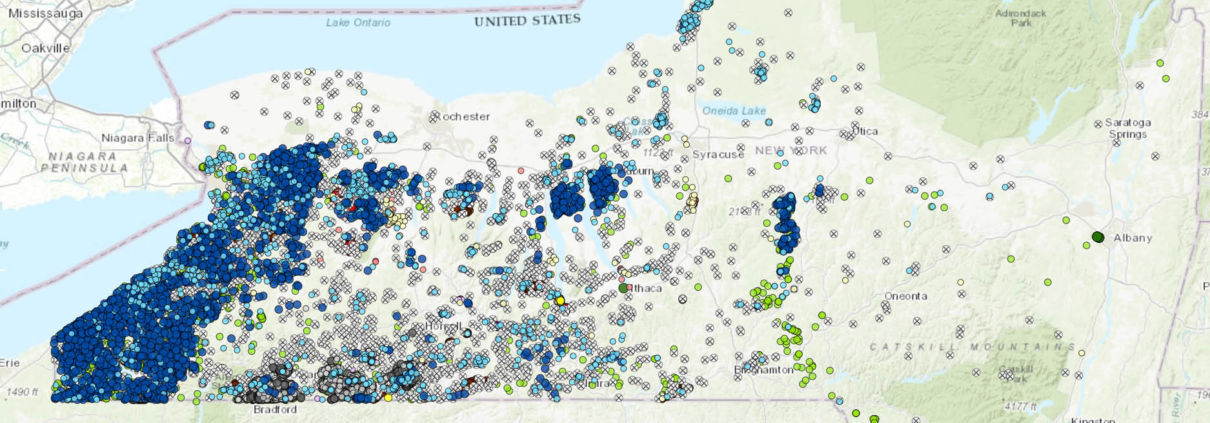
Every year, FracTracker updates the full state-wide dataset of oil, gas, and other assorted (non-drinking water) wells. To see the entire “big picture,” you can explore our interactive map below, which shows all wells in the New York State database, from prior to 1900 through late February 2021.
This map shows that, despite New York State banning high volume hydraulic, nearly 45,000 wells have been drilled, according to the Department of Environmental Conservation (DEC). Not all the wells in the DEC’s database were actually drilled; some were sites that were permitted, but never explored. Many have been plugged and abandoned. There may be nearly as many undocumented wells as there are in the database, given that record keeping in earlier years was nowhere near as comprehensive as it is today.
In order to turn layers on and off in the map, use the Layers dropdown menu. This tool is only available in Full Screen view. Data sources can be found in the Details section of the map as well as listed the end of this article.
View Full Screen | Updated February, 2021
FracTracker has also taken a more fine-grained approach to consider the patterns in drilling in New York State both spatially and temporally. Using the DEC wells database, we first filtered out well data for records that had actual spud (drilling) dates between 1970 and the present. Then, using pivot tables in Microsoft Excel, we graphed the data, and also looked for patterns around where the drilling was taking place.
Emergent from this process, we see the following.
Oil and gas hotspots are directly related to the underlying geology of a region. In New York State, the majority of oil wells have been drilled in the Chipmunk and Bradford Formations, followed by the Fulmer Valley, Glade, and Richburg Formations.
Updated February 2021
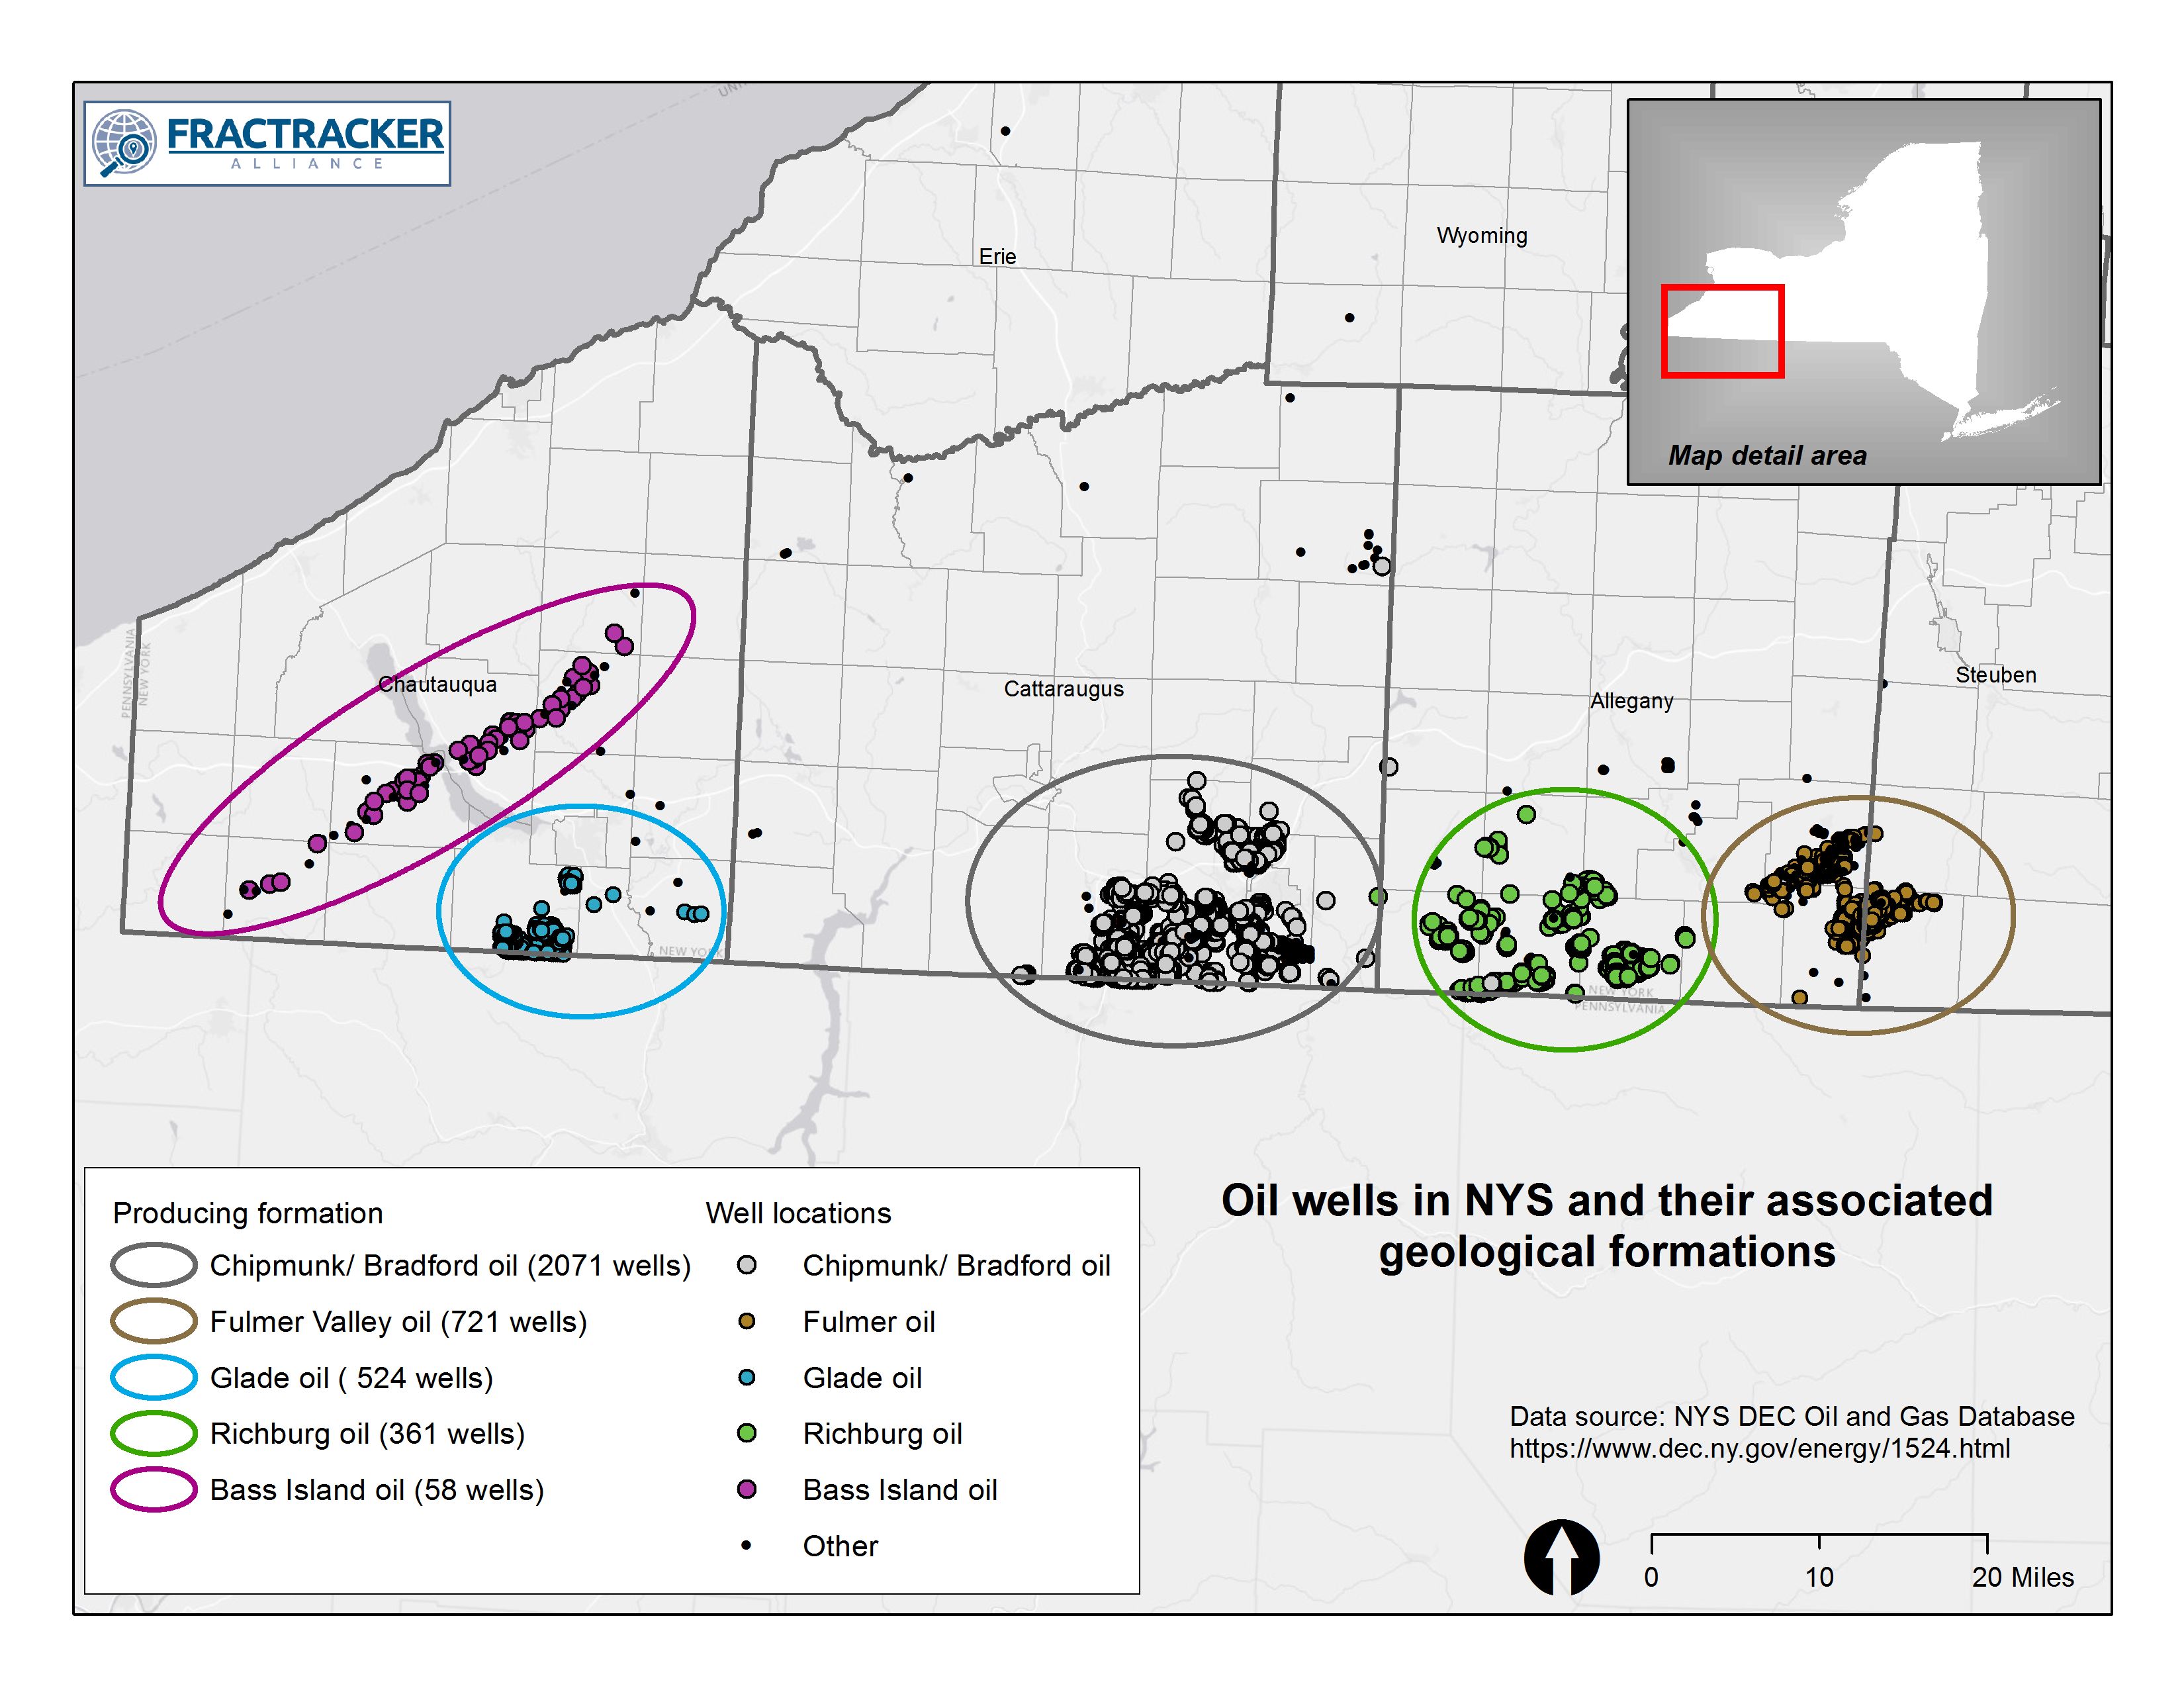 Figure 1. Oil Wells in NYS and Their Associated Geological Formations. Gas wells have historically been most productive in the Medina Formation, followed by the Queenston, and also Trenton-Black River Formations. Data source: New York State DEC Oil and Gas Database.
Updated February 2021
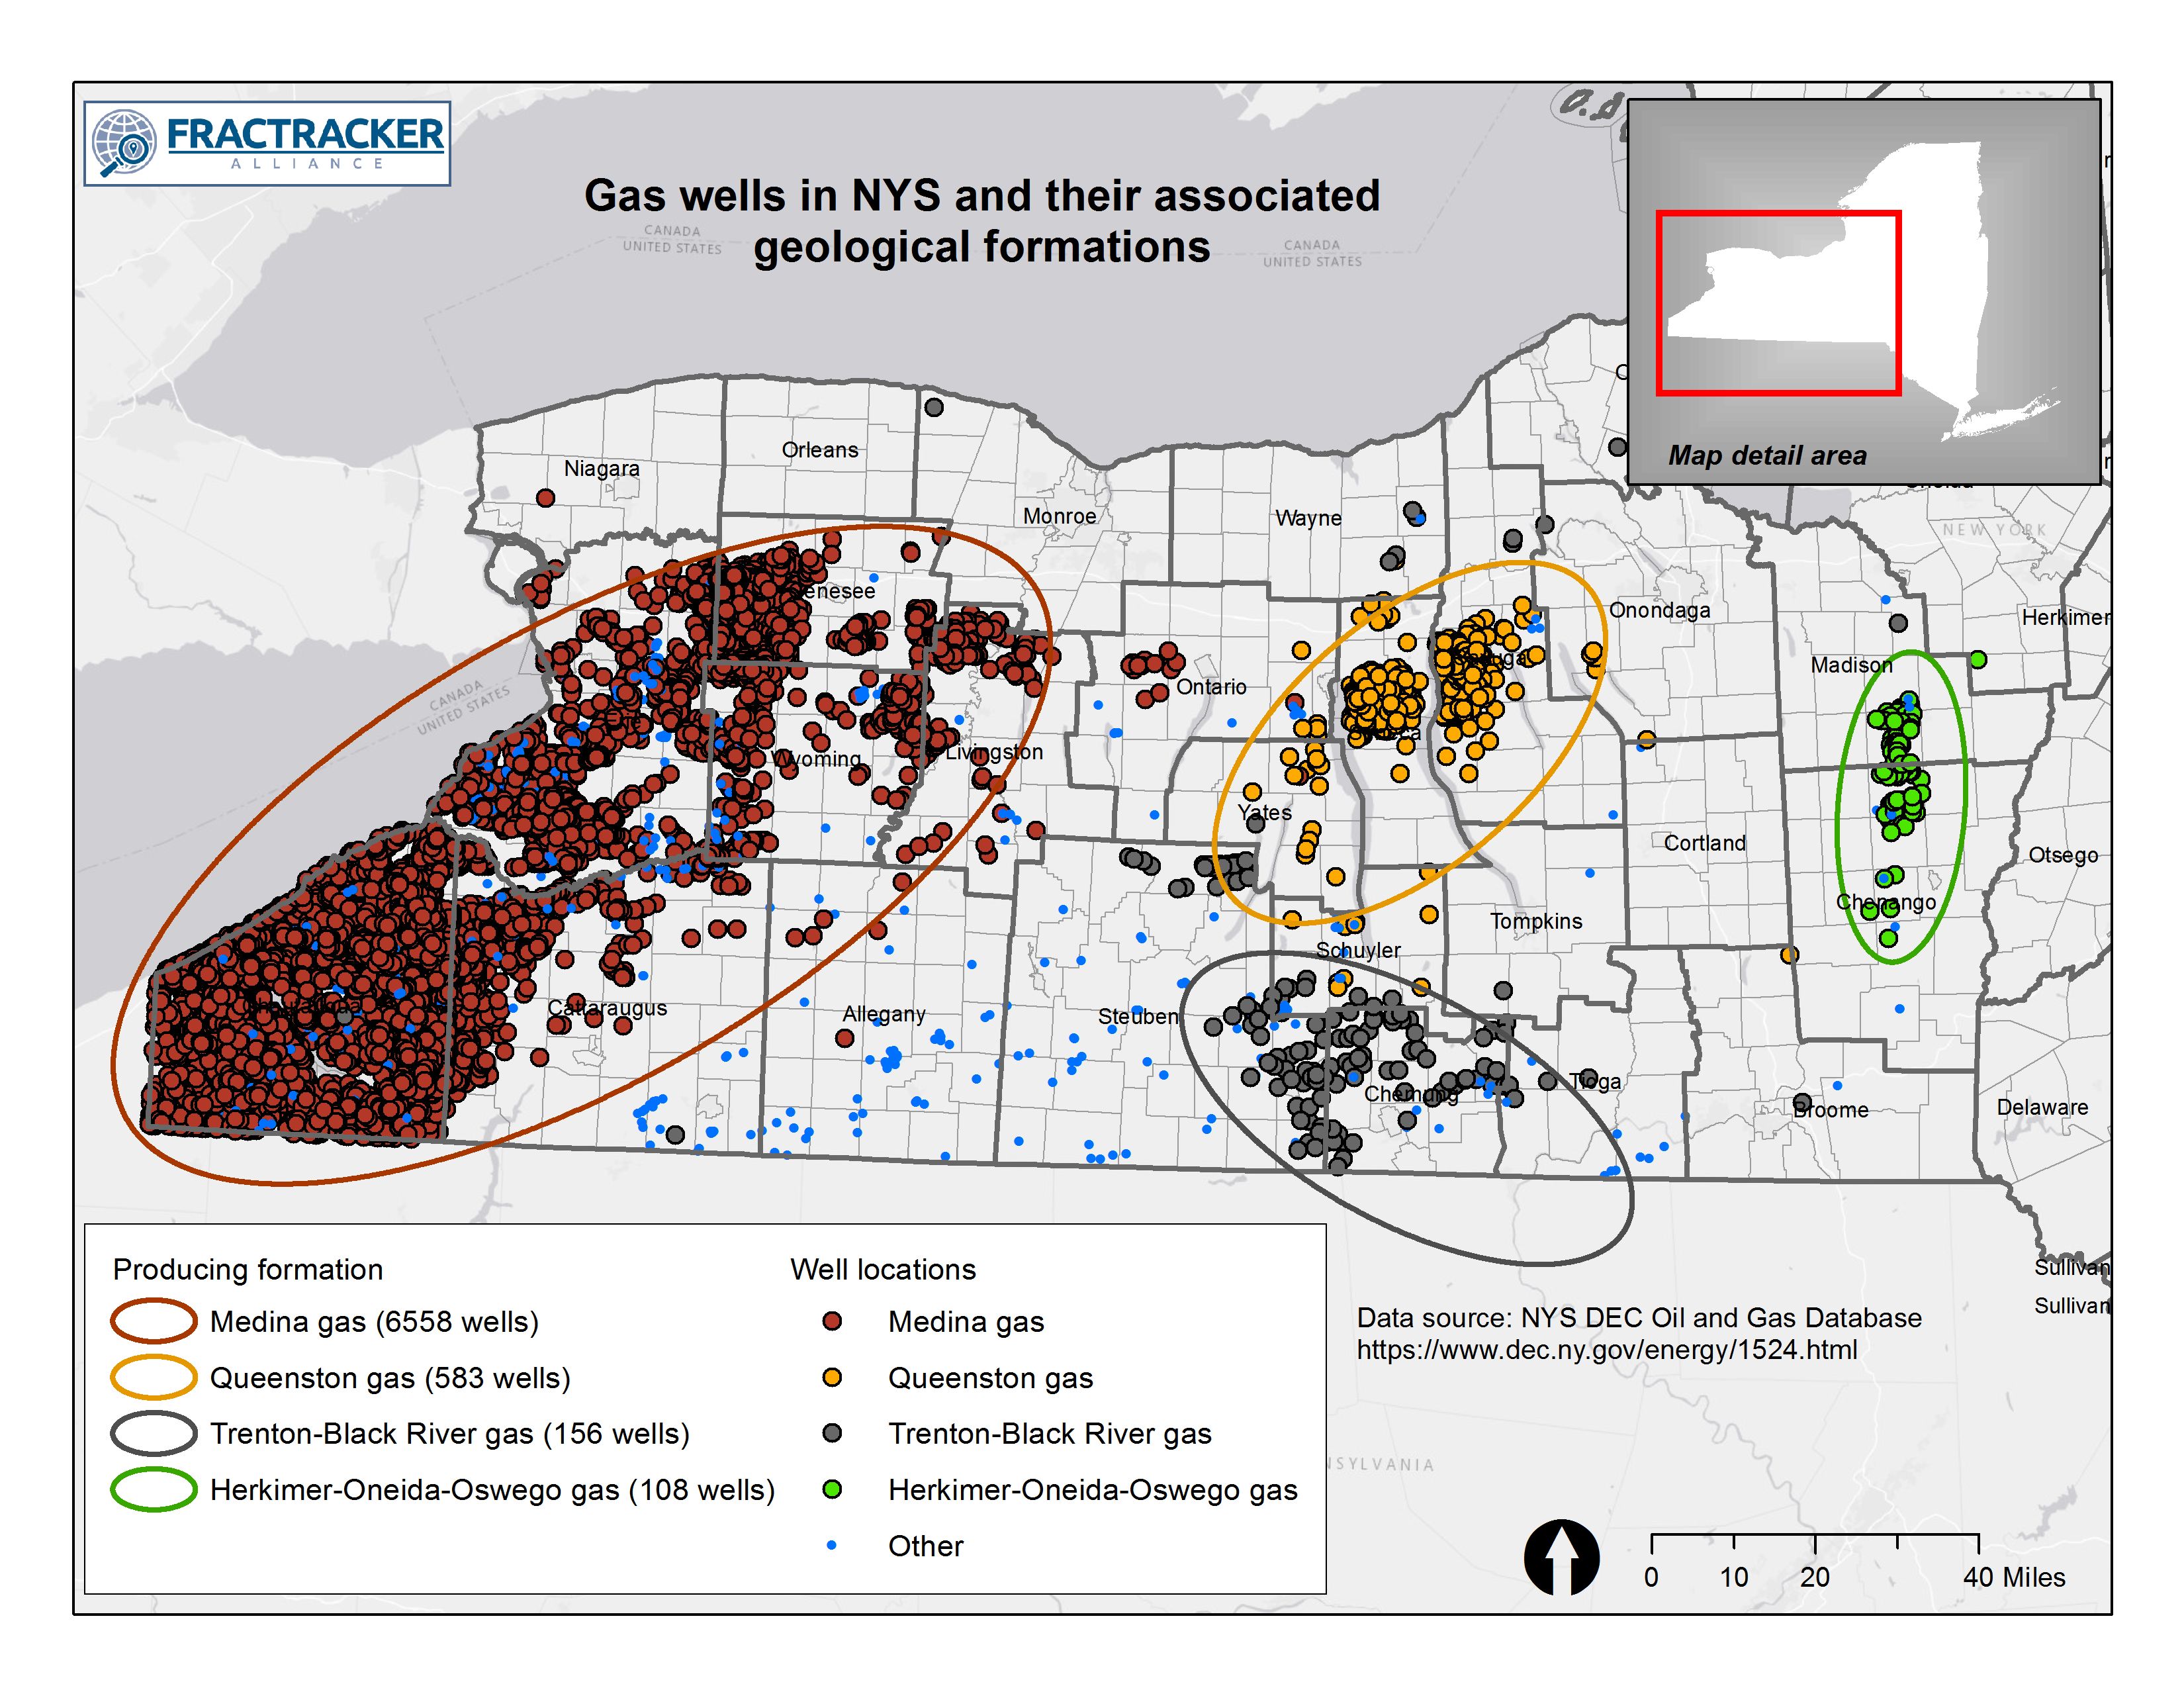
Figure 2. Gas wells in NYS and their associated geological formations. Data source: NYS DEC Oil and Gas Database.
Activity in drilling has exhibited distinct patterns over time, as well.
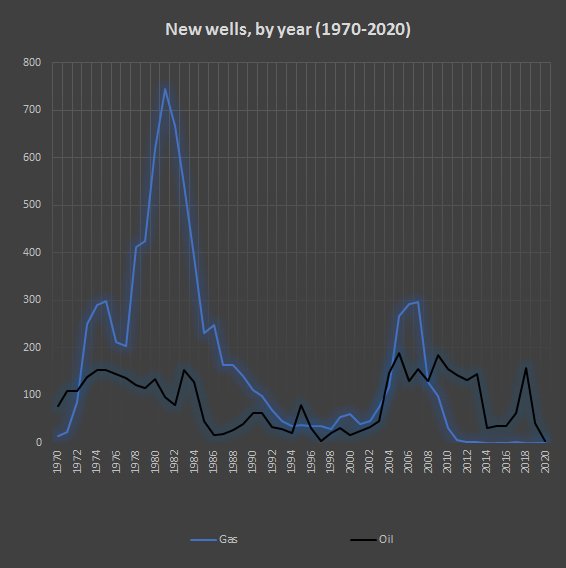
Figure 3. New oil and gas wells in New York State by year (1970-2020). Data source: New York State DEC Oil and Gas Database.
In 1982 and 1983, gas drilling in New York State surged, with 774 and 667 new wells drilled over those two years, respectively. The hot spot was in the Medina Group, which over the years, continued to be a primary focus. Well depths in this section of bedrock average around 3,400 feet at that time, although wells were exploited at a more shallow depth in subsequent years. Starting in 1995, gas was discovered in the Black River shale formation, with reservoirs more than 10,000 feet deep in some places. All of these wells were vertically oriented, but still were exploited using hydraulic fracturing technologies.
The early to mid-1980s marked a relatively high level in oil well drilling in New York State, with a peak occurring in 1984, with 153 wells drilled. After a lull of about 20 years, activity picked up again in 2005, hitting a high point in 2006 when 188 oil wells were drilled. In 2010, there was another peak with 188 wells, followed by a waning period of 4 years. Then, in 2019, interest exploded in a small area of the Bradford oil fields in Cattaraugus County, with 156 wells drilled, and an average production of 319 barrels per well over the course of that year.
According to EIA estimate from 2014, the cost of drilling an onshore oil well is between $4.9 – 8.3 million, however smaller vertical wells like those common in New York State are likely to cost more in the range of $150,000. With the price of oil at $64 a barrel in 2019, in its first year in production, the gross profit of any of these wells in New York, based on reported production, would have been between $0 and $120,000, with an average year around $20,400 per well. It’s hard to imagine how drilling for oil in recent years in New York State could have possibly been profitable, in particular with the steep drop-off in production typically seen after the first year or two.
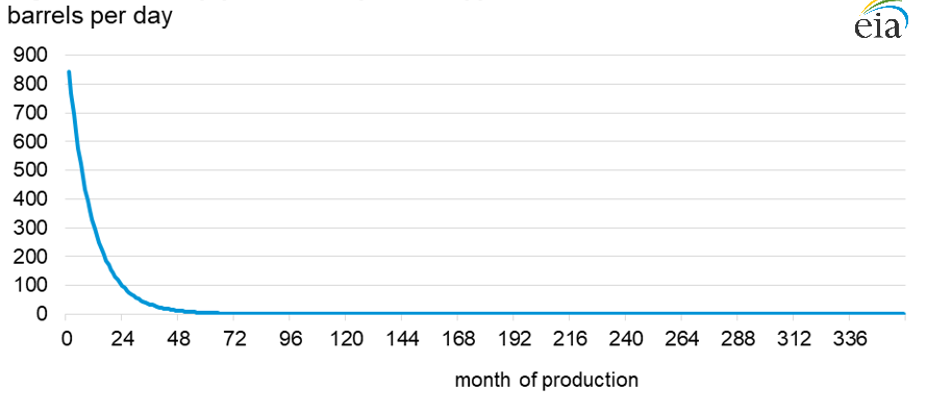
Figure 4. Example of monthly production decline following drilling of an oil well. Data source: US Energy Information Administration
These simple examples of a localized “oil boom” in New York State provide a stark example of exactly how unsustainable these endeavors are, particularly for small drilling operators. So, despite the enthusiastic rush to oil drilling in 2019, activity after that has been followed by a quick decline, with only 41 oil wells drilled in New York State in 2020, and only 4, so far, in 2021.
The increase in dry wells seems to track with the general patterns of oil and gas exploration. Hence, in periods when a lot of oil and gas wells are being drilled, there will be a higher number of wells that are dry, or nonproductive. During the 1970s, there was also a strong peak in disposal wells drilled. We are not certain whether this is, or is not, related to the high number of gas wells drilled during this period.
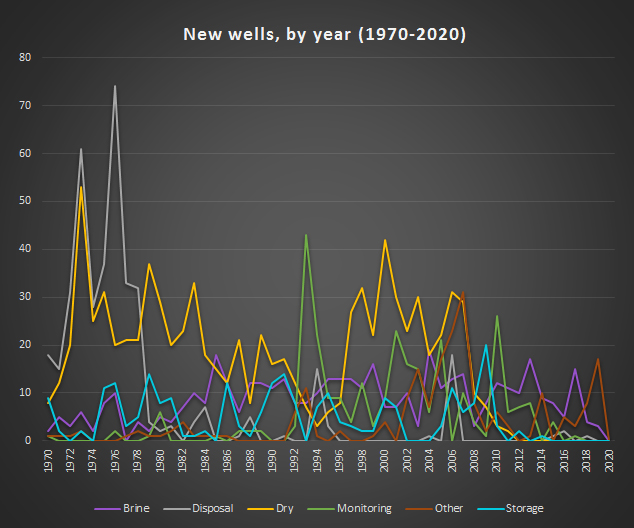
Figure 5. New oil and gas wells in New York State, by year (1970-2020). Data source: New York State DEC Oil and Gas Database
Some of the oil and gas wells drilled in the 19th and early 20th century were particularly poorly documented (or not documented at all), and improperly plugged. This creates a public and environmental safety hazard, with more than 30,000 of these undocumented oil and gas wells spread across the state potentially leaking methane into the air and water. Finding the abandoned and orphan wells has been a long term problem because they are often located in rough terrain across central and western New York. Fortunately, the New York State Department of Environmental Conservation has taken new measures to locate and plug these legacy wells, using drone technology. FracTracker reported on a pilot initiative a few years ago that was testing this technique, but the new program is backed by $400,000 in funding from NYSERDA, the New York State Energy Research and Development Authority, in support of New York States ambitious goals to reduce greenhouse gas emissions through the Climate Leadership and Community Protection Act.
One hundred years ago, few people expressed concerns about the environmental hazards associated with oil and gas drilling. Record-keeping was spotty, which has left us with a legacy of wells whose locations are lost to memory, or simply improperly plugged. After several periods of vigorous mineral extraction activity in the 1980s and early 2000s, oil and gas drilling has declined in its profitability, and formerly easily-accessed reserves have been depleted. Today, with unprecedented interest in clean energy sources like wind, geothermal, and solar, society can become less dependent on fossil fuels, and focus on responsibly stewarding the remnants of these “dinosaurs,” using new technologies to help clean up the damages left by them.
NYS gas wells, 19 February 2021
NYS oil wells, 19 February 2021
NYS monitoring wells, 19 February 2021
NYS dry holes, 19 February 2021
NYS disposal wells_19 February 2021
NYS storage wells, 19 February 2021
NYS brine wells, 19 February 2021
NYS other wells_19 February 2021
In December 2019, Plains All-American and Valero pipeline companies announced plans to build the 49-mile Byhalia Pipeline through southwestern Tennessee and northwestern Mississippi. The proposed Byhalia Connection Pipeline is a 24-inch, high pressure (1500 psi) conduit, conveying crude oil coming Oklahoma, bound for the Gulf coast. The pipeline, which is designed to carry up to 420,000 barrels of oil a day, provides a link between the Diamond Pipeline to the west and the Capline Pipeline to the east. Construction is planned to begin in early 2021, and be completed by year’s end. Plains All-American insists that all safety precautions are being considered, but the outcry among residents and environmental advocates has been considerable.
Many factors—environmental, geological, social, and economic—have emerged as reasons that this pipeline should not move ahead. And industry most certainly didn’t count on pushback from the local community. Residents, allies, and the media have risen up to challenge the project. In this article, we’ll take a look at the story from various perspectives, augmented by FracTracker’s mapping insights.
UPDATE: On Friday, July 2, 2021, Plains All American announced that it would be abandoning its plans to build the controversial Byhalia Connection Pipeline. As one activist involved in the fight proudly stated, “We’ve shown them that we aren’t the path of least resistance. We are the path of resilience.” Read more about this momentous victory for the people of South Memphis here.
Environmental and hydrological
Demographics and disaster preparedness
This interactive map looks at the various risks associated with the proposed Byhalia Connection Pipeline. The map contains all of the data layers related to the topics in this article. Scroll down in this article to find interactive maps separated out by topic. All data sources are listed in the “Details” section of the maps, as well as at the end of this article. Items will activate in this map dependent on the level of zoom in or out.
View Full Screen | Updated March, 2021
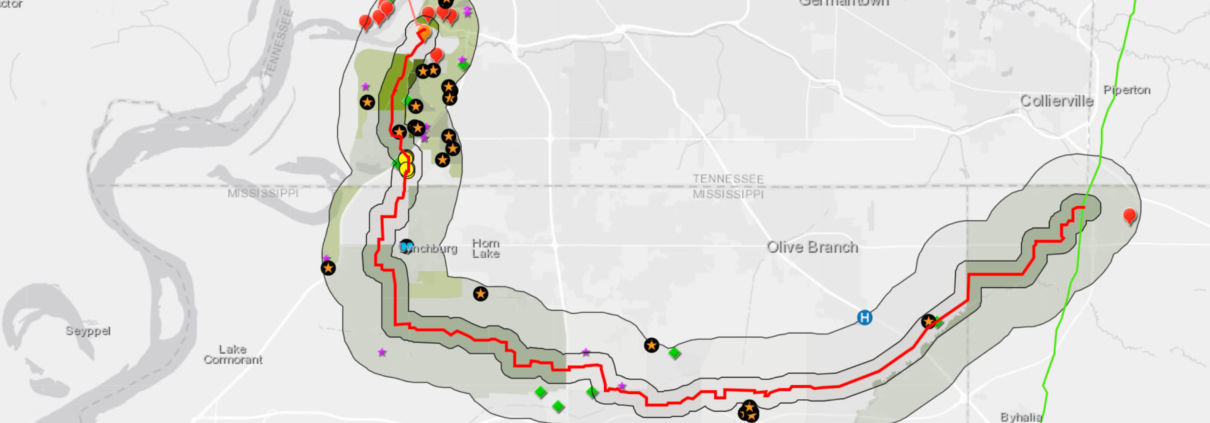
The 49-mile route of the proposed Byhalia Connection Pipeline passes through a patchwork of rural, suburban, and urban landscapes. Along the route, the pipeline would cross seven named waterways — Johnson Creek, Hurricane Creek, Bean Patch Creek, Camp Creek, Short Brook, Camp Creek Canal, and Coldwater Creek — and also pass immediately adjacently to a nearly 5-mile-long wetlands complex that surrounds the Coldwater River. But the natural environment is home to many more waterways than those that have official names on topographic maps. According to FracTracker’s inspection of National Wetlands Inventory data collected by the United States Fish and Wildlife Service, the proposed pipeline crosses or touches 62 streams in 102 separate locations, 25 forested wetlands, an emergent wetland, 17 ponds, and one lake.
Close to the City of Memphis, 0.8 miles of the pipeline would run directly through the Davis Wellfield Wellhead Protection Zone. The proposed pipeline is located over the extraordinary Memphis Sands Aquifer, which provides potable water for more than 400,000 people. Memphis Light, Gas and Water (MLGW) Company pumps water from over 175 artesian wells in Shelby County, Tennessee, alone—right in the path of the pipeline route. The aquifer itself is a sensitive resource, already under demand by the human population of the area, as well as many industries such as breweries and as a supply of cooling water for a nearby power plant.
Memphis Sands Aquifer is part of the larger Middle Claiborne Aquifer, a groundwater and geological unit in the lower Mississippi drainage. Technically speaking, the Memphis Sands portion of the aquifer is located in Tennessee, but is continuous with the Sparta Sands Aquifer, located in Mississippi. In the eastern portion of the Byhalia Connection’s proposed route, wetlands along Coldwater River are directly part of the recharge zone of this aquifer.
To learn more about the hydrologic features that may be impacted by the proposed Byhalia Connection Pipeline, explore our interactive map. When this map is viewed full-size, you can choose to view additional layers from the drop-down Layers menu.
View Full Screen | Last updated March 2021
The Memphis Sands Aquifer lies 350 to 1000 feet under Memphis (see Figure 1), and spans an area of 7500 square miles, roughly the size of Lake Ontario. “It’s one of the best (aquifers) in the world in terms of thickness, aerial content, quality of water”, according to Roy Van Arsdale, Professor of Geology at University of Memphis. Under Shelby County alone — where Memphis is located — the aquifer contains approximately 58 trillion gallons of clean water. Over time, the aquifer has seen threats from overpumping, as the population of Memphis grew. In addition, industrial pollution has turned up in some samples, including cancer-causing benzene. Policy protections on the aquifer have been lacking, although there is increasingly vocal public awareness about the need for more comprehensive groundwater resource protection in the area.
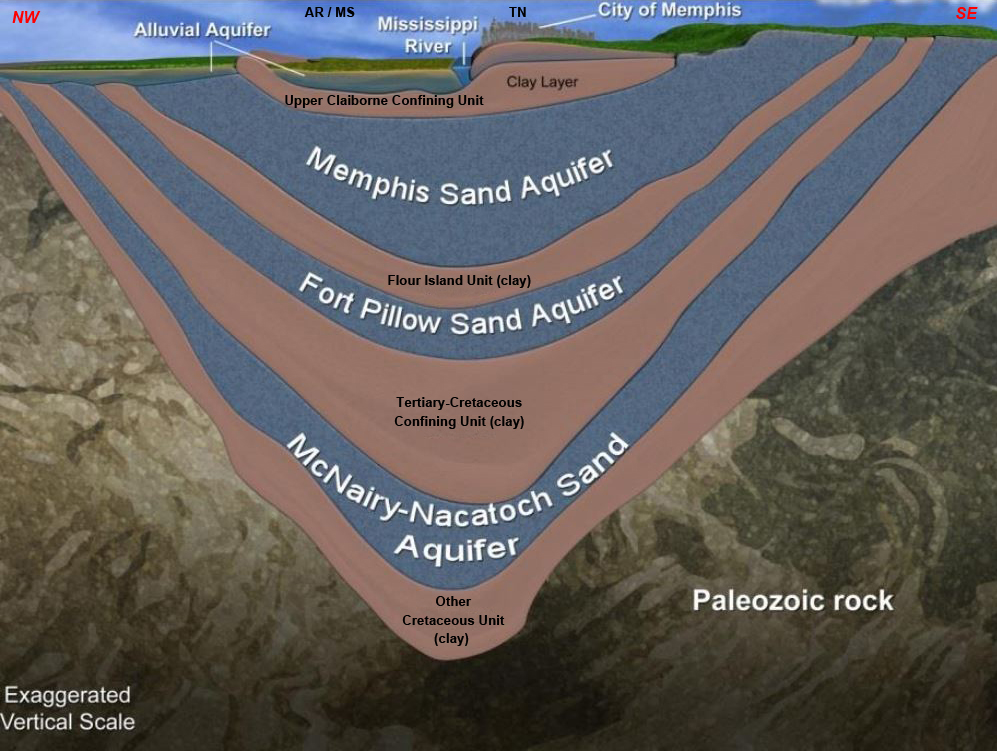
Figure 1. Cross-section of aquifers under Memphis, TN. Graphic modified from here.
Although water withdrawals from the aquifer have declined significantly since 2000 due, in part, to more water-efficient household appliances that reduce demand in comparison with older models, the MLGW pumped 126 million gallons a day from the aquifer in 2015. Consequently, the level of the aquifer has been rising in recent years, as the rate of recharge has exceeded use.
The courts have suggested that the water in the aquifer is an intrastate resource, and that therefore, Mississippi cannot have sole governance over the extraction of the water within its state boundaries. Instead, usage should be through “equitable apportionment.” Further arguments are still pending, as of late 2020. In short, as Figure 1 shows, withdrawal and recharge of the aquifer do not respect state boundaries.
The details of water law, and who can tap into these, and other deep, ancient aquifers, are complex questions in which agriculture, ecology, geology, and technology bump up against each other. All of these interests, not to mention human health, could be heavily impacted by a crude oil pipeline rupture or other accident that resulted in contamination of this groundwater resource.
Crude oil spills release a panoply of volatile organic compounds into the air and water that are extremely harmful to human and environmental health. These include benzene, ethylbenzene, toluene, and xylene. Polycyclic aromatic hydrocarbons (PAHs), such as carcinogenic benzo[a]pyrene, are also released. In addition, if the oil combusts, hydrogen sulfide gas, as well as heavy metals, including nickel, mercury, and cadmium, will become airborne.
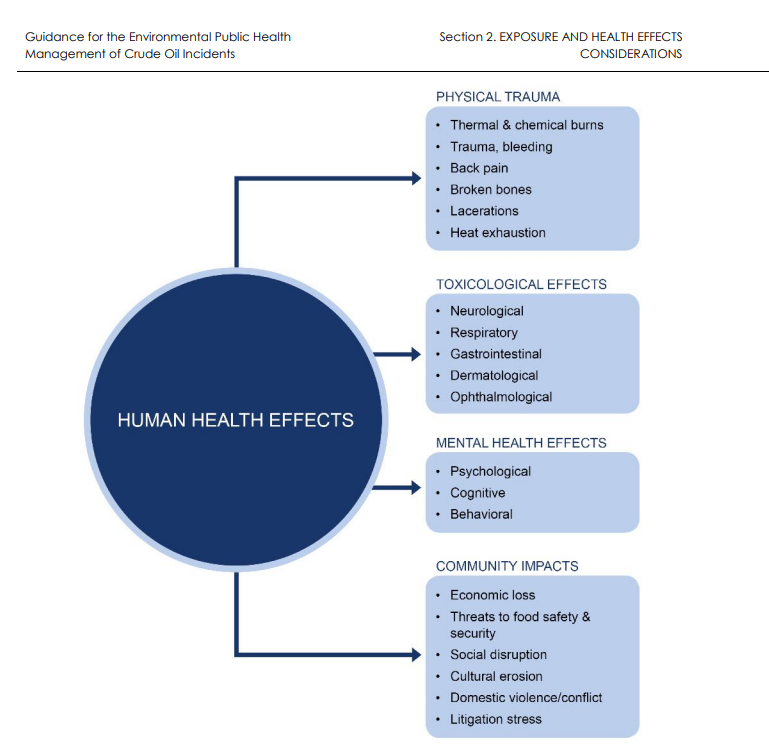
Figure 2. Observed/documented oil spill-induced acute and chronic human health effects. Source: Guidance for the Environmental Public Health Management of Crude Oil Incidents, Health Canada (2018).
The take-away is that crude oil spills from pipelines are not uncommon, result in environmental damage, impacts on the health and safety of workers and nearby residents. Most importantly, despite monitoring and inspections, pipelines fail. A partial list of pipeline failures is shown in the sidebar.
Within the 2-mile buffer of the pipeline, there are 20 facilities that the United States Environmental Protection Agency (US EPA) lists in its Toxic Release Inventory (TRI), including several chemical plants associated with hydrocarbon extraction. Carcinogens such as polycyclic aromatic compounds, benzene, styrene, dioxins, and naphthalene are just a few of the compounds produced by facilities owned by Valero Energy Corporation, Drexel Chemical Company, and other companies within the 2-mile buffer zone of the pipeline, which compound the risks to the populations there. In addition, while the TRI lists exposure to toluene and xylene from these facilities, neither are categorized by EPA’s TRI database as a carcinogen due to a lack of data; however, their deleterious impacts on the central nervous system are undeniable, and well- documented (see examples here and here).
View Full Screen | Updated March, 2021
In this interactive map, you can see sites in the proposed Byhalia Connection route that are listed in the TRI, as well as civic facilities like schools, daycare centers, and health care facilities. When this map is viewed full-size, you can choose to view additional layers from the drop-down Layers menu.
The most active seismic fault line in the eastern United States — the New Madrid Fault — is located about 40 miles from one end of the proposed pipeline (see Figure 2). The last major earthquakes along this fault line occurred in 1811 and 1812. Although the current Richter scale was not in use at that time, first quake in mid-December 1811 was estimated to have had a magnitude of between 7.2 and 8.2, and was followed by an aftershock of about 7.4. In January and February of 1812, there were additional earthquakes of this magnitude. Obviously, at this time in history, there was relatively sparse population in the area, and little infrastructure. Were such a quake to occur today, the outcomes would be catastrophic.
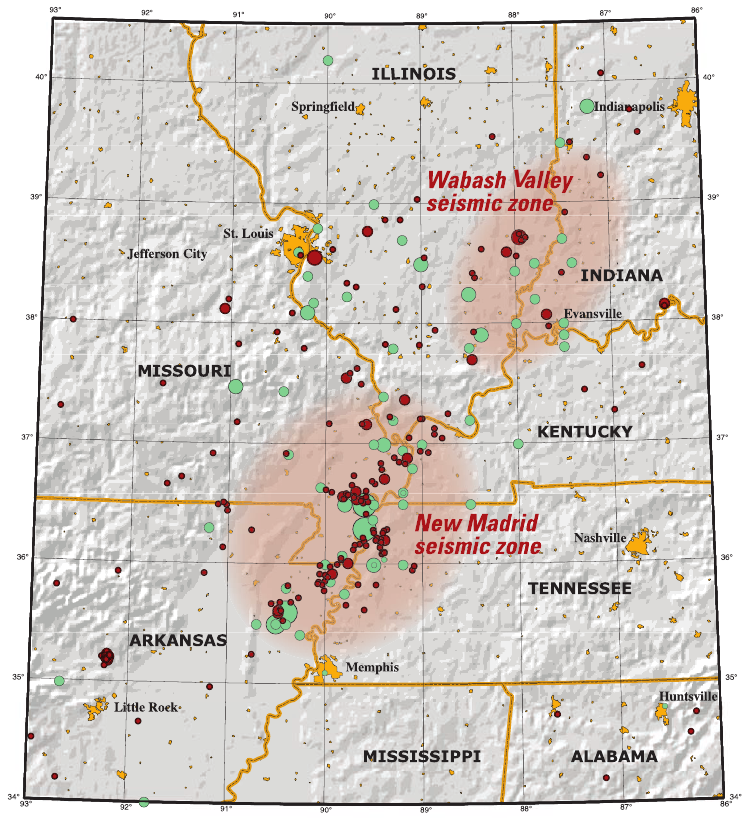
Figure 3: New Madrid Seismic Zone. Source: United States Geological Survey
According to a Wikipedia entry, “[i]n October 2009, a team composed of University of Illinois and Virginia Tech researchers headed by Amr S. Elnashai, funded by the Federal Emergency Management Agency, considered a scenario where all three segments of the New Madrid fault ruptured simultaneously with a total earthquake magnitude of 7.7. The report found that there would be significant damage in the eight states studied – Alabama, Arkansas, Illinois, Indiana, Kentucky, Mississippi, Missouri, and Tennessee – with the probability of additional damage in states farther from the New Madrid Seismic Zone. Tennessee, Arkansas, and Missouri would be most severely impacted, and the cities of Memphis, Tennessee, and St. Louis, Missouri, would be severely damaged. The report estimated 86,000 casualties, including 3,500 fatalities, 715,000 damaged buildings, and 7.2 million people displaced, with two million of those seeking shelter, primarily due to the lack of utility services. Direct economic losses, according to the report, would be at least $300 billion.” Source: University of Illinois report]
Another article on the New Madrid fault added that “….the US Geological Survey and the University of Memphis Center for Earthquake Research estimate there’s a 7 to 10 percent chance of a major quake — one with a magnitude between 7.5 and 8.0 — occurring in the region in the next 50 years….’ The scope is about as big as you could possibly have,’ said Jonathon Monken, director of the Illinois Emergency Management Agency and chairman of the Central U.S. Earthquake Consortium… ‘Putting it in a purely financial context, Hurricane Katrina was a $106 billion disaster. We estimate this would be a $300 billion disaster, the worst in the history of the United States.’”
Earthquake damage to pipelines can occur from movement on the fault itself, soil liquefaction, uplift, and landslides, resulting in potentially catastrophic situations. Engineering solutions to minimize or prevent seismic damage to pipelines do exist. These solutions must be part of the overall pipeline design, however. For example, the Trans-Alaska oil pipeline was constructed with considerations for earthquake impacts in mind. For more information, read about the solution that was implemented there.
This map shows the New Madrid seismic zone in the context of the proposed Byhalia Connection Pipeline. When this map is viewed full-size, you can choose to view additional layers from the drop-down Layers menu.
View Full Screen | Updated March 2021
As eloquently reported in a series of articles in mlk50.com, the siting of the Byhalia Connection Pipeline is not only an issue environmental tied with the natural environment. This is very much an issue of environmental justice, as well. Many of the census blocks along the proposed, preferred route of the pipeline, are 99% Black. Boxtown, a community in southwest Memphis is one of places, and already has a long history of impacts by environmental contamination from the dozens of industries that operate there. Toxic waste from coal power plants includes heavy metals and radioactive materials.
The pipeline route from Memphis to its terminus in Mississippi takes a circuitous route, avoiding wealthier parts of the city and its suburbs, but goes directly through low-income areas, some of which are inhabited by a nearly 100% Black population.
FracTracker looked at US Census data along the pipeline route, and calculated a half-mile (minimum recommended) and two-mile buffer zone from the pipeline right-of-way to consider populations that might be impacted in the case of an accident.
Explore the the demographics along the proposed Byhalia Connection Pipeline route. When this map is viewed full-size, you can choose to view additional layers from the drop-down Layers menu, such as the non-white population ration along the proposed pipeline route.
View Full Screen | Updated March 2021
There are 15,000 people living in the immediate evacuation zone of a half mile from the pipeline. In some parts of South Memphis, within this half-mile evacuation zone, population density is above 4,000 people per square mile, and the Black population approaches 100%. Within a two mile distance, the number climbs to over 76,000. Depending on the direction of the wind, a crude oil-induced fire could spew dangerous levels of volatile organic compounds through the air towards these populations. The disproportional risks to minority and low-income populations make the location of this pipeline — undeniably — an issue of environmental justice.
| Demographic | Within ½ mile of Byhalia Connection Pipeline | Within 2 miles of Byhalia Connection Pipeline |
| Total population | 15,041 | 76,016 |
| Non-white population | 7204 (48%, although some parts of South Memphis are 99+%) | 27,548 (36%, although some parts of South Memphis are 99+%) |
| Low income population | 4272 (28%, although some parts of South Memphis are 90+%) | 43,486(57%, although some parts of South Memphis are 90+%) |
Table 1: Population demographics along the proposed Byhalia Connection pipeline corridor.
Key civic facilities are also located within the half-mile evacuation zone of the pipeline. Were a disaster to occur, would the schools, childcare centers and medical facilities be able to successfully usher their residents and students to safety? Would they have had regular safety trainings to prepare them for this possibility?
| Facility | Within ½ mile of pipeline | Within 2 miles of pipeline |
| Child care | 4 (one within 800 feet) | 30 |
| Public school | 2 (one within 800 feet) | 26 |
| EMS | 2 | 11 |
| Hospital | 0 | 1 |
| Private school | 0 | 1 |
Table 2: Facilities along the proposed Byhalia Connection pipeline corridor (also shown in the interactive map here).
Former Vice President Al Gore voiced his opposition to the Byhalia Connection and put Memphis elected officials on notice during a rally against the pipeline on March 14, 2021.
Source: Article in commercialappeal.com
“Why is it that 64% of the polluting facilities of these pipeline communities are located in or adjacent to Black communities? Why is it that the cancer rate in SW Memphis four times higher than the national average? Why is it that Black children suffer from asthma three times more than white children? Why is it that the death rate from asthma for Black children is ten times higher than for white children?” – Former Vice President Al Gore
And two days later, on March 16th, the Memphis City Council unanimously approved a resolution that opposes the Byhalia Connection Pipeline project.
Approximately 300 property owners adjacent to the pipeline have already accepted monetary compensation to abandon their homes or sell property easements to make way for the pipeline. If a landowner refuses payment offered by the pipeline company for a property easement — often far under market value — the company can take the landowner to court, and seize the property (or portion of it) with no requirement of compensation. Although a majority of property owners accepted the terms of the easements drawn up by Byhalia’s developers, at least 14 did not. When numerous owners refused, nine properties were targeted for taking by eminent domain, and sued by the pipeline company. The Southern Environmental Law Center (SELC) is defending many of these property owners, claiming that the seizures — regardless of whether they are temporary or permanent — do not comply with the criteria of meeting a public good. The oil being transported in the proposed pipeline is entirely bound for export.
“The pipeline company is not created by, affiliated with or owned by the government, and the general public would have no access to the proposed crude oil pipeline… So, there is no ‘public use’ justifying the use of the condemnation power as required by Tennessee law,” said one of SELC’s attorneys. In addition, SELC has cited the illegality of the pipeline route because it runs through the municipal wellfield, and therefore violates permits issued by the Army Corps of Engineers. The Army Corp was still considering this request, as of mid-January 2021.
Furthermore, the eminent domain targeting of land owned by Black Americans in the south is a pointed question of racial justice. Historically, black and brown people throughout the United States have had far lower levels of home ownership than whites. This gap is most pronounced in lower income areas.

Figure 5: Homeownership rate in the US, by household income (2017). Source: The Urban Institute.
“The 71.9 percent white homeownership rate in 2017 represented a 0.7 percentage point decline since 2010, and the 41.8 percent black homeownership rate represented a 2.7 percentage point decline during that same period. The 30.1 percentage point gap is wider than it was when race-based discrimination against homebuyers was legal.” The Urban Institute
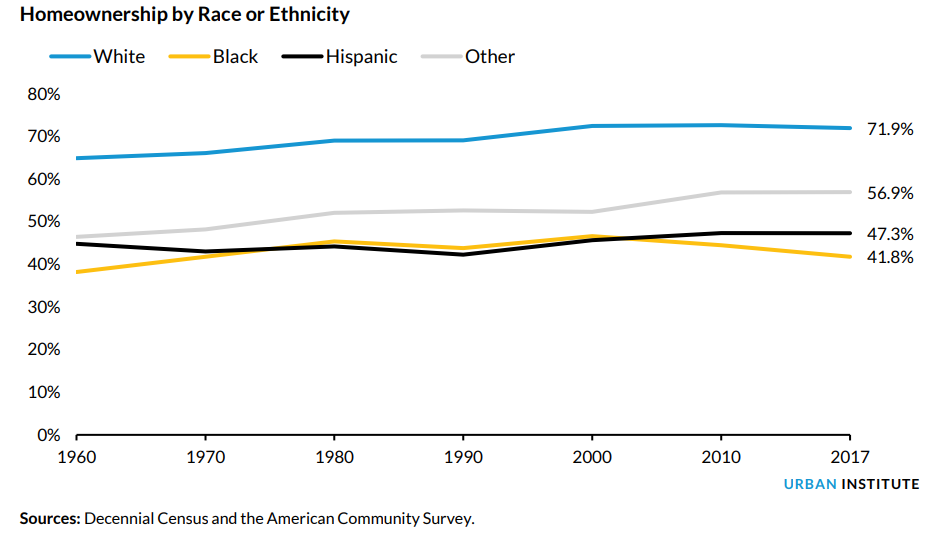
Figure 6: Homeownership in the US by race or ethnicity. Source: The Urban Institute.
Losing land to eminent domain represents a loss of control for a landowner — white or black. But the loss is especially unjust when a property may have been so hard won, and sometimes the result of a multi-generational lineage of ownership, as is the case for many properties along the Byhalia right-of-way.
FracTracker has created an interactive map showing the locations of crude oil spills across the United States between 2010 and 2021, using the most up-to-date information from PHMSA, the Pipeline and Hazardous Materials Safety Administration.
View Full Screen | Updated March, 2021
You can also read more about a wider diversity of hazardous liquid materials accidents analyzed by FracTracker in an article from February 2020, entitled “Pipelines Continue to Catch Fire and Explode”.
A 2020 research paper states, “Modeling and analysis of a catastrophic oil spill and vapor cloud explosion in a confined space upon oil pipeline leaking” provides a stark example of the damage done from the leak and explosion of a crude oil pipeline operating at a third of the pressure proposed for Byhalia.
“It is obvious that the explosion caused big damages to the adjacent buildings, roads, and public structures. Moreover, the explosion, combustion, and the shock wave caused injuries and deaths of workers, pedestrians, and residents. The total affected zone spread nearly 5 km [3.1 miles].”
Note: The oil pipeline shown in Shengzhu, Xu, et al.’s paper in was 28 inches in diameter, and operating at a pressure of between 400 and 660 psi. A vapor cloud from the spill into a municipal drainage area caused this explosion, which killed 62 people and injured 136 in November 2013. The 24-inch, proposed Byhalia pipeline would operate at triple the pressure of the pipeline shown in these photos of its explosion.
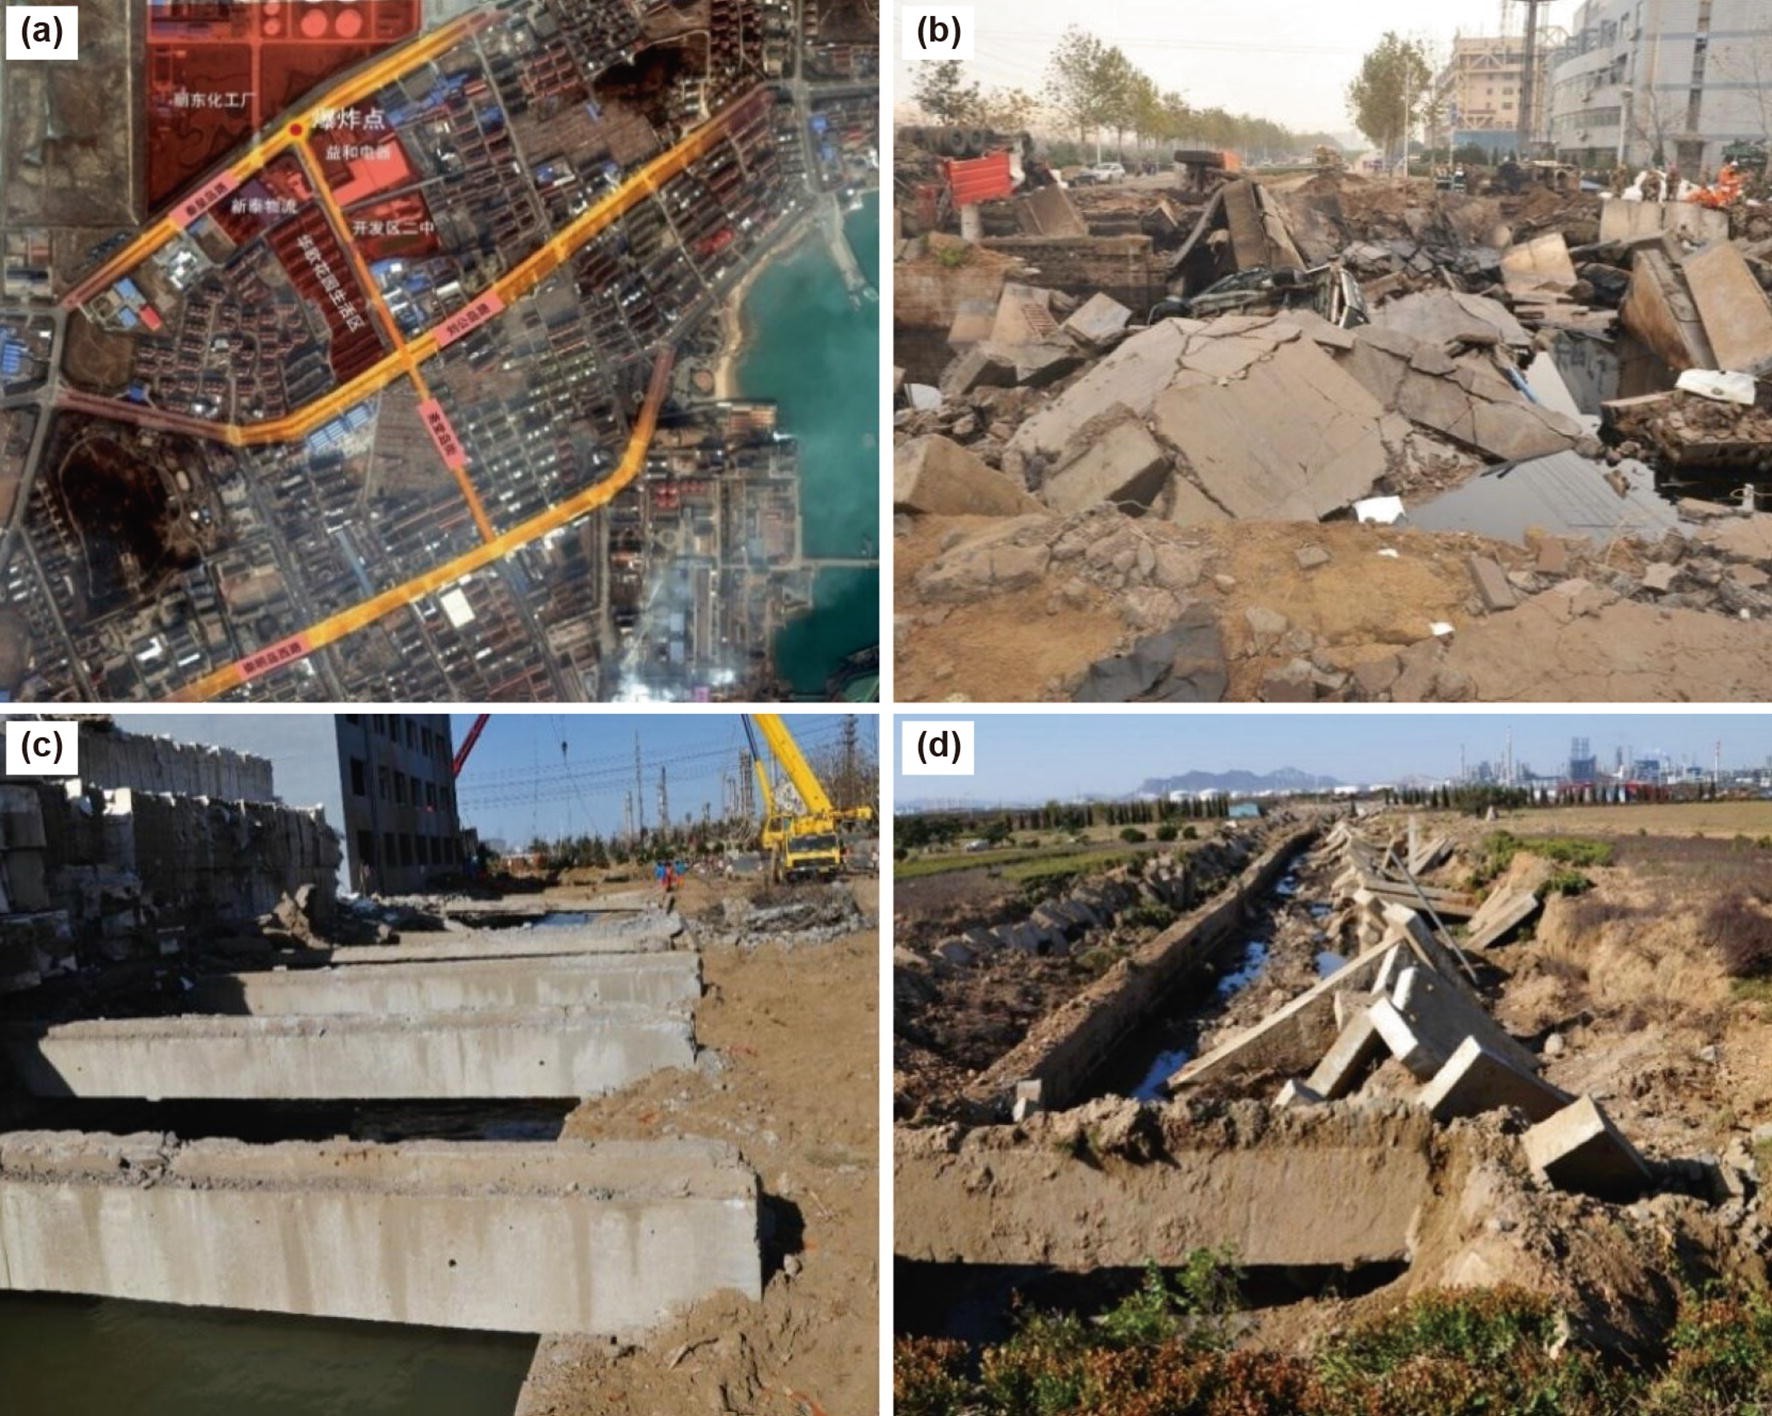
(a) bird’s eye view of the location of the explosion point, (b) scene of the oil spill point after explosion, (c) scene of the nearby street, (d) scene of the drainage of the adjacent plant.
Figure 7: Scene of an oil pipeline explosion site in China. (a) bird’s eye view of the location of the explosion point, (b) scene of the oil spill point after explosion, (c) scene of the nearby street, (d) scene of the drainage of the adjacent plant. Image from Shengzhu, Xu, et al.
Health Canada published the information document Guidance on the Management of Crude Oil Incidents (2018), which details important information about how to deal with crude oil spills. Here are checklists on whether to evacuate or shelter in place and information on determining protective zone distances, particularly downwind of a spill from the 2016 Emergency Response Guidebook.
In case of a large spill: Consider initial downwind evacuation for at least 300 meters (1000 feet).
In case of a fire: If tank, rail car or tank truck is involved in a fire, ISOLATE for 800 meters (1/2 mile) in all directions; also, consider initial evacuation for 800 meters (1/2 mile) in all directions. Source: Petroleum crude oil hazards


The Byhalia Connection Pipeline is receiving considerable scrutiny, both from media sources like the Memphis Daily News and MLK50, as well as advocacy groups including Sierra Club’s Tennessee Chapter, the Southern Environmental Law Center, Memphis Community Against the Pipeline, and Protect Our Aquifer. In a move considered egregious by a vast swath of stakeholders, in early February 2021, the US Army Corps of Engineers approved a Nationwide 12 permit to fast-track the Byhalia project, effectively cutting out public comment from the process, and lightening the environmental review requirements. Because the project touches vulnerabilities in the intersection of environment, economics, health, safety, and social justice, this discussion is not likely to easily recede into the background, despite placating claims by the companies that are poised to profit.
Protests are ongoing, and just recently, on February 22, 2021, United States Congressional Representative Steve Cohen sent a direct appeal to President Biden to revoke a key permit for Byhalia, directly citing the burden the pipeline would impose on long-suffering Black neighborhoods in South Memphis. Simultaneously, the Public Works Department of Memphis is considering a resolution condemning the pipeline, and asking the Memphis Light, Gas, and Water Division to oppose the project.
This story will undoubtedly continue to evolve in the upcoming months.
Regardless of where a pipeline is sited, there are inevitably risks to the environment, and to human communities living nearby. The proposed Byhalia Connection pipeline project is situated in a particularly problematic intersection where environmental justice, hydrology, geology, and risks to human and environmental health intersect. Without taking all of these factors into consideration, a potentially catastrophic cascade of impacts may ensue. Engagement and resistance to the project by the residents in the area, as well as support by advocacy groups, will hopefully result in comprehensive consideration of all the risks. Time will tell whether the project is modified, or simply defeated.
MLK50.com maintains an archive of excellent reading materials on this controversial project that can be found here.
The Falcon Ethane Pipeline System is at the center of major investigations into possible noncompliance with construction and public safety requirements and failing to report drilling mud spills, according to documents obtained from the Pennsylvania Department of Environmental Protection (PA DEP) by FracTracker Alliance. These investigations, which are yet to be released, also uncovered instances of alleged data falsification in construction reports and Shell Pipeline Company firing employees in retaliation for speaking up about these issues.
3/17/21 Press release: https://www.fractracker.org/falcon-investigation-press-release-fractraccker-alliance/
Shell’s attempts to cut corners while constructing this 98-mile pipeline, likely motivated by the increasingly bleak economic prospects of this project, present serious public safety concerns for the thousands of residents along its route in Pennsylvania, West Virginia, and Ohio.
These allegations are serious enough to warrant immediate action. We’re calling on the Pipeline and Hazardous Materials Safety Administration (PHMSA) to thoroughly examine these allegations and suspend construction if not yet completed, or, in the case that construction is complete, operation of the Falcon Pipeline. Furthermore, we call on state environmental regulators to fully investigate construction incidents throughout the entire pipeline route, require Shell Pipeline to complete any necessary remediation, including funding independent drinking water testing, and take enforcement action to hold Shell accountable. Read our letters to these agencies here.
These investigations were featured in a March 17th article by Anya Litvak in the Pittsburgh Post-Gazette.
3/18/21 update:
Additional coverage of this story was published in a Times Online article by Daveen Ray Kurutz, a StateImpact Pennsylvania article by Reid Frazier, and an Observer-Reporter article by Rick Shrum.
According to documents obtained through a public records request, a whistleblower contacted PHMSA in 2019 with serious concerns about the Falcon, including that the pipeline may have been constructed with defective corrosion coating. PHMSA is a federal agency that regulates pipeline operation. The whistleblower also shared environmental threats occurring within the DEP’s jurisdiction, prompting the PA DEP and Pennsylvania Attorney General’s Office to get involved.
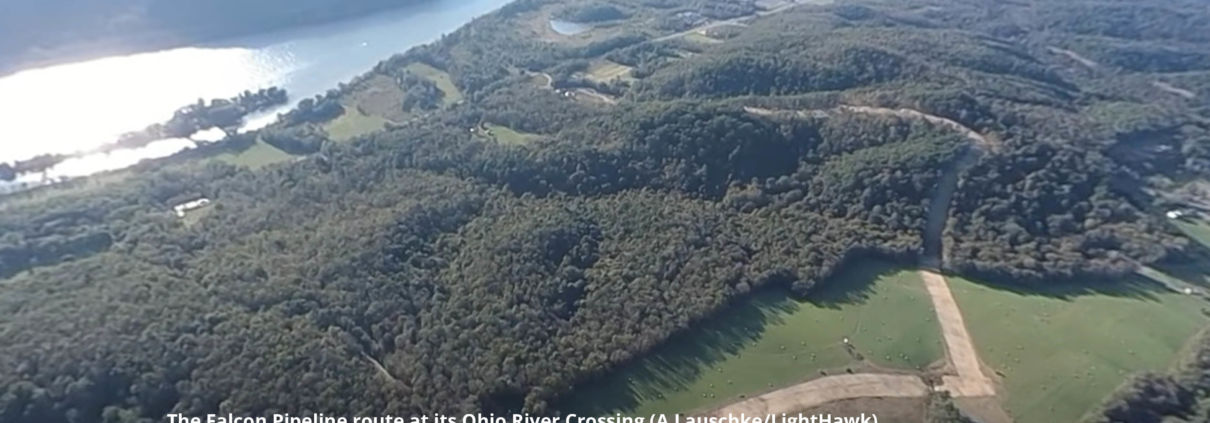
Many of the issues with the Falcon relate to a construction method used to install pipelines beneath sensitive areas like roads and rivers called horizontal directional drilling (HDD). Shell Pipeline contracted Ellingson Trenchless LLC to complete over 20 HDDs along the Falcon, including crossings beneath drinking water sources such as the Ohio River and its tributaries. FracTracker and DeSmog Blog previously reported on major drilling mud spills Shell caused while constructing HDDs and how public agencies have failed to regulate these incidents.
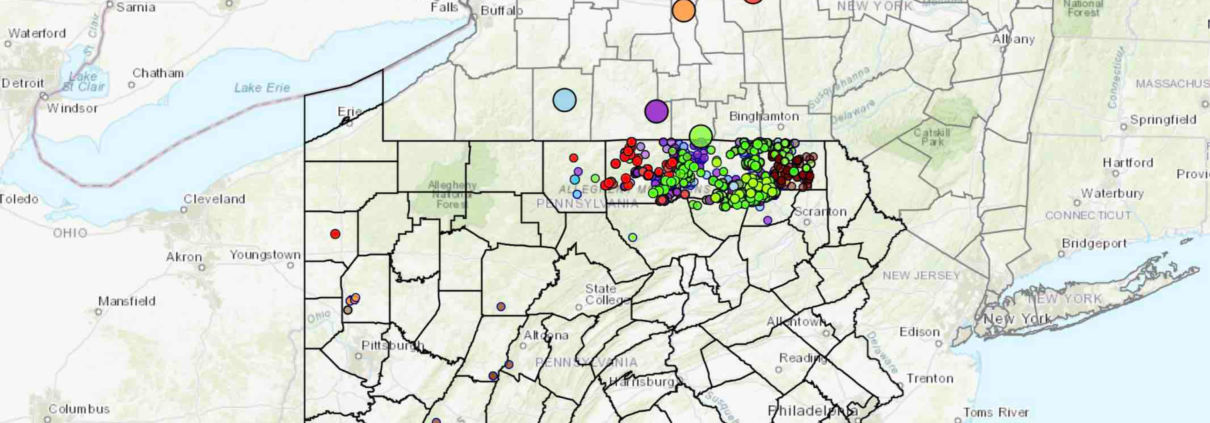
This map shows the Falcon Pipeline’s HDD crossings and spills of drilling fluid spills that occurred through 3/5/2020. To see the data sources, click on the information icon found in the upper right corner of the map header as well as under the map address bar.
View Map Full Sized | Updated 6/16/20
Correspondence between the PA DEP and PHMSA from February 26, 2020 reveal the gravity of the situation. While PHMSA conducted an inquiry into the whistleblower’s complaints in 2019 and concluded there were no deficiencies, PA DEP Secretary Patrick McDonnell wrote that his agency felt it was incomplete and urged PHMSA to conduct a more thorough investigation. Secretary McDonnell noted the PA DEP “has received what appears to be credible information that sections of Shell’s Falcon Pipeline project in western PA, developed for the transportation of ethane liquid, may have been constructed with defective corrosion coating protection,” and that “corroded pipes pose a possible threat of product release, landslide, or even explosions.”
FracTracker submitted a Freedom of Information Act request with PHMSA asking for documents pertaining to this inquiry, and was directed to the agency’s publicly available enforcement action webpage. The page shows that PHMSA opened a case into the Falcon on July 16, 2020, five months after Secretary McDonnell sent the letter. PHMSA sent Shell Pipeline Company a Notice of Amendment citing several inadequacies with the Falcon’s construction, including:
Shell responded with its amended procedures on July 27, 2020, and PHMSA closed the case on August 13, 2020.
Of note, PHMSA states it is basing this Notice on an inspection conducted between April 9th and 11th, 2019, when construction on the Falcon had only recently started. PHMSA has confirmed its investigation on the Falcon is ongoing, however we question the accuracy of self reported data given to PHMSA inspectors should be questioned
The PA DEP also brought the matter to the attention of the US Environmental Protection Agency.
The Falcon pipeline also crosses through Ohio and briefly, West Virginia. While we do not know how these states are involved in these investigations, our past analyses raise concerns about the Ohio Environmental Protection Agency’s (OEPA) ability to regulate the pipeline’s HDD crossings.
One of the focuses of the Pennsylvania DEP’s investigation is the failure to report drilling fluid spills that occur while constructing a HDD crossing. The PA DEP shut down all HDD operations in November, 2019 and forced Shell to use monitors to calculate spills, as was stated in permit applications.
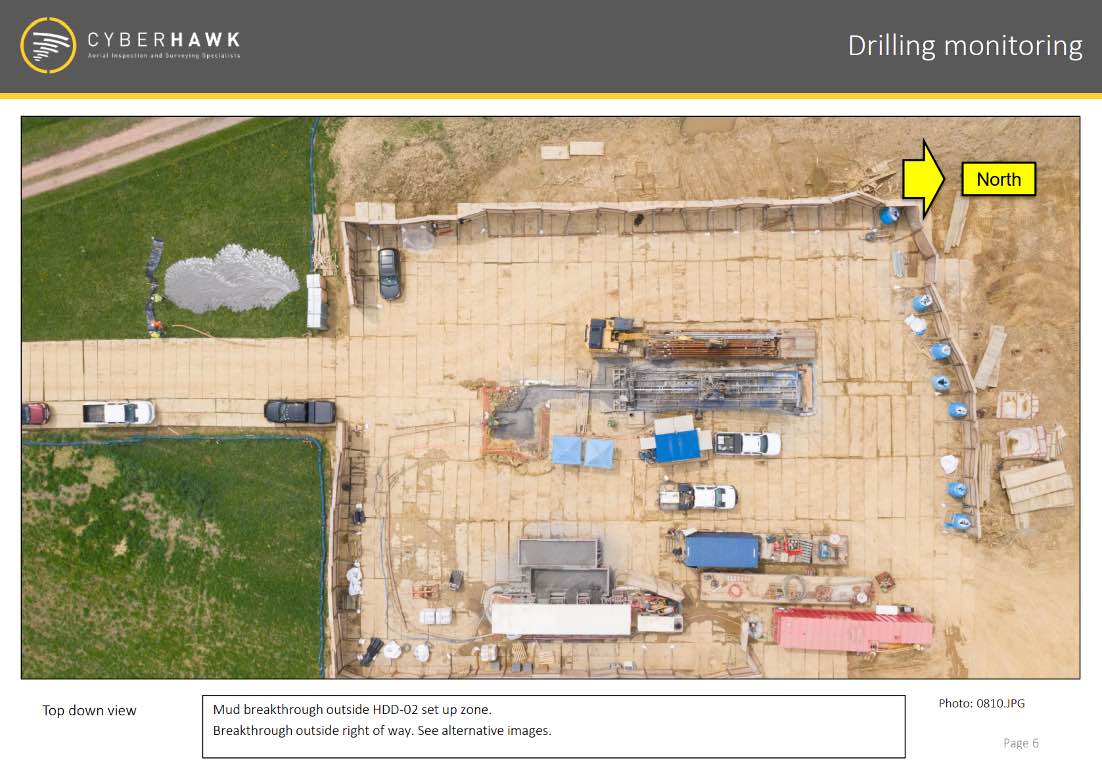
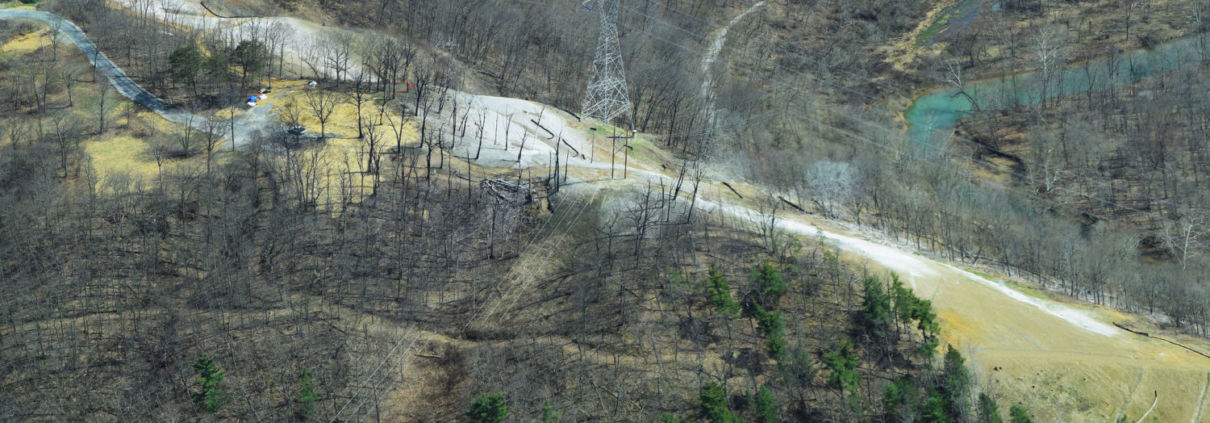
A horizontal directional drilling (HDD) construction site for the Falcon Pipeline in Southview, Washington County, Pennsylvania. You can see where the drilling mud has returned to the surface in the top left of the photo. Photo by Cyberhawk obtained by FracTracker Alliance through a right-to-know request with the Pennsylvania Department of Environmental Protection.
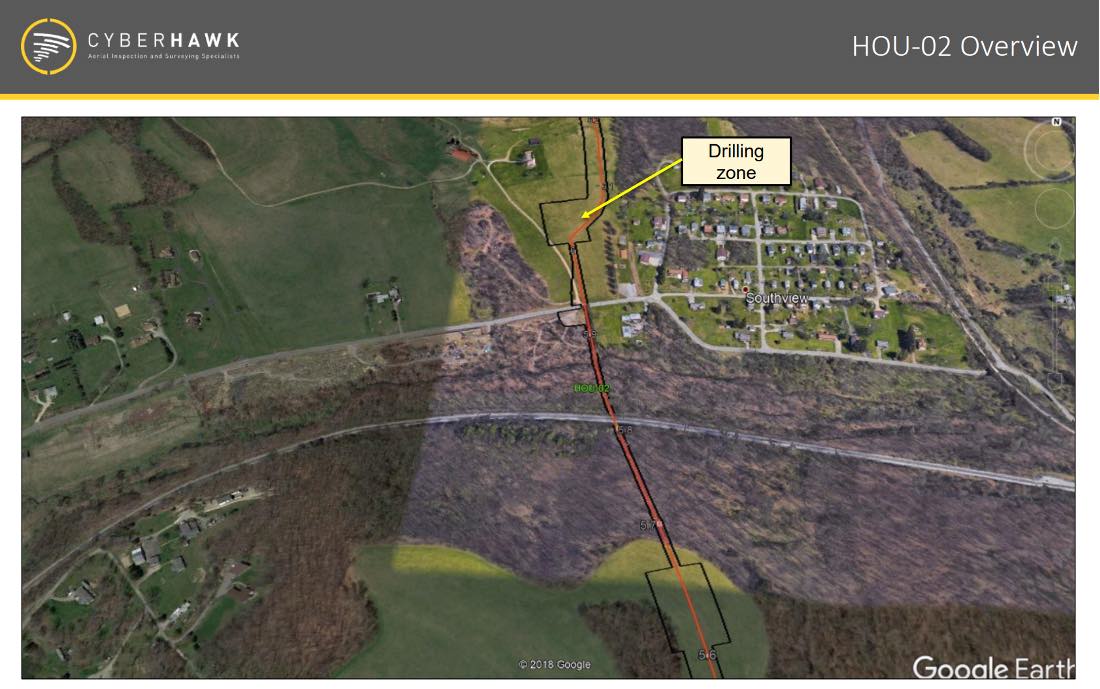
The Falcon Pipeline’s HDD locations are often close to neighborhoods, like the HOU-02 crossing in Southview, Washington County, Pennsylvania. Photo by Cyberhawk obtained by FracTracker Alliance through a right-to-know request with the Pennsylvania Department of Environmental Protection.
To our knowledge, the OEPA did not enforce this procedure, instead relying on workers to manually calculate and report spills. Shell’s failure to accurately self-report raises concerns about the safety of the Falcon’s HDD crossings in Ohio, including the crossing beneath the Ohio River, just upstream of drinking water intakes for Toronto and Steubenville, Ohio.
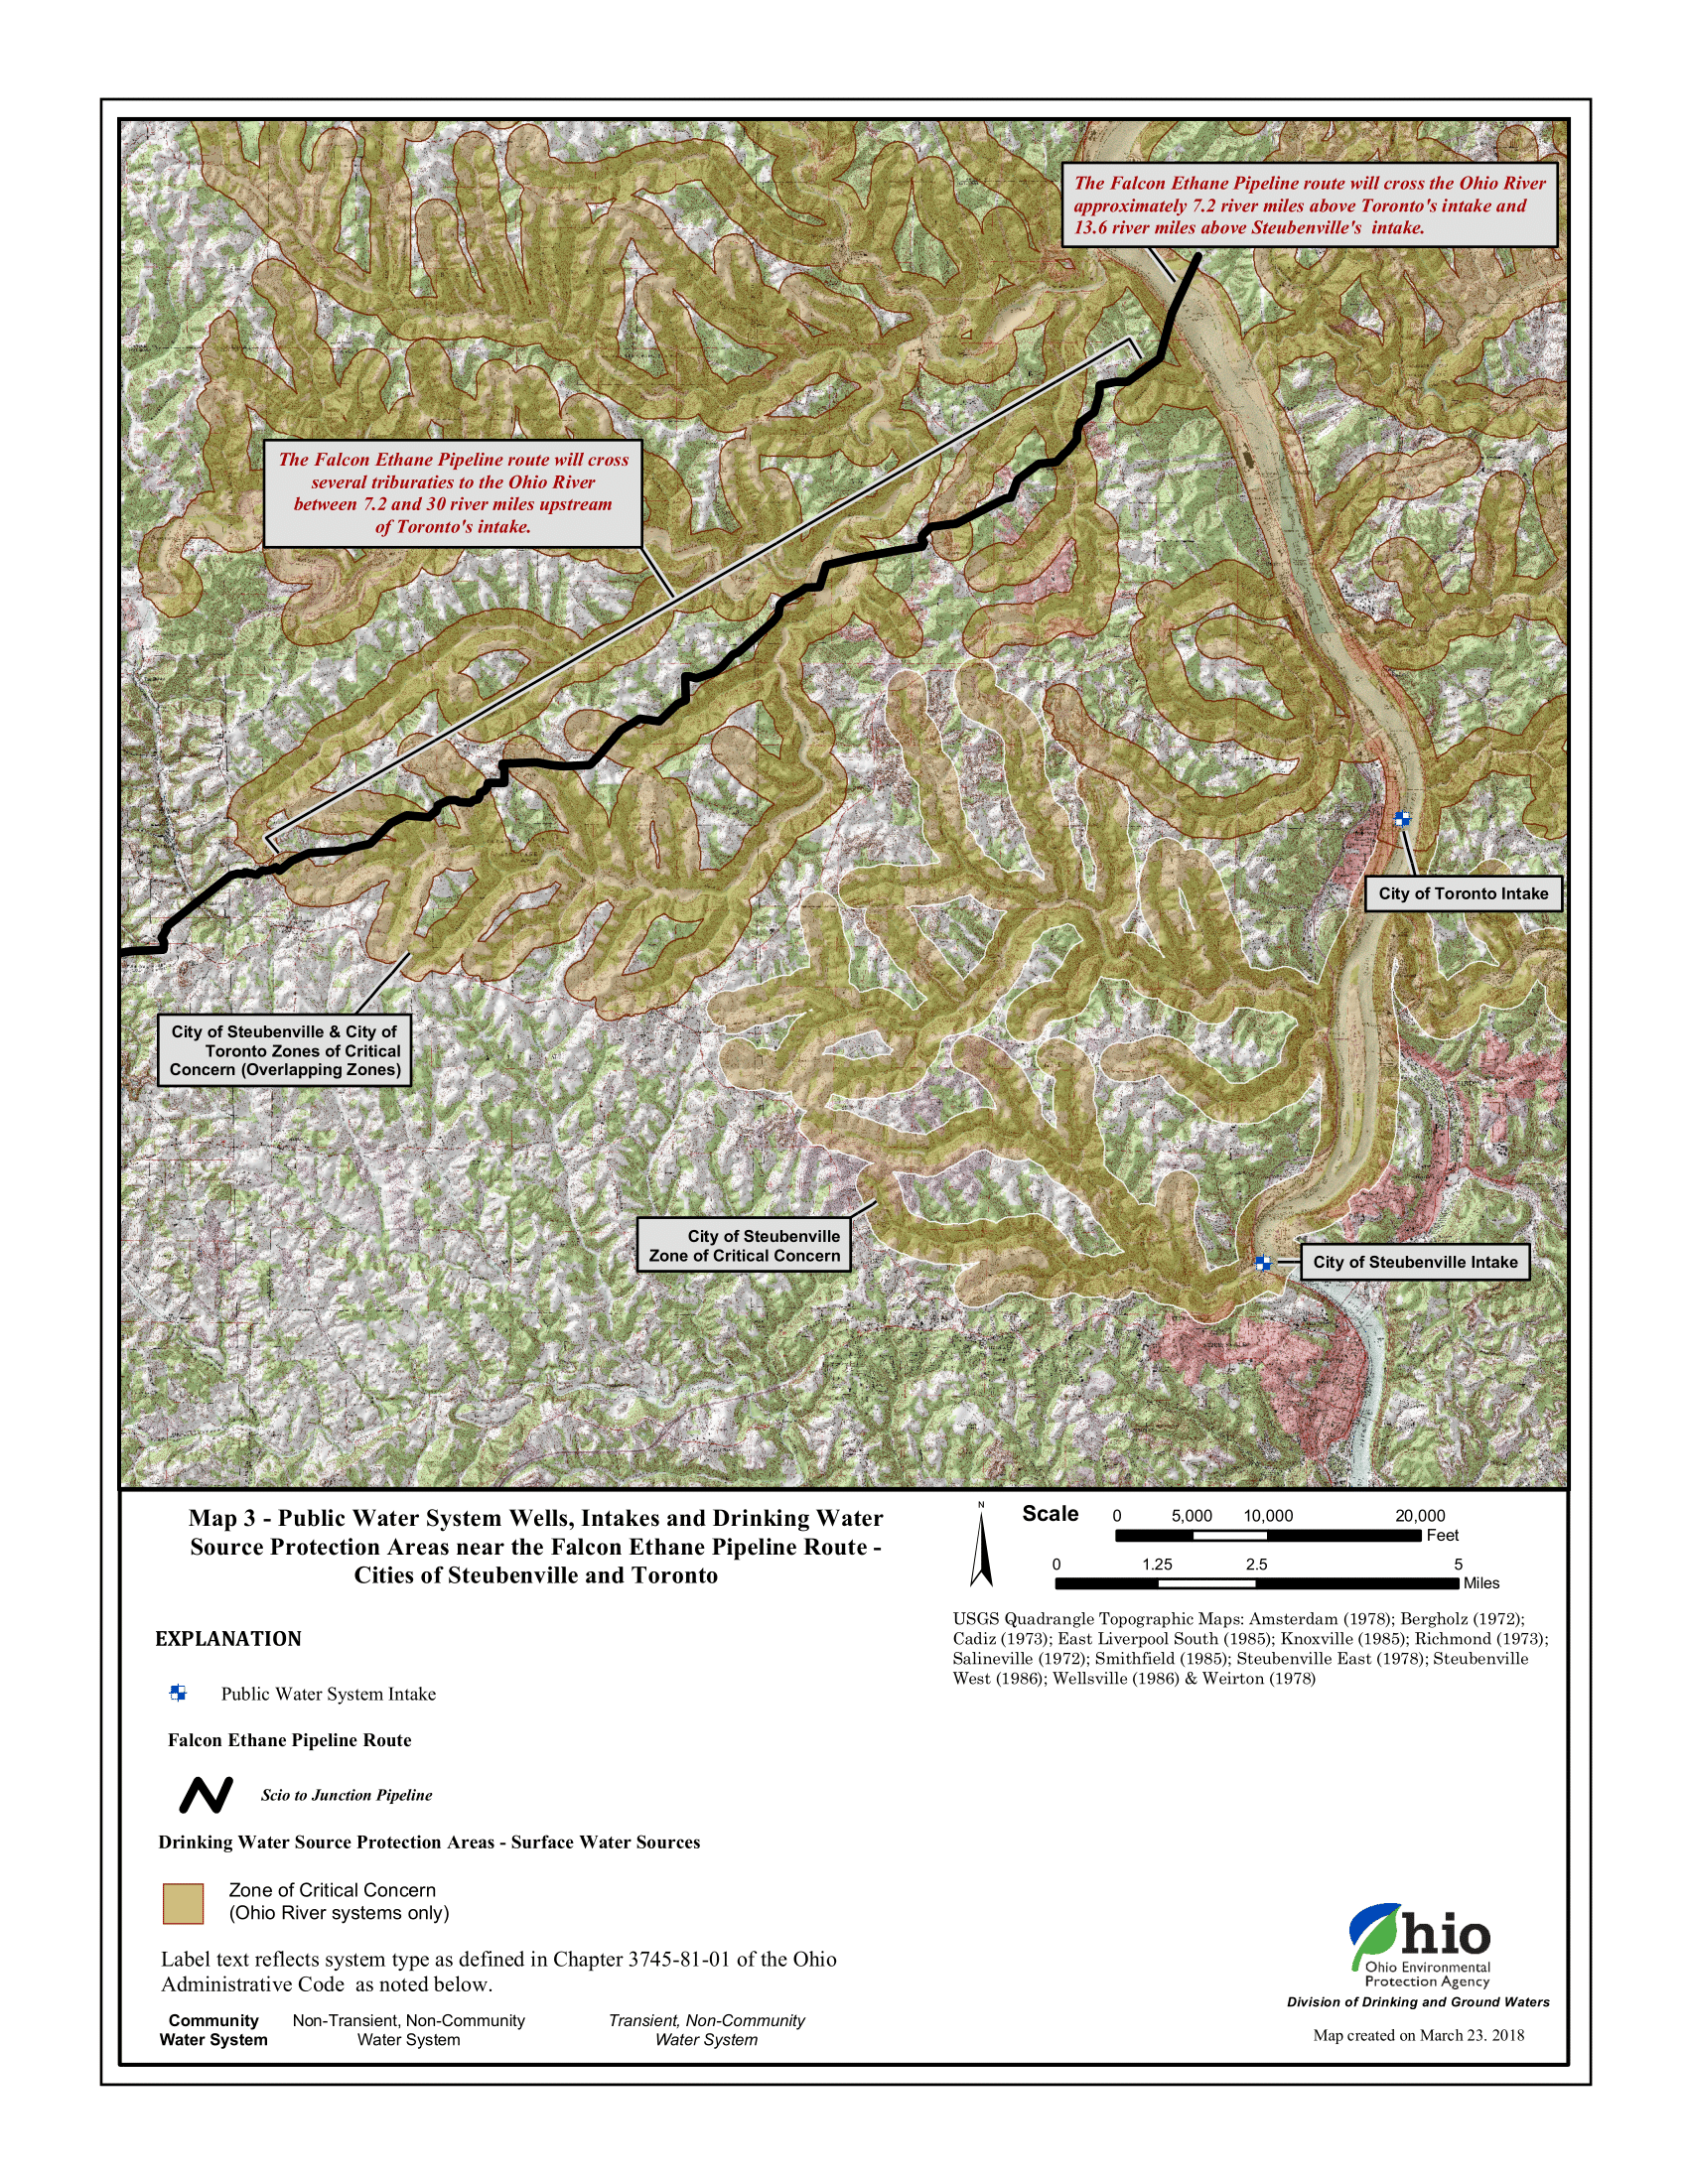
Public water system wells, intakes, and Drinking Water Source Protection Areas nears the Falcon Pipeline Route. Note, the pipeline route may have slightly changed since this map was produced. Source: Ohio EPA
The Falcon is connected to one of Shell’s most high-profile projects: a $6 billion to $10 billion plastic manufacturing plant, commonly referred to as the Shell ethane cracker, in Beaver County, Pennsylvania. These massive projects represent the oil and gas industry’s far-fetched dream of a new age of manufacturing in the region that would revolve around converting fracked gas into plastic, much of which would be exported overseas.
Many in the Ohio River Valley have raised serious concerns over the public health implications of a petrochemical buildout. The United States’ current petrochemical hub is in the Gulf Coast, including a stretch of Louisiana known colloquially as “Cancer Alley” because of the high risk of cancer from industrial pollution.
Construction of the ethane cracker and the Falcon pipeline have forged forward during the COVID-19 pandemic. In another example of the culture of fear at the worksite, several workers expressed concern that speaking publicly about unsafe working conditions that made social distancing impossible would cost them their jobs. Yet the state has allowed work to continue on at the plant, going so far as to grant Shell the approval to continue work without the waiver most businesses had to obtain. As of December 2020, over 274 Shell workers had contracted the coronavirus.
While the oil and gas industry had initially planned several ethane crackers for the region, all companies except for Shell have pulled out or put their plans on hold, likely due to the industry’s weak financial outlook.
A June 2020 report by the Institute for Energy Economics and Financial Analysis (IEEFA), stated that:
Royal Dutch Shell owes a more complete explanation to shareholders and the people of Pennsylvania of how it is managing risk. Shell remains optimistic regarding the prospects for its Pennsylvania Petrochemical Complex in Beaver County, Penn. The complex, which is expected to open in 2021 or 2022, is part of a larger planned buildout of plastics capacity in the Ohio River Valley and the U.S. IEEFA concludes that the current risk profile indicates the complex will open to market conditions that are more challenging than when the project was planned. The complex is likely to be less profitable than expected and face an extended period of financial distress.
Many of Pennsylvania’s elected officials have gone to great lengths to support this project. The Corbett administration enticed Shell to build this plastic factory in Pennsylvania by offering Shell a tax break for each barrel of fracked gas it buys from companies in the state and converts to plastic (valued at $66 million each year). The state declared the construction site a Keystone Opportunity Zone, giving Shell a 15-year exemption from state and local taxes. In exchange, Shell had to provide at least 2,500 temporary construction jobs and invest $1 billion in the state, giving the company an incredible amount of power to decide where resources are allocated in Pennsylvania.
Would the state have asked Shell for more than 2,500 construction jobs if it knew these jobs could be taken away when workers spoke out against life-threatening conditions? Will the politicians who have hailed oil and gas as the only job creator in the region care when workers are forced to hide their identity when communicating with public agencies?
The PA DEP appears to have played a key role in calling for this investigation, yet the agency itself was recently at the center of a different investigation led by Pennsylvania Attorney General Josh Shapiro. The resulting Investigating Grand Jury Report revealed systematic failure by the PA DEP and the state’s Department of Health to regulate the unconventional oil and gas industry. One of the failures was that the Department seldom referred environmental crimes to the Attorney General’s Office, which must occur before the Office has the authority to prosecute.
The Office of Attorney General is involved in this investigation, which the PA DEP is referring to as noncriminal.
The Grand Jury Report also cited concerns about “the revolving door” that shuffled PA DEP employees into higher-paying jobs in the oil and gas industry. The report cited examples of PA DEP employees skirting regulations to perform special favors for companies they wished to be hired by. The watchdog research organization Little Sis listed 47 fracking regulators in Pennsylvania that have moved back and forth between the energy industry, including Shell’s Government Relations Advisor, John Hines.
The Falcon Pipeline sits empty as people across the nation are amping up pressure on President Biden to pursue bold action in pursuit of environmental justice and a just transition to clean energy. Following Biden’s cancellation of the Keystone XL pipeline, Indigenous leaders are calling for him to shut down other projects including Enbridge Line 3 and the Dakota Access Pipeline.
Over a hundred groups representing millions of people have signed on to the Build Back Fossil Free campaign, imploring Biden to create new jobs through climate mobilization. Americans are also pushing Biden to be a Plastic Free President and take immediate action to address plastic pollution by suspending and denying permits for new projects like the Shell ethane cracker that convert fracked gas into plastic.
If brought online, the Falcon pipeline and Shell ethane cracker will lock in decades of more fracking, greenhouse gasses, dangerous pollution, and single-use plastic production.
Just as concerning, Shell will need to tighten its parasitic grip on the state’s economic and legislative landscape to keep this plant running. Current economic and political conditions are not favorable for the Shell ethane cracker: financial analysts report that its profits will be significantly less than originally presented. If the plant is brought online, Shell’s lobbyists and public relations firms will be using every tactic to create conditions that support Shell’s bottom line, not the well-being of residents in the Ohio River Valley. Politicians will be encouraged to pass more preemptive laws to block bans on plastic bags and straws to keep up demand for the ethane cracker’s product. Lobbyists will continue pushing for legislation that imposes harsh fines and felony charges on people who protest oil and gas infrastructure, while oil and gas companies continue to fund police foundations. Shell will ensure that Pennsylvania keeps extracting fossil fuels to feed its ethane cracker.
The Falcon pipeline is at odds with global demands to address plastic and climate crises. As these new documents reveal, it also poses immediate threats to residents along its route. While we’re eager for more information from state and federal agencies to understand the details of this investigation, it’s clear that there is no safe way forward with the Falcon Pipeline.
Royal Dutch Shell has been exerting control over people through the extraction of their natural resources ever since it began drilling for oil in Dutch and British colonies in the 19th Century. What will it take to end its reign?
Health & Safety | Legislation & Politics | Petrochemicals & Plastics | Pipelines
This article focuses on the city of Arvin as an example to show how some Frontline Communities in California are completely surrounded by an unrelenting barrage of carcinogenic and toxic air pollutants from oil and gas wells. Kern County’s proposed environmental impact report (EIR) would streamline the approval of an additional 67,000 new oil and gas wells in the County and thus further degrade air quality. We provide several recommendations for how local and state decision-makers can better protect public health from these serious threats.
Upstream greenhouse-gas and volatile organic compound (VOC) emissions from oil and gas extraction have been drastically under-reported throughout the United States, and California’s emissions regulations for oil and gas production wells are not comprehensive enough to protect Frontline Communities. The contribution of VOCs from the oil and gas extraction sector is responsible for California’s central valley and Kern County communities being exposed to the worst air quality in the country. As carcinogens, air toxics, and precursors to ozone, VOC’s present a myriad of health threats.
The contribution of VOCs from the well-sites in Kern, in addition to the cumulative burden of the Central Valley’s degraded air quality, puts Kern residents at considerable risk. Obvious loopholes in the California Air Resources Board’s oil and gas rule must be addressed immediately, and revised to prevent the cumulative impact of multiple exposure sources from causing additional documented negative health impacts. Additionally Kern County’s proposed environmental impact report (EIR) would streamline the approval of an additional 67,000 new oil and gas wells in the County and thus further degrade air quality. It is crucial that the EIR is instead revised to eliminate extraction near sensitive populations. (For more details on this proposal, see our more in depth environmental justice analysis of Kern County and our article on the proposed EIR.)
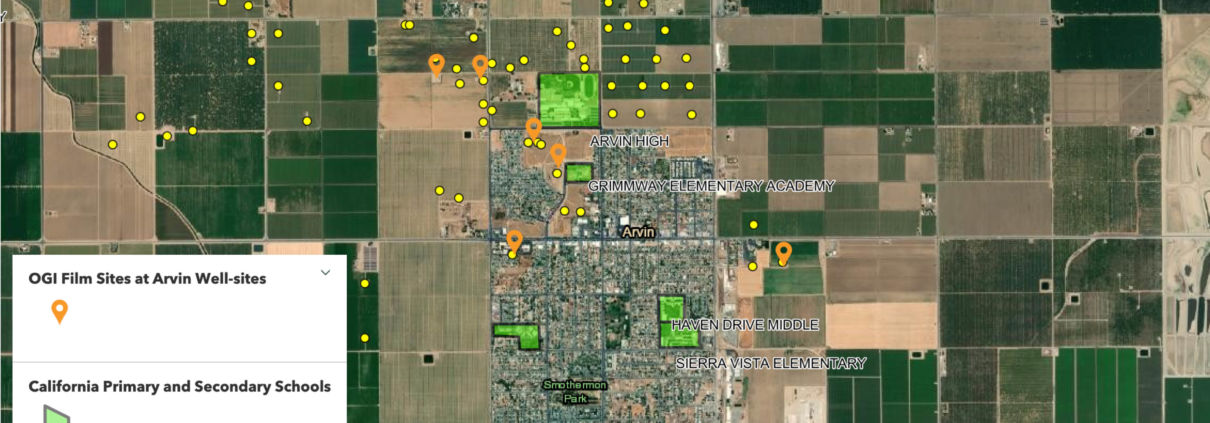
In support of establishing new public health rules that protect Frontline Communities, Earthwork’s Community Empowerment Project, in collaboration with the Central California Environmental Justice Network and FracTracker Alliance, has focused on documenting the uncontrolled emissions from extraction sites within and surrounding the small city of Arvin, California. Using infrared cameras with state of the art optical gas imaging (OGI) technology, the team documented major leaks at multiple well-sites. Footage from Arvin spans the years from 2016-2020. A collection of this footage has been compiled into the interactive story map that follows.
This StoryMap explores how current California regulations fail to stop emissions from tanks on oil and gas well-sites by looking at examples of emissions from well-sites in Arvin, California. Place your cursor over the image and scroll down to advance the StoryMap and explore a series of maps charting the fracking-for-plastic system. Click on the icon in the bottom left to view the legend.
View Full Sized Map | Updated 3/4/21
The cases of uncontrolled emissions in the story map provides just an example of the inventory of uncontrolled emissions sources in Kern County, and California at large. Finding and filming emissions sources while using OGI cameras in California is not at all uncommon, otherwise there would not be seven prime examples just in the City of Arvin. Prior to 2018, emissions from these well-sites went completely unregulated. While the California oil and gas rule (COGR) was developed to address greenhouse gas emissions from small sources, certain aspects of the rule are not being enforced by the local air districts. Rather than requiring tanks to have closed evaporation systems the air districts allow operators to set pressure/vacuum hatches to open and emit toxic and carcinogenic vapors when pressure builds inside tanks. While this is a safety mechanism on tanks, in practice it allows tanks to be consistent sources of exposure that put neighboring communities at risk. Specifically, California Code of Regulations, Title 17, Division 3, Chapter 1, Subchapter 10 Climate Change, Article 4, § 95669, Leak Detection and Repair, Paragraph I states that “Hatches shall remain closed at all times except during sampling, adding process material, or attended maintenance operations.”
New research from Harvard, Berkeley and Stanford has shown that living near oil and gas drilling and extraction exposes Frontline Communities to emissions of VOC’s and ozone that put them at risk for a variety of health impacts. Researchers at Stanford have linked proximity and density of oil and gas wells to preterm birth for pregnant mothers (Gonzalez et al. 2020), even at large distances. Similar research from UC Berkeley showed mothers living near oil and gas drilling and extraction are also at risk of birthing infants with low birth weight (Tran et al. 2020). The study found pregnant people who lived within 0.62 miles (1 kilometer) of the highest producing wells were 40% more likely to have low birth weight babies and 20% more likely to have babies who were small for their gestational age compared to people living farther away from wells or near inactive wells only. Most recently, new research from Harvard University shows that even very low ambient levels of ozone, particulate matter (PM2.5), and nitrogen dioxide increased hospitalizations for cardiac and respiratory conditions (Wang et al. 2021). These are the primary and secondary pollutants emitted from oil and gas extraction sites and also result from burning fossil fuels. The magnitude of the impact on public health is also much larger than previously considered. Another article recently published by researchers at Harvard shows that fossil fuel air pollution is responsible for 18% of total deaths, worldwide (Vohra, et al. 2021).
While the COGR rule is a step in the right direction to reduce emissions, oil and gas’s legacy of degradation to ambient air quality has placed the Central Valley in the worst categories for these pollutants in the country. This puts Kern residents at considerable risk. The local health department continues to report improved conditions and increased numbers of healthy air days, but the truth is the mean, median and maximum values of ozone concentrations at US EPA monitoring locations in Kern County have remained relatively constant at harmful levels from 2015-2019. Expanding the data to 2020 shows a two sharp decreases in ambient levels of pollutants that correspond to decreases in reported production volumes for the county. The first decrease in 2016 corresponds to a drop in production following the institution of State Bill requirements for fracking permits. The decrease in 2020 is a result of the slowed production and burning of fossil fuels related to the Covid-19 Pandemic, as shown below in Figure 1.
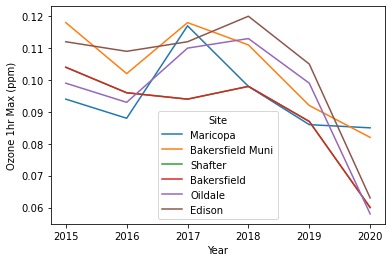
Figure 1. Plot of annual Maximum 1 hour Ozone concentrations at all monitoring locations in western Kern County. Ozone concentrations are presented in parts per million. Annual trends in ambient concentrations of ozone. Note the decrease in concentrations in 2016 and in 2020. Both events correlate to decreases in production.
Using the U.S. EPA’s AirData mapping portal, air quality data for Kern County was exported, compiled and plotted to show trends over time. Above in Figure 1, annual ambient concentrations of ozone are shown. The trends of ambient concentrations follow similar trends in the spatial and temporal distribution of CalGEM reported production volumes. FracTracker Alliance is conducting more thorough analyses of these correlations, so stay tuned for future reports.
The locations of these monitoring locations are shown below in the map in Figure 2. Note that there are not any monitors in northwestern Kern, near large oil fields including North Belridge and Lost Hills. The communities near these fields, such as the City of Lost Hills are predominantly Latinx with elevated levels of linguistic isolation and poverty.
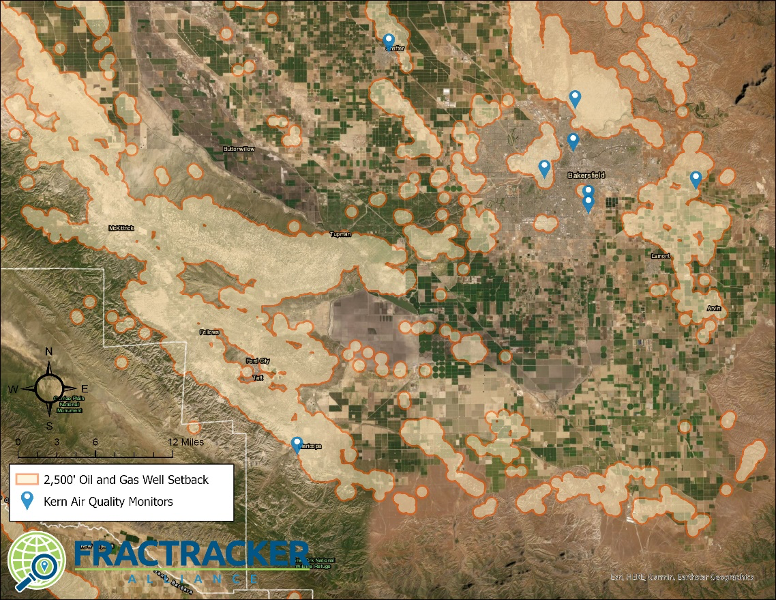
Figure 2. Map of Air Quality Monitors in Kern County.
Permitting new oil and gas wells in Kern County is certain to degrade the already harmful local and regional ambient air quality of the Central Valley. Kern County’s proposed EIR, as it stands will streamline an additional 67,000 sources of VOCs to the inventory of emissions already impacting communities. The health impacts from concentrations of ozone are well established, and the release of VOCs are major risk driver for communities living closest to oil and gas extraction operations as well as for regional public health. Together, these primary and secondary pollutants create a major risk driver for Kern County communities. Globally, these emissions are responsible for upwards of 8 million premature deaths annually. The burden on Frontline Communities in Kern County is likely much higher, and will only grow if the currently drafted EIR is passed. Additional air quality monitoring stations in northwestern Kern County should be installed immediately to help track air quality impacts.
To reduce this harm to Frontline Communities, California Senator Scott Weiner has submitted a new senate bill. Senate Bill 467 would stop the issuance of hydraulic fracturing permits and create a public health setback distance of 2,500 feet from homes, schools and other health care facilities for all new drilling permits. The bill would also create a program to provide new training and job opportunities for workers who would be negatively impacted by the bill. Senate Bill 467 provides the first step for a green transition away from the health impacts resulting from fossil fuel industries.
Built on sound data and ample research, FracTracker recommends the following measures be taken to protect the health of California’s overburdened Frontline Communities: Kern County should revise its environmental impact report to address the onslaught of harmful oil and gas emissions (EIR), California Air Resources Board’s oil and gas rule should close its loophole allowing emissions from the pressure/vacuum hatch on the tank to be exempt from regulation, and legislators should educate themselves on the importance of 2,500 foot setbacks requirements for oil and gas wells.
FracTracker’s public comments regarding recommendations to modify the Kern County Draft Environmental Impact Report (EIR): https://www.fractracker.org/a5ej20sjfwe/wp-content/uploads/2021/03/Kern.EIR_.comments_FracTrackerAlliance_3.8.21_compressed.pdf
FracTracker California articles, maps, and imagery: https://www.fractracker.org/map/us/california/
Earthwork’s Community Empowerment Project: https://www.youtube.com/playlist?list=PL9BS7nDf-8tqlaUT8pc0Yr0Tpfl0UFDMK
Newsom Well Watch, a collaboration between FracTracker and Consumer Watchdog: https://newsomwellwatch.com/
Infrastructure | Health & Safety | Legislation & Politics | Social
![]()
216 Franklin St, Suite 400, Johnstown, PA 15901
Phone: +1 (717) 303-0403 | info@fractracker.org
FracTracker Alliance is a 501(c)3 non-profit: Tax identification number: 80-0844297
 EPA
EPA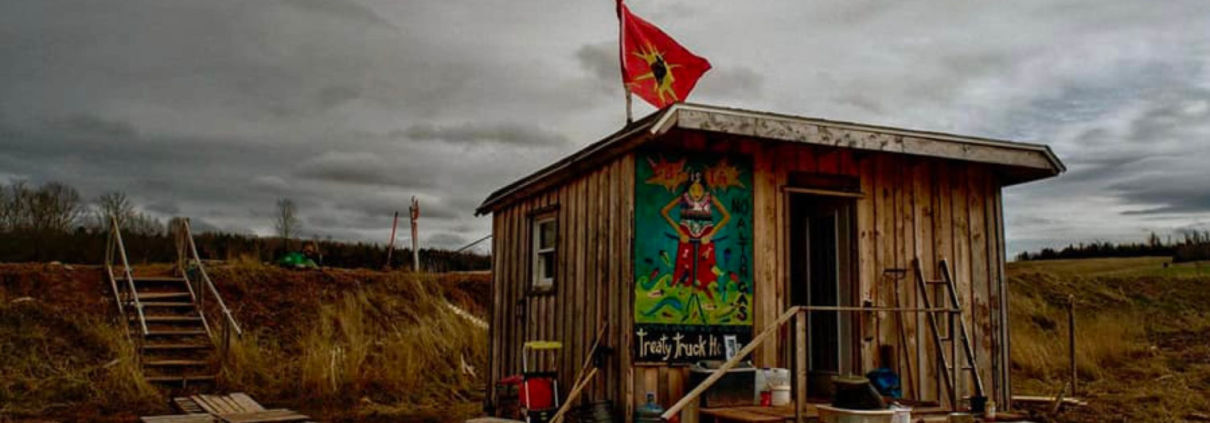 Jared Durelle