Ongoing Safety Concerns over Shell’s Falcon Pipeline
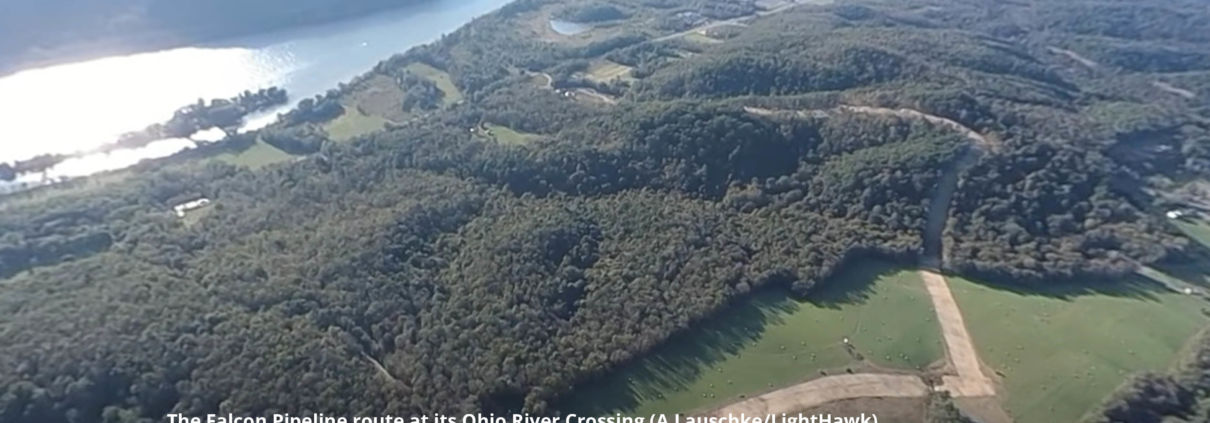
Ohio River Valley Groups react to a new safety warning issued by federal regulators to Shell regarding the troubled Falcon Pipeline
The majority of FracTracker’s posts are generally considered articles. These may include analysis around data, embedded maps, summaries of partner collaborations, highlights of a publication or project, guest posts, etc.
Ohio River Valley Groups react to a new safety warning issued by federal regulators to Shell regarding the troubled Falcon Pipeline
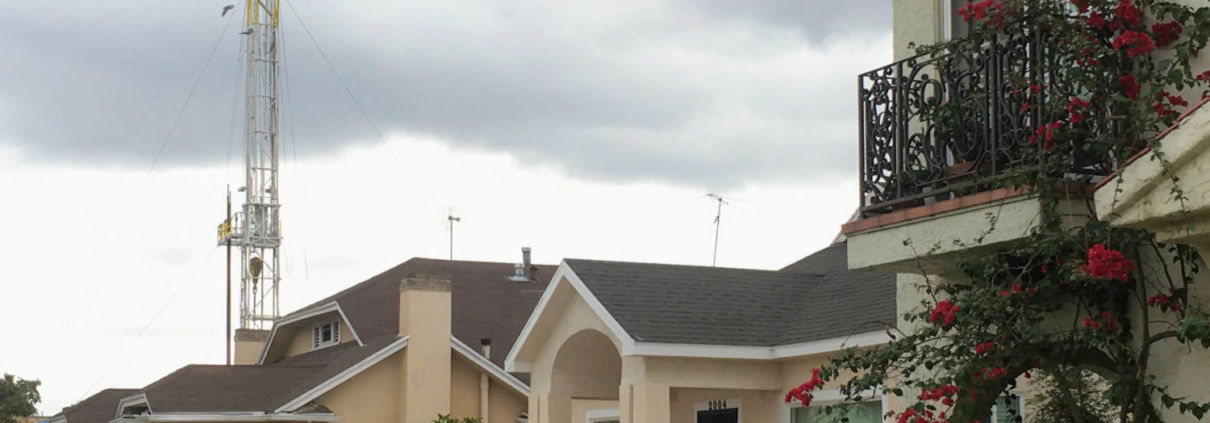
California drilling permits continue while Frontline communities and grassroots groups call for an immediate moratorium and 2,500′ setback.

If Gov. Cuomo wants to lead the nation on climate, he has to address the impacts of proof of work cryptocurrency mining industry in New York.
As California permit approvals for new oil & gas well drills decrease, Consumer Watchdog urges the Governor to move from fossil fuels.
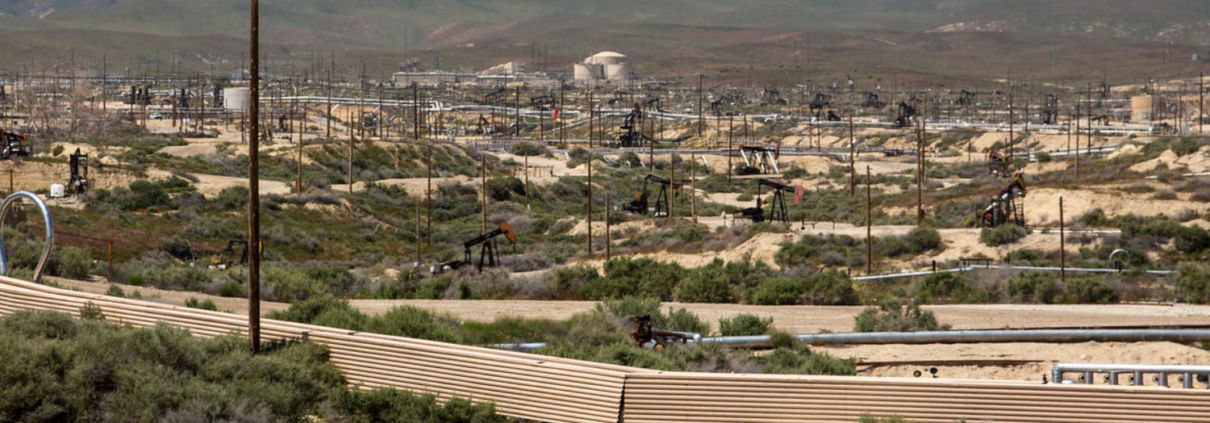
California regulators recently denied 21 well stimulation permit applications—a welcomed move in the right direction—but not enough.
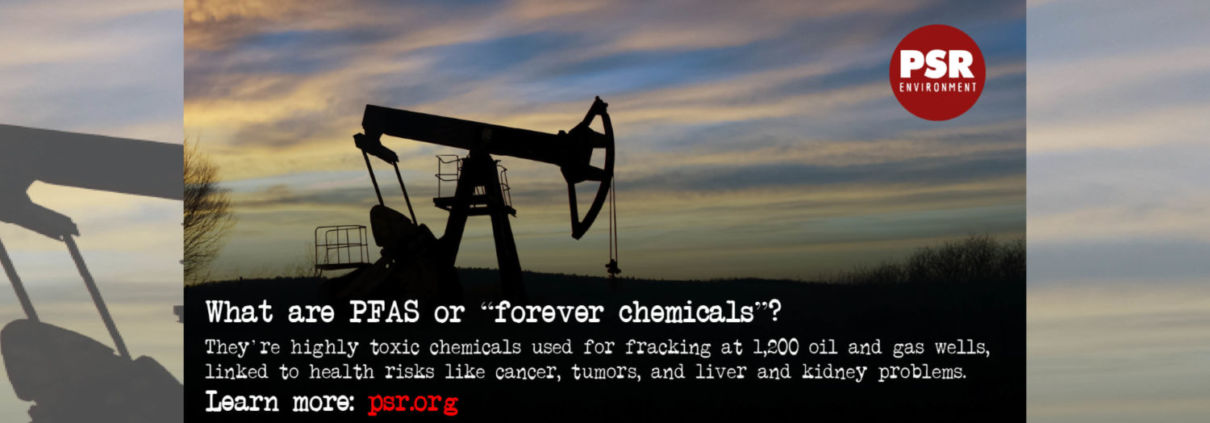
FracTracker Alliance released a new map identifying the locations of over 1,200 oil and gas wells using toxic “forever chemicals” in Arkansas, Louisiana, Oklahoma, New Mexico, Texas, and Wyoming.
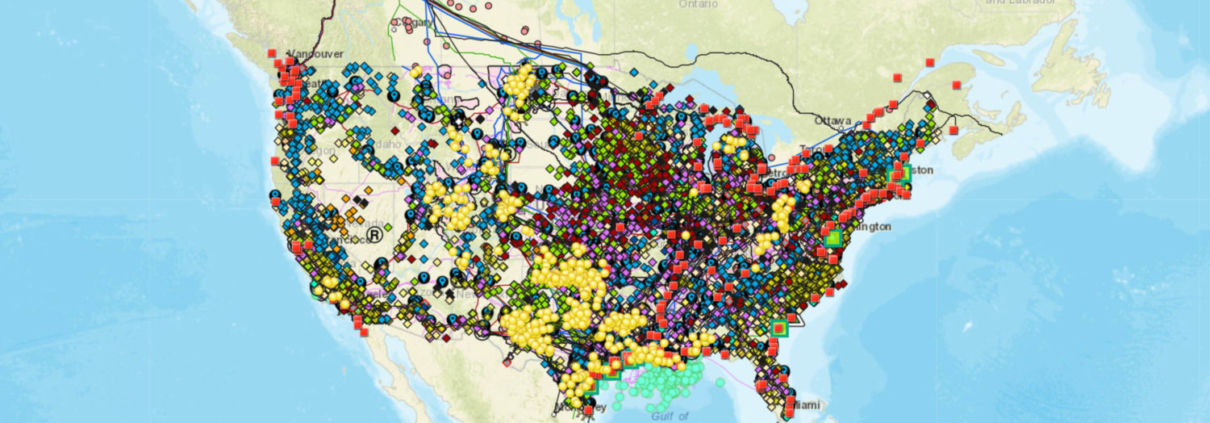
We first released this map in February of 2020. In the year since, the world’s energy systems have experienced record changes. Explore the interactive map, updated by FracTracker Alliance in April, 2021.
FracTracker’s aerial survey of unconventional oil & gas infrastructure and activities in northeast PA to southern OH and central WV
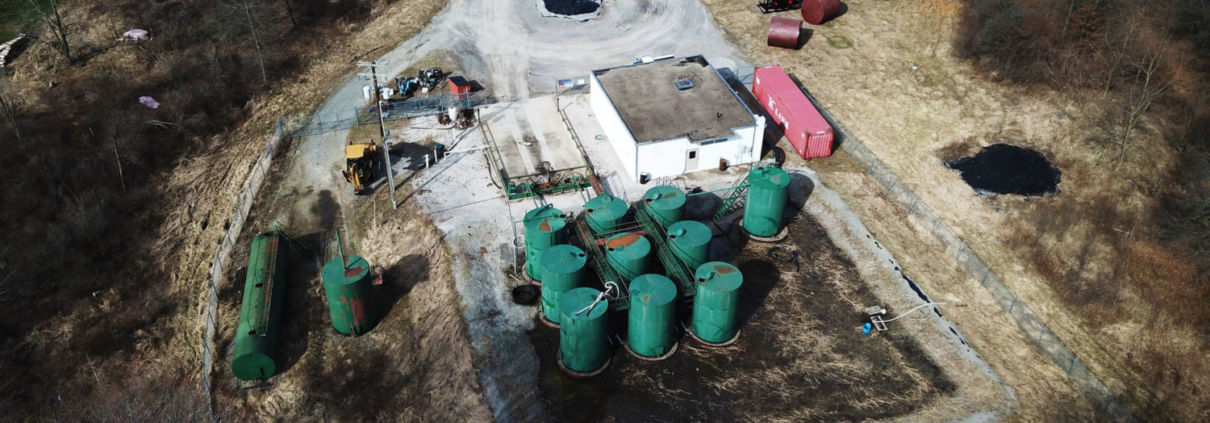
Insights on Ohio’s massive fracking waste gap, Class II injection well activity, and fracking waste related legislation
![]()
216 Franklin St, Suite 400, Johnstown, PA 15901
Phone: +1 (717) 303-0403 | info@fractracker.org
FracTracker Alliance is a 501(c)3 non-profit: Tax identification number: 80-0844297