Living on the Front Lines with Silica Sand Mines
Guest blog by Christine Yellowthunder, an environmental activist, tree farmer, and poet
Most people living in Wisconsin, Minnesota and Iowa have increased their knowledge over the past six years regarding the fracking destruction occurring across the country. The horror of fracking damages to life and land remain in the minds of most people who live near the massive land destruction from silica sand mining for what the unconventional oil and gas industry lovingly calls “proppant”.
Very often, we in the Midwest wonder if the rest of the country knows that this specialized form of silica sand mining destroys our rolling hills, woodlands, and water sources in order for silica sand to feed the fracking industry’s insatiable proppant demand.
Those of us who live in the direct path of this unhealthy silica sand mining need to make our stories known.
Bridge Creek Town, Wisconsin
The quiet abundance of life on an 80-acre tree farm in Wisconsin, fed by natural springs and wetlands, has nurtured every dream this prairie-raised transplant could conceive in the last 30 years. Six years of vigilance and rational debate has led to loss on every front when addressing the local government’s permitting of silica sand mines and its health and safety impacts on the community.
The largest sand mine in Bridge Creek Town lies one mile north of our tree farm. Two years ago, 40 acres of trees were culled for the installation of high intensity power lines to feed anticipated silica sand mine expansion under the legal provision of “Right-of-Way.” That document was signed by a previous land owner in 1948. No specific amount of land was specified on the original right-of-way, thus allowing significant legal destruction and permanent loss against the farm.
However, from a tree farm owner’s perspective, we have seen the variety and number of wildlife species increase at our farm over the past six years – likely because these species view our farm as an oasis, or what ecologists call a refugium, in an otherwise altered mixed-use landscape. The maximum capacity of the tree farm as a wildlife sanctuary is unknown. The adjacent silica Hi-Crush sand mine depletes the hillsides and woodlots in its path.
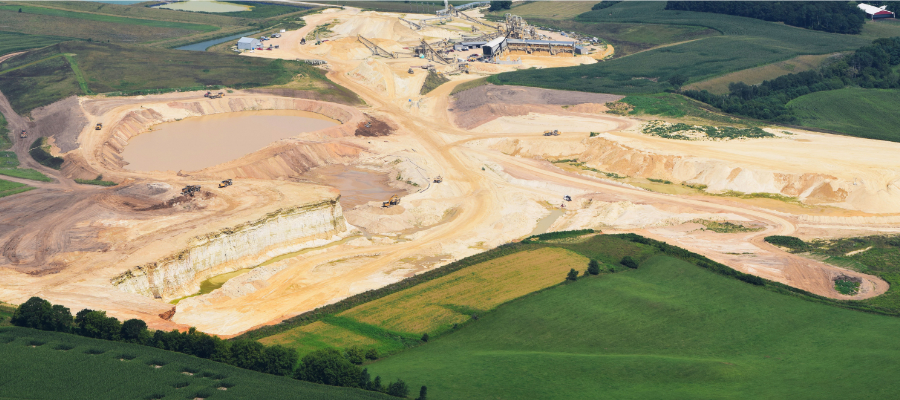
Frac sand mine in Eau Claire County, WI
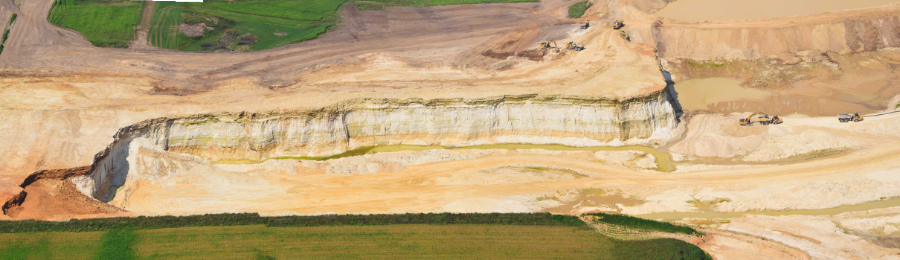
Hi-Crush Partners LP’s frac sand mine
The weekly blasting away of the hillsides sends shock waves – shaking homes and outbuildings weekly, along with our nerves. Visible cracks appear in the walls of buildings, and private wells are monitored for collapse and contamination. The sand mine only guarantees repair to property lying within a half-mile of the mine. The mine blasts the land near Amish schools and has had a noticeable effect on the psyche of countless farm animals. The invisible silica is breathed by every living thing much to the mine’s denial, with deadly silicosis appearing up to 15 years after initial exposure. Our community is left to wonder who will manifest the health effects first. Blasting unearths arsenic, lead, and other contaminants into private wells and into the remaining soil.
There has been no successful reclamation of the land after it is mined, with most residents wondering what the actual point is of developing a reclamation plan is if timely implementation and stringent reclamation metrics are not enforced. All useful topsoil has been stripped away and is dead with the land only able to support sedge grasses and very few of them at best. No farming on this mined land can occur even though these mining companies promise farm owners that when they are done mining, soil productivity will meet or exceed pre-mining conditions and much milder slopes than the pre-mining bluffs that contained the silica sand. Needless to say, land values of homes, farms, and property decrease as the mines creeps closer.
Explore photos of Hi-Crush Partner’s frac sand mine:


The people of Bridge Creek
Bridge Creek, as well as many other towns, have been easy picking for the mines. Many towns are unzoned, having little industry, a meager tax base, and a huge land area for a very sparse population. The unemployment and underemployment rates are quite high. Many residents in Bridge Creek farm, including a very large population of Amish who own a checkerboard of land used for farming and saw mills. Most of these Amish families arrived here from Canada and bought farms when the mid 80’s drought put small farms up for sale. The Amish community seldom votes, and their strong religious beliefs prevent them from taking a stand on any political issues.
Video of contaminated well water an Amish farm in Augusta, WI near frac sand mining
Scroll to the end of the article to explore more impacts to the Amish community
The original residents of this land, the Ho-Chunk people, are few in number and wish to protect their home lands that they had purchased back from the government.
Furthermore, a significant number of artists live in this community and have chosen to keep their homes and studios in anonymity. Thus, it is very difficult to amass any unity among this diverse population to stand up to the local government. Many long-time residents have the attitude that you can’t stop “progress.” I wonder if they know that this kind of progress kills the future?
Broken promises made by the mining company for jobs and huge payments to the initial land sellers have divided families and the community. Even though the mining boom was sold as a job provider, few locals are employed by the mines. There is little faith that the local government will provide for the safety and well being of its residents. Presentation of research, facts regarding aquifer endangerment and silica sand health risks, and proposals written in detail outlining potential protective ordinances have cost citizens, including myself, enormous amounts of time and money. The government responses remain the same. The sand mines have been allowed to continue destruction of the natural resources to no one’s benefit except for the enormous profits lining the coffers of the mining corporations.
Today, after six years of continuous silica sand mining moving ever closer, I can no longer fight logically and linearly to eliminate the greed, injustice, and usurped power head on. I fight land destruction as a different warrior.
I choose to protect this land and wood by nurturing its existence through planting more native trees, educating others to the wisdom and wonder of nature, by photo journaling the struggle for its survival and documenting this land’s story so that future citizens will know the truth. Moreover, I will continue to spread the message loud and long: stopping the silica sand mining will stop fracking.
These efforts may be the best that I can manage with a grieving heart. A fierce spirit will continue to share this story and those of others living in the Midwest where the silica sand laden hills roll under the top soil of our lives.
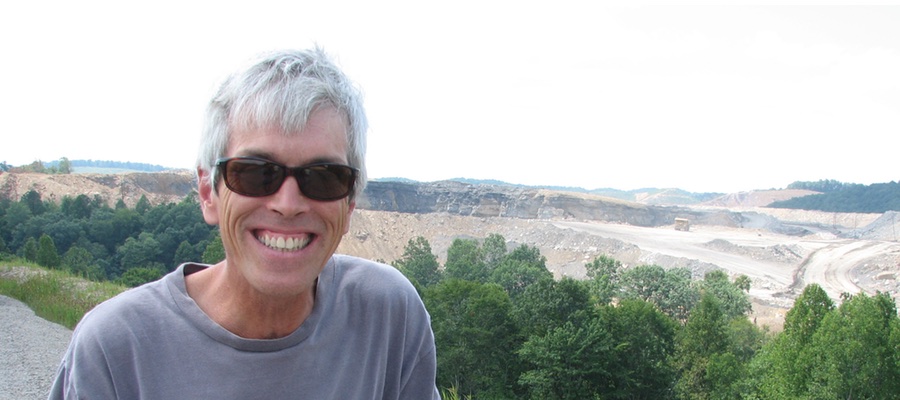
Christine Yellowthunder is an environmental activist of Lakota heritage and is also a tree farmer and poet. She lives on her farm with her husband Ralph Yellowthunder, a Ho-Chunk elder and Vietnam combat veteran.
The Amish community in Bridge Creek:
Listen below to in interview of an Amish farmer and clock maker who lives adjacent to the Hi-Crush mine, by Ted Auch, FracTracker’s Great Lakes Program Coordinator, and local resident, Mary Ann O’Donahue:
The frac sand mine and its impact on well water
1:35 “We had no problem with the well until they started back here, and then from there on she was orange….in June, I put chickens in the barn and I put a new filter in the line…and in a month’s time it was stopped up”
4: 28 “They hauled all that toxic waste to the back of the mine and dumped it”
Water testing and dust in the air
1:35 “They test for magnesium and manganese and aluminum, metals…there’s like 5 pages of them, and iron, mercury, iodine…everything they say if it’s a certain color it’s high…It’s been going up ever since they started. The first test looked real good, before they started doing anything…and every year since, it’s getting higher and higher and higher…I don’t hear nothing from them, they take the sample and that’s it…They don’t come talk about it, they’re not concerned that it’s raising”
7:15 “I can have my cart sitting underneath the overhang by the shop and I’ve never had to worry about it being much dusty. But if it’s sitting underneath there over there in the summer time…it’s not there a day before it’s covered in it.” “And that stuff’s going in your mouth too.”
Hi-Crush pond and blasts from the mine
1:40 “Who knows what’s in the pond?” “Well, that’s the problem, all the chemicals they use they never tell anybody what they’re using to process this stuff, and it’s all in where ever it runs off”
7:15 “You should’ve been here Monday…It was a real hard blast… I had the engine running and was working in [the shop], and it was a very big shaking there, and I noticed it so it had to be a real big one and I came to the door to look and [the smoke from the blast] was still three lengths higher than the tree over there… Usually they’re doing it two times a week…I’m sure it [affected] my house, because my ceiling’s cracked more and more. There was one lady here once when it happened and she didn’t stay very long, she said ‘I’m going home, I’m not staying in this house'”
Impact to animals, light pollution, interactions with workers
0:50 “She was riding a buggy and…they just happened to blast about the time the horse was as close as it could be and the horse freaked out and ran and she couldn’t control it”
Relations between workers, local officials, and the Amish community
Accidents involving farm animals, workers, and residents
Photos of the property and workshop:


Feature image: Frac sand mining in Wisconsin. Photo by Ted Auch, FracTracker Alliance, with aerial assistance from LightHawk.

