The Shale Gas & Oil Health Registry: A Collective Step to Track the Impacts of Fracking
“It’s all about facts. Documented facts…”
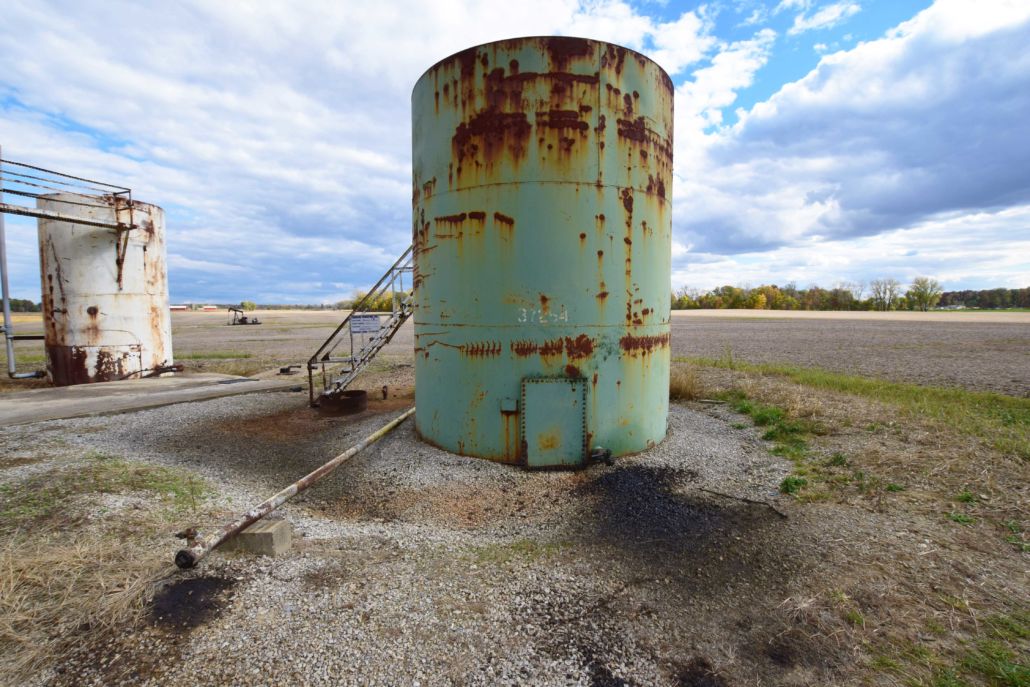
… asserted a county commissioner to a recent gathering of concerned residents in Hannibal, Ohio. His comment came at the end of over an hour of deeply moving narratives from residents, sharing disturbing changes in their health after a disastrous well pad fire in their community and other ongoing shale development in the area. One family, whose home was blanketed by the heavy black smoke from the fire, which burned for five days in 2014, told of respiratory problems, hair loss, newly-diagnosed thyroid issues, and a premature birth. Another family reported worsening of existing cardiac conditions, sleep disturbances, and considerable stress due to continued encroachment of pipelines and compression stations.
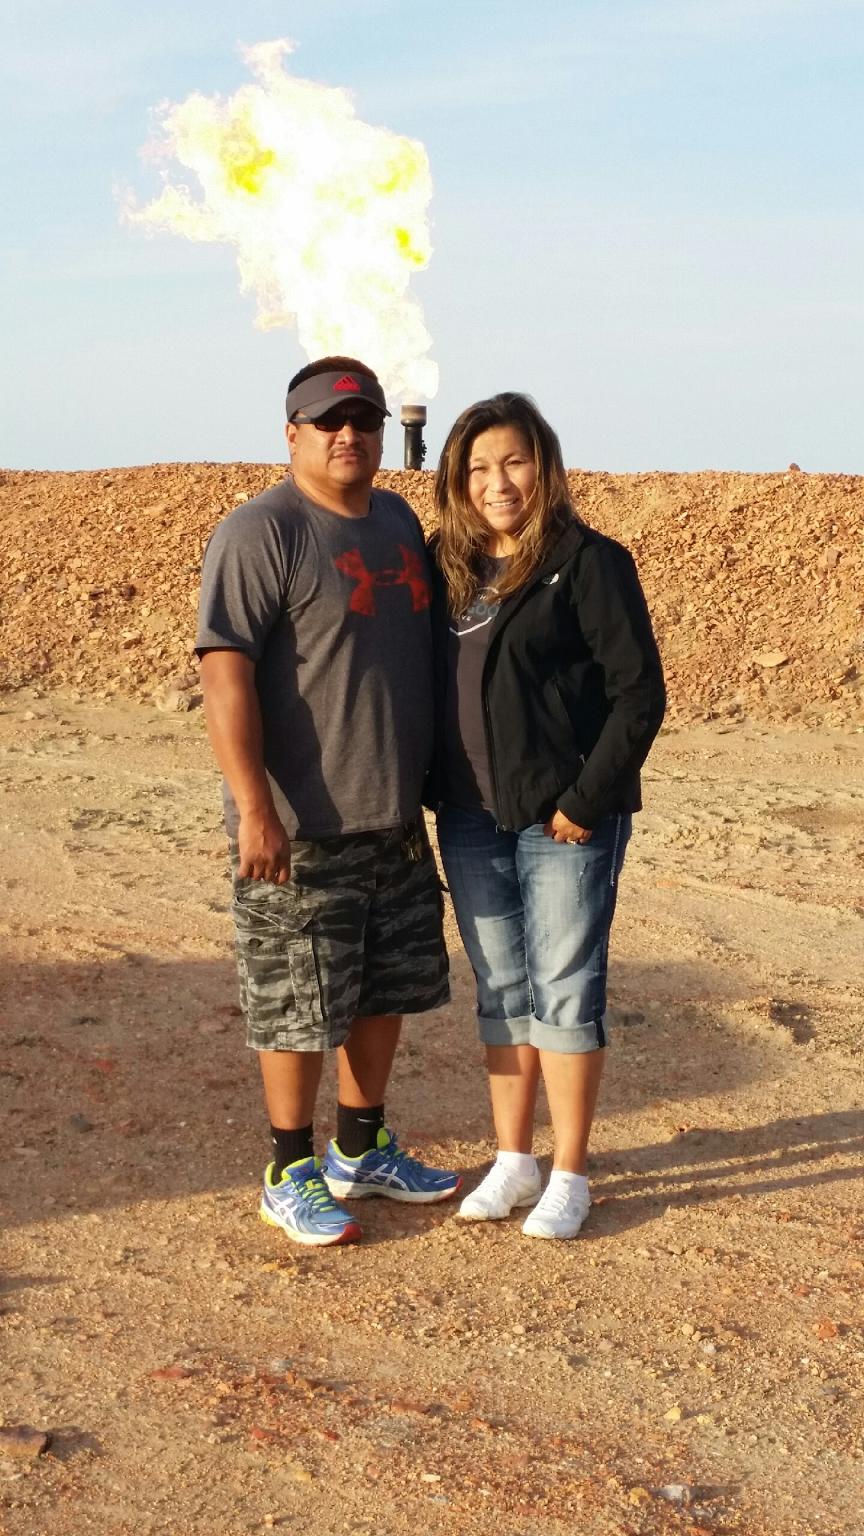
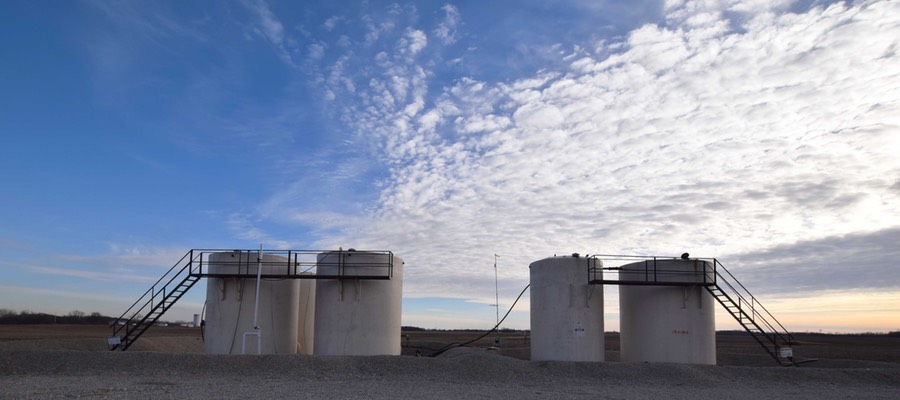
Figure 1: Residents of the Fort Berthold Indian Reservation in North Dakota live amid numerous oil rigs. Photo credit: Shalefield Stories, Vol. 2.
Throughout the country, personal stories like these offer a meaningful window into the experiences of people living at the frontlines of shale gas and oil development – often called ‘fracking.’ But aggregated into a formal health registry, these experiences can also form the kind of documentation needed to inform public health research and legislators who, like the county commissioner in Ohio, insist on documented evidence before issuing health-protective policies.
A health registry is “a dataset of uniform information about individuals collected in a systematic and comprehensive way, in order to serve a predetermined medical or public health purpose.”
The Southwest PA Environmental Health Project (EHP), in partnership with the Genetic Alliance, has just introduced the first such national system. In this online system, participants share – and control access to – their own data, making it unique among many other registries. This exciting new forum invites those living, working, or going to school near shale gas and oil development, like the families described above, to share their exposures and document their health symptoms. Perhaps most importantly, it ensures that personal stories are collected, respected, and treated as the important data that they are.
Figure 2: These quick and informative videos introduce EHP’s Shale Gas & Oil Health Registry and how it works. They feature the voices of those who helped create it, including public health professionals, the director of EHP, and a community member.
Why a registry?
Public health research affirms that there are significant health risks for those living, working, or attending school near shale gas and oil development. Research points to links between proximity to fracking and worsened asthma and other respiratory impacts and skin conditions; fracking’s noise pollution and stress-related conditions, like cardiovascular problems; and low birth weight babies among mothers living near numerous hydraulically fractured wells.
Physicians, Scientists, and Engineers for Healthy Energy (PSE) conducted a thorough examination of the extensive and growing body of shale gas and oil-related research and found that between 2009 and 2015, 84% of the studies focused on health have findings that “indicate public health hazards, elevated risks, or adverse health outcomes.”
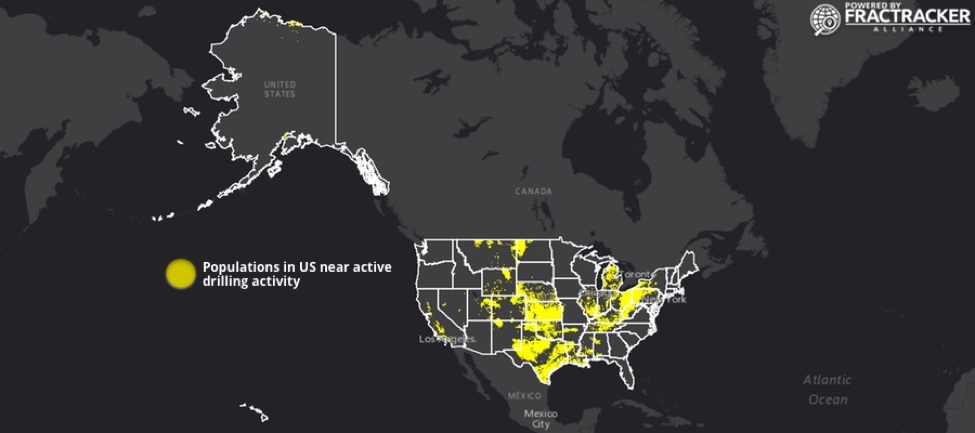
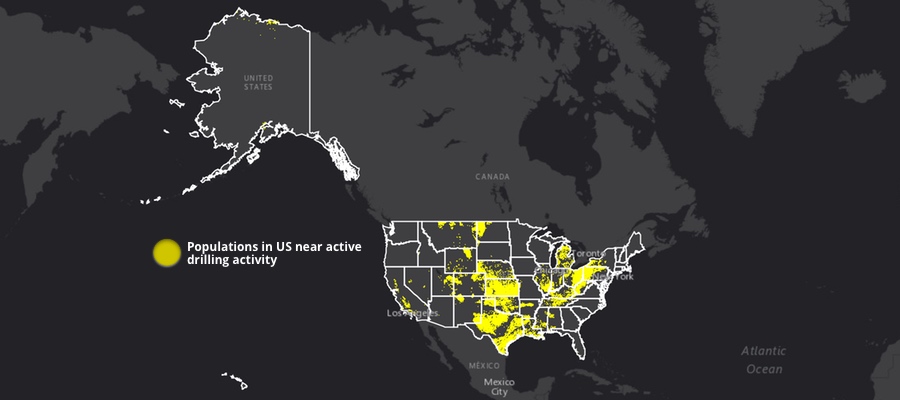
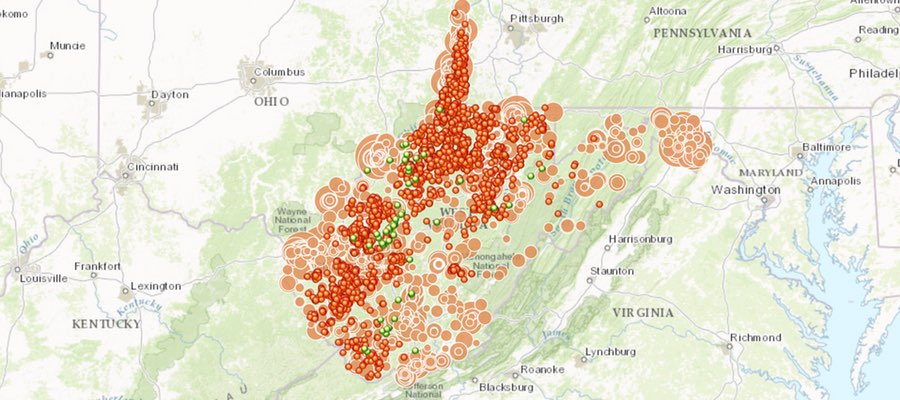
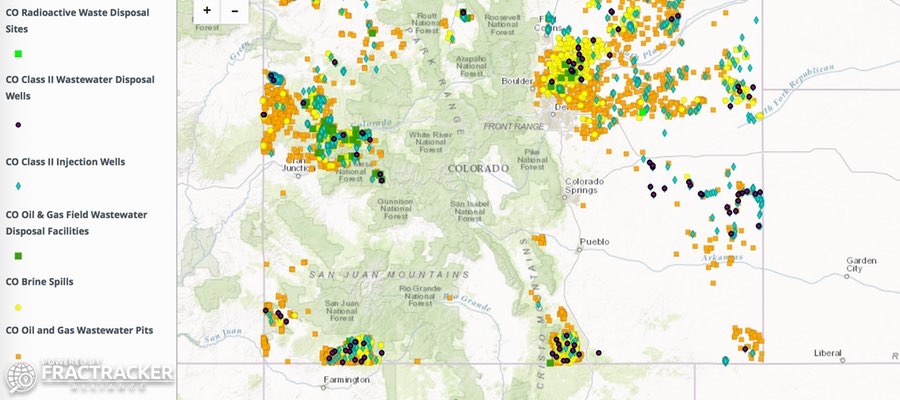
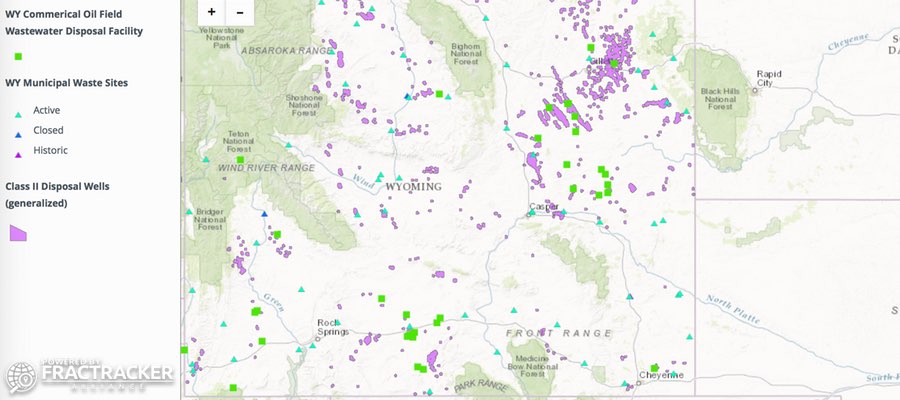
Figure 3: Populations in the U.S. near active drilling. The Shale Gas & Oil Health Registry has a national scope. Click on the image to learn more about how this map was made.
For years, some medical professionals attuned to environmental effects on health have noted correlations between fracking and health symptoms in their patients. But without a clear explanation of causation that links such symptoms to fracking, researchers need more data.
The Pennsylvania Medical Society recommended a registry as a necessary step toward getting a grasp on the public health problem. A health registry collects health data systematically, and may support further epidemiology and toxicology research by putting these patterns in higher contrast.
Laying the Groundwork
The Shale Gas & Oil Health Registry did not emerge in isolation, but rather is one of several ongoing efforts toward gathering the innumerable accounts of health symptoms from shale development regions around the country.
Important grassroots initiatives include the List of the Harmed, started by Jenny Lisak in 2011. The List catalogues over 20,000 stories of human, animal, and environmental impacts. The Natural Gas Exploration & Production Health and Community Impacts Survey, created by The Damascus Citizens for Sustainability (DCS), is an effort to collect health impact information from individuals in shale gas communities and hopefully trigger further review from the Agency for Toxic Substances and Disease Registry (ATSDR). Additionally, there are numerous peer reviewed studies on the topic, but they are often too limited in scope and size to be generalized to communities outside of where the data was originally collected.
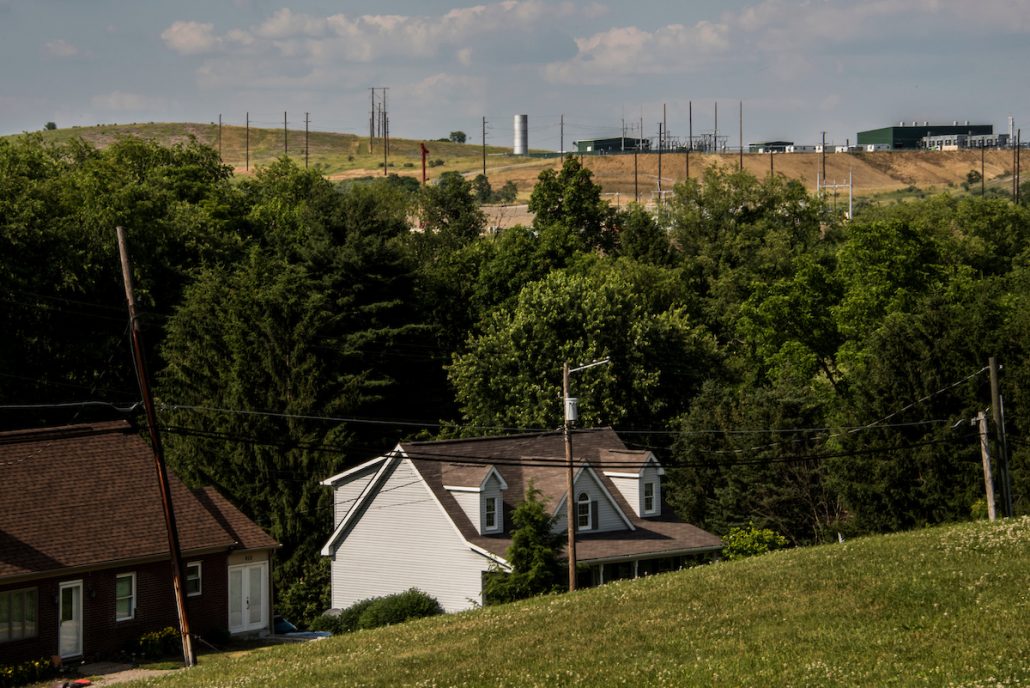
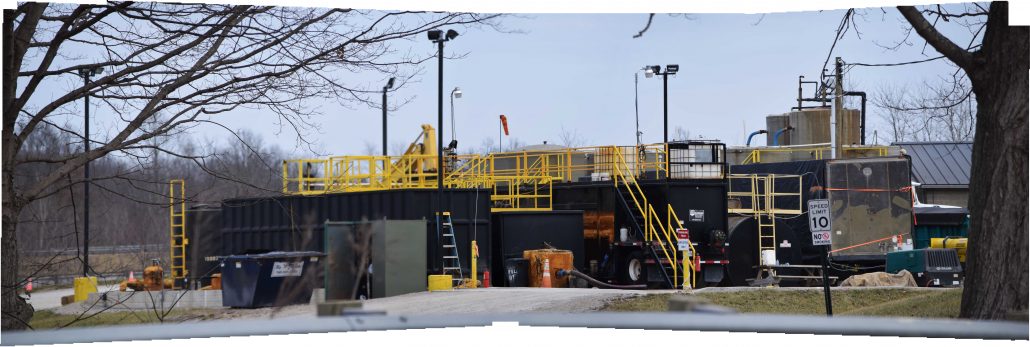
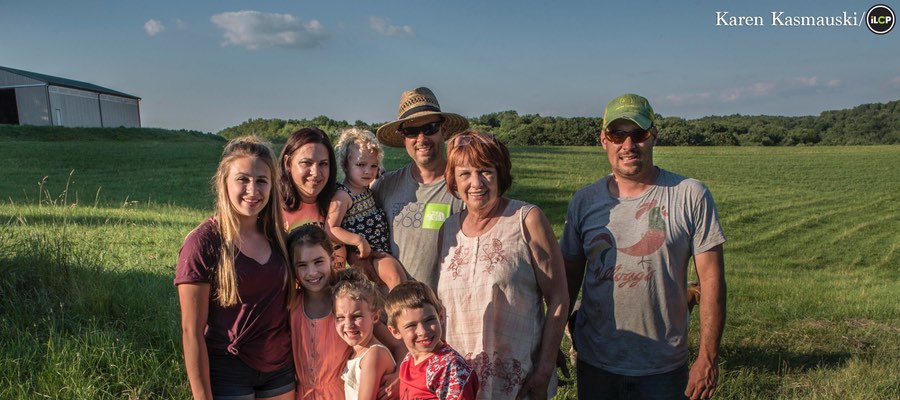
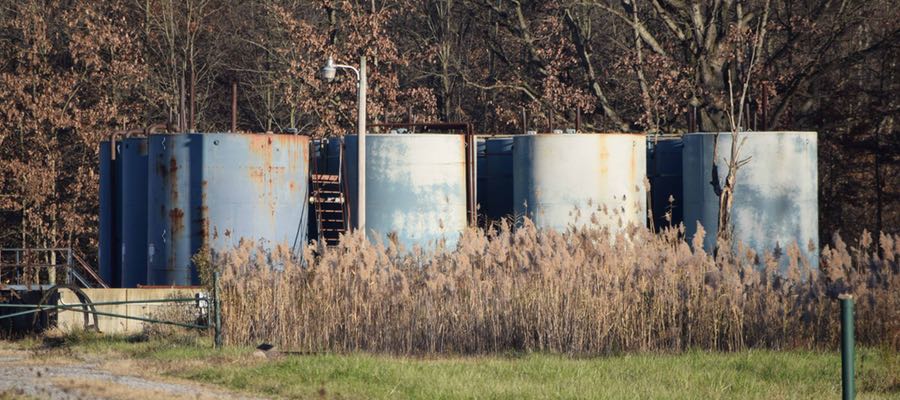
Figure 4: In Washington County, PA, houses sit just below a compressor station, a type of natural gas facility that can produce air emissions, noise, and light pollution. In the health registry, participants can answer questions about the types of facilities they are exposed to. Photo credit: Karen Kasmauski, iLCP.
Two states have begun their own registry-related efforts. Colorado’s Oil & Gas Health Information and Response Program includes an online self-referral form, a hotline for those with health concerns potentially related to oil and gas, and a health information “clearinghouse.” Their program aims to illuminate “possible health effects related to oil and gas operations,” which the program intends to make available to the public, researchers, and policy-makers (source).
Pennsylvania, where EHP does much of its on-the-ground work, has a history of legislative calls for its own registry, beginning with recommendations issued by Governor Tom Corbett’s Marcellus Shale Advisory Commission in 2011. The Secretary of Health at the time called a registry “the most timely and important initiative” for the Department of Health (DOH). Current Governor Tom Wolf called for a shale gas health registry in his 2014 gubernatorial campaign. He proposed budgeting $100,000 to the PA Department of Health (DOH) for the cause, although health professionals argue that more is needed to implement an effective registry. According to recent conversations with EHP, DOH is in the process of developing a system similar to Colorado’s, in coordination with that state. For the time being, Pennsylvanians seeking assistance from DOH will find a webpage with limited information, directing calls to the state’s Bureau of Epidemiology.
Making the Registry a Reality
There is a clear need for a system to collect individuals’ exposures and health symptoms, with a national scope that matches the country-wide scale of shale development. Yet, the costs of initiating and maintaining a registry, political issues related to industry reporting on the chemicals they use and discharge, and scientific issues such as scant exposure data and limited funding for research, are some of the various obstacles that faced the implementation of a health registry.
From a health perspective, symptoms potentially related to drilling activity may be similar to symptoms from unrelated causes, or may be exacerbations of existing health conditions. Added to this is the complexity of exposure sources, since an individual or family may live, work, or go to school in proximity to multiple types of shale gas and oil facilities. Moreover, those at the frontlines of shale oil and gas development – whose health data is essential to the registry – may be reluctant to participate due to social or family pressures.
The Shale Gas & Oil Health Registry directly addresses each of these challenges. Using an existing registry infrastructure created by Genetic Alliance significantly reduced the costs of launching and maintaining the registry. Including systematic questions that let users record their proximity to – and frequency of – exposure captures the complexity of this important information. And through steps like collecting zip codes instead of home addresses, and offering the choice of privacy settings that only allow researchers to see data in anonymous form, the registry ensures confidentiality and user control of data.


End Result: The Shale Gas & Oil Health Registry
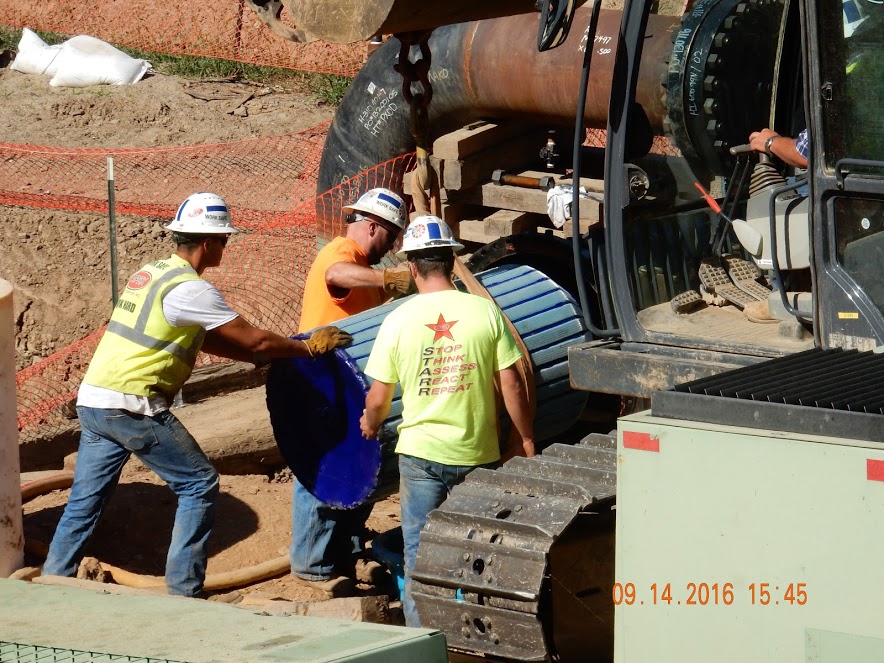
Figure 7: The health registry includes a set of questions for participants whose exposures come from working in the gas and oil industry. Photo credit: Bill Hughes.
The result of these efforts is a secure, online system where participants – people within five miles of shale gas and oil development, with or without health symptoms – can create an account for themselves and/or their family members. The online registry guides them through a series of screens inviting them to share the various exposures they encounter, such as heavy truck traffic, air emissions, and water impacts. Participants can catalogue and update health symptoms that have surfaced or worsened during their exposure, while controlling who can view and share their personal information.
Industry workers and children can even be registered in this system using a set of tailored questions. The registry also allows an assistor to create a profile and answer the questions for someone not comfortable with or able to use the online system.
One Registry to Meet Many Needs
EHP created the health registry to respond to the needs of several groups: affected communities, researchers, policymakers, and the public.
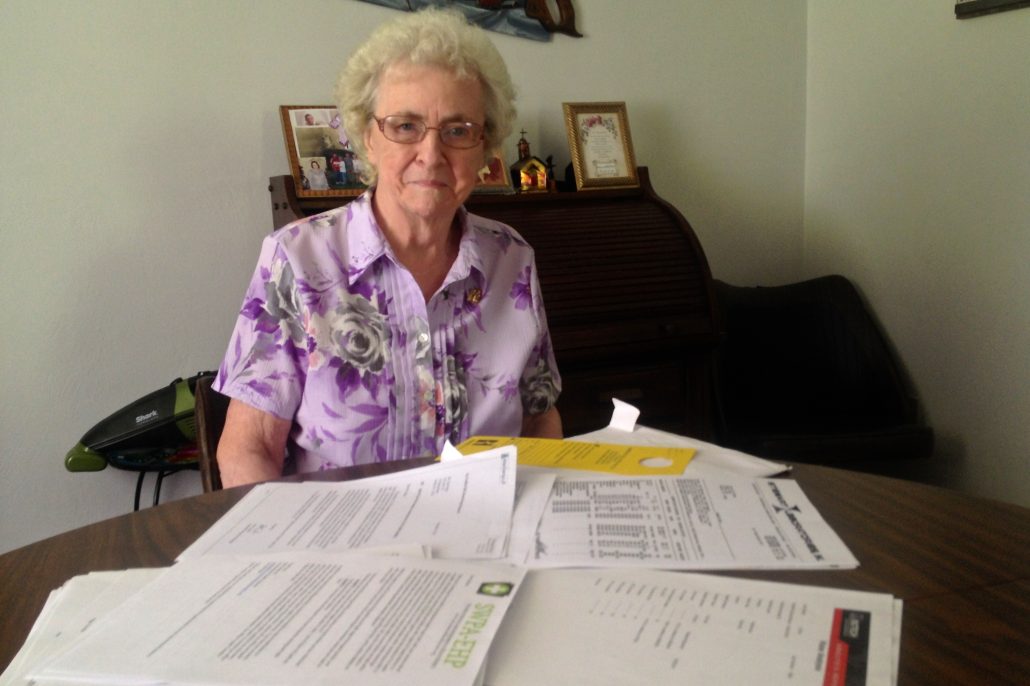
Figure 8: A resident of Washington County, PA sits in front of paperwork documenting health struggles that may be connected to shale gas development near her home. Photo credit: Shalefield Stories, Vol. 2.
In developing the health registry, EHP recognized that those affected by shale development must not be treated as “data points,” but as collaborators in – and beneficiaries of – the process. As a venue to share health concerns, the registry helps give voice to those who may be suffering in silence. Participants can connect with researchers, receive a biannual newsletter of updates on the growing size of the registry and new knowledge around health impacts and treatment. In the long view, the registry gives individuals an opportunity to take part in a large-scale effort that may ultimately inform positive change and promote protections from ever-expanding shale development.
The data participants provide via the registry can also help researchers identify emergent patterns and generate testable hypotheses for new studies. Through this process, a registry can enable research that is responsive to community needs.
Policymakers stand to benefit, as well. The patterns that the registry highlights, and the additional research it makes possible, can help elected leaders to understand the scope of the health problem. In time, this knowledge can inform policies and regulations that benefit those living in shale country.
A chance to be a part of something larger
EHP encourages those who live near shale gas and oil development, with or without health symptoms, to register now and fill out the registry questionnaire. The three-step process takes only about 20 minutes.
- Share: Answer as many questions as you would like, and control how and with whom that information is shared
- Connect: Find out how you compare to others, and let support and helpful resources come to you
- Discover: If you wish, let researchers access your information to help them understand the health impacts of shale oil and gas development and transport
Researchers and healthcare providers who want to take part in the possibilities created by the registry, such as studying data patterns from participants who have elected to share certain information, can contact Jill Kriesky (jkriesky@environmentalhealthproject.org) or Beth Weinberger (bweinberger@environmentalhealthproject.org) for more information.

Ready to get started?
Click here to join the Shale Gas & Oil Health Registry!
Sincere Appreciation
Many thanks to those who contributed to this article about the Shale Gas & Oil Health Registry through interviews and by sharing the images used in this story.
The International League of Conservation Photographers and the Environmental Integrity Project for sharing photographs of families coping with fracking where they live, “The Human Cost of Energy Production.”
Dana Dolney, co-founder of Friends of the Harmed. Friends of the Harmed, publishers of Shalefield Stories, dedicate 100% of donations they receive to providing much-needed direct aid to families negatively affected by fracking.
Jenny Lisak, creator of List of the Harmed. List of the Harmed is an ever-growing list of the individuals and families that have been harmed by fracking (or fracked gas and oil production) in the U.S.
Barbara Arrindell, director of Damascus Citizens’ Group. Damascus Citizens for Sustainability (DCS) is a collaborative endeavor to preserve and protect clean air, land and water as a civil and basic human right in the face of the threat posed by the shale gas extraction industry.
Jill Kriesky, Associate Director and Beth Weinberger, Research & Communications Specialist, both of The Southwest PA Environmental Health Project. The Environmental Health Project (EHP) is a nonprofit public health organization that assists and supports residents of Southwestern Pennsylvania and beyond who believe their health has been, or could be, impacted by unconventional oil and gas development (UOGD, or “fracking”).
By Leann Leiter, Environmental Health Fellow, FracTracker Alliance & EHP
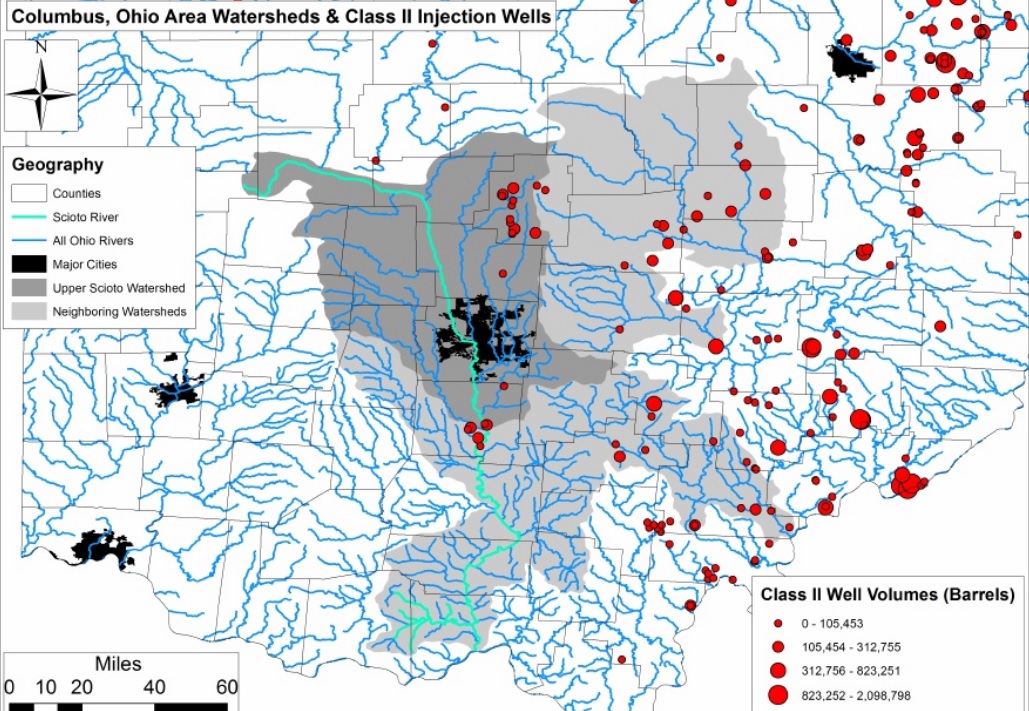


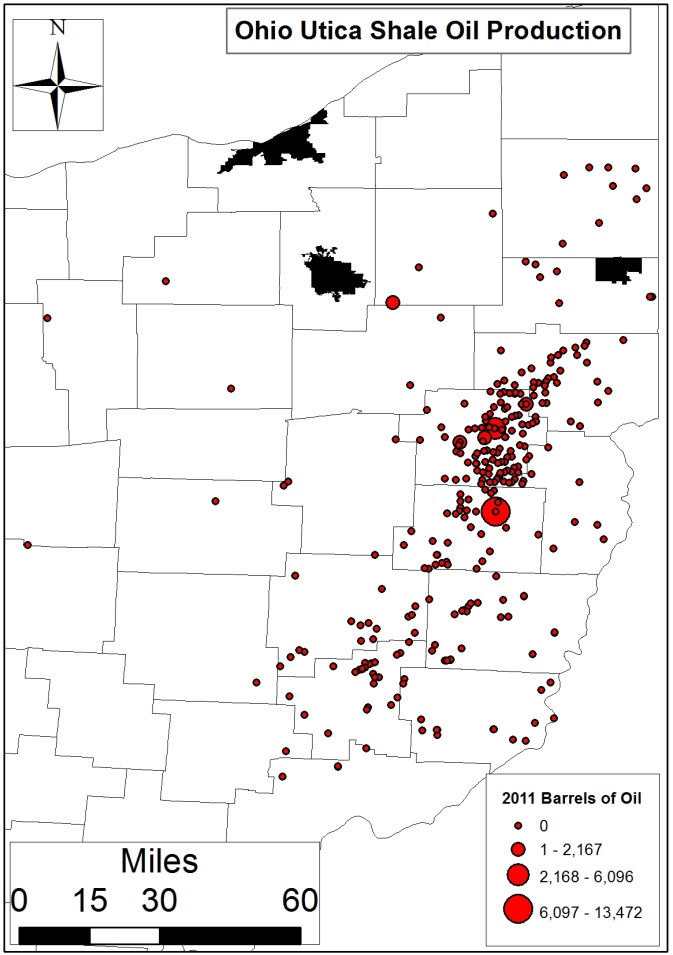
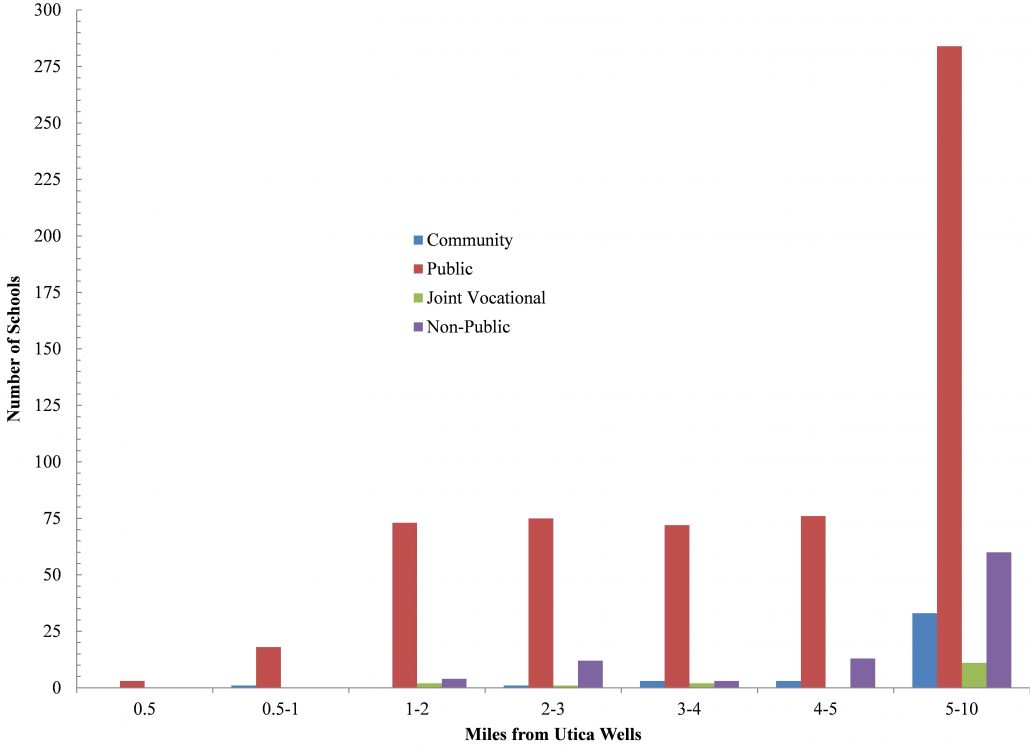


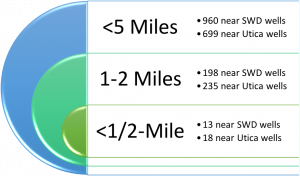 Just how close are public water supplies to Class II waste disposal wells and permitted Utica wells? As of January 15, 2017, there are 13 PWS’s within a half-mile of Ohio’s Class II SWD wells, and 18 within a half-mile of permitted Utica wells. These facilities serve approximately 2,000 Ohioans each, with an average of 112-153 people per PWS (Tables 1 and 5). Within one mile from these wells there are 64 to 66 PWSs serving 18 to 61 thousand Ohioans. That’s an average of 285-925 residents.