The majority of FracTracker’s posts are generally considered articles. These may include analysis around data, embedded maps, summaries of partner collaborations, highlights of a publication or project, guest posts, etc.
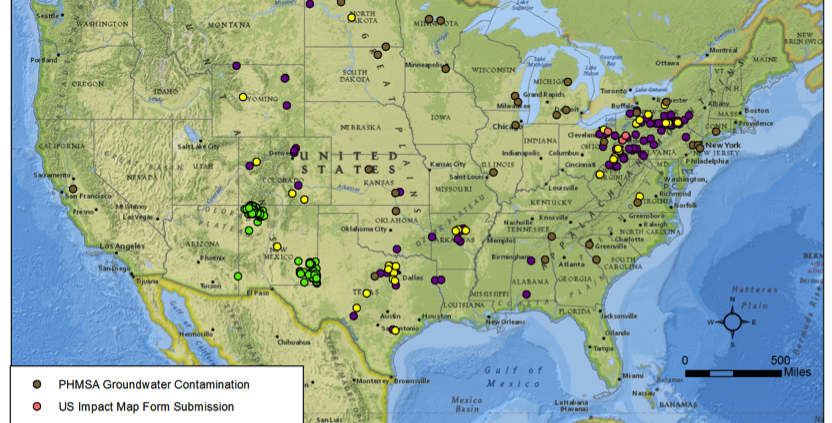
The FracTracker Alliance has been working with nine different community partners on a project to map instances where oil and gas activity are suspect of impacting groundwater supplies in the United States. The US Map of Suspected Well Water Impacts is now ready for its initial release, and consists of the following data layers:
Visitor Submitted Impacts. This layer consists of viewer submitted form data describing suspected incidents of groundwater contamination by oil and gas extraction and related industries. The locations have been determined using the centroids or geometric center-points of the zip code in which the suspected incident occurred. If you are aware of additional incidents, please submit them here.
Pipeline Incidents Contaminating Groundwater. This data layer includes hazardous liquid pipeline incidents that were indicated as resulting in groundwater contamination between 1/1/2010 and 3/29/2013. The data were obtained by the US Department of Transportation Pipeline and Hazardous Materials Safety Administration (PHMSA). The data have been altered by the FracTracker Alliance in that it only includes incidents leading to groundwater contamination, and by the removal of several dozen columns of data about the incident for the sake of brevity. There are 30 incidents on this list.
NRDC Suspected Contamination Events. Amy Mall of the Natural Resources Defense Council compiled a list of 37 incidents where hydraulic fracturing is suspected of contributing to groundwater contamination. The list was compiled in December 2011, and each entry is linked to news reports of the event. This layer was mapped by the FracTracker Alliance based on the centroids or geographic center-points of the municipality, county, or state of the incident, depending on the best information available.
List of the Harmed Suspected Water Incidents. Jenny Lisak, co-director of the Pennsylvania Alliance for Clean Water and Air, maintains a list of people claiming to be harmed by hydraulic fracturing or related processes, called the List of the Harmed (LotH). This data layer is based on the February 23, 2013 update of the list, and contains only the events in which water is the suspected exposure pathway. This data was mapped by the FracTracker Alliance based on the centroids or geographic center-points of the municipality, county, or state of the incident, depending on the best information available.
NM Pit Contamination Events. This layer consists of events where the New Mexico Oil Conservation Division determined that substances from oil and gas pits contaminated groundwater. Altogether, there are 369 incidents included in the data. The document on which this map was based was published in 2008. This data was mapped by the FracTracker Alliance based on the centroids or geographic center-points of the PLSS section, meaning that the points should be accurate within 0.72 miles.
US Map of Suspected Well Water Impacts – Version 1
It is important to note that the standard for inclusion in the map is simply whether or not someone suspects that well water has been impacted by oil and gas extraction-related activity. Specifically, items on the Visitor Submitted Impacts, NRDC Suspected Contamination Events, and List of the Harmed Suspected Water Incidents should be thought of as perceived impacts by oil and gas activity, not confirmed ones. The NRDC and LotH lists were built with links to one or more media reports about the event.
On the other hand, the New Mexico document on which the pit contamination event layer was built simply says, “Cases Where Pit Substances Contaminated New Mexico’s Ground Water,” and it is worth noting that it was published by a state regulatory agency. Likewise, the PHMSA pipeline data is published by an administration within the US Department of Transportation. Between these two layers, there are 399 incidents with the authority of a regulatory agency behind them.
https://www.fractracker.org/a5ej20sjfwe/wp-content/uploads/2013/04/WellimpactsMap_V1Static.png628832Matt Kelso, BAhttps://www.fractracker.org/a5ej20sjfwe/wp-content/uploads/2025/09/2025-Wordmark-Logo.pngMatt Kelso, BA2013-05-01 09:30:382020-07-21 10:40:58Introducing the US Map of Suspected Well Water Impacts
Identified by Researchers at the University of Pittsburgh Graduate School of Public Health
By Kyle Ferrar, MPH – DrPH Candidate, Environmental and Occupational Health Department, Graduate School of Public Health, University of Pittsburgh
The potential for negative health impacts to result from unconventional natural gas development activities, such as hydraulic fracturing (deemed “frac’ing”) occurring in the Marcellus Shale basin, is a highly debated and contentious issue. To resolve this issue public health and medical professionals will need to conduct a large-scale epidemiological study – one that monitors the lives and health of a large sample of people for an extended period of time. Such a study should test to see if proximity, or closeness to unconventional natural gas development, such as frac’ing, causes negative health impacts. Such a study has not yet been officially proposed in Pennsylvania, much less funded, but researchers at the University of Pittsburgh’s Center for Healthy Environments and Communities (CHEC) believe such a study will be conducted in the future.
New peer-reviewed research released by the CHEC provides background data for that kind of study. The research documented 59 unique health impacts, or “symptoms,” and 13 “stressors” perceived to result from Marcellus Shale development. Over time, symptoms and perceived health impacts increased for the sample population (p<0.05), while stressors resulting from Marcellus Shale activity remained consistent (p=0.60). The study group was a biased sample population, meaning the participants were not randomly selected. Rather, the participants were already concerned by or interested in issues associated with this industrial activity.
Using community based participatory research methods, researchers from CHEC, along with researchers from FracTracker while it was still a project at CHEC, engaged community members with in-depth interviews. Mail surveys have been conducted by other researchers in Colorado and Wyoming, but this is the first research to use an ethnographical, in-person approach. Furthermore, this is the first peer-reviewed and published research that describes symptoms in those who believe their health has been affected. The six most reported symptoms are reported in Table 1, with stress being the most commonly reported health effect.
The article contributes several new findings to this field of research, including evidence about what people report as stressors. Contributions of stress to negative health effects are well documented in the literature, known as allostatic loads. The six most commonly reported “stressors,” or sources of stress, are reported in Table 2. Particularly notable is the very high percentage of the group that report issues such as being lied to that presumably would be corrected if the industry became more transparent and responsive. The article also reports on the longitudinal nature of the perceived health impacts and stressors. Longitudinal refers to the fact that the data were collected over time, not just once. Follow-up interviews conducted 19-22 months after the initial interviews showed that the number of perceived health impacts reported by participants actually increased over time, while the number of stressors reported remained consistent. This contradicts industry’s argument that the problems are mainly caused by seeing and hearing drilling activity, and that as the intensity of activity diminishes over time so will the symptoms and stressors. While this research does not answer the larger question of whether negative health effects are associated with Marcellus Shale development, it demonstrates a need for future studies to be conducted within these particular communities and supports the more difficult task of embarking on a broader epidemiological study.
Table 1. Most reported symptoms with the percentage of participants reporting said symptom.
Symptoms
Session 1 (n=33)
Stress
76%
Rashes
27%
Loss of sleep
27%
General illness
24%
Headaches
24%
Diarrhea
24%
Shortness of breath
21%
Table 2. Most reported “stressors” participants associated with Marcellus Shale development, with the percentage of participants reporting said stressor.
https://www.fractracker.org/a5ej20sjfwe/wp-content/uploads/2012/02/Twitter-FracTracker-Logo.png291317Guest Authorhttps://www.fractracker.org/a5ej20sjfwe/wp-content/uploads/2025/09/2025-Wordmark-Logo.pngGuest Author2013-04-30 10:51:592020-07-21 10:40:58Negative Health Impacts & Stressors Perceived to Result from Marcellus Shale Activity
By Ted Auch, PhD – Ohio Outreach Coordinator, FracTracker Alliance
A Conference Retrospective
Communities, NGOs large and small, local governments, and even next door neighbors and/or families are dealing with long-term potential and realized environmental, economic, health*, and social equity damage from the activities of the gas industry in Ohio and beyond. These impacts were vetted at a conference (PDF) recently convened in Warren, OH by FreshWater Accountability Project Ohio, The FracTracker Alliance, and the Buckeye Forest Council. The title of the conference was “Unconventional Shale Drilling: What we know, What we don’t know, What we need to know to move forward.” The premise was to bring together a forum of diverse subject matter experts from academia, industry, government and private organizations to discuss and prioritize – using a knowledge-based approach – the various major issues relating to energy extraction that are facing local, state and national agencies and private citizens.
Conference attendees heard from a variety of researchers and community activist about their successes and failures, data needs, and expectations for how to leverage the conference gathering into a relatively cohesive and largely ego free movement. One highlight was a presentation and informal discussion with Deborah Rogers, former Merrill Lynch and Smith Barney investment banker, Dallas Federal Reserve Advisory Council member, current U.S. Extractive Industries Transparency Initiative (USEITI) advisory committee member, and the woman behind the Energy Policy Forum. Ms. Rogers’ keynote presentation “Shale and Wall Street: Was the Decline in Natural Gas Prices Orchestrated?” focused on the regulatory and high finance parallels between the early aughts real-estate bubble and the current US shale bubble’s red queen predicament (what’s this?) forcing industry to acquire shale assets and repurchase shares in an illusory attempt to inflate their balance sheets and placate Wall Street expectations (while simultaneously overestimating reserves by 400-500% and experiencing 6.5% recovery efficiencies). Ms. Rogers pointed to the fact that the US is home to 181,000 oil and gas jobs Vs. 183,200 renewable energy jobs, however, they account for 45% and 15% of total energy generation capacity, respectively, with the latter “providing significantly more jobs per kilowatt capacity than oil and gas.”
Ms. Rogers was followed by University of Pittsburgh professor Dr. Bernard Goldstein, Biological Mimetics, Inc. President and CEO, Peter Nara, with public health and environmental concerns presentations, respectively. Julie Weatherington-Rice, an OSU adjunct faculty geologist, delivered an Ohio- focused talk on the legal and public policy implications of drilling in public water well fields. Dr. Weatherington-Rice gave an encore performance the following day focusing on shale gas waste, public water supplies, Ohio EPA’s September 2012 advisory regarding disposal of fracking waste in the Great Lake’s waste landfill facilities, and the dangers associated with technologically enhanced radioactive material (TENORM). Dr. Rice was followed by presentations on sustainable communities via “Local Self-Government and the Rights of Nature” by Tish O’Dell of the Community Environmental Legal Defense Fund (CELDF) and Matt Nisenoff exploring the non-binary nature of Ohio advocacy. Mr. Nisenoff addressed the need for persistent organizing and “entering the political ring as candidates rather than voters.”
One of the most novel components of the conference was the presentation by Rumi Shammin, an environmental studies professor at Oberlin College who brought to the floor the concepts of ecosystem services and ecological economics or the monetization of ecological pattern and process [1]. These two lines of research are new to the hydraulic fracturing conversation and potentially integral to policy formulation, community outreach and academic-citizen scientist collaboration in Ohio.
Bowling Green State University professor Andrew Kear offered the final presentation titled “Unconventional Politics of Unconventional Gas: Environmental Reframing and Policy Change.” The presentation highlighted his PhD dissertation work focusing on unlikely bedfellows in the mountain west shale plays and the types of lessons he thought applied to Ohio’s shale fracturing discussion.
The conference closed with attendees coming together to identify the explicit knowns, known unknowns, and unknown unknowns in Ohio relative to economic, environmental, social integrity, and health issues. The results of these break-out groups and discussion will be made available to the public in the next two weeks.
Next steps include crafting two to three white papers, writing a peer review publication, implementing effective collaboration strategies, planning future conferences, and developing policy recommendations. The ultimate goals are to promote fact-based transparency, best in class technologies, and create healthy and sustainable energy resources.
In the face of industry and regulatory inertia that continues to push back against transparency and local control, the conference underscored the need for more education, data, and far more research – all issues of special interest to the FracTracker Alliance – while bridging rifts and fortifying existing bonds.
Contact Information
For more information and notices as to resulting products, please contact:
* Keynote speaker Deborah Rogers cited health impact costs in the Barnett, Fayetteville, and Marcellus Shale of $73, 33.5, and 32 million per annum.
[1] Arrow et al., 1995; Costanza et al., 1997; Costanza et al., 2000; Costanza, Wainger, Folke, & Mäler, 1993; Daily et al., 1997; Krantzberg & Boer, 2006; Ruhl, 2006
https://www.fractracker.org/a5ej20sjfwe/wp-content/uploads/2025/09/2025-Wordmark-Logo.png00Ted Auch, PhDhttps://www.fractracker.org/a5ej20sjfwe/wp-content/uploads/2025/09/2025-Wordmark-Logo.pngTed Auch, PhD2013-04-23 16:44:562020-07-21 10:40:57Unconventional Shale Drilling: What we know, What we don’t know, What we need to know to move forward
The Ohio Utica play has taken off in the last calendar year, jumping from 160 permitted wells as of March 2012 to 453 since then. This equates to 1.24 permitted wells per day. (Note: The state’s less exploited Marcellus shale had 13 permitted wells a year ago with an increase of 7 since then.) A year ago Ohio was home to 50 “drilled” wells and is now home to an additional 80 “drilled” wells (Figure 1). Meanwhile 0.65% and 1.14% of permitted wells are what Ohio Department of Natural Resources (ODNR) calls “Inactive” or “Not Drilled” with the latter being relatively similar a year ago vs. today with 3 and 4 “Not Drilled” wells, respectively. According to the latest ODNR data 54 Utica wells were permitted as of 4/1/2012 vs. 342 since then. Plugged wells constitute 1.63% of all Ohio Utica wells although the industry appears to be increasing efficiency with respect to plugging having experienced 7 “Plugged” wells as of 4/1/2012 and only 3 since. Conversely, wells that are “Producing” have declined from 25.63% (41 “Producing” wells) of all permitted wells to 1.32% (6 “Producing” wells) of all permitted wells since then with the latest reported producing well being a Mountaineer Keystone well in Windham Township, Portage County.
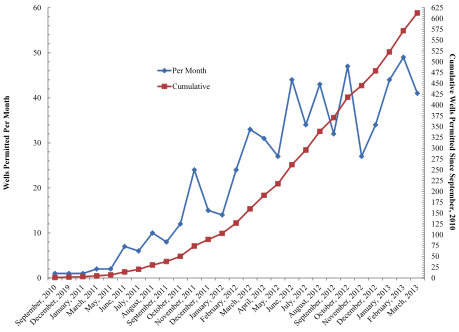
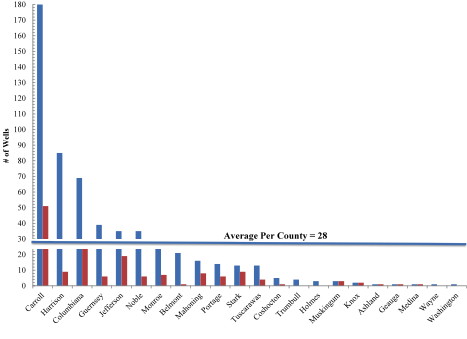
The permitting process has continued along its exponential path since permitting began September 28, 2010 (Figure 2). The gross average number of permitted Ohio Utica wells per month in the last five months is 39 with a total of 195 permitted since November 2012. The quarterly permit average has increased by an order of magnitude of 4.2 permits per month between September 2010 and 2011 to 39 per month since September 2012. In recent months Washington county was added to the list of Ohio counties home to Utica hydraulic fracturing permits, while Carroll remains the state with the most Utica permits followed by Harrison, Columbiana, Guernsey, and Jefferson/Noble with the average number of Utica well permits across the 22 counties home to at least one permit being 28 per county with six counties above and sixteen below this mean (Figure 3). In the last year the four counties that have entered the Utica conversation are Trumbull, neighboring Holmes and Wayne, and Washington, with 4, 3, 1, and 1 Utica permit as of April 1st, respectively. Meanwhile five other counties have seen no increase in Utica permits including Muskingum, Knox, Ashland, Geauga, and Medina. Conversely Belmont County has seen a 21-fold increase in Utica well permits followed distantly by Harrison, Guernsey, Noble, and Coshocton counties all of which have experienced ≥5-fold increases.
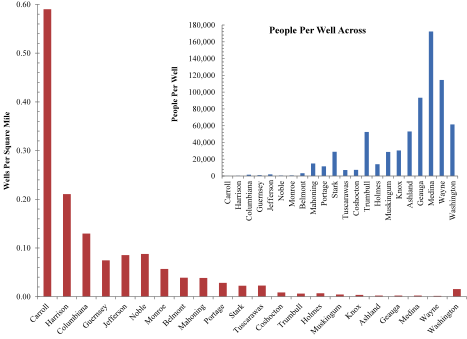
The average number of people per Utica well across the aforementioned 22 counties is 31,808, while the average number of wells per square mile is 0.066. The range is quite broad for both variables ranging from 0.0018 wells per square mile in Wayne – home to the Wayne National Forest – to 0.59 wells per square mile in Carroll County, with the one recent Washington County well placing it 13th out of 22 counties. The inverse is the case for people per well with Medina County, home to the highest number of people relative to Utica well permits with 172,332 people per well (vs. 124-563 people per well in Carroll, Harrison, Noble, and Monroe counties). Since last we conducted this type of analysis in late January the valuation of Ohio’s major Utica players has actually increased by 11.7%. This is a particularly complex situation considering that Atlas Noble the owner of 6 Utica wells has actually gone private for a variety of reasons and Chesapeake Energy has ousted its CEO Aubrey McClendon due to “philosophical differences and a pending SEC investigation. Meanwhile, Wall Street-types:
… expect well results to vary greatly, given 2012 drilling activity across many fringe areas of the play. We believe weak results from other operators are likely to validate that Gulfport remains the most exposed operator. Source
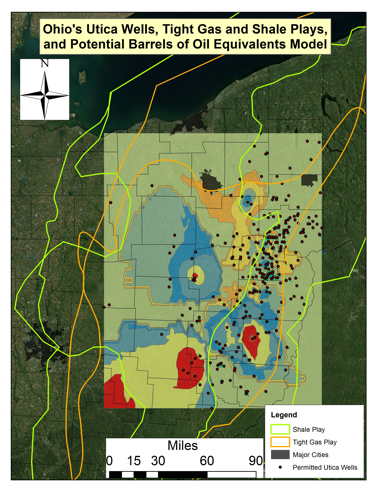
Additionally, the repeated delay in 2012 production numbers scheduled for the 1st of April is creating layer upon layer of uncertainty leaving everyone guessing and relying on 2011 production numbers. This leaves public sentiment worried about the unsustainability, uncoordinated, and unbalanced nature of both Ohio’s regulatory framework and highly Utica exposed and/or leveraged balance sheets. Meanwhile Wall Street analysts are contemplating whether market forces, expectations, reality, or collusion is to blame. Our current model of potential Utica production in the form of barrels of oil equivalent speaks to small and discrete highly productive zones in Belmont, Noble, Guernsey, Morgan, and Muskingum counties, rather than the originally estimated zones of highest production in Carroll and Columbiana. An additional hotspot appears to be located in Fairfield, Perry, and Hocking counties. However, due to insufficient data quantity, quality, and methodology, and transparency from ODNR and industry, the opportunities to conduct such exercises are still accompanied by substantial uncertainty in the form of high signal-to-noise resulting from scant and unreliable data. The hope, herein and on Wall Street, is that ODNR and industry will begin to make their production data available in real-time.
This is an especially important consideration given that the aforementioned regulatory environment here in Ohio – as well as the relatively generous severance taxing system[1] – has reached a point that even industry/supply-side think tanks like The Fraser Institute in Canada have determined “the extent of investment barriers (based on All-Inclusive Composite Index values)” are as good as they are ever going to get; Ohio trails only Mississippi in a global investment barrier ranking of 146 countries, US states, and Canadian provinces. Furthermore, in one year the conditions for doing largely hydrocarbon-related business in Ohio improved so much between 2010 and 2011 that Ohio jumped up the league tables from 12th to 2nd, according to the institute’s 2011 “Global Petroleum Survey.” This loosening of regulations, combined with decreasing data quality and availability, is the primary concern of The FracTracker Alliance in Ohio.
Figure 1: Utica Permit activity by status to April 1, 2013
Figure 2. Cumulative and Per Month Utica Permits to September 2010 through March 2013
Figure 3. Utica Permit Count by County from September 28, 2010 to April 1, 2013
Figure 4. Utica Permits Per Square Mile and People Per Well by County from September 28, 2010 to April 1, 2013
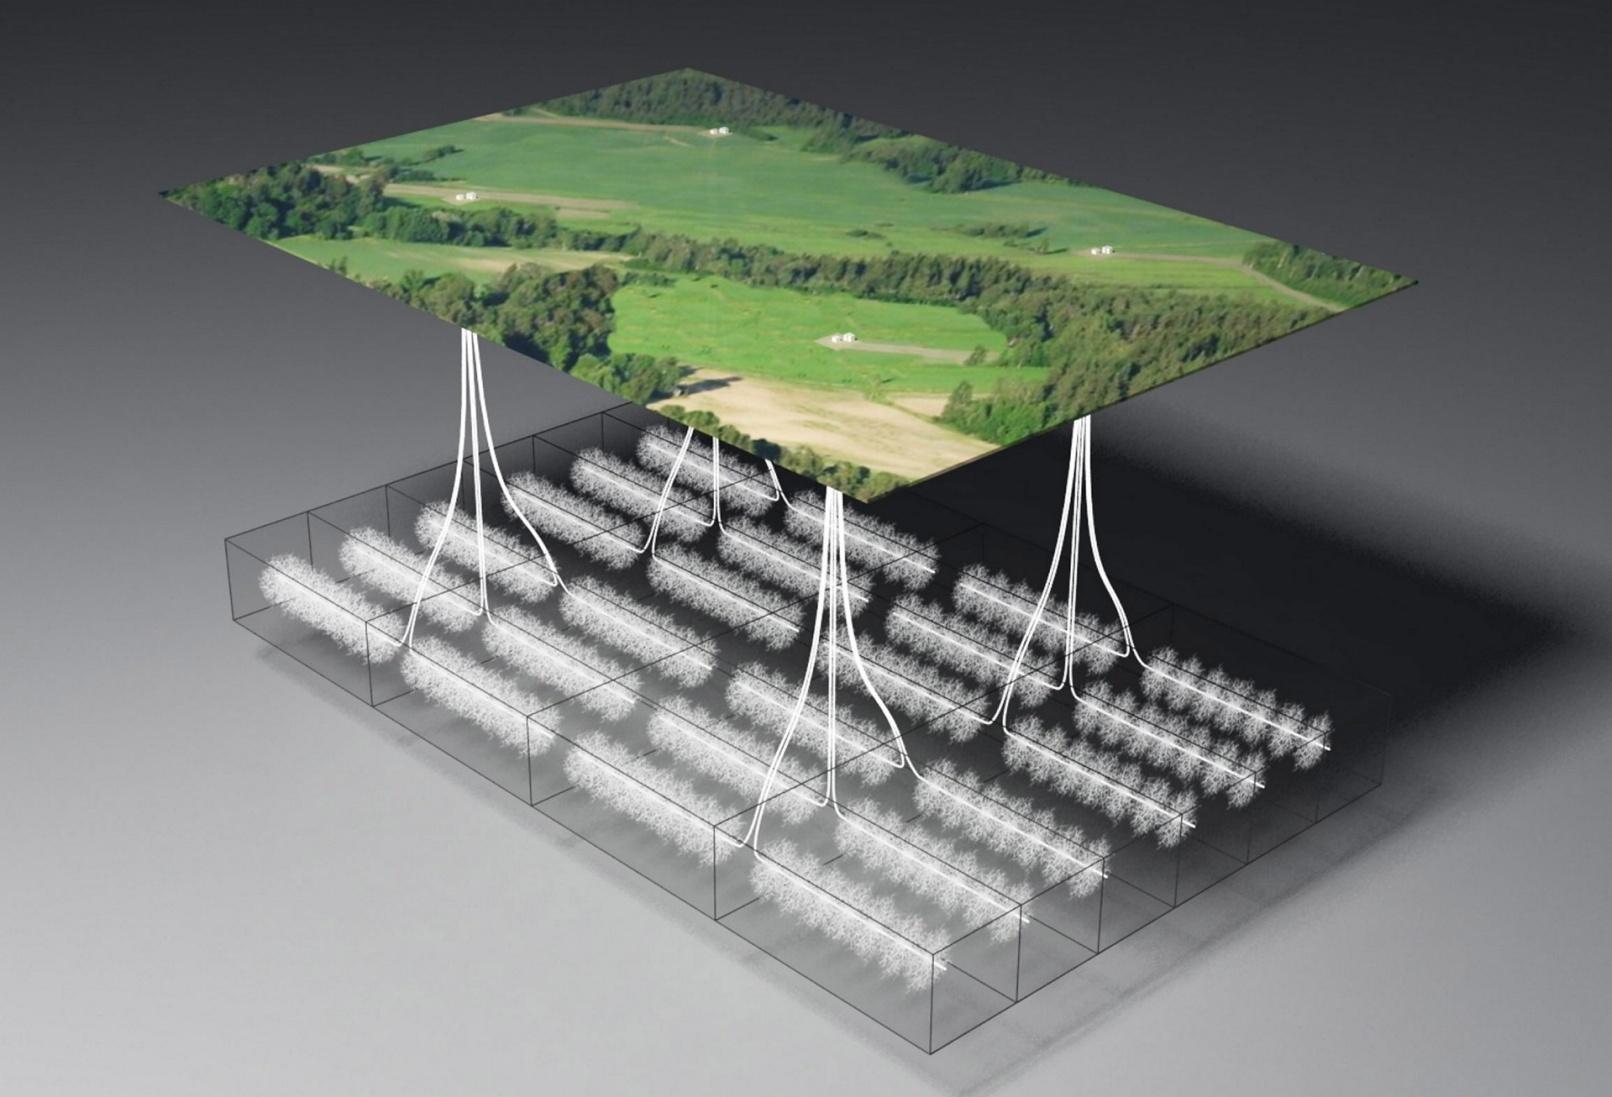
Figure 5. A map of the current Ohio Shale and Tight Gas Plays, hydraulic fracturing permits in Ohio as of 4/1/2013, and a generalized model of potential production from with light green representing 20 Barrels of Oil Equivalent (BOE) and red approximately 10,000 BOE
Table 1. Distribution of Ohio Utica Shale wells across companies (#, %), Date of First Permit (DFP), and the valuation of the publicly funded companies at their DFP at the close of business 4/9/2013.
Company Valuation
Company
#
%
DFP†
Share Price DFP
Share Price 4/9/2013
% Change
Anadarko•
12
0.019
09/07/2011
69.88
86.70
1.241
Antero
21
0.034
03/23/2012
Atlas Noble††
6
0.010
09/24/2012
31.14
Carrizo
2
0.003
07/26/2012
24.02
26.26
1.093
Chesapeake Energy•
389
0.626
12/23/2010
25.61
19.99
0.781
Chevron Appalachia
2
0.003
07/31/2012
109.58
118.71
1.083
Consol Energy•
25
0.040
06/17/2011
45.86
33.85
0.738
Devon Energy
13
0.021
11/02/2011
65.46
55.28
0.844
Eclipse Resources
1
0.002
12/21/2012
—
—
Enervest•
16
0.026
06/30/2011
9.37
8.79
0.938
EQT
3
0.005
09/13/2012
57.76
69.59
1.205
Gulfport Energy•
46
0.074
02/28/2012
35.49
48.09
1.355
Halcon
2
0.003
11/02/2012
5.003
7.69
1.537
Hall Drilling
1
0.002
09/17/2012
Hess Ohio
24
0.039
09/28/2010
53.63
73.50
1.371
HG Energy
16
0.026
09/14/2011
—
—
—
Hilcorp Energy
3
0.005
12/14/2012
—
—
—
Mountaineer Keystone
7
0.011
07/13/2012
—
—
—
PDC Energy•
9
0.014
05/25/2012
25.67
47.59
1.854
R E Gas Development•
13
0.021
03/19/2012
—
—
—
Sierra Resources
3
0.005
07/02/2012
—
—
—
SWEPI
1
0.002
06/20/2012
—
—
—
XTO Energy
5
0.008
04/09/2012
0.28
0.01
0.036
BP
1
0.002
03/20/2013
613
1.083
† DFP = Date of First Permit; “—“ not a publicly traded company
†† Atlas Noble has since gone private
• Corporations that have reported production numbers as of this post: 1) Anadarko – 3, 2) Chesapeake – 14, 3) Consol Energy – 1, 4) Enervest and PDC Energy – 2, 5) Gulfport – 10, R E Gas Development – 4.
[1] Ernst & Young in a 2011 report found that Ohio’s hydrocarbon taxing rates were the most favorable of the eight states they investigated with a total state and local tax of 1.8% vs. 10.9-11.0% in neighboring West Virginia and Oklahoma, respectively. The average across the seven other states was 9.2% or 5.12 times that of The Buckeye State.
https://www.fractracker.org/a5ej20sjfwe/wp-content/uploads/2025/09/2025-Wordmark-Logo.png00Ted Auch, PhDhttps://www.fractracker.org/a5ej20sjfwe/wp-content/uploads/2025/09/2025-Wordmark-Logo.pngTed Auch, PhD2013-04-23 16:19:202020-07-21 10:40:57A Year in the Life of Ohio’s Utica Play
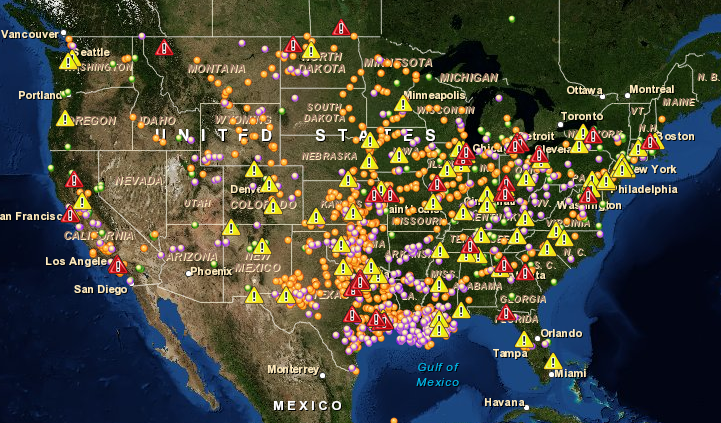
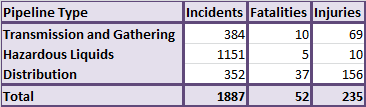
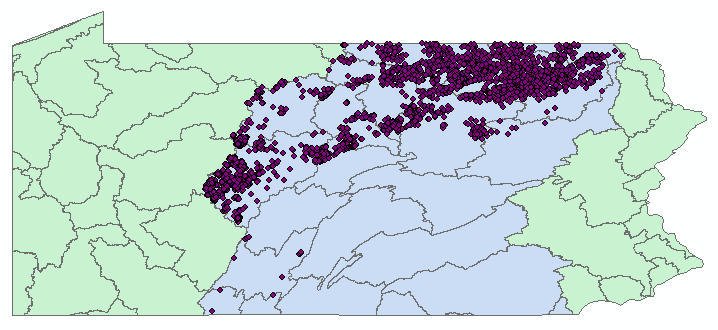
Recently, there has been a lot of attention focused on the Mayflower, Arkansas pipeline failure that resulted in a massive oil spill, particularly as it comes at a time when discussions of the controversial Keystone XL Pipeline project are once again heating up. However, the situation is far from unusual. In fact, according to data downloaded from the Pipeline and Hazardous Materials Safety Administration (PHMSA), there were 1,887 incidents in the nation’s gathering and transmission, distribution, and hazardous liquids pipelines between January 1, 2010 and March 29, 2013, or an average of 1.6 incidents per day.
Pipeline incidents from 1/1/2010 through 3/29/2013. Data Source: PHMSA.
Obviously, not all of these failures are on par with the massive spill in Mayflower, and it should be noted that there are a variety of reasons for these lines to fail. Some of these reasons, such as excavation activity in the vicinity of a pipeline, are not necessarily the fault of the pipeline’s operator. The fact that these incidents are commonplace, however, is not one that can be dismissed.
Pipeline incidents in the United States from 1/1/2010 through 3/29/2013. Source: PHMSA. Red Triangles represent incidents leading to fatalities, and yellow triangles represent those leading to injuries. To access the legend and other controls, click the “Fullscreen” icon at the top-right corner of the map.
It is clear from the map that there a few data entry errors, as a few of the data points draw in locations that aren’t even in the jurisdiction of the United States. However, each entry also contains a city and state that the incident is associated with, and for the most part, the data seem to be fairly reliable.
https://www.fractracker.org/a5ej20sjfwe/wp-content/uploads/2013/04/pipeline_incidents.png502721Matt Kelso, BAhttps://www.fractracker.org/a5ej20sjfwe/wp-content/uploads/2025/09/2025-Wordmark-Logo.pngMatt Kelso, BA2013-04-15 08:38:052020-07-21 10:40:57US Pipelines Incidents Are a Daily Occurrence
Love him or hate him, there’s no arguing that Stephen Colbert can grab a headline. Recently he’s had a lot to say about environmental protection, energy and water. Last week he reported on the Pegasus Pipeline Spill in Arkansas and reminded us that what’s “out of sight” and “out of mind” might still be in our drinking water. Those of us in Pennsylvania familiar with Talisman Terry have yet to forget his exposé on the children’s coloring book that attempts to teach kids about hydraulic fracturing through the expertise of a friendly Frackasaurus. This leaves me wondering if Colbert might ask Congressman Matt Cartwright about his legislative attempts to apply stricter federal protections to oil and gas development when the Pennsylvania Congressman appears on Stephen’s “Better Know a District” segment in early May.
In March 2013, Congressman Cartwright (PA-17) introduced the “Focused Reduction of Effluence and Stormwater runoff through Hydrofracking Environmental Regulation Act” or FRESHER act. Because of expanding development of oil and gas wells in Pennsylvania and exploration, construction, and operations in almost 30 other states, Mr. Cartwright introduced legislation aimed at fixing a federal Clean Water Act loophole to control stormwater runoff from for oil and gas operations. Under the Clean Water Act, industrial facilities are required to obtain a permit to discharge stormwater from their sites and develop “Stormwater Pollution Prevention Plans” if disturbing more than one acre of land. However, Congress exempted oil and gas operations from both of these requirements. By closing the loophole, the FRESHER Act would provide for stronger oversight as both regulators and the public would be aware of industry plans to control pollution. The bill would also require a federal study of stormwater impacts in areas that might be contaminated by stormwater runoff pollution from oil and gas operations.
Chesapeake Bay Watershed
Many of us working in the Chesapeake Bay watershed are often asked about the impacts that increasing natural gas activity may have on our local waters and the larger Chesapeake Bay cleanup. Considering the ongoing challenges we have with sediment impacts to our local waterways in Pennsylvania and West Virginia and the pollution limits we now have in place to bring the Bay back to health, many are asking how we quantify these impacts. In addition to increased sediment pollution largely carried by stormwater runoff, others are also asking what impact a change in our land use might have as we convert farm fields and forests to well pads. Furthermore, many are asking about roads and pipelines and cumulative impacts. All good questions – and these are just related to natural gas development and its relationship to existing pollution limits and cleanup plans. There are a host of additional questions being asked about drinking water, emissions, groundwater contamination, methane migration, and health and safety.
To get an idea of the impacts of the oil and gas industry in the Chesapeake Bay watershed, we turned to our colleagues at the FracTracker Alliance. FracTracker is committed to working with partners – citizens, organizations, and institutions – in a quest for objective, helpful information to perpetuate awareness and support actions that protect public health, the environment, and socioeconomic well-being. FracTracker collects, interprets and shares data through a website and mapping tool. When it came time to understand impacts, we asked for and received some numbers.
In the portion of Pennsylvania that has waterways draining to the Chesapeake Bay, there have been 5,137 oil and gas wells drilled since 2005*. This number includes both conventional and unconventional wells and vertical and horizontal wells (see map on right). Pennsylvania defines an “unconventional well” as one that is drilled into an unconventional formation, which is defined as a geologic shale formation between the base of the Elk Sandstone or its geologic equivalent where natural gas generally cannot be produced except by horizontal or vertical well bores stimulated by hydraulic fracturing. In short, the definition does include wells drilled within the Marcellus Shale formation. We are continuing to work with FracTracker to obtain similar information on West Virginia.
In Practice
I don’t want to leave the impression that oil and gas development, specifically gas development because of hydraulic fracturing, is an unregulated industry. For example, Pennsylvania already requires erosion & sediment permits for activities involving earth disturbance activities over five acres. I’m also not attempting to get into the patchwork of state-by-state regulations of the oil and gas industry, but Congressman Cartwright’s legislation would ensure that oil and gas companies have stormwater-related permits and pollution prevention plans in place prior to well pad development. The lack of oversight and permitting represents a significant threat to our waterways in places without adequate accountability mechanisms. It’s a fresh opportunity to address an ongoing challenge. We hope Mr. Colbert might just ask Mr. Cartwright about his efforts as we get to know PA’s 17th district. We think he might just say the FRESHER Act is good for his Congressional district and the region.
Jenny Lisak, co-director of the Pennsylvania Alliance for Clean Water and Air, maintains a list of people claiming to be harmed by hydraulic fracturing or related processes, called the List of the Harmed. This version of the list, last updated on February 23, 2013, has 822 people thought to be negatively impacted by the industry, with symptoms ranging from headaches and rashes to death.
The List of the Harmed is maintained by the Pennsylvania Alliance for Clean Water and Air. For full access to map controls, click the “Fullscreen” icon at the top right corner of the map.
The FracTracker Alliance was not involved in the creation or maintenance of this list, but our intern Stephen Paddock did map the incidents to the best available level of accuracy, whether that was at the municipal, county, or state level. Please do not assume that the locations on the map are any more accurate than the level indicated in the “Accuracy” column.
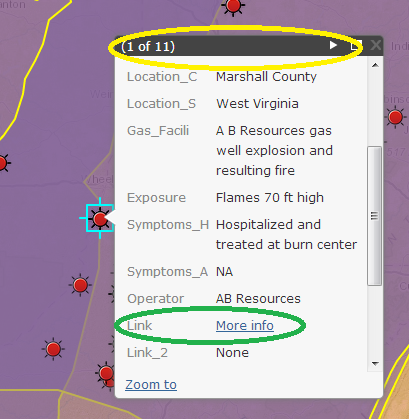
Popup box containing the data for one of the 878 entries on the List. The yellow oval shows that there are multiple boxes stacked on top of each other, and the green oval provides a hyperlink to more information about the incident in question.
Each entry on the List of the Harmed has at least one link to more information about the given incident. To access those, click on any map icon to bring up the popup box. Then scroll down to the “Link” section, and click on “More info”. If there are multiple sources, they will appear under “Link_2” or “Link_3”.
In the picture above, the text “(1 of 11)” in the yellow oval tells us that there are eleven popup boxes stacked on top on one another. To sort through the records, simply click the arrow button toward the right edge of the yellow oval.
https://www.fractracker.org/a5ej20sjfwe/wp-content/uploads/2013/03/harmed-2.png419409Matt Kelso, BAhttps://www.fractracker.org/a5ej20sjfwe/wp-content/uploads/2025/09/2025-Wordmark-Logo.pngMatt Kelso, BA2013-03-07 13:29:342020-07-21 10:40:56PACWA’s List of the Harmed Now Mapped by FracTracker
The Pennsylvania Department of Environmental Protection (DEP) recently published its biannual reports for production and waste from unconventional wells throughout the state for the last half of 2012. FracTracker has learned the hard way not to be too eager in analyzing this data. In the previous cycle, this data was released without the contribution several operators, one of which happened to be the biggest player in the state, Chesapeake Appalachia. That incident prompted the inclusion of a data disclaimer from DEP, which includes the following text:
The Oil and Gas Act reporting is a self-reporting system, meaning that data is reported from producers to DEP as required by law. All production data is posted as it was received from the unconventional well operators. DEP does not independently verify the data before it is posted.
While the Oil and Gas Act requires accurate and on-time data reporting by producers, and the producers and DEP endeavor to correct any errors discovered after the data is posted, DEP makes no claims, promises or guarantees regarding the accuracy, completeness or timeliness of the operators’ data that DEP is required to post.
While considering content regarding production and waste in Pennsylvania, it is worth noting that the DEP considers the data to belong to the various operators. All data for this post was downloaded on February 25, 2013, and while it seems reasonably complete, it is important to note that there could be operators which have not posted their data to DEP in a timely fashion.
PA Production and Waste From Unconventional Wells: July 2012 to December 2012. Click on any map icon for more information, or click the “Fullscreen” button at the top right of the map to access more toolbars. To access data for individual wells, viewers must zoom in to 1:750,000, or an area equivalent to several counties.
The default map frame includes most of the activity for unconventional oil and gas production and waste from Pennsylvania, but if you zoom out, you can find a landfill in southwestern Idaho that accepted 11 tons of flowback fracturing sand for disposal. Unfortunately, the available data does not give any indication of why an operator might choose to ship waste over 2,000 miles away from its source.
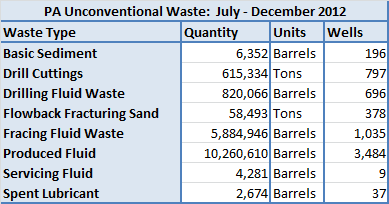
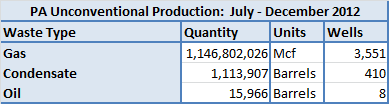
Below are the six month statewide production and waste totals for Pennsylvania’s unconventional wells, including the number of wells that contributed to each total:
Production from unconventional wells in Pennsylvania from July to December 2012. Mcf represents 1,000 cubic feet, and barrels measure 42 US gallons.
The total gas produced was over 1.1 trillion cubic feet (Tcf) for the six month period, which was over 250 billion cubic feet (Bcf) higher than the previous total of 895 Bcf.
Waste produced by unconventional wells in Pennsylvania from June to December 2012.
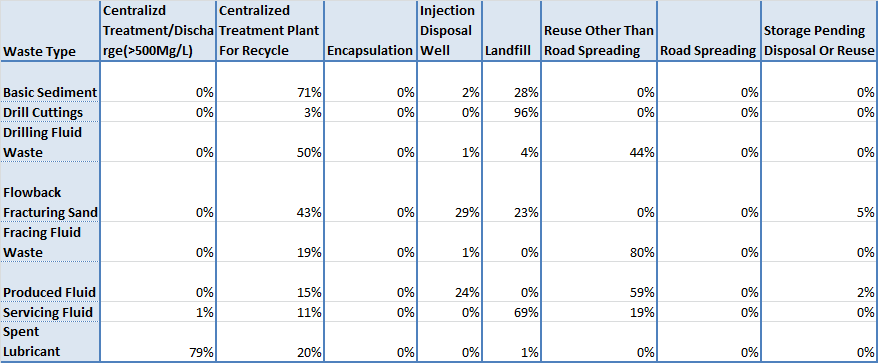
And here is a look at the disposal method for each type of waste, in terms of percentage:
Disposal methods of Pennsylvania unconventional oil and gas waste products, in terms of percentage of the waste type. July – December 2012.
Note that while road spreading rounds down to 0%, 425 barrels of produced fluid were used in this effort.
https://www.fractracker.org/a5ej20sjfwe/wp-content/uploads/2013/03/waste_2012b.png204389Matt Kelso, BAhttps://www.fractracker.org/a5ej20sjfwe/wp-content/uploads/2025/09/2025-Wordmark-Logo.pngMatt Kelso, BA2013-03-01 15:42:032020-07-21 10:40:56Six Months of Production and Waste From PA’s Unconventional Wells
By Ted Auch, PhD – OH Program Coordinator, FracTracker Alliance
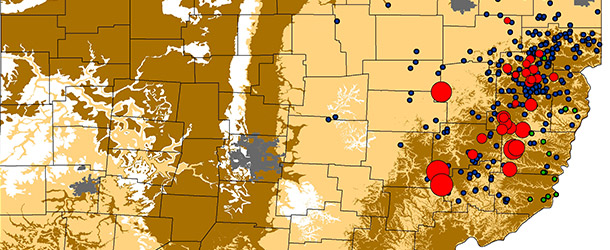
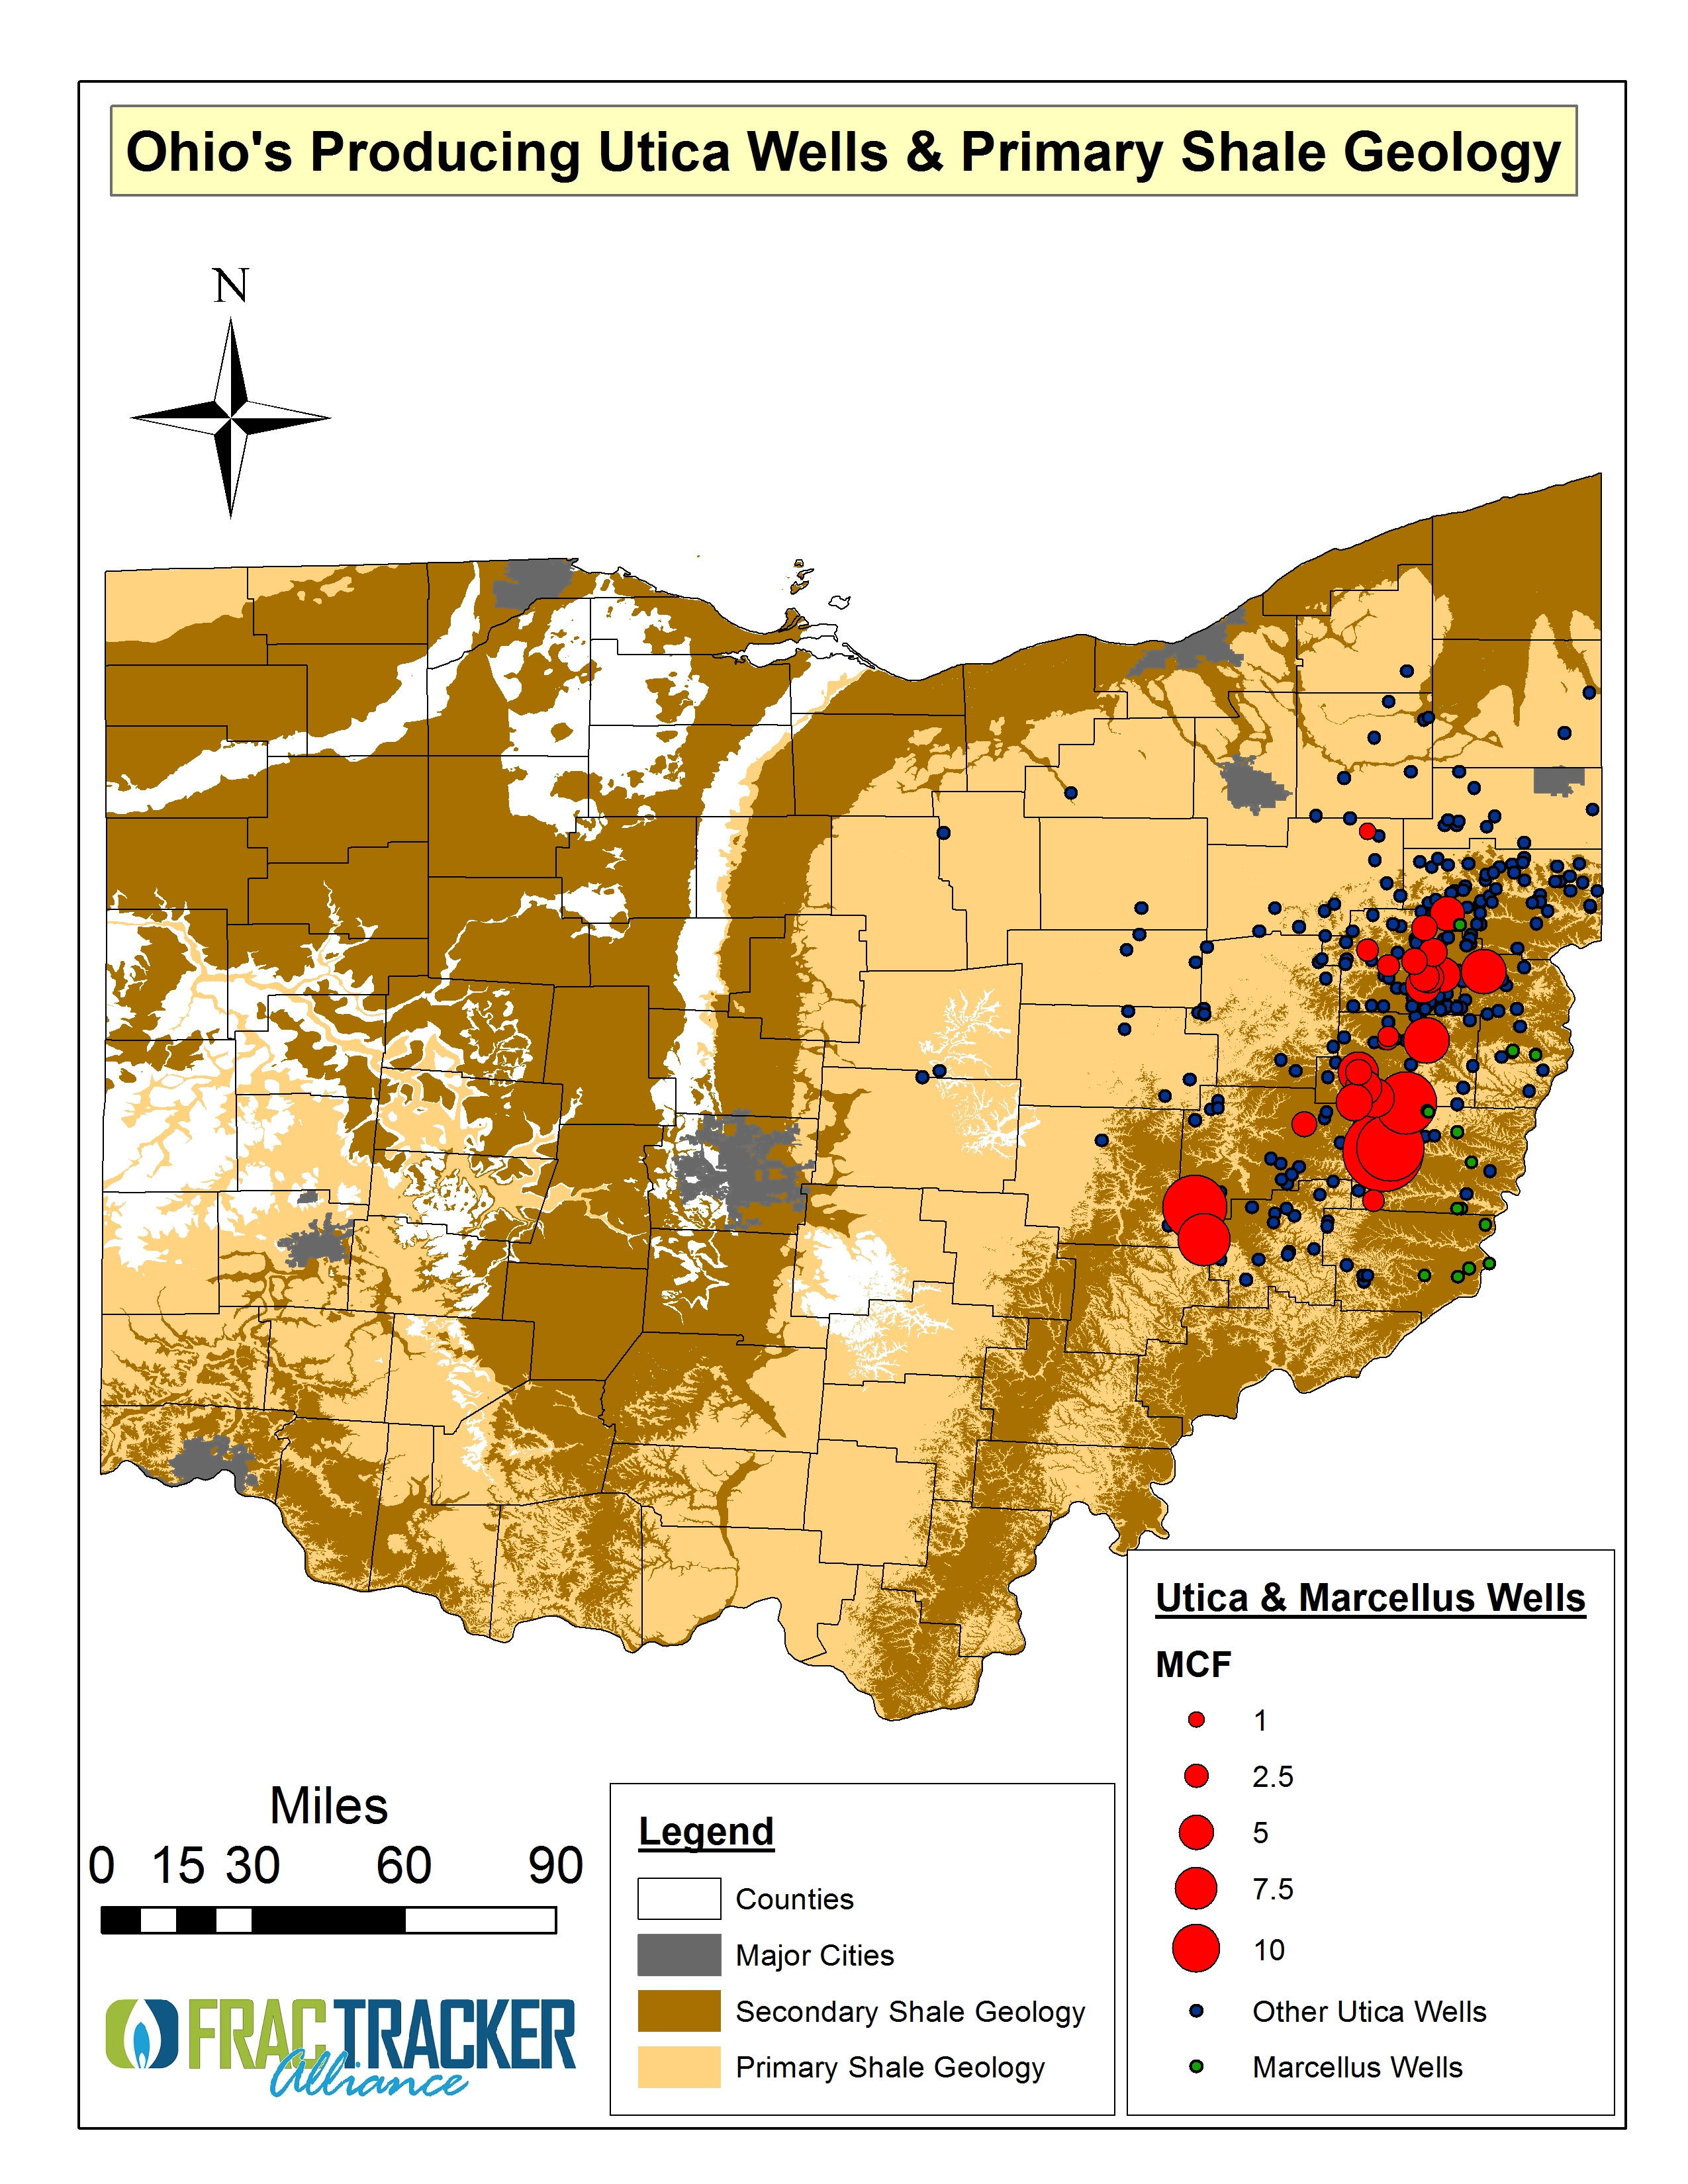
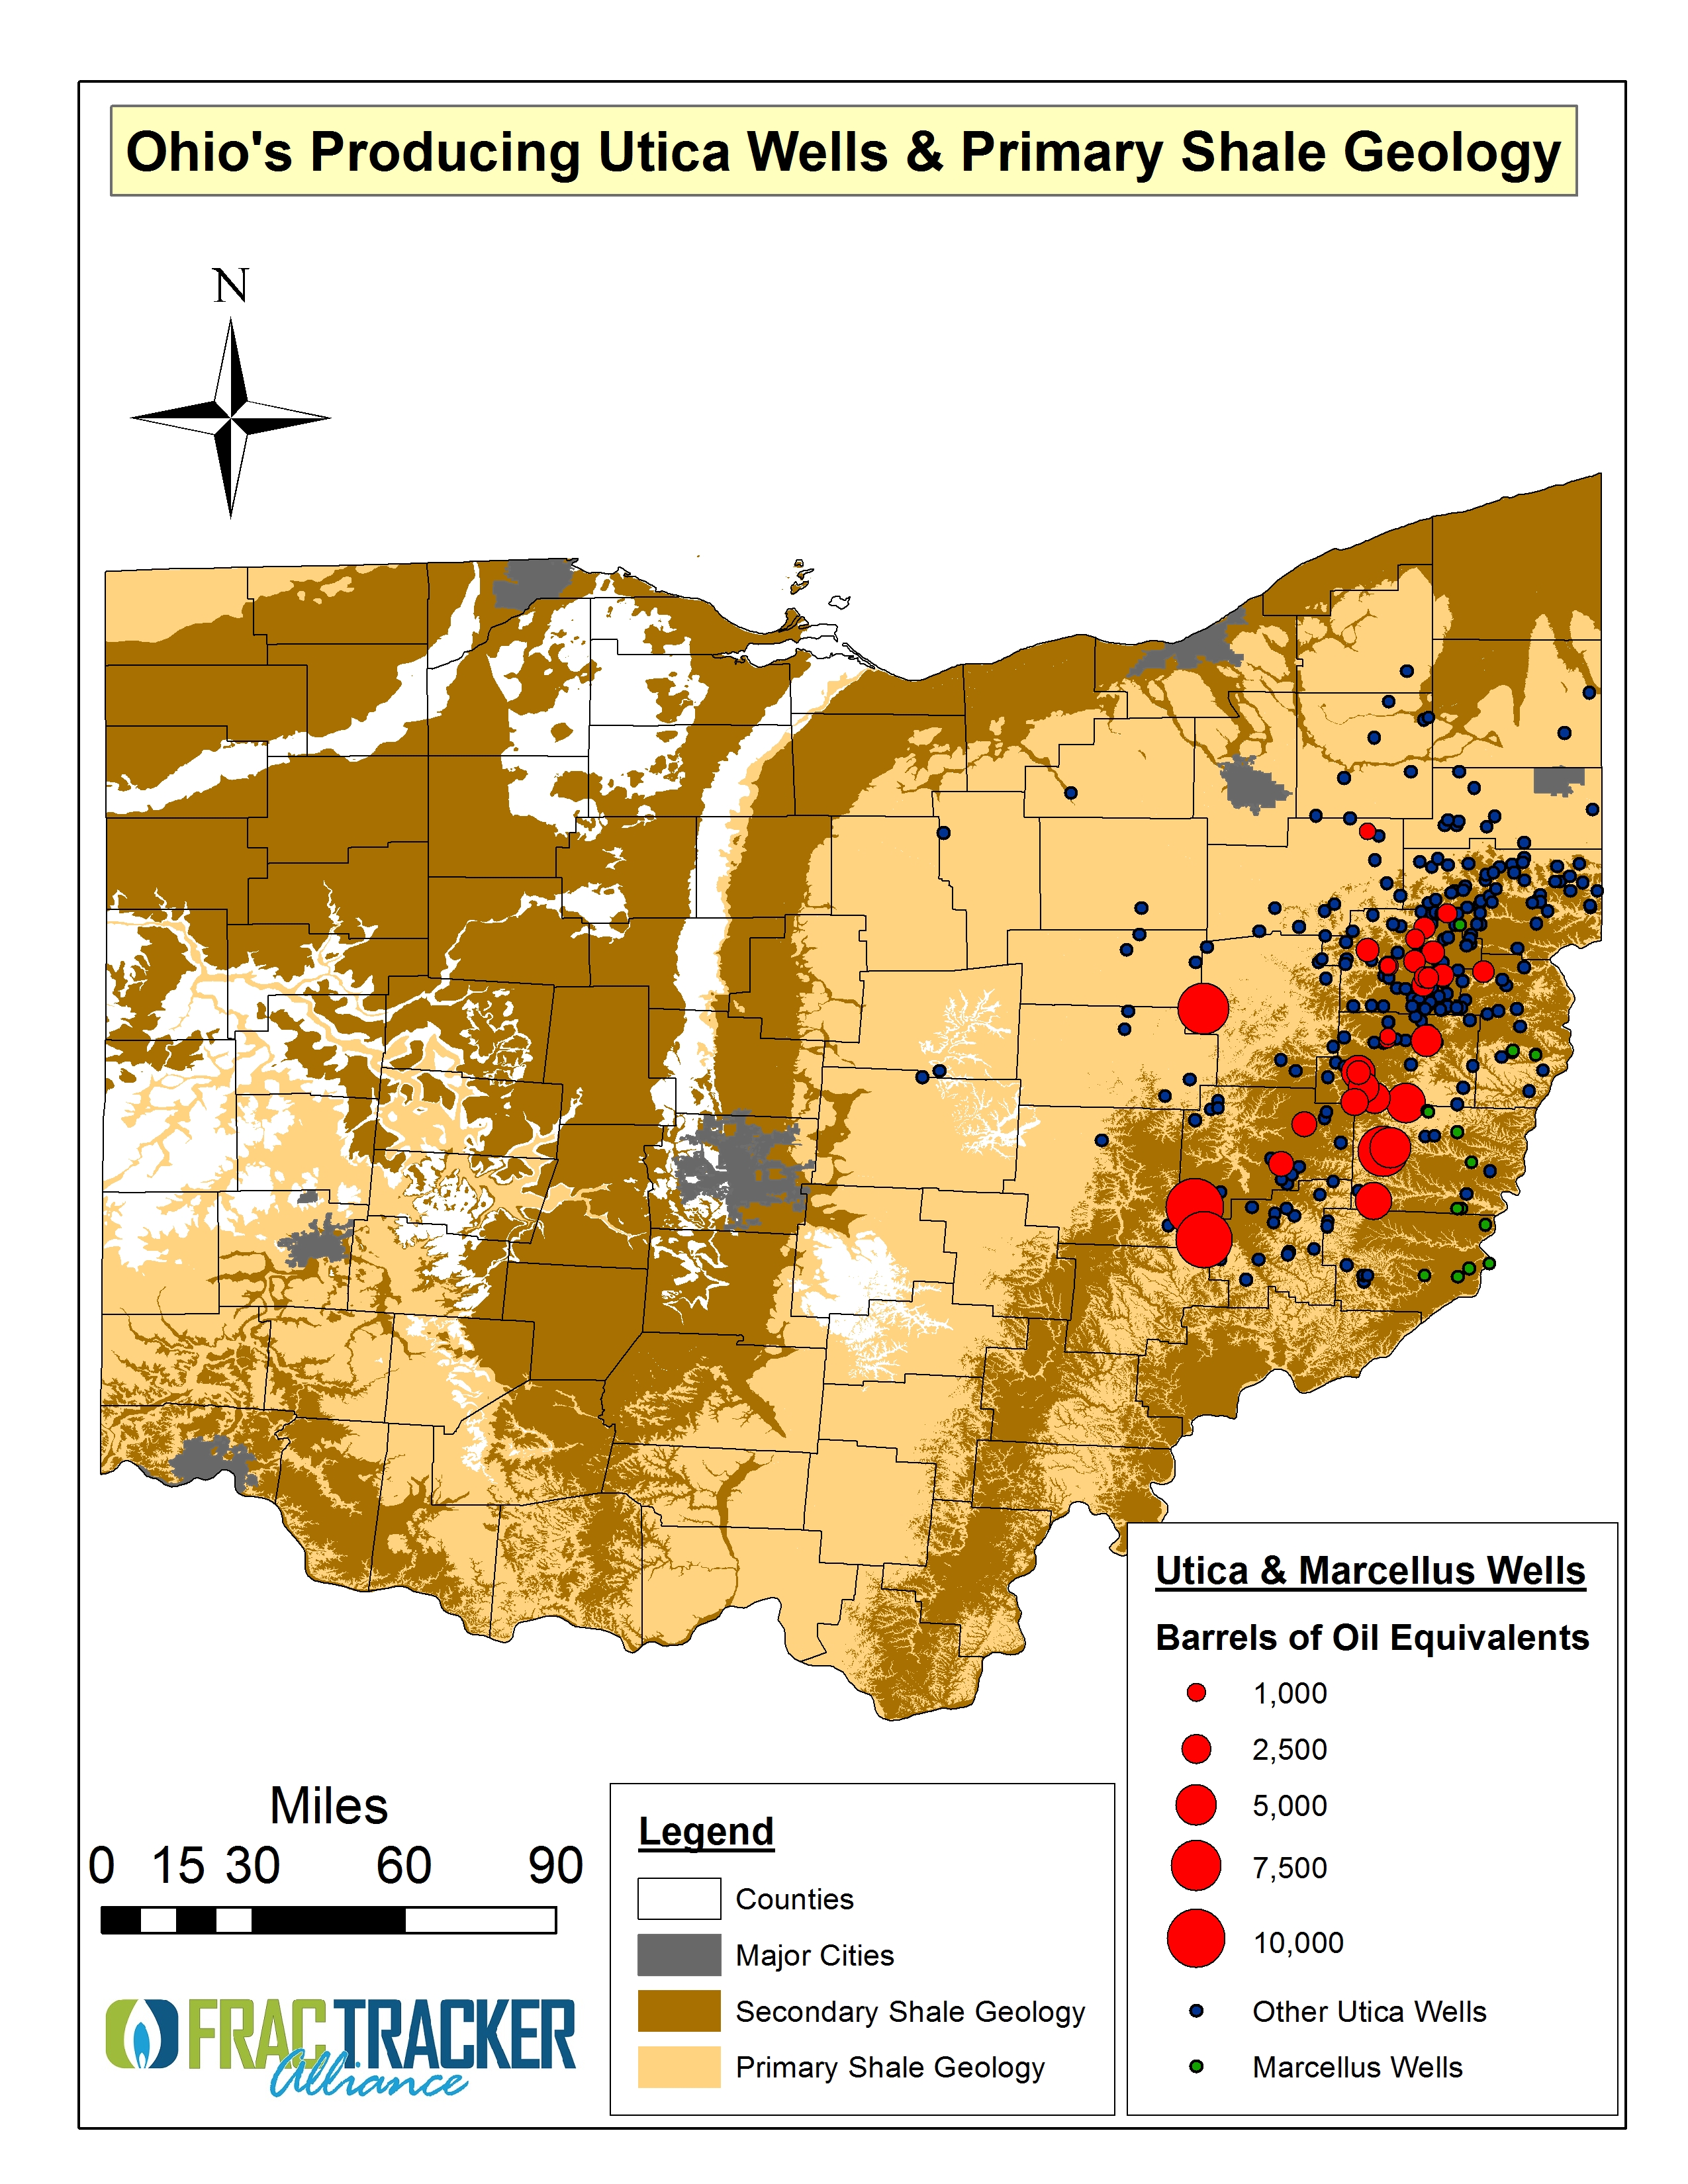
Figure 1. Ohio’s Producing Utica Wells & Primary Shale Geology – plus non-reporting, drilled, or producing Utica & Marcellus Wells. “Million Cubic Feet” (MCF) as measured over industry standard test periods. “Barrels of Oil Equivalents” (BOE) as measured over industry standard test periods.
The economic opportunities provided by Ohio’s Utica Shale play via hydraulic fracturing have been cited repeatedly by the Ohio Oil and Gas Association and industry think-tanks like IHS Inc [1]. Numbers published by the latter last October [2] predicted 143,000 Ohio jobs and $18 billion in state revenue by 2020. However, these projections are accompanied by substantial amounts of error. Given that the state’s Utica Shale well movement is now more than 500 wells permitted strong, we thought it was time to take a closer look at the demographics and economics of the Utica Play, given that there will be a strong geographic component being inserted into the “To Drill Or Not To Drill” and waste disposal debate here in Ohio. This is an especially important issue given that the state is wrestling with either implementing an ad valorem[3] tax or raising the state’s industry-low severance taxes, which currently stands at 0.5-0.8% but would be raised to 1% under the governor’s budget. In contrast, proposals from Policy Matters Ohio and northeast Ohio Democrats seek 5% – 7%, respectively.
In comparison to most other states producing oil and gas, even 5% may be a trivial amount, or what The Cleveland Plain Dealer called “indefensibly low.” It amounts to 97 cents per Ohioan (i.e., $275 mi2) [4]. According to an Ernst & Young analysis of eight states that produce dry gas and natural gas liquids and/or dry gas and oil…
Ohio currently imposes the lowest combined state and local taxes of the states included in the analysis.
…Ohio’s overall effective tax rate (measured as total taxes divided by sales) is 80% below the average rate for the other 7 states for a well producing dry natural gas and natural gas liquids.
For a well producing dry natural gas and oil, Ohio’s effective tax rate is 65% below the other-state average…
With the [proposed] increase, Ohio’s effective severance tax rate (ETR) would be 16% lower than the other states’ average for the well producing dry natural gas liquids and 4% lower than the other states’ average for the well producing dry natural gas and oil.
The governor’s proposed “Severance Tax Changes” will not apply to any Marcellus Shale wells, even though the state is home to five producing Marcellus wells (two in Monroe County) and eight permitted wells across Belmont and Monroe Counties. Additionally, the governor and his staff included a severance tax exemption for all “small-volume gas wells” (gas wells with average daily production of under 10 million cubic feet [MCF] would be exempt from the tax). If early industry production reports – and the Ohio Business Roundtable requested Ernst & Young report – are any indication, only 19% of wells will be subject to this tax. Our own analysis revealed that of the 32 industry reported production wells, the average production value is 7.5 MCF (Figure 1).The Kasich administration admitted the exemptions would apply to – by their estimation – 45,000 gas wells.
Another nuance of the Kasich administration’s severance tax complicated mélange is that rates will be 1% for natural gas and 4% for oil, natural gas liquids, and condensate. However, according to the administration:
… there will be a lower tax rate of 1.5 percent for the first year of production, in order to allow producers to recover the cost of preparing the well site and drilling the well.
Coincidentally, “the first year of production” is generally the time of greatest gas yields. Anonymous sources in Ohio’s Utica sweet spot have spoken of 50% declines in royalties within 6 months of production.
The Ohio Oil and Gas Association, the industry’s lobbying arm, has weighed-in against higher severance taxes, stating that:
a 4% severance tax on oil and gas would be equivalent to a 40% income tax and 16 times more than the commercial activities tax (or CAT). It would also burden economically challenged area throughout the state and landowners who want to lease their land and receive royalty streams.
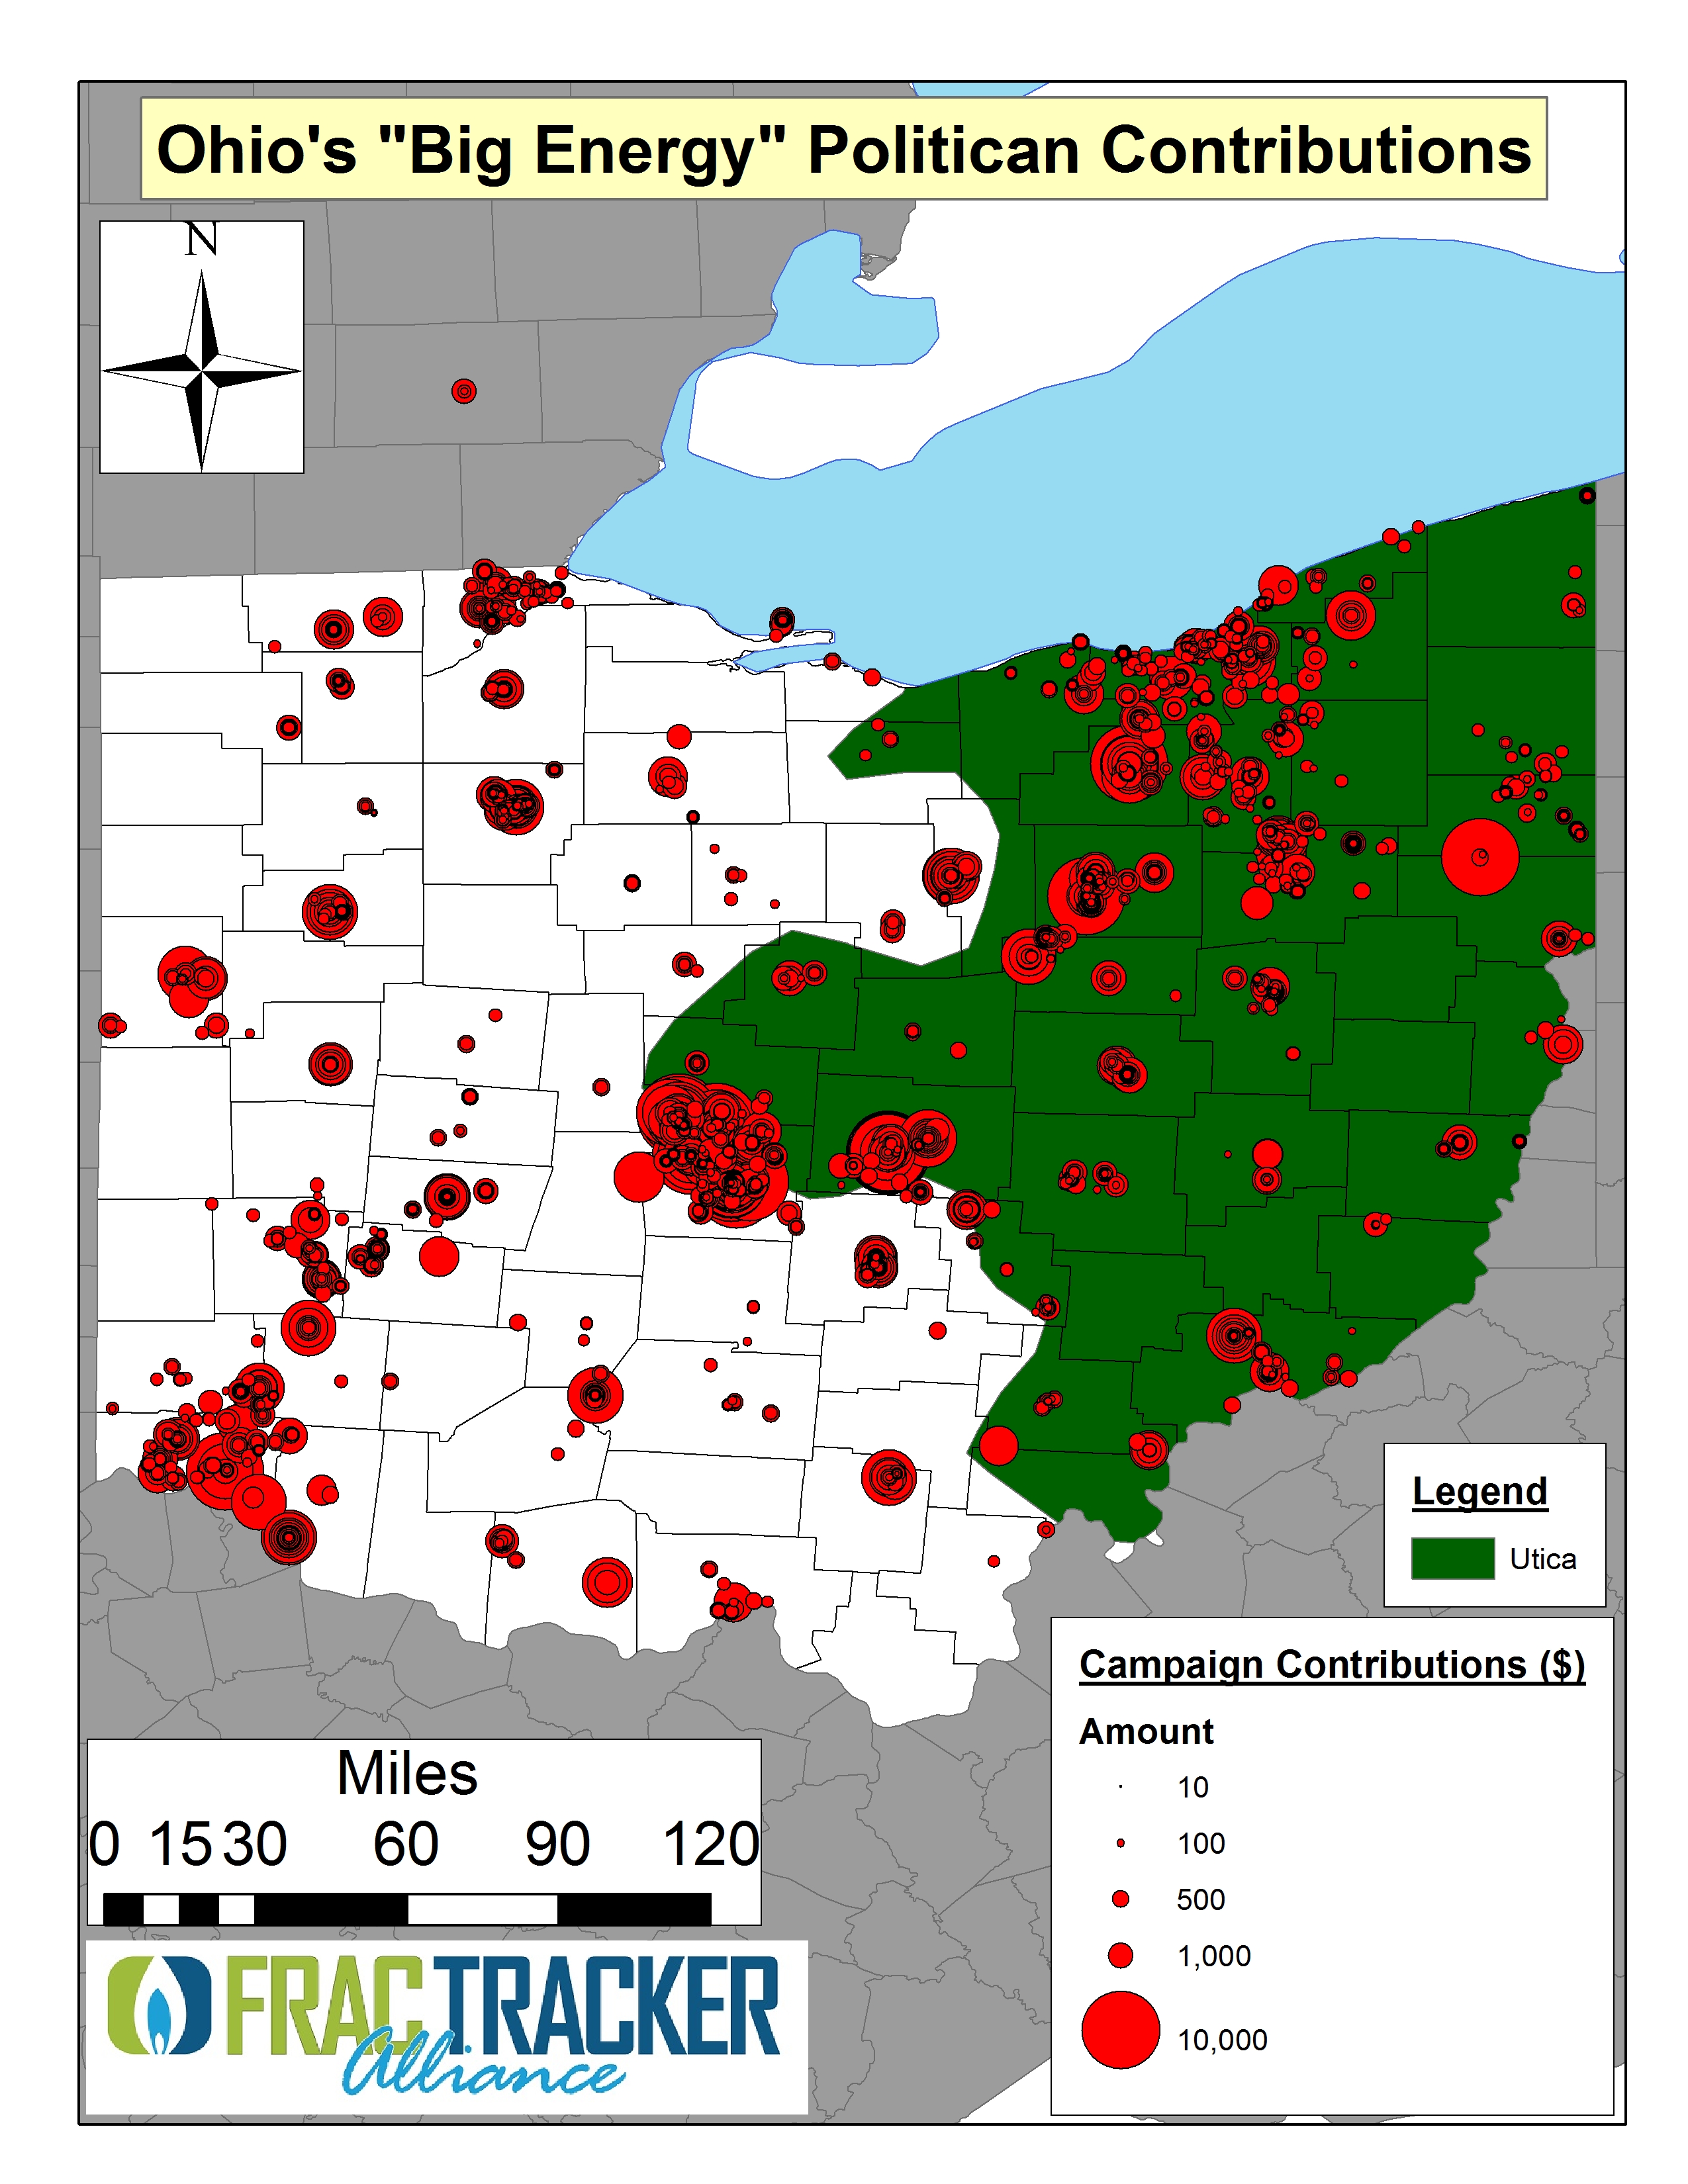
Figure 2. Ohio’s Big Energy individual or Political Action Committee (PAC) political donations from 2001 to 2011. (Total: 4,037 individual donations. Data courtesy of Common Cause Ohio’s Deep Drilling, Deep Pockets spreadsheet.)
The anonymous BizzyBlog took the OOGA position one step further proclaiming that energy companies “won’t do business in a state with a newly-enacted punitive severance tax.”
Whereas an ad valorem tax would be redistributed directly back into the communities from which the hydrocarbons are extracted, a severance tax would be distributed throughout the state, even to communities and counties that prohibit Utica Shale drilling and/or injection activity. Theoretically, the entire state could benefit from the toils and environmental risks taken on by Ohio’s Appalachian region. According to a Quinnipiac pole, Ohioans support (52 to 38%) an increase in drilling-related severance taxes. Bipartisan voter support for a severance tax increases (60 to 32%) when the prospect of offsetting state income taxes is proposed.
Either levy – an ad valorem tax or severance tax – would be based upon the industry’s headline well production, even though USGS research recently spoke to the substantial well-to-well production variability in the Appalachian Shale Basin: 250-600% [5]. There are quite a few short- and long-term costs and benefits associated with exploitation of the Utica Shale; however, as it stands the risk burden is disproportionately being shouldered by Appalachian Ohio. Thus, the severance tax being proposed by the governor and House Democrats could add to the regional schisms evident in the state.
But maybe geography is immaterial. The likely big winner of the tax decisions will be energy companies and, according to data on recent campaign contributions, those politicians they deem worthy of their political donations – many of whom are on the fringes or completely outside the Utica Shale (Figure 2).
[2] This work was funded by the US Chamber of Commerce’s Institute for 21st Century Energy, the American Petroleum Institute, the American Chemistry Council, America’s natural Gas Alliance, and the Natural Gas Supply Association.
[3] Ad valorem taxes are assessed according to the value of the natural gas extracted.
[4] The Kasich “Ohio’s Jobs Budget 2.0: Jobs. Momentum. Transformation” highlights this aspect of their proposed severance tax, explicitly noting that it “has researched the severance tax structures of other states with significant oil and gas production, particularly those states with shale resources, and has found that even with a 4 percent tax rate, the tax burden on the revenues from these horizontal Utica wells will be lower than in other states.”
[5] According to the USGS, production from the most productive wells in the Appalachian Basin’s shale formations is commonly 50 times larger than the poorest producing wells, with the same value being 250-600 times larger for the Marcellus Basin. However, the only numbers presented to individual landowners – but less frequently to collectives given that energy firms are increasingly aware of the legal advice that land aggregators are seeking out – when the subject of royalties comes up are near-term gushers. For example:
GPOR’s “’King’ of Utica Well” the Shugert 1-1H at 4,913 barrels of oil equivalents per day (BOEPD),
CHK’s Buell well in Harrison County, OH producing 1,040 BOE[5],
GPOR’s Boy Scout 1-33H in Wagner, Harrison County producing 3,456 BOE, the Ryser 1-25H producing 2,914, or the Groh 1-12H producing 1,935 BOE,
https://www.fractracker.org/a5ej20sjfwe/wp-content/uploads/2013/02/OHUtica2-25-13.jpg250610Ted Auch, PhDhttps://www.fractracker.org/a5ej20sjfwe/wp-content/uploads/2025/09/2025-Wordmark-Logo.pngTed Auch, PhD2013-02-25 11:48:012020-07-21 10:40:55To Severance Tax or not to Severance Tax, that is the question!
This page was updated in January 2018 to fix the embed code in the map.
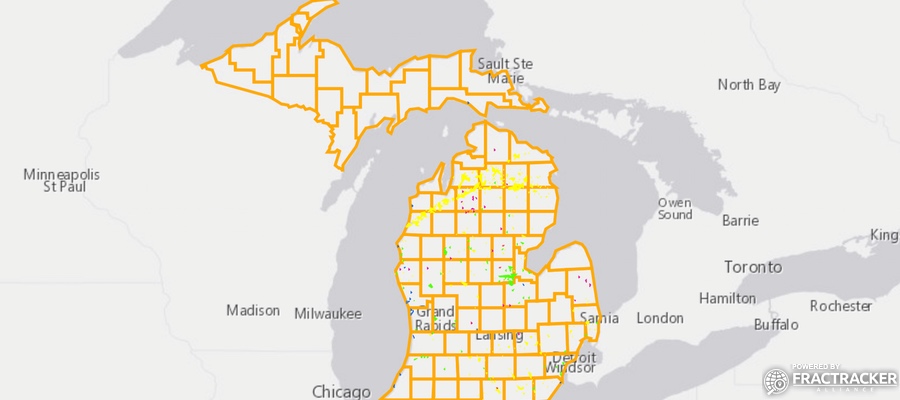
Recently, FracTracker has been getting requests from residents in many locations to map large-scale oil and gas operations in their area. We now have content for Michigan, which happens to correspond with the release of additional map export functionality on FracMapper:
Each state is different in the data it makes available to the public, so it is always interesting to take a look at how new areas approach their duties of data transparency. After having recently produced maps for New Mexico and Colorado, I confess to being excited to work with data from a state that embraces designating locations in latitude and longitude (and doesn’t release data only with the archaic PLSS notation). But then, sometimes mapmakers are easy to please.
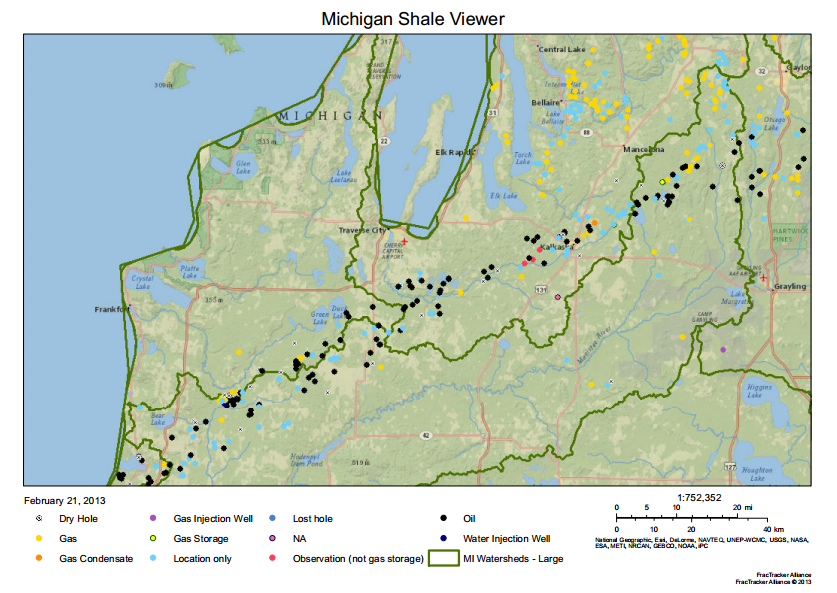
Far more important is the data made available for wells related to oil and gas development by the Michigan Department of Environmental Quality. Not only does it include the standard well type designations of “oil” or “gas”, but it also includes observation wells, storage wells, and injection wells. Altogether, there are 15 categories of well types.
As with many states, there are so many legacy oil and gas wells that mapping them all would overwhelm the online mapping software servers with data requests from over 63,000 wells. For that reason, the wells are restricted to those marked as being horizontally drilled, which reduces that number to 1,562. That should include most of the unconventional oil and gas extraction activity from recent years.
Also included in the data are point locations for the tops and bottoms of the well bore, which could be used in the future to map a generalized path of the horizontal wells beneath the surface.
FracMapper Export Feature Enhancement
The Michigan map is the first one produced with our new “Save as PDF” tool, which can be found in the “Export” toolbar.
The “Save as PDF” tool in the the Export Menu creates as landscape oriented 8.5″ x 11″ document, complete with title, scale bar, and legend. The legend contains only those map icons that are displayed in the view of the PDF.
Please note that if you wish to make multiple PDF files from the same map, it is currently required to refresh the webpage containing the map, or it will continue to produce the same map.
In the coming weeks, this functionality will be added to the other FracMapper entries that have already been published. We are also hoping to roll out additional functionality in the near future.
 Conference attendees heard from a variety of researchers and community activist about their successes and failures, data needs, and expectations for how to leverage the conference gathering into a relatively cohesive and largely ego free movement. One highlight was a presentation and informal discussion with Deborah Rogers, former Merrill Lynch and Smith Barney investment banker,
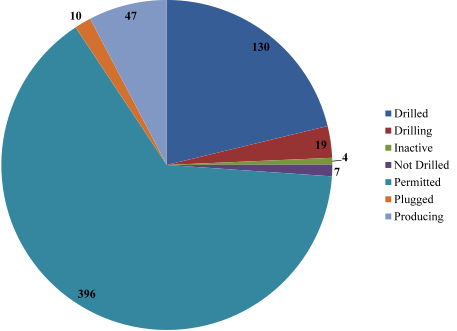