When the US Geologic survey released their assessment of undiscovered oil and gas resources last month, it created some attention in Pennsylvania, as it raised the possibility that oil and gas companies might begin exploring areas in the southeastern portion of the state for the first time ever. The report estimated $2.5 billion worth of gas in the southern portion of the Newark Basin at current prices.
When the legislature placed a moratorium on drilling in the formation until January 1, 2018 as impacts are studied, many observers saw this as fundamentally inconsistent with the spirit of Act 13, passed by the same legislature earlier in the year. While Act 13 established an impact fee for drilling operations and strengthened some environmental regulations, it was controversial due to all but eliminating local input on when and where gas wells and corresponding infrastructure could be built.
To many, the moratorium in southeastern Pennsylvania seems like a double standard, as many in the Commonwealth have advocated for a moratorium in the Marcellus for precisely the same reason–to assess impacts of drilling and related activity–to no avail. Why then did suburban Philadelphia get treated differently from the rest of the state?
The Marcellus Shale, the Newark Basin, and median household income by county in Pennsylvania. Please click the compass rose and double carat (^) to hide those menus. Click the blue “i” tool then any map feature for more information.
This map explores the possibility that this could be an environmental justice issue. The Newark Basin, where caution was employed, underlies the three wealthiest counties in Pennsylvania as measured by median household income according to the US Census. Obviously, correlation does not show causality, but the possibility that representatives of wealthier communities are more influential than others is an idea worth exploring.
The moratorium for the Newark Basin was inserted into the state budget at the request of Republican Senator Charles McIlhinney of Bucks County, who voted for Act 13 (known as HB 1950 until its passage). To see how other Pennsylvania senators voted on HB 1950, see the map below.
Pennsylvania senate votes on HB 1950 (subsequently known as Act 13). Click the blue “i” tool then any map feature for more information.
https://www.fractracker.org/a5ej20sjfwe/wp-content/uploads/2025/09/2025-Wordmark-Logo.png00Matt Kelso, BAhttps://www.fractracker.org/a5ej20sjfwe/wp-content/uploads/2025/09/2025-Wordmark-Logo.pngMatt Kelso, BA2012-07-16 14:54:382020-07-21 10:39:59The Marcellus Shale, the Newark Basin, and Household Income
If you are like me and start your morning work routine by scrolling through the daily Marcellus Shale news with a good cup of coffee, then you are probably just as confused as the rest of us about the recent Duke University study results regarding shale gas drilling. Just take a look at the list below and try to interpret strictly from the news headlines what it is Nathaniel Warner, Dr. Robert Jackson, and colleagues actually found:
New research shows no Marcellus Shale pollution (CNBC.com)
Marcellus Shale Study Shows Fluids Likely Seeping Into Pennsylvania Drinking Water (Huffington Post)
Rising Shale Water Complicates Fracking Debate (NPR)
Marcellus Brine Migration Likely Natural, Not Man-Made (Oil and Gas Online)
Duke study finds possible pathways from Marcellus shale to drinking water … (Akron Beacon Journal)
Fracking Did Not Sully Aquifers, Limited Study Finds (New York Times -blog)
Water contamination from shale fracking may follow natural routes (Examiner.com)
Duke study: Fluids likely seeping into PA’s drinking water from Marcellus Shale (News & Observer)
Findings are mixed in fracking-water study (Pittsburgh Post-Gazette)
New study: Fluids from Marcellus Shale likely seeping into PA drinking water (Syracuse.com)
New research shows no Marcellus Shale pollution (The Wall Street Journal)
Marcellus Brine Migration Likely Natural, Not Man-Made (Duke University)
No wonder this entire issue is so contentious. Not only is the science still evolving, but then you have to waft through the countless takes on what the research means. Perhaps we should take a cue from our childhood years and get the story “straight from the horse’s mouth.” E.g. try reading the officialresults (PDF) published in the Proceedings of the National Academy of Sciences. Even the abstract below will tell you a lot more about the implications of the results than any truncated news headline could:
The debate surrounding the safety of shale gas development in the Appalachian Basin has generated increased awareness of drinking water quality in rural communities. Concerns include the potential for migration of stray gas, metal-rich formation brines, and hydraulic fracturing and/or flowback fluids to drinking water aquifers. A critical question common to these environmental risks is the hydraulic connectivity between the shale gas formations and the overlying shallow drinking water aquifers. We present geochemical evidence from northeastern Pennsylvania showing that pathways, unrelated to recent drilling activities, exist in some locations between deep underlying formations and shallow drinking water aquifers. Integration of chemical data (Br, Cl, Na, Ba, Sr, and Li) and isotopic ratios (87Sr∕86Sr, 2H∕H, 18O∕16O, and 228Ra∕226Ra) from this and previous studies in 426 shallow groundwater samples and 83 northern Appalachian brine samples suggest that mixing relationships between shallow ground water and a deep formation brine causes groundwater salinization in some locations. The strong geochemical fingerprint in the salinized (Cl > 20 mg∕L) groundwater sampled from the Alluvium, Catskill, and Lock Haven aquifers suggests possible migration of Marcellus brine through naturally occurring pathways. The occurrences of saline water do not correlate with the location of shale-gas wells and are consistent with reported data before rapid shale-gas development in the region; however, the presence of these fluids suggests conductive pathways and specific geostructural and/or hydrodynamic regimes in northeastern Pennsylvania that are at increased risk for contamination of shallow drinking water resources, particularly by fugitive gases, because of natural hydraulic connections to deeper formations.
In all fairness, this study is very technical, so writing a catching but accurate news headline is extremely difficult. It is important to keep in mind, however, that summaries written for the lay public will often contain a piece of the translator’s perspective – like snippets of foreign code embedded in the story.
By Samantha Malone, MPH, CPH – Communications Specialist, FracTracker; DrPH Student, University of Pittsburgh Graduate School of Public Health, Environmental and Occupational Health department
https://www.fractracker.org/a5ej20sjfwe/wp-content/uploads/2012/07/Shale-News-Callout.png300365FracTracker Alliancehttps://www.fractracker.org/a5ej20sjfwe/wp-content/uploads/2025/09/2025-Wordmark-Logo.pngFracTracker Alliance2012-07-11 11:44:022020-07-21 10:39:59Duke Study Prompts Confusing Headlines
Violations issued by the Pennsylvania Department of Environmental Protection (DEP) can be found on the Compliance Report. Each violations has many columns of data, including whether it was broadly categorized as either “Administrative” or “Environmental Health and Safety” (EH&S). This is a distinction that has caused no shortage of confusion, to the point where I have argued that the distinction is actually meaningless.
But don’t take my word for it! Take the words of the DEP field agents who entered the various codes and comments. On the link below, I have made a quiz where I give you the code description or comment for ten different violations, and you use that information to decide whether you think they should be categorized as “Administrative” or “Environmental Health and Safety”. At worst, you have a 50/50 shot at getting each question right, and you only need five out of ten to pass.
This past January, when Ohio was still in the midst of the bidding war for the proposed cracker facility, Toledoans saw the following blurb in their paper, the Toledo Blade:
Gov. John Kasich is pursuing the multibillion-dollar ethane-cracker facility that Shell Chemicals LP plans to build in Ohio, West Virginia, or Pennsylvania to capitalize on the increasing harvest of natural gas from Marcellus shale. The American Chemistry Council estimates that the plant would generate 17,000 jobs in chemistry and other industries as well as $1 billion in wages and $169 million in tax revenue.
That’s some financial impact, right? And now we are hearing the same figure coming out of Harrisburg via the Post-Gazette:
Estimates from the American Chemical Council have projected that a $3.2 billion ethane-processing facility, similar to the one that Shell is considering for Beaver County, would create more than 17,000 new jobs at the plant itself and among spinoff businesses along the supply chain.
Too bad it is isn’t very realistic.
Although the planned Monaca plant is one of several new cracker facilities planned in North America, currently, there are just a handful on the continent. In January, I posted about one of them, a Shell facility in Norco, Louisiana. On their website, the multinational giant proudly proclaims the following, in bold type:
Shell Chemicals’ Norco facility is located in St. Charles Parish. The facility has over 600 full-time employees, more than 160 contractors, and generates an annual payroll of $50 million. The company pays more than $16 million in state and local taxes and $6M is property taxes that help fund public education as well as police and fire departments.
As I mentioned five months ago, those are significant contributions, to be sure. But it is a far cry from the projections of the American Chemistry Counsel (ACC) state above. Shell also operates another cracker in Deer Park, Texas, which claims:
Shell Deer Park is a 1,500-acre complex located in Deer Park, Texas, approximately 20 miles east of downtown Houston along the Houston Ship Channel. Founded in 1929, Shell Deer Park is now home to 1,700 employees who operate a fully integrated refinery and petrochemical facility 24 hours a day.
That’s a lot of jobs, but as an integrated facility, it already accounts for some of the “spinoff businesses along the supply chain”.
Nova Chemicals operates another cracker in Sarnia, Onterio, which according to their website employs about 900 people who earn an estimated $86 million in wages and benefits each year.
So how silly is the claim of 17,000 jobs and $1 billion in wages? Consider that with all of its existing crackers and other facilities,
“Shell chemicals companies staff total 8,500 worldwide. The majority of these support our manufacturing operations. This does not include joint venture employees.”
Even with the JV employees not being counted, we are talking about major petrochemical plants in nine locations around the world, plus three technology centers. So just who are these experts at the ACC who keep getting quoted for the 17,000 job figure? According to website:
The American Chemistry Council’s (ACC’s) mission is to deliver business value through exceptional advocacy using best-in-class member performance, political engagement, communications and scientific research.
Well played, ACC. You have put on a best-in-class performance with your exceptional advocacy. But for the rest of us, it is time to start considering more realistic jobs numbers when talking about the proposed ethylene producing facility.
Ever since the DEP responded to FracTracker’s request for oil and gas violation data in October 2010, I have been providing periodic updates of the data in a variety of meaningful ways, such as raw violations totals and violations per amount of gas produced. But for most purposes, the best analysis has always been in terms of violations per well.
Since that time, the data have improved considerably. Not only have significant issues been addressed with both datasets, but the violations and drilled wells are now both relatively easy to access online directly from the DEP. That does not mean, however, that the available datasets are perfect or straightforward. For example, the DEP seems to count violations by the number of violation ID numbers issued, but upon closer inspection, that’s not the full story, and as a result, I prefer to use the total number of entries on the compliance report instead. The situation for permits and wells used to be almost exactly the opposite, as those reports often list multiple actions for the same well.
I have not checked the permits report lately but as I began this analysis, I was surprised to discover that the drilled wells list has been cleaned up considerably, as each unique eight digit well API number appears on the list exactly once. Now I may be the only one excited about this, but it is a notable milestone in the evolution of the data in my humble opinion, because it removes an element of interpretation which can have a significant impact on the result of the analysis. And as an added bonus, it makes the analysis much easier, too.
So let’s take a look at violations per well (VpW) from January 1, 2005 through June 12, 2012:
Violations per well by year in Pennsylvania’s Marcellus Shale.
Keep in mind that if we were talking about raw totals of violations and wells, it would of course be significant that we are less than half way through the year. As a ratio, however, that’s not the case, and there is no reason to expect the VpW for 2012 to change substantially up or down based on seasonality. Looking at the the trend, however, there is plenty of reason to expect the final score to be lower, as the rate of violations per well has been declining sharply in recent years. In fact, the current 2012 rate of 0.51 violations per year is less than half of the 1.14 violations per Marcellus well that we saw in 2009. Certainly, that’s an encouraging trend, if it can be attributed to changes in practices in the field, and not just changes how violations are administered, coinciding with changes in the executive branch of the state government.
One of those changes made by the new administration was an effort to route the violations process through Harrisburg. It was a move that raised considerable suspicion among some people, as it had the appearance of moving the oversight process a good bit closer to elected and appointed officials. But on the other hand, it was clear that the three DEP offices which handled oil and gas violations were not on the same page:
2010 Violations per Well by DEP issuing region.
Violations issued from the North Central Regional Office (NCRO) were roughly three times that coming from either the North West Regional Office (NWRO) or the South West Regional Office (SWRO). As the role of the regional office is supposedly diminished in determining what is and is not a violation, we will take a look at the 2012 data on a county by county basis:
Marcellus Shale violations per well (VpW) by county from 1-1-12 through 6-12-12. Counties outlined in yellow contained at least one drilled well during the period.
Compared to the map above, it seems like the strong association with VpW score and regional office affiliation is starting to break down. For those who are are curious, you can see all of the data for each county dating back to 2005 by clicking on the blue “i” tool, then any map outline.
But because the VpW scores can be so exaggerated for counties with just a handful of Marcellus Shale wells, let’s take a look at the five counties with the most wells, all of which were in the North Central Regional Office jurisdiction except for Washington, which was in the South West Regional Office:
Violations per Well for the 5 counties in PA with the most Marcellus Shale wells, as of 6-12-2012.
Last year was the first time since 2007 that Washington County did not have the lowest VpW score out of the five counties with the most wells. In this subset, trends are down across the board since 2009, and now the counties that are major players in the Marcellus are all much closer together.
When it was learned that the plan at the DEP was to have Secretary Krancer approve each Marcellus violation, the prediction that the number of violations relative to the activity of the industry would decrease was widespread. Even though the specific plan was scuttled, the expected result came to pass anyway. And yet, the validated hypothesis does not amount to proof of political meddling; the possibility that the data reflect improved practices in the field would also net the same result.
https://www.fractracker.org/a5ej20sjfwe/wp-content/uploads/2025/09/2025-Wordmark-Logo.png00Matt Kelso, BAhttps://www.fractracker.org/a5ej20sjfwe/wp-content/uploads/2025/09/2025-Wordmark-Logo.pngMatt Kelso, BA2012-06-19 14:49:552020-07-21 10:39:39Long Term Trends in PA’s Marcellus: Violations per Well
Ever wonder what we do with all the gas we’ve been producing?
In 2011, the United States consumed about 24.4 trillion cubic feet (Tcf) of natural gas, a 2.4 percent increase from 2010. From that total, just over 2 Tcf was used to fuel operations necessary to get the product to market, including production and recovery efforts as well as transportation of the product through pipelines. The remainder of the natural gas, about 22.3 Tcf, made its way to consumers.
Residential, commercial, and vehicle fuel usage have all been relatively flat over the past dozen years, save for a slight dip between 2005 and 2007, when the wellhead price of gas was around $6 to $8 per thousand cubic feet (Mcf). On the other hand, the amount used for electric power has increased 46 percent, while industrial usage has fallen 17 percent over the same period of time.
Much of this variation may be due to external factors, such as changes in industrial production or the fact that price of coal roughly doubled over the same time frame. And as a whole, the United States must have made significant progress in increased residential efficiency, because although there are 32 million more people now than in 2000, the residential sector actually saw a slight decrease in overall natural gas consumption.
But has the recent surge in domestic drilling activity reduced our dependence of foreign oil? Although oil imports were about one third less in 2011 than the 2005 peak, many experts think that is due to a combination of high prices (due mainly to Asian demand) and the less-than-robust US economy making fill-ups at the pump more painful, and therefore, less frequent.
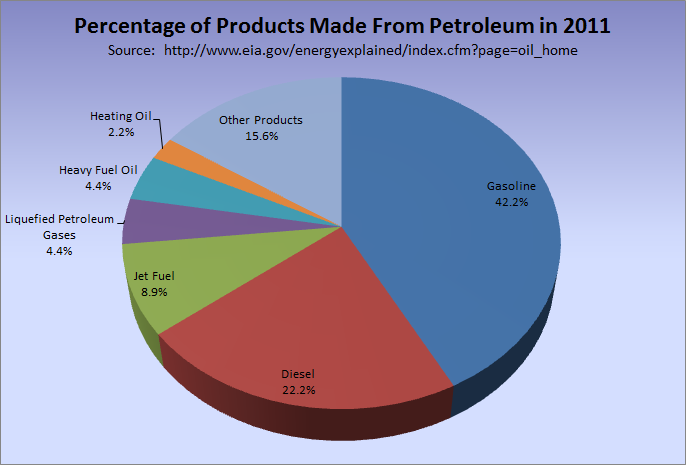
Consider that in the United States, the way we use natural gas and petroleum are really quite different. While many developing nations have millions of natural gas vehicles, the United States had fewer than 120,000 compressed natural gas (CNG) and liquefied natural gas (LNG) powered vehicles in 2010, explaining why vehicle fuel is barely a factor in the chart above. Compare that to petroleum, below, where gasoline, diesel, and jet fuel account for nearly three quarters of all petroleum usage:
Consumers can hardly be faulted for not buying natural gas powered vehicles: according to an interactive map on the US Department of Energy site, there are exactly seven CNG filling stations within a 100 mile radius of downtown Pittsburgh, and no LNG stations within that area.
So natural gas is not yet a major factor in replacing our primary use of petroleum, which is really to move people and things around. That could change though, if production remains high and prices remain low. That last part might be what has prevented a movement toward natural gas vehicles: currently, the price of CNG is about $2.13 per gallon equivalent, but if gas prices go back up to around $8 per Mcf (from the current $2.78) then gas may not seem like such a good deal again. One can only presume that fluctuations such as those factor into why the investments for CNG and LNG infrastructure is so limited.
The Haynesville Shale is a gas rich formation that underlies parts of Louisiana, Texas, and Arkansas. Technically a mudstone, it was deposited in the Upper Jurassic epoch, about 150 million years ago. As the chart below demonstrates, the Haynesville Shale is a major player in terms of shale gas extraction in the United States:
Unfortunately, the exact production values were not released along with this chart, but the Haynesville is clearly competitive with both the Barnett Shale and the Marcellus Shale, and may in fact outproduce both of them. So let’s take a look at the Haynesville, and with it, a look at the data distribution of the three states where it is located.
Haynesville Shale activity. Please click the grey compass rose and double carat (^) to hide those menus. For more information, click the blue “i” tool, then any map feature.
Arkansas
Arkansas has 64 wells drilled into the Haynesville formation, only a handful of which were drilled in the 21st Century. In fact, many of the wells listed are quite old, dating to the 1940’s. Taken together, the small number of wells and the age of those wells makes it clear that Arkansas is not much of a factor in the total output of the Haynesville Shale. In fact, the Haynesville wells in Louisiana stop well south of the border with the Natural State.
In terms of their data, the Arkansas Oil and Gas Commission provides access to data that many other states do not, including well stimulation data. Unfortunately, the data export feature seems to be a bit buggy, but luckily, the Haynesville data is practically unchanged from when I downloaded the data in 2010. Much of the dataset has location information in decimal degrees–the standard latitude and longitude format of the digital age. Many of the wells are only available in the archaic and arcane Public Land Survey System, which is still the legal way to describe locations in many western states. Louisiana
In all likelihood, the Pelican State contains the largest share of recoverable gas from the Haynesville formation. This assertion is based on activity rather than production: 2,400 Haynesville wells have been permitted since 2006, of which 2,194 have been spudded, and 1,985 have been completed.
The data released by Louisiana’s Department of Natural Resources has a certain elegance to it, in that the dates for permits, spuds, and original well completion can all be found on the same spreadsheet. What’s more, the same dataset contains location information in the preferred decimal degree format for the top and bottom of the wells, meaning that it is possible to map the lateral portion. Texas
With almost 100,000 producing gas wells in 2010, Texas accounts for one fifth of all such wells in the United States. The heart of the Haynesville Shale continues into the Lone Star State from the western border of Louisiana.
And yet, there are no wells in Texas on the map above. Why? I can tell you that as of the writing of this, there are 816 Haynesville wells in Texas, according to the well search tool of the agency which oversees the oil and gas industry, the Railroad Commission of Texas (RRC). I can quickly find production values, and even the lease number, and in other queries, there are even scans of original paperwork available online, digitally, and free of charge. What they don’t provide is location data. This omission seems to be consistent with the following statement on the RRC site:
The on-line research queries are intended for use by individuals needing specific information from the Railroad Commission. The use of automated tools to retrieve volumes of data can cause severe degradation of the Railroad Commission’s systems. If the query system detects that data is being retrieved using an automated tool, the Commission will end the session for that user.
The first sentence contains the philosophy, while the second statement frankly comes across as a lame excuse in 2012, especially for a state with such substantial activity and a healthy severance tax. It seems inconsistent to dedicate so much server space to scans of images without informing you where the location is–it’s a convoluted approach to data transparency, if ever there were one.
Perhaps my interest in mapping is a source of bias, but to me, the location of the well is the single most important data point. How can you determine what the potential impact of a well would be if you don’t even know where it is?
https://www.fractracker.org/a5ej20sjfwe/wp-content/uploads/2025/09/2025-Wordmark-Logo.png00Matt Kelso, BAhttps://www.fractracker.org/a5ej20sjfwe/wp-content/uploads/2025/09/2025-Wordmark-Logo.pngMatt Kelso, BA2012-05-17 15:09:012020-07-21 10:39:38A Look at the Haynesville Shale
Ohio is on the western edge of two enormous black shale formations in Appalachian Basin: the 390 million year old Devonian Period Marcellus Shale and the Utica Shale, formed from deposits in the Ordovician Period about 460 million years ago. Image source: Ohio Environmental Protection Agency
The Ohio Department of Natural Resources (ODNR) has made it easy to find shale gas data from these two formations.
This is provided that you are only interested in horizontal wells. ODNR sums up their opinion of the importance of horizontal wells thusly:
Effective immediately, the vertical permits (stratigraphic test well permits) have been removed from this listing. In the initial phases of both Marcellus and Utica exploration, they were listed to reflect exploratory activity. They are no longer necessary with the increase of horizontal permitting activity. As always, they are available through the Oil and Gas On-line Well Search (1).
To me, this seems like an arbitrary line in the sand for the ODNR to take, but then again, each state has its own quirks with dissemination of their oil and gas data. In Pennsylvania, for example, there is no way to determine a well’s source formation without a file review, other than whether or not the well is drilled into the Marcellus. And in New York, the entire debate is couched around the phrase “High Volume Horizontal Hydraulic Fracturing”, a specificity unmatched elsewhere in the basin, that includes well stimulations using more than 80,000 gallons of fluid. In many respects, the ways in which the states release their data are datapoints unto themselves, but then, that is the subject of a different post altogether.
So let’s take a look at the trends in Ohio for the deep shale gas formations:
Ohio shale gas permits, including Marcellus (blue) and Utica (red). Please note that Marcellus wells include horizontal and vertical permits, while Utica includes only permits for horizontal wells. Please click the gray compass rose and double carat (^) to hide those menus.
Horizontal Marcellus Shale permits issued in Ohio through 4-9-2012
Clearly, there is not nearly as much activity as there is in Pennsylvania or even West Virginia. Altogether, there have been 13 horizontal Marcellus permits issued in the Buckeye State, the most recent of which was nearly ten months ago. Seven of the permitted locations have been drilled so far.
Here’s the data from the Utica Shale:
Horizontal Utica Shale permits issued in Ohio through 4-9-2012
Altogether, there have been permits issued for 194 horizontal Utica wells, 60 of which have been drilled so far. Moreover, it seems to be in a period of rapid expansion; a distribution is reminiscent of the Marcellus in Pennsylvania in 2006 to 2007 (see link above).
Only nine of the sixty drilled wells were in production in 2011, four of which produced some oil from early completion and flowback phases, but no natural gas as of yet. None of the horizontal Utica wells were in production for the entire year in 2011.
Here are the statewide totals from the horizontal Utica wells:
Statewide production values from horizontal Utica Shale wells in Ohio in 2011
It is worth noting that over 59 percent of the gas production came from one well publicized Harrison County gas well–its 1.5 billion cubic feet of production is reported to be the source of 2 percent of the entire state’s gas production.
While that is an impressive quantity of gas from one well, it might be the oil production that is raising eyebrows in the industry. As this post is being written, oil prices are at $104 per barrel, and natural gas is trading at $1.92 per thousand cubic feet (Mcf). While there really isn’t much data to go on to determine if the results are typical, if there continues to be oil associated with the Utica gas to that extent, we may see more drilling rigs focused on the older formation, and fewer on the Marcellus.
The well database is here. There are some limitations on the utility of this database, however, as users cannot use formation as a search parameter, and searches are limited to 1,000 records. Upon request though, the ODNR did send me a DVD full of data. The information is available, it just takes some fortitude to slog through it.
https://www.fractracker.org/a5ej20sjfwe/wp-content/uploads/2025/09/2025-Wordmark-Logo.png00Matt Kelso, BAhttps://www.fractracker.org/a5ej20sjfwe/wp-content/uploads/2025/09/2025-Wordmark-Logo.pngMatt Kelso, BA2012-04-20 12:19:572020-07-21 10:39:36Shale Gas Trends in Ohio: Abandoning Marcellus, Embracing Utica
Last night, I queried the Oil and Gas Compliance Report wizard the PADEP website for Marcellus Shale violations from 2005 through February 15, 2012. The resulting document contained 4,072 rows of data, which as tallied by the DEP includes 3,497 violations, and 976 enforcement actions.
For an industry that would like to convince us that it is producing safe and clean energy, these numbers are pretty big. When presented with numbers like this, I hear the following refutation with surprising frequency: “Most of those are administrative violations. It’s just paperwork.”
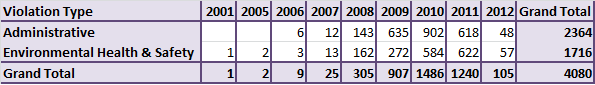
Administrative and Environmental Health and Safety Violations for MS Wells in PA by Year(1)
So about 58 percent of the total number of violations are indeed categorized as administrative, which is a significant majority of all the Marcellus Shale violations in Pennsylvania (1). And yet, this is merely an observation, not an effective counterpoint to the argument that there sure are a lot of violations associated with this industry. This is doubly true when trying to address the fact that some operators have a better culture of compliance than others. If we were to take the leap that many have that administrative violations amount to paperwork, shouldn’t they be easy to avoid? If a drilling operator in this multi-billion dollar industry wanted to convey respect for Pennsylvania’s laws, wouldn’t adequate paperwork be a good place to start?
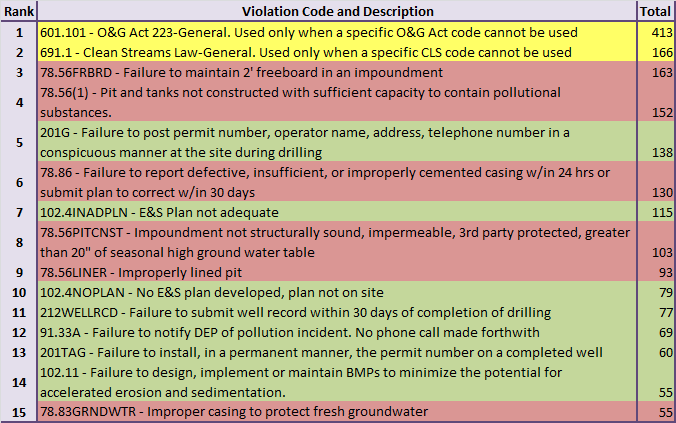
But if you take a closer look at the administrative data, the paperwork argument itself begins to fall into disarray. To date, there have been 59 violation codes used under the administrative category. Let’s take a closer look at the 15 of those which have been cited most frequently:
15 most frequent administrative violations for Marcellus Shale wells in PA
And here is the color key for the chart above:
The two most frequent administrative violations cited are so vague that they are practically meaningless for our purposes. With many of the rest of the categories, it is possible to argue that they are fundamentally administrative or fundamentally environmental, health and safety in nature. Obviously, these are my interpretations, but I think that in general, categories in green seem to be matters of procedure while categories in red reflect actual problems in the field.
Not only are there more administrative violations in the red category than the green, but the truly administrative violations are also important. If something goes wrong at the well site and the operator cannot be contacted because they didn’t post the required signage, that is a problem. If there are insufficient plans for dealing with erosion and sedimentation, that’s a problem. If such plans exist, but they aren’t on site where the workers can access them, that’s a problem too.
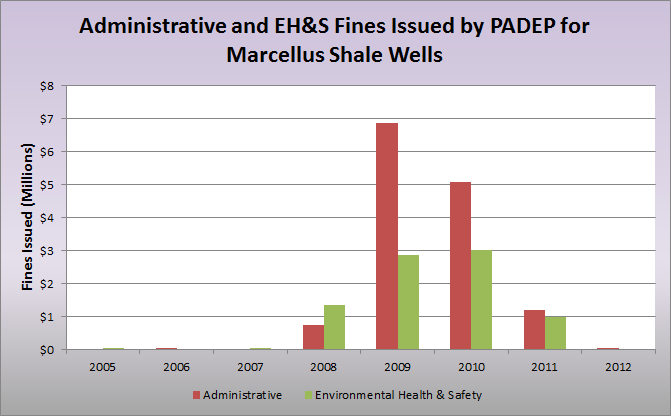
Before laying the “it’s just paperwork” argument to rest, let’s take a look at the exchange of paper with pictures of presidents’ faces on them:
PADEP fines for Marcellus Shale wells, sorted by violation type
Yikes! Once we recover from the fact that the aggregate fine totals are trending sharply downward (3), the question that we were trying to address is pretty obvious: more fines are assessed for violations categorized as administrative than for environmental health and safety ones. All together, almost 63 percent of the $22 million in DEP fines for Marcellus Shale wells have been for “administrative” violations.
So can we please dispense with the notion that “it’s just paperwork”?
Astute readers will note:
A) There is a value for 2001, when data was queried from 2005 onward. Clearly, this reflects an input error in the violation issue date.
B) There are 4,080 records being accounted for, which doesn’t equal any of the three numbers above. Here then is the story of this data….There are indeed 3,497 unique violation ID numbers, but some of these are used to address more than one concern, which explains the 4,072 rows. The original data did not contain location information, so I merged that data with permit data, using the API number for a match. This resulted in 4,732 records, as there are often more than one entry for a single API in the permit data. Therefore, I took the results and removed duplicate lines, the result of which was 4,080 records.
However, if we look at data from 2011 on, we see that there are more Environmental Health and Safety violations than Administrative ones.
There is often a considerable latency period between the incident and when the fine is issued, especially for high profile cases. But still, given the media attention given to oil and gas fines recently, this downward trend is surprising, to say the least.
https://www.fractracker.org/a5ej20sjfwe/wp-content/uploads/2012/02/top-15-admins.png423676Matt Kelso, BAhttps://www.fractracker.org/a5ej20sjfwe/wp-content/uploads/2025/09/2025-Wordmark-Logo.pngMatt Kelso, BA2012-02-16 15:55:102020-07-21 10:38:54“Administrative” Violations Should not be Dismissed
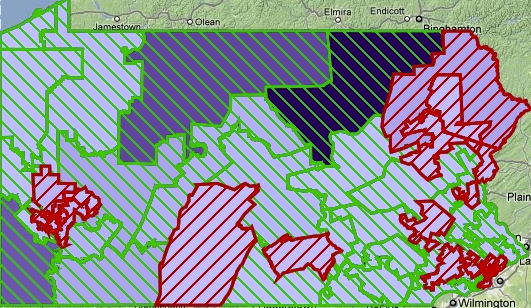
While House Bill 1950 is not actually listed as an antonym to “transparent” in the dictionary, its passing certainly acted that way. On February 8, 2012, PA’s HB 1950 was quickly bullied through the Senate and House with very little public transparency on what it contained. The lack of transparency during the move to pass the bill is similar to that of a drilled wells map for PA (yes, that’s a corny GIS joke). It now awaits the signature of Gov. Corbett – who has thanked the General Assembly for passing it. While HB 1950 institutes a sort-of impact tax that counties can decide whether or not to implement, the fee is the lowest in the country and is dependent partly on the [low] commercial price of gas. The bill also reduces the ability of local municipalities from individually zoning drilling (including pipelines). Tack onto all of that the fact that the data on these wells is just not up to speed with the pace of drilling. In one of Matt’s recent post about how many permits there are in PA right now, he notes that not even the PA DEP numbers can give you a straight answer. These numerical discrepancies make you wonder how thoroughly any permitting site assessments can be conducted when not all of the well locations can be accounted for. That issue makes the PennEnvironment Research and Policy Center’s recent report looking at drilling data even more frightening. Their analysis revealed that the gas drilling industry was responsible for 3,355 Marcellus Violations between 2008 and 2011, many of which were not simply paperwork violations. At least the money set aside in the proposed state budget for improving emergency response on drills sites will be well worth it.
Ah yes, the proposed state budget… This intriguing reading was introduced by the Governor on the 8th, as well. According to John Quigley there is much to love and even more to hate in the 2012-13 budget proposal. To start off, this version of the budget WOULD NOT reopen the state forests to more leasing, something that many environmental groups were concerned could happen to help alleviate the state’s budget deficit. However, the Keystone Fund monies ($46 million) WOULD be reallocated into the general fund. This would be a major setback to conservation work because normally the money would be granted out to land trusts and conservation groups. That means less conservation work all around – at a time when it’s is needed more than ever.
There is much more to all of these issues, but instead of reinventing the wheel, here is a nice summary about the lack of transparency related to HB 1950. If you are interested in seeing how your representative voted on HB 1950, click on these links: PA House Roll Call Votes | PA Senate Roll Call Votes or check out the map below showing two layers of data on the:
Number of wells per PA Senate district on a light to dark purple spectrum (darker indicates more wells)
Vote on HB 1950, with green hatching indicating “yes” votes and red hatching indicating “no” votes.
To get the most out of this map: zoom in to your area of interest, click on the identify “i” button, and then click on a place on the map that you would like to learn more about.
https://www.fractracker.org/a5ej20sjfwe/wp-content/uploads/2012/02/HB1950votes.png308531FracTracker Alliancehttps://www.fractracker.org/a5ej20sjfwe/wp-content/uploads/2025/09/2025-Wordmark-Logo.pngFracTracker Alliance2012-02-10 15:30:462020-07-21 10:38:54Covert Affairs in the Commonwealth


 nt, -par-]