Our thoughts and opinions about gas extraction and related topics

A World Without Research

When times are economically demanding, the first tendency of regulators is to suggest cutting non-essential programs. Unfortunately, many of those ‘non-essentials’ include public services and research, which are pivotal to the progress of our nation. Mostly as a mental exercise, I’d like everyone to ask themselves where we would we be if we did not fund such research:

  • You would not be reading this article on the internet, as it was pioneered by those that developed the Large Hadron Collider.
  • The paths of hurricanes and tornadoes would be terribly difficult to predict.
  • One out of every ~nine babies worldwide would be claimed by smallpox.
  • Medical MRI technology would not exist – pioneered by a chemist and a physicist.

DCNR Changes

DCNR Lands & Active Permits

Located more close to home are Pennsylvania’s recent funding cuts on ecological projects. Those in power have claimed that their regulatory decisions regarding unconventional natural gas extraction from the Marcellus Shale layer are based on science. However, the funding for the Commonwealth’s Department of Conservation of Natural Resources (DCNR) to provide data on the health of PA’s ecosystem is aggressively being cut by those same individuals. On January 18, 2012, NPR reported that documents obtained by StateImpact Pennsylvania (among others) suggest that the funding for scientific endeavors within DCNR currently focusing on drilling-related issues is actively being slashed by the state. The agency’s wildlife research program has been cut by almost 70%, specifically impacting the projects dealing with understanding the impacts of drilling. The rationale for why some projects were cut and not others has not been provided, nor was the reason for failing to involve the conservation team in such funding decisions. Also recently, the director of DCNR’s citizens advisory committee was fired by the Corbett administration. The committee has oversight of the state’s parks and forests. These significant changes could significantly affect the accountability of Marcellus Shale gas drilling in PA’s forests.

The Commonwealth of Pennsylvania has a major budget deficit to deal with, no doubt. However, in the face of financial crises compounded by overlapping priorities on a policy level, it is even more crucial that we use real evidence – science – to create policies and make decisions. How can we do that when we are cutting the very channels that provide us with the data? Without access to reliable data and information about how PA’s ecosystem is dealing with drilling, our policy-makers will find it more difficult to make well-informed decisions. Without programs that provide up-to-date and reliable impact data, we are doomed to repeat the mistakes that lead to today’s legacy pollution sites – for which tax-payers are now encumbered to remediate!

Read more about the DCNR cuts in NPR’s full article.

Cuts as Pace of Drilling Intensifies

Inadequate access to quality data is an issue that is only going to become more concerning as the pace of the shale gas industry intensifies. (There were 785 Marcellus wells drilled in 2009; 1,461 in 2010; and 1,920 in 2011.) Forty percent of PA’s state forests are already leased out for shale gas drilling, and there has also been some discussion about the likelihood of lifting the moratorium (ban) on further drilling. Learn more here.

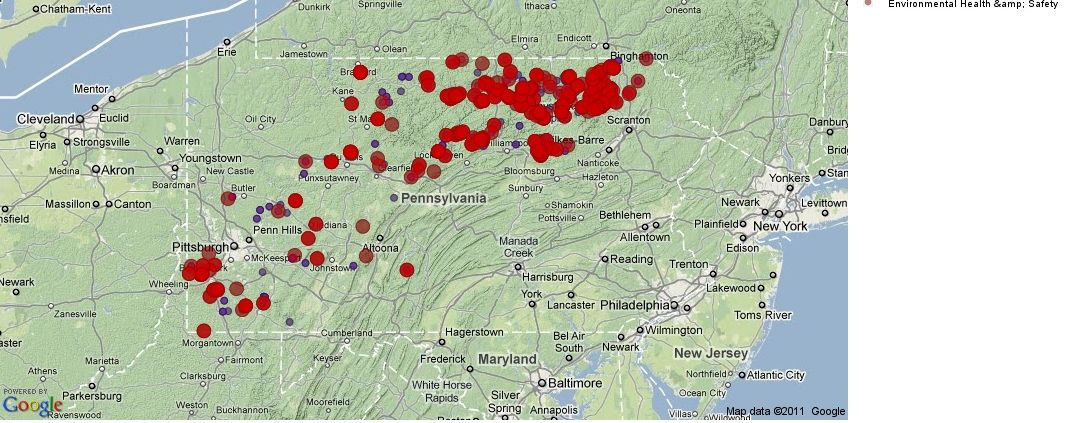
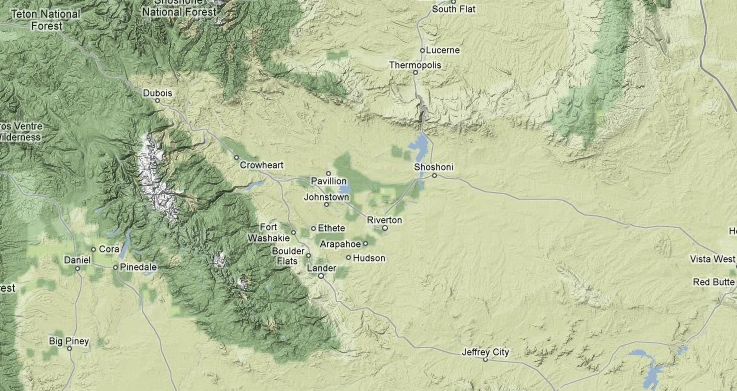
As another point of reference regarding the scale of shale gas drilling in PA, below is a map of all of the Marcellus Shale wells drilled in the state as of 1-12-12 created with data from the PA DEP using Data.FracTracker.org


Samantha Malone, MPH, CPH is a doctorate student in the Environmental and Occupational Health department of the University of Pittsburgh’s Graduate School of Public Health and the Communications Specialist for FracTracker.org. She can be reached at: malone@fractracker.org  |  412-648-8641

Ethylene Cracker Would Contribute Jobs, Air Pollution

Last year, Shell Chemicals announced its intentions to build a multi-billion dollar ethylene cracker “in Appalachia”, effectively setting the stage for a bidding war between Ohio, West Virginia, and Pennsylvania. There have been numerous other plans for such plants in the area, including a recent partnership trying to get Aither Chemicals catalytic cracking process up in running, once again, “in Appalachia.”  The interest in the region is mostly due to the Marcellus and Utica shale gas produced in the region, which contains mostly methane (so-called natural gas used for heating, cooking, etc.), as well as other hydrocarbons that must be removed from the methane before the gas is put into pipelines.  These other hydrocarbons are mostly ethane, propane, and butane, which are converted into ethylene, propylene, and butadiene, respectively, through a process called cracking, and are then used for the creation of plastics, synthetic rubber, and other petrochemicals.

Whichever state lands these massive facilities stands to gain several thousand temporary construction jobs and several hundred permanent positions at the facility.  It seems reasonable to take a look at other similar facilities in the country, not only to get a reasonable idea of the economic contribution, but also to gain insight on the facility’s contribution to air pollution in the region.

I have chosen to look at the cracker in Norco, Loisiana, also run by Shell Chemicals. Norco is the ultimate company town, named for the now defunct New Orleans Refining Company, it contains not only the Shell plant, but also major petrochemical facilities owned by Dow, Hexion, and Valero. There is also a presence by Motiva, but all indications are that this is functionally part of the Shell plant that is simply owned by a different company.


Norco, LA as seen from Google Earth

According to the Shell page linked above, the facility employs 600 full time workers and 160 contractors for an annual payroll of $50 million. It also contributes $22 million in state, local, and property taxes to the community. That’s all very significant, albeit a far cry from the 17,000 jobs, $1 billion in wages, and $169 million in tax revenues that the good people of Ohio are being promised–perhaps those figures are over the estimated life of the facility, who knows? I’m guessing the proposed facility in Appalachia won’t be 22 times larger than the one in Norco, Louisiana though.

In terms of air emissions, it is hard to know what to expect. Emissions may wind up being quite different from Norco’s due to a different chemical composition of the feedstock, for example.  However, to get the conversation started, I have compiled the EPA’s 2008 National Emissions Inventory (NEI) estimated emissions for Norco, as well as a well known polluter that’s already in the area, Clairton Coke Works. I should mention that based on my experience, I don’t have a lot of faith of the validity of NEI data, especially for data in Pennsylvania (see this discussion about Clairton, for example), but it is what’s available.  Also, I need to mention that the data for Shell is aggregated between the Norco East, Norco West, and Motiva facilities, because from looking at the the websites for Shell and Motiva, the whole operation seems to be focused around cracking.  Let’s take a look:


2008 USEPA National Emissions Inventory for the Coke Works in Clairton, PA and the Shell ethylene cracker in Norco, LA

Now before you go to the EPA site to research these 84 pollutants, I didn’t put these up for direct comparison, since the facilities are obviously quite different. The point is that in an area that still largely in nonattainment for fine particulate matter and just recently re-entering attainment for ozone, the prospect of adding another major emitter of particulates and ozone and particulate precursors (as well as a whole host of other junk) isn’t going to help.

Youngstown Earthquake Related to Gas Extraction Industry?

Youngstown, Ohio rang out the old year in style, with a magnitude 4.0 earthquake that apparently felt as far away as Buffalo, but received attention nationally (See the LA Times blog titled 4.0 quake hits Youngstown Ohio. Yes, Ohio.) There is a widespread notion that the temblor was related to Class II injection wells in the area–see for example this Akron Beacon Journal article where Ohio state geologist Michael Hansen is quoted as saying there is “little doubt” that this latest in a series of 11 quakes is the result of activities at injection wells in the immediate area. The article goes on to say that his boss, Ohio Department of Natural Resources director James Zehringer, closed several injection wells in the area as the issue is being examined.

But wait a second…if you go to this NPR link, you see an AP story titled “Earthquake Strikes Near Ohio Fracking Site”, where the same James Zehringer is quoted as saying, “The seismic events are not a direct result of fracking.”

What gives? Actually, there is no discrepancy at all, except that the AP writer lumped injection wells together with hydraulic fracturing, which have some similarities in that they highly pressurized oil injections of oil and gas related fluids, but the two are in fact different. Therefore, saying that the seismic events are not a direct result of fracking is completely true.

But it does make one wonder…most of Pennsylvania has been deemed unsuitable for brine injection wells, which is why much of our waste water has gone to Ohio in the first place. But if these supposedly safe activities can result in a disturbance equivalent to 15 metrics tons of TNT, maybe we don’t really understand what we’re doing down there.

Here are maps showing earthquakes near the Ohio river basin since 1973. For more information on any event, hit the blue “i” button, followed by any map feature. Clicking the gray compass rose and double carat (^) will hide those menus.

Violations Jan-Sept 2011 PA (EHS highlighted with red dots)

A discussion on regulation and safety

By Samantha Malone, MPH, CPH – DrPH Student in Environmental & Occupational Health; Communications Specialist for FracTracker.org

As natural gas drilling in the Marcellus Shale region of our country moves forward, people in many states are debating over the best ways to regulate the natural gas industry. I’m not going to get into the impact fee discussion in this piece, although it is an obvious point of contention that needs addressed in PA immediately. Rather, I’d like to propose a way to manage the permitting and future development of the companies operating in this field.

Pipeline Safety

There are 2.5 million miles of pipelines in the U.S., the majority of which are for gas transmission and distribution. A recent 4-part series by the Philadelphia Inquirer brought to light the real and potential dangers of the gas pipeline system, which is being expanded in PA to handle the Marcellus gas destined for the market. The biggest concern highlighted in these articles in my opinion is the lack of oversight anywhere in the process – especially when our regulatory officials cannot even locate the pipelines. (Specific geographic locations of pipelines are often held close to the chest due to the perception that this information poses a risk to national security and infrastructure.)

Pipelines do fail, as demonstrated by the toxic liquid spills map below. This graphic was created by the New York Times, who in a earlier article discussed the lack of human and fiscal resources available to the Pipeline and Hazardous Materials Safety Administration – noting that although the number of spills have declined, pipelines are still responsible for approximately 100 significant spills per year.

NYTs: U.S. Pipeline Incidents 1990 - June 2011

NEW YORK TIMES | Source: Department of Transportation, Pipeline and Hazardous Materials Safety Administration

If you’d like to be able to find where pipelines are located (approximately) in your county, visit the U.S. DOT’s Pipeline and Hazardous Materials Safety Administration (PHMSA) website for Pipeline Safety Awareness. The site also provides you with data about pipeline incidents. In case you would rather not go diving through the raw data, below are some U.S. pipeline incident datasets and example maps from 2010 – Nov 2011 data that  Matt Kelso obtained from PHMSA:

  • PHMSA Hazardous Liquids Pipeline Incidents: Dataset | Map
  • PHMSA Gas Distribution Pipeline Incidents: Dataset | Map
  • PHMSA Gas Transmission Pipeline Incidents: Dataset | Map
(You can do a lot more with this data, such as filtering it by whether surface water remediation was necessary or by the type of contaminant that was released.)

Violations in PA

Violations Jan-Sept 2011 PA (EHS highlighted with red dots)

Violations Jan-Sept 2011 PA (EHS violations in red)

Another concern about natural gas drilling is the risk of environmental health and safety incidents occurring throughout the rest of the drilling process.1

The map to the left created using Data.FracTracker.org shows all of the violations that were issued to drillers from Jan-Sept. 2011 in Pennsylvania. The red dots are the violations that fall under the DEP’s loose category of Environmental Health and Safety (EHS).2

As you can see, EHS incidents do occur, but is that the whole story? Perhaps we should be asking ourselves, who exactly is responsible for these incidents – pipelines and the like? When you look more closely at the data the industry’s safety record becomes less monolithic than at first glance.

Focusing on the Bad Actors

The PR surrounding natural gas drilling is controversial at best. We have seen blanket statements about how safe – and dangerous – natural gas drilling and pipelines can be. We all must recognize that the answer lies somewhere in between. However, where is the perfect medium located, and how do we address the root of the problems that do arise?

One approach that is taken by some regulatory bodies such as OSHA is to focus on the bad actors. In two of his more recent posts, FracTracker’s Matt Kelso analyzed the ‘bad actors’ that exist within the violations issued in PA. While this is certainly not an easy or straightforward task, he was able to identify operators with the highest and lowest violations per well drilled, as well as trends between 2010 and 2011. Check out these analyses here: Part 1 |  Part 2.

Bad actors are not good for the industry’s PR or the Commonwealth’s residents. If the agencies responsible for issuing drilling permits quantitatively began to take violation trends into account, this would allow the safer drillers to continue operating, while limiting those with a less than appealing track record.


1 One of the great changes made by the PA Department of Environmental Protection in the last 2 years has been the transfer from the paper record system for keeping track of the violations they issue to a digital version that allows people access to the comprehensive, raw data. This is certainly also something that should be on NY’s Department of Environmental Conservation radar prior to issuing its first permit for high volume hydraulic fracturing.

2 EHS violations are a loose category because often times when we sift through the data we will find administrative oversights like paperwork mislabeled as EHS, and more serious spills and fires mislabeled as administrative.

Violations per Well by Operator, Part 2: Bad Actors

Recently, I conducted an analysis of the legacy of each Marcellus Shale operator’s violations over time, normalized by the number of wells each company has drilled, in a metric that I call Violations per Well, or VpW. While that analysis was cumulative, I’ve had FracTracker readers ask if the VpW from one year predicts the VpW for the following year, particularly among the bad actors. To help answer that question, I’ve taken the same raw data from the previous post, and recompiled it to help address that.

I’ve been looking at violations per well for some time, on the theory that it can be used to help score a company’s compliance history with regards to the Pennsylvania Department of Environmental Protection, which issues them. All of these wells and violations are Marcellus Shale specific, and come from sources posted on the DEP website.

For ease of use, I’ve color coded the results, with bright green being the best scores, and bright red being the worst. Companies without wells for a given year are indicated in pale blue. They may either indicate drilling operators that were inactive in a given year, or midstream companies that haven’t drilled any well. Here’s the color coded key:

And here are the results:

To look at the bad actors from 2010, I selected all of the entries that were colored burgundy or bright red for that year’s VpW score. How have they fared so far in 2011?

To be fair, I should point out that operators with very few wells can get obnoxious VpW scores in a hurry. On the other hand, there were 14 Marcellus Shale operators with at least one well drilled in 2010 that didn’t get any violations that year. Therefore, in this instance, I’ve included all operators with a VpW of 1.00 or greater, and will leave questions about sample size up to the reader.

Five of the operators with VpW scores of 1.00 or higher haven’t drilled any wells at all in 2011 so far. In fact, all of them had VpW scores of at least 2.50. There may be a variety of reason for their absence in 2011, but honestly, their lack of compliance isn’t missed.

Nine operators improved from 2010 to 2011, four of which improved all the way into green categories. This is the result that we want to see, where companies appear to be responsive to violations issued by the DEP. Notable among this group is Citrus Energy, which had a huge amount of violations compared to one drilled well in 2010, to a VpW score under 0.50 so far in 2011. Also, PA Gen Energy is an operator with a significant number of wells that went from a red to a green category, which is encouraging to see. Cabot, on the other hand, barely budged, and remains over 2.00 violations per well.

There are also three operators from 2010 with VpW scores of 1.00 or greater that actually got worse in 2011. And keep in mind, the data used includes almost two more months of drilled wells than violations, so inclusion in this group is especially dubious. They include Rice Drilling B, whose VpW more than duobled to 2.13; XTO, which went from awful to horrific since becoming a subsidiary of ExxonMobil; and Ultra Resources, whose performance has been nothing short of ghastly in 2011. Luckily, Ultra has been leaving the Keystone State alone since January–let’s hope it stays that way.

I maintain that since so many operators–big and small–are able to keep their violations to wells ratio at less than 1:2, all of the operators that operate in Pennsylvania’s Marcellus Shale should try to reach that standard.  Those that show a continued disregard for our laws protecting our environment should face stiff fines for their complacency, while those operators that average more than two violations per well drilled over a prolonged period of time need to be banned.

Map of Pavilion WY

EPA: Fracking and Groundwater Contamination

Map of Pavillion, WY

Pavillion, WY

The Internet is alive today after the U.S. Environmental Protection Agency released a report that indicates hydraulic fracturing (used when drilling for natural gas in tight shale formations) can contaminate groundwater. Residents of Pavillion, WY have been complaining about the state of their groundwater for some time now. The draft EPA report lends credibility to their claims with the finding that chemicals associated with the process were found in some deep water aquifers in the area. And when you look at all of the evidence around this issue – outside of the EPA’s study – the results are even more ‘ground-breaking.’

Having said that, there are a few questions regarding the EPA report/research. No field study could ever account for all of the potential confounders and variables – especially given the amount of resources the EPA had at its disposal to conduct this work. However, some of the most significant questions that I would like to see answered before this draft is finalized include:

  1. How representative is the data from the two monitoring wells in relation to residents’  drinking water wells?
  2. Has the potential for surface contamination of the monitoring wells been ruled out?
  3. Why weren’t the duplicate samples that were analyzed by separate labs also able to detect 2-BE?

These questions (and surely more) are exactly why this is only a draft report. According to the EPA, it will be available for a 45-day public comment period. A subsequent 30-day peer-review process will be led by a panel of independent scientists to ensure that the results that stay on the records are accurate.

DEP = Department of…Economic Promotion?

In today’s Post-Gazette, Laura Olson quotes the DEP Deputy Secretary of Oil and Gas Management Scott Perry refuting the notion that hydraulic fracturing is an unregulated process, saying:

“It’s important to point this out, because I think if the public loses confidence in the department’s ability to manage this industry, it’s going to have some consequences and perhaps some unfortunate policy decisions will be made. It ultimately will result in less opportunities for everyone.”

In times like these, isn’t it nice to know that even the Department of Environmental Protection has the economy foremost on their minds?

“I feel like I’m trying to convince the public that Sasquatch doesn’t exist.”

Hasn’t anyone told him? There have been 951 confirmed Sasquatch sightings in the Marcellus Shale portion of the Commonwealth so far this year.

Even if I’m taking this quote of Perry slightly out of context, the point remains valid: The DEP stands for the Department of Environmental Protection. That’s what they should talk about, and denying that there are problems doesn’t make it seem like they are paying any attention to their own data.

Flood Control and Shale Gas Wells

Flooding from Hurricane Irene in Wilkes-Barre PA

Photo Credit: Salvation Army, Randall Thomas, Wilkes-Barre, PA

Pennsylvania is no stranger to water and flooding, as we receive between 38 and 45 inches of rain per year on average. Unfortunately, the storms that hit the region starting on August 27th were more than we could handle – to say the least. During this time Hurricane Irene and the remnants of Tropical Storm Lee burdened the eastern portion of the state with flooding at water levels that rivaled Hurricane Agnes (1972).

While most residents hit hardest by flooding focused on protecting their families, homes, and livelihoods, others throughout the Commonwealth were also concerned about the impact that rising water levels could have on natural gas well pads. This is especially an issue for those sites operating in floodplains with open frac ponds. According to the reports we have been able to gather no shale gas well sites were compromised or sustained environmental damage in PA.  Apparently, Marcellus Shale drillers were advised to prevent overflows from wastewater/’frac’ ponds by the governor, although due to a communication loophole it is unclear as to whether all of the relevant sites temporarily shut down during the inclement weather. Regardless, with the number of wells being drilled in PA especially in the northeast, being able to prevent any incidents during these storms is quite a feat on the part of the drillers and should be recognized as such. Industry reports also indicate that drilling companies provided financial contributions, expertise, equipment, work hours, and supplies to aid in the flood relief efforts. Learn more about these contributions here.

We ask that if you have any knowledge that contradicts this information, please let us know and contact your local representative to report the incident.

Severance Tax vs. Impact Fee, Revisited

It may not seem like it when you head to the pump, but the price of oil has plummeted in recent months. After peaking near $114 in April, the price has fallen all the way to $77.27, as of today. Natural gas, which was $4.27 last month, has fallen 15 percent since then to $3.62. Surely with all of this uncertainty, the Corbett’s proposed impact fee makes more sense than the traditional severance tax which most states use? Perhaps it would be better to take the predictable lump-sum amount than basing that portion of the state’s coffers on the vagaries of the market?

No, not really.

Corbett’s plan allows the counties to charge up to $40,000 per well per year, for a period of up to 10 years per well. According to the Post-Gazette, his administrations figures it could bring in $120 million in the first year, and up to $200 million per year by the sixth year.

Or, as I pointed out in June, we could tax like Texas. Texas imposes a 7.5% severance tax on natural gas and 4.6% tax on oil and condensate. Using yearlong production data for non Marcellus Shale wells in Pennsylvania and the average wellhead price of gas and price per barrel of liquid hydrocarbons for 2010, I estimated that non-Marcellus wells would have brought in $72.5 million if we taxed our resources just like Texas does. What’s more, based on six month production data, I showed that the wells in the Marcellus Shale formation would produce at least $173 million, for a statewide total of $246 million through all formations.

But that was before the bottom fell out of the price of oil and gas. What if we used today’s low prices as a guide?


Estimated six month severance tax from the Marcellus Shale formation in Pennsylvania.

Even with the low energy prices, that six month total is almost as much as Corbett’s administration figures to raise in a year, and it doesn’t even include the tens of thousands of wells that aren’t drilled into the Marcellus Shale.

While the proposed impact fee does more for Pennsylvania than the current nothing-at-all policy, in the scheme of things, it is a great deal for the drilling industry.

And one final aside: does it seem strange to anyone else to let the counties set the impact fee? Is this some sort of attempt to have them compete with each other to keep the prices low? If so, it seems unlikely to work in my opinion. If a county charges the maximum $40,000, that represents only about 0.8 percent of cost of a well that costs $5 million to drill, and that figure is on the low end of the spectrum. The drilling companies will want to drill where the resources are, and whatever fees or taxes are charged will not change that fact.

If It’s Unsuitable For Mining, Is Drilling Advisable?

There are a handful of watersheds, predominantly in central Pennsylvania, that the Department of Environmental Protection has deemed to be unsuitable for mining activities.

According to pages 100-101 of the Oil and Gas Operator’s Manual, a region may be determined to be unsuitable for mining if the mining operation will:

  1. be incompatible with existing State or local land use plans or programs;
  2. affect fragile or historic lands in which such operations could result in significant
    damage to important historic, cultural, scientific and esthetic values and natural
    systems;
  3. affect renewable resource lands in which such operations could result in a
    substantial loss or reduction of long-range productivity of water supply or of
    food or fiber products, and such lands to include aquifers and aquifer recharge
    areas; or
  4. affect natural hazard lands in which such operations could substantially
    endanger life and property, such lands to include areas subject to frequent
    flooding and areas of unstable geology.

Marcellus Shale Permits in Areas Unsuitable for Mining (large)
Marcellus Shale permits that were issued in areas which were deemed to be “unsuitable for mining” according to the PA DEP in 2002.

These seem like worthy goals. So if these areas are unsuitable for coal mining, why is it OK to put gas wells there?


Surface coal mine. Source: http://en.wikipedia.org/wiki/File:Coal_mine_Wyoming.jpg

Granted, drilling a well is not quite the same impact as a surface mining operation, but to protect an area from one mode of mineral extraction and not the other seems inconsistent. After all, many of the problems with coal are still relevant for gas drilling, since the drilling operator must go through the coal seam to get to the gas. The pyrite associated with the coal is still exposed to air, meaning that the drilling mud and drill cuttings probably contain sulfuric acid, the key component of acid mine drainage (AMD).

And it’s not just the drill cuttings that could be a source of problems…it could be the well bore itself. Consider the Hughes Bore Hole, which, according to Wikipedia was drilled in the 1920’s to drain underground mines in the area, then capped in the 1950’s. So what’s the big deal? In the 1970’s, pressure built up and the hole burst open, and has been spewing about 800 gallons per minute of acid mine drainage ever since.


Hughes Bore Hole releasing acid mine drainage. Source: http://en.wikipedia.org/wiki/File:Hughe%27s_Bore_Hole_071.jpg

Could drilling a gas well in the wrong place have the same effect?

Maybe to be safe we ought not drill in areas where geologists have determined that AMD could exist. That wouldn’t affect that many wells, would it?

MS Permits in Areas With AMD Potential (large)
Marcellus Shale permits in areas with acid mine drainage potential. Please click the map for a dynamic view and more information.

Oh. Well then let’s hope the well casing experts don’t have any bad days.

[Note: if you want to watch a video of Hughes Bore Hole and don’t mind salty language, click the Youtube link on the “Hughes Well Bore” link above.]