Guest authors Sam Stearns and Tabitha Tripp dive into the complex history of resource extraction in Southern Illinois. Drawing on personal experience and the work of community organizers, they reveal the threats posed by fracking, the failures of regulatory agencies, and the urgent need for environmental justice.
https://www.fractracker.org/a5ej20sjfwe/wp-content/uploads/2025/02/49727923413_5d7b7335a0_k.jpg6211500Guest Authorhttps://www.fractracker.org/a5ej20sjfwe/wp-content/uploads/2025/09/2025-Wordmark-Logo.pngGuest Author2025-01-31 14:52:292025-02-03 15:59:13Regulatory Gaps and Resistance: The Battle Over Fracking in Southern Illinois
FracTracker Alliance and Great Plains Action Society have launched an environmental justice mapping tool to support Indigenous communities in their resistance against CO2 pipelines.
https://www.fractracker.org/a5ej20sjfwe/wp-content/uploads/2024/10/No-CO2-Ppelines-Sioux-City.jpg6721012Gwen Klenkehttps://www.fractracker.org/a5ej20sjfwe/wp-content/uploads/2025/09/2025-Wordmark-Logo.pngGwen Klenke2024-10-22 11:55:082024-10-25 12:10:00Indigenous Communities’ Fight Against CO2 Pipelines in the Great Plains
By Ted Auch, PhD, Great Lakes Program Coordinator and Shannon Smith, Manager of Communications & Development
The oil and gas industry continues to use rhetoric focusing on national security and energy independence in order to advocate for legislation to criminalize climate activists. Backlash against protestors and environmental stewards has only increased since the onset of COVID-19, suggesting that industry proponents are exploiting this public health crisis to further their own dangerous and controversial policies.[1]
Industry actors contributing to the wave of anti-protest bills include American Petroleum Institute (API), IHS Markit, The American Fuel & Petrochemical Manufacturers (AFPM), and most effectively, the American Legislative Exchange Council (ALEC), by way of its primary financial backer, Koch Industries (Fang, 2014, Shelor, 2017).
ALEC is the source of the model legislation “Critical Infrastructure Protection Act” of 2017, intended to make it a felony to “impede,” “inhibit,” “impair,” or “interrupt” critical infrastructure operation and/or construction. Close approximations – if not exact replicas – of this legislative template have been passed in 11 hydrocarbon rich and/or pathway states, and 8 more are being debated in 4 additional states.
The “critical infrastructure” designation in ALEC’s “Critical Infrastructure Protection Act” is extremely broad, including over 70 pieces of infrastructure, from wastewater treatment and well pads, to ports and pipelines. However, along with the 259 Foreign Trade Zones (FTZ) (Figures 1 and 4) supervised by US Customs and Border Protection (CBP), security is of such importance because over 50% of this infrastructure is related to oil and gas. According to our analysis, there are more than 8,000 unique pieces of infrastructure that fall under this designation, with over 10% in the Marcellus/Utica states of Ohio, West Virginia, and Pennsylvania. See Figure 1 for the number of FTZ per state.
Regarding FTZ, the US Department of Homeland Security doesn’t attempt to hide their genuine nature, boldly proclaiming them “… the United States’ version of what are known internationally as free-trade zones … to serve adequately ‘the public interest’.” If there remains any confusion as to who these zones are geared toward, the US Department of Commerce’s International Administration (ITA) makes the link between FTZ and the fossil fuel industry explicit in its FTZ FAQ page, stating “The largest industry currently using zone procedures is the petroleum refining industry.” (Figure 2)
Figure 1. Number of Foreign-Trade Zones (FTZ) by state as of June 2020.
Figure 2. Foreign-Trade Zone (FTZ) Board of Actions in Zones 87 in Lake Charles, LA, 115-117 in and around Port Arthur, TX, and 122 in Corpus Christi, TX. (click on the images to enlarge)
Foreign-Trade Zone (FTZ) Board of Actions in Zone 87 in Lake Charles, Louisiana
Foreign-Trade Zone (FTZ) Board of Actions in Zones 115-117 in and around Port Arthur, Texas
Foreign-Trade Zone (FTZ) Board of Actions in Zone 122 in Corpus Christi, Texas
Much of the oil, gas, and petrochemical industries’ efforts stem from the mass resistance to the Dakota Access Pipeline (DAPL). Native American tribes and environmental groups spent months protesting the environmentally risky $3.78 billion dollar project, which began production in June 2017, after Donald Trump signed an executive order to expedite construction during his first week in office. The Standing Rock Sioux tribe also sued the US government in a campaign effort to protect their tribal lands. The world watched as Energy Transfer Partners (ETP), the company building the pipeline, destroyed Native artifacts and sacred sites, and as police deployed tear gas and sprayed protesters with water in temperatures below freezing.
ETP’s bottom line and reputation were damaged during the fight against DAPL. Besides increasingly militarized law enforcement, the oil and gas industry has retaliated by criminalizing similar types of protests against fossil fuel infrastructure. However, the tireless work of Native Americans and environmental advocates has resulted in a recent victory in March 2020, when a federal judge ordered a halt to the pipeline’s production and an extensive new environmental review of DAPL.
Just days ago, on July 6, 2020, a federal judge ruled that DAPL must shut down until further environmental review can assess potential hazards to the landscape and water quality of the Tribe’s water source. This is certainly a victory for the Standing Rock Sioux Tribe and other environmental defenders, but the decision is subject to appeal.
Since the DAPL conflict began, the industry has been hastily coordinating state-level legislation in anticipation of resistance to other notable national gas transmission pipelines, more locally concerning projects like Class II Oil and Gas Waste Injection Wells, and miles of gas gathering pipelines that transport increasing streams of waste – as well as oil and gas – to coastal processing sites.
The following “critical infrastructure” bills have already been enacted:
STATE
BILL
TITLE
DATE PASSED
West Virginia
HB 4615
NEW PENALTIES FOR PROTESTS NEAR GAS AND OIL PIPELINES
3/25/20
South Dakota
SB 151
NEW PENALTIES FOR PROTESTS NEAR PIPELINES AND OTHER INFRASTRUCTURE
3/18/20
Kentucky
HB 44
NEW PENALTIES FOR PROTESTS NEAR PIPELINES AND OTHER INFRASTRUCTURE
3/16/20
Wisconsin
AB 426
NEW PENALTIES FOR PROTESTS NEAR GAS AND OIL PIPELINES
11/21/19
Missouri
HB 355
NEW PENALTIES FOR PROTESTS NEAR GAS AND OIL PIPELINES
7/11/19
Texas
HB 3557
NEW CRIMINAL AND CIVIL PENALTIES FOR PROTESTS AROUND CRITICAL INFRASTRUCTURE
6/14/19
Tennessee
SB 264
NEW PENALTIES FOR PROTESTS NEAR GAS AND OIL PIPELINES
5/10/19
Indiana
SB 471
NEW PENALTIES FOR PROTESTS NEAR CRITICAL INFRASTRUCTURE
5/6/19
North Dakota
HB 2044
HEIGHTENED PENALTIES FOR PROTESTS NEAR CRITICAL INFRASTRUCTURE
4/10/19
Louisiana
HB 727
HEIGHTENED PENALTIES FOR PROTESTING NEAR A PIPELINE
5/30/18
Oklahoma
HB 1123
NEW PENALTIES FOR PROTESTS NEAR CRITICAL INFRASTRUCTURE
5/3/17
There are an additional eight bills proposed and under consideration in these six states:
STATE
PENDING
TITLE
DATE PROPOSED
Louisiana
HB 197
NEW PENALTIES FOR PROTESTS NEAR CRITICAL INFRASTRUCTURE
2/24/20
Minnesota
HF 3668
NEW PENALTIES FOR PROTESTS NEAR GAS AND OIL PIPELINES
2/24/20
Mississippi
HB 1243
NEW PENALTIES FOR PROTESTS NEAR CRITICAL INFRASTRUCTURE
2/19/20
Alabama
SB 45
NEW PENALTIES FOR PROTESTS NEAR GAS AND OIL PIPELINES
2/4/20
Minnesota
HF 2966
NEW PENALTIES FOR PROTESTS NEAR OIL AND GAS PIPELINES
1/31/20
Minnesota
SF 2011
NEW PENALTIES FOR PROTESTS NEAR GAS AND OIL PIPELINES
3/4/19
Ohio
SB 33
NEW PENALTIES FOR PROTESTS NEAR CRITICAL INFRASTRUCTURE
2/12/19
Illinois
HB 1633
NEW PENALTIES FOR PROTESTS NEAR CRITICAL INFRASTRUCTURE
1/31/19
Desperate Backlash Against Peaceful Protest
Activists and organizations like the American Civil Liberties Union (ACLU) are framing their opposition to such legislation as an attempt to stave off the worst Orwellian instincts of our elected officials, whether they are in Columbus or Mar-a-Lago. On the other hand, industry and prosecutors are framing these protests as terroristic acts that threaten national security, which is why sentencing comes with a felony conviction and up to ten years in prison. The view of the FBI’s deputy assistant director and top official in charge of domestic terrorism John Lewis is that, “In recent years, the Animal Liberation Front and the Earth Liberation Front have become the most active, criminal extremist elements in the United States … the FBI’s investigation of animal rights extremists and ecoterrorism matters is our highest domestic terrorism investigative priority.”
It shocked many when last week, two protesters in the petrochemical-laden “Cancer Alley” region of Louisiana were arrested and charged under the state’s felony “terrorist” law. Their crime? Placing boxes of nurdles – plastic pellets that are the building blocks of many single-use plastic products – on the doorsteps of fossil fuel lobbyists’ homes. To make matters more ridiculous, the nurdles were illegally dumped by the petrochemical company Formosa Plastics.[2] This is outrageous indeed, but is the sort of legally-sanctioned oppression that fossil fuel industry lobbyists have been successfully advocating for years.
American Fuel & Petrochemical Manufacturers (AFPM) stated in a letter of support for ALEC’s legislative efforts:
“In recent years, there has been a growing and disturbing trend of individuals and organizations attempting to disrupt the operation of critical infrastructure in the energy, manufacturing, telecommunications, and transportation industries. Energy infrastructure is often targeted by environmental activists to raise awareness of climate change and other perceived environmental challenges. These activities, however, expose individuals, communities, and the environment to unacceptable levels of risk, and can cause millions of dollars in damage … As the private sector continues to expand and maintain the infrastructure necessary to safely and reliably deliver energy and other services to hundreds of millions of Americans, policymakers should continue to consider how they can help discourage acts of sabotage … Finally, it will also hold organizations both criminally and vicariously liable for conspiring with individuals who willfully trespass or damage critical infrastructure sites.”
Those organizations deemed ‘criminally and vicariously liable’ would in some states face fines an order of magnitude greater than the actual individual, which would cripple margin-thin environmental groups around the country, and could amount to $100,000 to $1,000,000. The AFPM’s senior vice president for federal and regulatory affairs Derrick Morgan referred to these vicarious organizations as “inspiring … organizations who have ill intent, want to encourage folks to damage property and endanger lives …”
One of the most disturbing aspects of this legislation is that it could, according to the testimony and additional concerns of ACLU of Ohio’s Chief Lobbyist Gary Daniels, equate “‘impeding’ and ‘inhibiting’ the ‘operations’ of a critical infrastructure site” with acts as innocuous as Letters to the Editor, labor strikes or protests, attending and submitting testimony at hearings, or simply voicing your concern or objections to the validity of industry claims and its proposals with emails, faxes, phone calls, or a peaceful protest outside critical infrastructure that raises the concern of site security. Mr. Daniels noted in his additional written testimony that the latter, “may prove inconvenient to the site’s staff, under SB 250 they would be an F3 [Third Degree Felony], and that is without someone even stepping foot on or near the property, as physical presence is not required to be guilty of criminal mischief, as found in/defined in Sec. 2907.07(A)(7) of the bill.”
Figure 3. A rally held by the Louisiana-based nonprofit RISE St. James.
This connection, when enshrined into law, will have a chilling effect on freedom of speech and assembly, and will stop protests or thoughtful lines of questioning before they even start. As the Ohio Valley Environmental Coalition (OVEC) put it in their request for residents to ask the governor to veto the now-enacted HB 4615, such a bill is unnecessary, duplicative, deceitful, un-American, unconstitutional, and “will further crowd our jails and prisons.”
To combat such industry-friendly legislation that erodes local government control in Ohio, lawmakers like State Senator Nikki Antonio are introducing resolutions like SR 221, which would, “abolish corporate personhood and money-as-speech doctrine” made law by the Supreme Court of the United States’ rulings in Citizens United v. FEC and Buckley v. Valeo. After all, the overarching impact of ALEC’s efforts and those described below furthers privatized, short-term profit and socialized, long-term costs, and amplifies the incredibly corrosive Citizen’s United decision a little over a decade ago.
Further Criminalization of Protest, Protections for Law Enforcement
Simultaneously, there is an effort to criminalize protest activities through “riot boosting acts,” increased civil liability and decreased police liability, trespassing penalties, and new sanctions for protestors who conceal their identities (by wearing a face mask, for example).
The following bills have already been enacted:
STATE
BILL
TITLE
DATE PASSED
South Dakota
SB 189
EXPANDED CIVIL LIABILITY FOR PROTESTERS AND PROTEST FUNDERS
3/27/19
West Virginia
HB 4618
ELIMINATING POLICE LIABILITY FOR DEATHS WHILE DISPERSING RIOTS AND UNLAWFUL ASSEMBLIES
3/10/18
North Dakota
HB 1426
HEIGHTENED PENALTIES FOR RIOT OFFENCES
2/23/17
North Dakota
HB 1293
EXPANDED SCOPE OF CRIMINAL TRESPASS
2/23/17
North Dakota
HB 1304
NEW PENALTIES FOR PROTESTERS WHO CONCEAL THEIR IDENTITY
2/23/17
In addition, the following bills have been proposed and are under consideration:
STATE
PENDING
TITLE
DATE PROPOSED
Rhode Island
H 7543
NEW PENALTIES FOR PROTESTERS WHO CONCEAL THEIR IDENTITY
2/12/20
Oregon
HB 4126
HARSH PENALTIES FOR PROTESTERS WHO CONCEAL THEIR IDENTITY
1/28/20
Tennessee
SB 1750
NEW PENALTIES FOR PROTESTERS WHO CONCEAL THEIR IDENTITY
1/21/20
Ohio
HB 362
NEW PENALTIES FOR PROTESTERS WHO CONCEAL THEIR IDENTITY
10/8/19
Pennsylvania
SB 887
NEW PENALTIES FOR PROTESTS NEAR “CRITICAL INFRASTRUCTURE”
10/7/19
Massachusetts
HB 1588
PROHIBITION ON MASKED DEMONSTRATIONS
1/17/19
All the while, the Bundy clan of Utah pillage – and at times – hold our public lands hostage, and white male Michiganders enter the state capital in Lansing armed for Armageddon, because they feel that COVID-19 is a hoax. We imagine that it isn’t these types of folks that West Virginia State Representatives John Shott and Roger Hanshaw had in mind when they wrote and eventually successfully passed HB 4618, which eliminated police liability for deaths while dispersing riots and unlawful assemblies.
Contrarily, South Dakota’s SB 189, or “Riot Boosting Act,” was blocked by the likes of US District Judge Lawrence L. Piersol, who wrote:
“Imagine that if these riot boosting statutes were applied to the protests that took place in Birmingham, Alabama, what might be the result? … Dr. King and the Southern Christian Leadership Conference could have been liable under an identical riot boosting law.”
FracTracker collaborated with Crude Accountability on a report documenting increasing reprisals against environmental activists in the US and Eurasia. Read the Report.
Figure 4. Photo of US Treasury Department signage outlining the warning associated with BP’s Whiting, IN, oil refinery designated a Foreign Trade Zone (FTZ). Photo by Ted Auch July 15th, 2015
In all fairness to Mr. Emanuel, he was referring to the Obama administration’s support for the post-2008 bipartisan Wall Street bailout. However, it is critical that we acknowledge the push for critical infrastructure legislation has been most assuredly bipartisan, with Democratic Governors in Kentucky, Louisiana, and Wisconsin signing into law their versions on March 16th of this year, in May of 2018, and in November of 2019, respectively.
Related Legislation in Need of Immediate Attention
In Columbus, Ohio, there are several pieces of legislation being pushed in concert with ALEC-led efforts. These include the recently submitted HB 362, that would “create the crime of masked intimidation.” Phil Plummer and George F. Lang sponsor the bill, with the latter being the same official who introduced HB 625, a decidedly anti-local control bill that would preempt communities from banning plastic bags. Most of the general public and some of the country’s largest supermarket chains have identified plastic bag bans as a logical next step as they wrestle with their role in the now universally understood crimes plastics have foisted on our oceans and shores. As Cleveland Scene’s Sam Allard wrote, “bill mills” and their willing collaborators in states like Ohio cause such geographies to march “boldly, with sigils flying in the opposite direction” of progress, and a more renewable and diversified energy future.
With respect to Plummer and Lang’s HB 362, two things must be pointed out:
1) It is eerily similar to North Dakota’s HB 1304 that created new penalties for protestors who conceal their identity, and
So, when elected officials as far away as Columbus copy and paste legislation passed in the aftermath of the DAPL resistance efforts, it is clear the message they are conveying, and the audience(s) they are trying to intimidate.
Plummer and Lang’s HB 362 would add a section to the state’s “Offenses Against the Public Peace,” Chapter 2917, that would in part read:
No person shall wear a mask or disguise in order to purposely do any of the following:
(A) Obstruct the execution of the law;
(B) Intimidate, hinder, or interrupt a person in the performance of the person’s legal duty; or
(C) Prevent a person from exercising the rights granted to them by the Constitution or the laws of this state.
Whoever violates this proposed section is guilty of masked intimidation. Masked intimidation is a first degree misdemeanor. It was critical for the DAPL protestors to protect their faces during tear gas and pepper spray barrages, from county sheriffs and private security contractors alike.
At the present moment, masks are one of the few things standing between COVID-19 and even more death. Given these realities, it is stunning that our elected officials have the time and/or interest in pushing bills such as HB 362 under the thin veil of law and order.
But judging by what one West Virginia resident and former oil and gas industry draftsman,[3] wrote to us recently, elected officials do not really have much to lose, given how little most people think of them:
“Honestly, it doesn’t seem to matter what we do. The only success most of us have had is in possibly slowing the process down and adding to the cost that the companies incur. But then again, the increase in costs probably just gets passed down to the consumers. One of the biggest drawbacks in my County is that most, if not all, of the elected officials are pro drilling. Many of them have profited from it.”
The oil, gas, and petrochemical industries are revealing their weakness by scrambling to pass repressive legislation to counteract activists. But social movements around the world are determined to address interrelated social and environmental issues before climate chaos renders our planet unlivable, particularly for those at the bottom of the socioeconomic ladder. We hope that by shining a light on these bills, more people will become outraged enough to join the fight against antidemocratic legislation.
This is Part I of a two-part series on concerning legislation related to the oil, gas, and petrochemical industries. Part II focuses on bills that would weaken environmental regulations in Ohio, Michigan, and South Dakota.
By Ted Auch, PhD, Great Lakes Program Coordinator and Shannon Smith, Manager of Communications & Development
[1] See Naomi Klein’s concept of the Shock Doctrine for similar trends.
[2] The community-based environmental organization RISE St. James has been working tirelessly to prevent Formosa Plastics from building one of the largest petrochemical complexes in the US in their Parish. Sharon Lavigne is a leading member of RISE St. James, and is an honored recipient of the 2019 Community Sentinel Award for Environmental Stewardship. Read more on Sharon’s work with RISE St. James here.
[3] This individual lives in Central West Virginia, and formerly monitored Oil & Gas company assets in primarily WV, PA, NY, VA, MD & OH, as well as the Gulf Coast. Towards the end of this individual’s career, they provided mapping support for the smart pigging program, call before you dig, and the pipeline integrity program.
FracTracker Alliance has released a new national map, filled with energy and petrochemical data. Explore the map, continue reading to learn more, and see how your state measures up!
This map has been updated since this blog post was originally published, and therefore statistics and figures below may no longer correspond with the map
The items on the map (followed by facility count in parenthesis) include:
For oil and gas wells, view FracTracker’s state maps.
Transportation & Storage
Natural gas compressor stations (1,367) – Facilities built along a pipeline route that pressurize natural gas to keep it flowing through the pipeline.
Crude oil rail terminals (94) – Rail terminals that load and unload crude oil (liquid hydrocarbons that have yet to be processed into higher-value petroleum products).
Liquefied natural gas import/export terminals (8) – Facilities that can a) liquefy natural gas so it can be exported as LNG (liquefied natural gas) and/or b) re-gasify LNG so it can be used as natural gas. Natural gas is transported in a liquid state because it takes up less space as a liquid than as a gas.
Natural Gas Underground Storage (486) – Locations where natural gas is stored underground in aquifers, depleted gas fields, and salt formations.
Petroleum Product Terminals (1,484) – Terminals with a storage capacity of 50,000 barrels or more and/or the ability to receive volumes from tanker, barge, or pipeline. Petroleum products include products “produced from the processing of crude oil and other liquids at petroleum refineries, from extraction of liquid hydrocarbons at natural gas processing plants, and from production of finished petroleum products at blending facilities.”
Petroleum Ports (242) – A port that can import and/or export 200,000 or more short tons of petroleum products a year.
Natural gas import/export pipeline facility (54) – A facility where natural gas crosses the border of the continental United States.
Pipelines
Crude oil pipelines – major crude oil pipelines, including interstate truck lines and selected intrastate lines, but not including gathering lines.
Natural gas liquid pipelines – Also referred to as hydrocarbon gas liquid pipelines, they carry the heavier components of the natural gas stream which are liquid under intense pressure and extreme cold, but gas in normal conditions.
Natural gas pipelines– Interstate and intrastate natural gas pipelines. Due to the immensity of this pipeline network and lack of available data, this pipeline layer in particular varies in degree of accuracy.
Petroleum Product Pipelines – Major petroleum product pipelines.
Recent Pipeline Projects – Pipeline projects that have been announced since 2017. This includes projects in various stages, including under construction, complete, planned or canceled. Click on the pipeline for the status.
Processing & Downstream
Natural Gas Processing Plants (478) – Plants that separate impurities and components of the natural gas stream.
Chemical plants (36) – Includes two types of chemical plants – petrochemical production and ammonia manufacturing – that report to EPA’s Greenhouse Gas Reporting Program.
Ethylene Crackers (30) – Also referred to as ethane crackers, these petrochemical complexes that converts ethane (a natural gas liquid) into ethylene. Ethylene is used to make products like polyethylene plastic.
Petroleum Refineries (135) – A plant that processes crude oil into products like petroleum naphtha, diesel fuel, and gasoline.
Power Plants (9,414) – Electric generating plants with a capacity of at least one megawatt, sorted by energy source.
Wind Turbines (63,003) – Zoom in on wind power plants to see this legend item appear.
Natural Resources
Shale Plays (45) – Tight oil and gas shale plays, which are formations where oil and gas can be extracted.
Major Rivers
Solar Energy Potential – Potential solar energy generation, in kilowatt-hours per square meter per day – averaged annually.
This map is by no means exhaustive, but is exhausting. It takes a lot of infrastructure to meet the energy demands from industries, transportation, residents, and businesses – and the vast majority of these facilities are powered by fossil fuels. What can we learn about the state of our national energy ecosystem from visualizing this infrastructure? And with increasing urgency to decarbonize within the next one to three decades, how close are we to completely reengineering the way we make energy?
Key Takeaways
Natural gas accounts for 44% of electricity generation in the United States – more than any other source. Despite that, the cost per megawatt hour of electricity for renewable energy power plants is now cheaper than that of natural gas power plants.
The state generating the largest amount of solar energy is California, while wind energy is Texas. The state with the greatest relative solar energy is not technically a state – it’s D.C., where 18% of electricity generation is from solar, closely followed by Nevada at 17%. Iowa leads the country in relative wind energy production, at 45%.
The state generating the most amount of energy from both natural gas and coal is Texas. Relatively, West Virginia has the greatest reliance on coal for electricity (85%), and Rhode Island has the greatest percentage of natural gas (92%).
With 28% of total U.S. energy consumption for transportation, many of the refineries, crude oil and petroleum product pipelines, and terminals on this map are dedicated towards gasoline, diesel, and other fuel production.
Petrochemical production, which is expected to account for over a third of global oil demand growth by 2030, takes the form of chemical plants, ethylene crackers, and natural gas liquid pipelines on this map, largely concentrated in the Gulf Coast.
Electricity generation
The “power plant” legend item on this map contains facilities with an electric generating capacity of at least one megawatt, and includes independent power producers, electric utilities, commercial plants, and industrial plants. What does this data reveal?
In terms of the raw number of power plants – solar plants tops the list, with 2,916 facilities, followed by natural gas at 1,747.
In terms of megawatts of electricity generated, the picture is much different – with natural gas supplying the highest percentage of electricity (44%), much more than the second place source, which is coal at 21%, and far more than solar, which generates only 3% (Figure 1).
Figure 1. Electricity generation by source in the United States, 2019. Data from EIA.
This difference speaks to the decentralized nature of the solar industry, with more facilities producing less energy. At a glance, this may seem less efficient and more costly than the natural gas alternative, which has fewer plants producing more energy. But in reality, each of these natural gas plants depend on thousands of fracked wells – and they’re anything but efficient.
The cost per megawatt hour of electricity for a renewable energy power plants is now cheaper than that of fracked gas power plants. A report by the Rocky Mountain Institute, found “even as clean energy costs continue to fall, utilities and other investors have announced plans for over $70 billion in new gas-fired power plant construction through 2025. RMI research finds that 90% of this proposed capacity is more costly than equivalent [clean energy portfolios, which consist of wind, solar, and energy storage technologies] and, if those plants are built anyway, they would be uneconomic to continue operating in 2035.”
The economics side with renewables – but with solar, wind, geothermal comprising only 12% of the energy pie, and hydropower at 7%, do renewables have the capacity to meet the nation’s energy needs? Yes! Even the Energy Information Administration, a notorious skeptic of renewable energy’s potential, forecasted renewables would beat out natural gas in terms of electricity generation by 2050 in their 2020 Annual Energy Outlook.
This prediction doesn’t take into account any future legislation limiting fossil fuel infrastructure. A ban on fracking or policies under a Green New Deal could push renewables into the lead much sooner than 2050.
In a void of national leadership on the transition to cleaner energy, a few states have bolstered their renewable portfolio.
Figure 2. Electricity generation state-wide by source, 2019. Data from EIA.
One final factor to consider – the pie pieces on these state charts aren’t weighted equally, with some states’ capacity to generate electricity far greater than others. The top five electricity producers are Texas, California, Florida, Pennsylvania, and Illinois.
Transportation
In 2018, approximately 28% of total U.S. energy consumption was for transportation. To understand the scale of infrastructure that serves this sector, it’s helpful to click on the petroleum refineries, crude oil rail terminals, and crude oil pipelines on the map.
Transportation Fuel Infrastructure. Data from EIA.
The majority of gasoline we use in our cars in the US is produced domestically. Crude oil from wells goes to refineries to be processed into products like diesel fuel and gasoline. Gasoline is taken by pipelines, tanker, rail, or barge to storage terminals (add the “petroleum product terminal” and “petroleum product pipelines” legend items), and then by truck to be further processed and delivered to gas stations.
China leads the world in this movement. In 2018, just over half of the world’s electric vehicles sales occurred in China. Analysts predict that the country’s oil demand will peak in the next five years thanks to battery-powered vehicles and high-speed rail.
In the United States, the percentage of electric vehicles on the road is small but growing quickly. Tax credits and incentives will be important for encouraging this transition. Almost half of the country’s electric vehicle sales are in California, where incentives are added to the federal tax credit. California also has a “Zero Emission Vehicle” program, requiring electric vehicles to comprise a certain percentage of sales.
We can’t ignore where electric vehicles are sourcing their power – and for that we must go back up to the electricity generation section. If you’re charging your car in a state powered mainly by fossil fuels (as many are), then the electricity is still tied to fossil fuels.
Petrochemicals
Many of the oil and gas infrastructure on the map doesn’t go towards energy at all, but rather aids in manufacturing petrochemicals – the basis of products like plastic, fertilizer, solvents, detergents, and resins.
Natural gas processing plants separate components of the natural gas stream to extract natural gas liquids like ethane and propane – which are transported through the natural gas liquid pipelines. These natural gas liquids are key building blocks of the petrochemical industry.
Ethane crackers process natural gas liquids into polyethylene – the most common type of plastic.
The chemical plants on this map include petrochemical production plants and ammonia manufacturing. Ammonia, which is used in fertilizer production, is one of the top synthetic chemicals produced in the world, and most of it comes from steam reforming natural gas.
As we discuss ways to decarbonize the country, petrochemicals must be a major focus of our efforts. That’s because petrochemicals are expected to account for over a third of global oil demand growth by 2030 and nearly half of demand growth by 2050 – thanks largely to an increase in plastic production. The International Energy Agency calls petrochemicals a “blind spot” in the global energy debate.
Petrochemical development off the coast of Texas, November 2019. Photo by Ted Auch, aerial support provided by LightHawk.
Investing in plastic manufacturing is the fossil fuel industry’s strategy to remain relevant in a renewable energy world. As such, we can’t break up with fossil fuels without also giving up our reliance on plastic. Legislation like the Break Free From Plastic Pollution Act get to the heart of this issue, by pausing construction of new ethane crackers, ensuring the power of local governments to enact plastic bans, and phasing out certain single-use products.
“The greatest industrial challenge the world has ever faced”
Mapped out, this web of fossil fuel infrastructure seems like a permanent grid locking us into a carbon-intensive future. But even more overwhelming than the ubiquity of fossil fuels in the US is how quickly this infrastructure has all been built. Everything on this map was constructed since Industrial Revolution, and the vast majority in the last century (Figure 3) – an inch on the mile-long timeline of human civilization.
Figure 3. Global Fossil Fuel Consumption. Data from Vaclav Smil (2017)
In fact, over half of the carbon from burning fossil fuels has been released in the last 30 years. As David Wallace Wells writes in The Uninhabitable Earth, “we have done as much damage to the fate of the planet and its ability to sustain human life and civilization since Al Gore published his first book on climate than in all the centuries—all the millennia—that came before.”
What will this map look like in the next 30 years?
A recent report on the global economics of the oil industry states, “To phase out petroleum products (and fossil fuels in general), the entire global industrial ecosystem will need to be reengineered, retooled and fundamentally rebuilt…This will be perhaps the greatest industrial challenge the world has ever faced historically.”
Is it possible to build a decentralized energy grid, generated by a diverse array of renewable, local, natural resources and backed up by battery power? Could all communities have the opportunity to control their energy through member-owned cooperatives instead of profit-thirsty corporations? Could microgrids improve the resiliency of our system in the face of increasingly intense natural disasters and ensure power in remote regions? Could hydrogen provide power for energy-intensive industries like steel and iron production? Could high speed rail, electric vehicles, a robust public transportation network and bike-able cities negate the need for gasoline and diesel? Could traditional methods of farming reduce our dependency on oil and gas-based fertilizers? Could zero waste cities stop our reliance on single-use plastic?
Of course! Technology evolves at lightning speed. Thirty years ago we didn’t know what fracking was and we didn’t have smart phones. The greater challenge lies in breaking the fossil fuel industry’s hold on our political system and convincing our leaders that human health and the environment shouldn’t be externalized costs of economic growth.
https://www.fractracker.org/a5ej20sjfwe/wp-content/uploads/2020/02/National-map-feature-3.png400900Erica Jacksonhttps://www.fractracker.org/a5ej20sjfwe/wp-content/uploads/2025/09/2025-Wordmark-Logo.pngErica Jackson2020-02-28 17:35:142022-05-02 15:21:42National Energy and Petrochemical Map
“The aeroplane has unveiled for us the true face of the earth.” by French writer and aviator Antoine de Saint-Exupéry author of Le Petit Prince (The Little Prince)
I always tell people that you can’t really understand or appreciate the enormity, heterogeneity, and complexity of the unconventional oil and gas industry’s impact unless you look at the landscape from the cockpit of a Cessna 172. This bird’s-eye-view allows you to see the grandeur and nuance of all things beautiful and humbling. Conversely, and unfortunately more to the point of what I’ve seen in the last year, a Cessna allows one to really absorb the extent, degree, and intensity of all things destructive.
I’ve had the opportunity to hop on board the planes of some amazing pilots like Dave Warner, a forester formerly of Shanks, West Virginia (Note: More on our harrowing West Virginia flight with Dave later!!), Tim Jacobson Esq. out of La Crosse, Wisconsin, northern Illinois retired commodity and tree farmer Doug Harford, and Target corporate jet pilot Fred Muskol out of the Twin Cities area of Minnesota.
Since joining FracTracker I’ve been fortunate to have completed nearly a dozen of these “morning flights” as I like to call them, and five of those have taken place since August 2017. I’m going to take the next few paragraphs to share what I’ve found in my own words and by way of some of the photos I think really capture how hydraulic fracturing, and all of its tentacles, has impacted the landscape.
The following is by no means an empirical illustration. I’m increasingly aware, however, that often times tables, charts, and graphs fail to capture much of the scale and scope of fossil fuel’s impact. Photos, if properly georeferenced and curated, are as robust a source of data as a spreadsheet or shapefile, both of which are the traditional coins of the realm here at FracTracker.
West Central Wisconsin Frac Sand Mines
August 2, 2017
Figure 1. Wisconsin and Winona, Minnesota silica sand mines, processing facilities, and related operations
It was nearly a year ago today that I met Bloomer, Wisconsin dairy farmer Ken Schmitt at the Chippewa Valley Regional Airport (KEAU) and soon thereafter jumped into Tim Jacobson’s Cessna 172 to get a bird’s-eye-view of the region’s many frac sand mines and their impacts (Figure 1). These sites are spread out over a 12-county region known as West Central Wisconsin (WCW). Ken hadn’t been up to see these mines since October of 2016 and was eager to see how they had “progressed,” knowing what he did about their impact on his neck of the woods in northern Chippewa County.
Ken is one of the smartest guys I’ve ever met, and – befitting a dairy farmer – he is also one of the most conservative and analytical folks I’ve ever met. However, that morning it was clear that his patience with county administrators and the frac sand mining industry had long since run out. He was tired of broken promises, their clear and ubiquitous bullying tactics, and a general sense that his livelihood and the farm he was hoping to leave his kids were at risk due to sand mining’s complete capture of WCW’s residents and administrators.
Meanwhile Mr. Jacobson Esq. was intimately familiar with some of the legal tools residents were using to fight the spread of sand mining in the WCW. This is something he referred to as “anticipatory nuisance” lawsuits, which he and his colleagues were pursuing on behalf of several landowners against OmniTrax’s (f/k/a Terracor) “sand mine, wet and dry processing, a conveyor system to a rail load out with manifest yard” proposal in Jackson County, Wisconsin. I, too, have worked with Tim to inform some of his legal work with respect to the nuisance stories and incidents I’ve documented in my travels, as well as research into the effects of sand mining across Michigan, Illinois, Minnesota, and Wisconsin.
Explore details from our sand mining tour by clicking on the images below:
Our flight lasted nearly 2.5 hours and stretched out over 4,522 square miles. It included nearly 20 sand mines – and related infrastructure – in the counties of Jackson, Wood, Clark, Eau Claire, Monroe, Trempealeau, and Buffalo. What we saw was a sizeable expansion of the mining complex in the region since the last time I flew the area – nearly four years earlier on October 8, 2013. The number and size of mines that had popped up since that trip were far greater than any of us had expected.
This expansion paralleled the relative – and total –increase in demand for “proppant” from the High Volume Hydraulic Fracturing (HVHF) all across the country (Figure 2).
Figure 2. A map of the likely destination for Wisconsin’s frac sand mines silica sand based on an analysis of Superior Silica Sand’s 2015 SEC 10Ks.
West Virginia Panhandle & Southeastern Ohio
January 26, 2018
On the morning of January 26th, I woke up on the west side of Cleveland thinking there was very little chance we were going to get up in the air for our flight with SouthWings’ pilot Dave Warner due to inclement weather. There was a part of me that was optimistic, however, so I decided to make the three hour drive down to the Marshall County Airport (KMPG) in Moundsville, West Virginia from Cleveland in the hopes that the “cold rain and snow” we’d been receiving was purely lake effect stuff and the West Virginia panhandle had not been in the path of the same cold front.
Marshall County, West Virginia Airport (KMPG) staff clearing the runway for our flight with SouthWings pilot Dave Warner, 1/26/2018
Unfortunately, when I arrived at the Moundsville airport I was wrong, and the runway was pretty slick around 8:00 a.m. However, the airport’s staff worked diligently to de-ice and plow the runway and by the time Dave Warner arrived from southern West Virginia conditions were ideal. The goal of this flight was two-fold:
Photograph some of the large-scale high-volume hydraulic fracturing (HVHF) infrastructure in the West Virginia counties of Doddridge, Wetzel, and Marshall owned and operated by MarkWest, and
Allegheny Front’s Julie Grant was doing a story on natural gas gathering pipeline’s impact on waterways, and more specifically the Hellbender Salamander (Cryptobranchus alleganiensis). She was looking to see the impacted landscape from the air.
Both of these goals were achieved efficiently and safely, with the resulting Allegheny Front piece receiving significant interest across multiple public radio and television platforms including PRI’s Living On Earth.
Explore details from our WV / OH tour by clicking on the images below:
On my return drive home that afternoon the one new thing that really resonated with me was the fact that hydraulic fracturing or fracking has come to be defined by 4-5 acre well pads across Appalachian, Texas, Oklahoma, and North Dakota. This is a myth, however, expertly perpetuated by the oil and gas industry and their talking shops. Fracking’s extreme volatility and quick declines in rates of return necessitate that this latest fossil fuel iteration install large pieces of infrastructure like compressor stations and cracking facilities. This all is to ensure timely movement of product from supply to demand and to optimize the “value added” products the global markets demand and plastics industry uses as their primary feedstocks. This large infrastructure was never mentioned at the outset of the shale revolution, and I would imagine if it had been there would be far more resistance.
The one old thing the trip reinforced was the omnipresence and sinuosity of natural gas gathering lines across extremely steep and forested Appalachian geographies. How these pipelines will hold up and what their hasty construction is doing to terrestrial and aquatic wildlife, not to mention humanity, is anyone’s guess; the data is just so darn bad.
Southeastern Ohio
March 5, 2018 – aka, The XTO Powhatan Point Well Pad Explosion Flight
Around 9 a.m. on Thursday, February 15, 2018, an explosion occurred at XTO’s Schnegg frack pad “as the company worked to frack a fourth well” in Powhatan Point, Belmont County, Ohio. Shortly thereafter, a two-mile Temporary Flight Restriction (TFR) was enacted by the Federal Aviation Administration (FAA) around the incident’s location. The TFR was supposed to lapse during the afternoon of March 5, however, due to complications at the site the TFR was extended to the evening of March 8.
We were antsy to see what we could see, so we caught an emergency flight with Dave Warner, only this time under the LightHawk umbrella. We left on the morning of March 5th out of the all too familiar[1]Carroll County-Tolson Airport (KTSO). Although we couldn’t get close to the site, there was a holler valley to the northwest of the pad that allowed us to capture a photo of the ongoing releases. Additionally, within several weeks we obtained by FOIA the raw Ohio State Trooper monitoring footage from their helicopter and posted this footage to our YouTube channel, where it has received 4,787 views since March 19, 2018. This type of web traffic is atypical for anything that doesn’t include kittens, the Kardashians, or the Kardashians’ kittens.
Explore details from our Southeastern Ohio tour by clicking on the images below:
Much like our flight in January the most salient points I got out of Dave’s plane thinking about were:
Astonishment regarding the number of gas gathering lines and the fact that they seem to have been installed with very little-to-no reclamation forethought. They are also installed during a time of year when – even if hydroseed is applied – it won’t grow, leaving plenty of chances for predictable spring rains to cause major problems for streams and creeks, and
It is a big plant, a very big plant and far bigger than other plants around here… What’s really amazing that we got it up and running in six months. No one believed that we could do that. – Momentum Midstream spokesman Eric Mize discussing their natural gas liquids-separating complex in Scio, Ohio.
LaSalle County, Illinois
May 24 & 26, 2018
Frac Sand Mines and The Nature Conservancy’s Nachusa Grasslands Buffalo Herd, Franklin Grove, Illinois
Fast forward to the week of May 21st of this year, and I was back in the frac sand capital to interview several folks that live near these mines or have been advocating for a more responsible industry. I conducted a “morning flight” with several journalists and county officials from neighboring Ottawa County.
LaSalle County is an extremely interesting case study for anyone even remotely interested in the food, energy, and water (FEW) conversation that has begun to receive significant attention in the age of the “Shale Revolution.” (Such focus is largely thanks to the extreme amounts of water required during the fracking process.) While LaSalle County has never experienced even a single HVHF permit, it is home to much of the prized silica or “proppant” the HVHF industry prizes. La Salle receives this recognition due to its location above one of the finest sources of silica sand: the St. Peter Sandstone formation. This situation has prompted a significant expansion in the permitting of new silica sand mines and expansion of existing mines throughout the county – from small townships like North Utica and Oglesby to Troy Grove 7 miles north on East 8th Road.
Meanwhile, LaSalle County is home to some of the most productive soils in the United States, due largely to the carbon sequestration capabilities of the tallgrass prairies that once dominated the region. In any given year, the county ranks in the top 5 nationally based on the amount of soybean and corn produced on a per-acre basis. According to an analysis of the most recent USDA agricultural census, total agricultural value in LaSalle County exceeds $175 million or seven times the national average by county of roughly $23 million.
Needless to say, the short-term extraction of silica sands in the name of “energy independence” stands to have a profound impact on long-term “food security” in the U.S. and worldwide. Sadly, this conflict is similar to the one facing the aforementioned West Central Wisconsin, home to similarly productive soils. The cows that feed on the forage those soils produce some of the highest quality dairy anywhere. (As an aside: both regions are facing the realities of their disproportionate support for Donald Trump and the effects his trade war will have on their economies.)
… vertical walls of moss-covered stone formed by glacial meltwater that slice dramatically through tree-covered sandstone bluffs. More than 13 miles of trails allow access to waterfalls, fed season runoff or natural springs, sandstone overhangs, and spectacular overlooks. Lush vegetation supports abundant wildlife, while oak, cedar and pine grow on drier, sandy bluff tops. – IL DNR
Starved Rock receives more than 2.5 million visitors annually, which is the most of any Illinois state park. However, it is completely surrounded by existing or proposed frac sand mines, including US Silica’s Covel Creek mine. US Silica even recently pitched an expansion to the doorstep of Starved Rock and future plans to nearly engulf the park’s perimeter. What such an expansion would do to the attractiveness of the park and its trickle down economic impact is debatable, but LaSalle County residents Paul Wheeler and photographer Michelle McCray took a stab at illustrating the value of the state park to residents for our audience back in August, 2016:
Our flight with LightHawk pilot and neighboring Mazon, Illinois retired farmer Doug Harford lifted off from Illinois Valley Regional Airport (KVYS) at around 9:00 a.m. local time on the morning of May 24th. We had perfect conditions for taking photos, with no clouds and a comfortable 70-75°F for the duration of a two-hour flight. We covered nearly 200 square miles and ten existing, abandoned, or permitted frac sand mines.
Explore details from our Illinois tour by clicking on the images below:
All passengers were struck by how large these mines were and how much several of the mines had expanded since the last time we all flew over them in June of 2016. The mines that had experienced the greatest rates of expansion were US Silica’s LaSalle Voss mine along Interstate 80 and the aforementioned Illinois River mine along with Fairmount Mineral’s major expansion, both in terms of infrastructure and actual mine footprint, in Wedron along the Fox River.
Figure 3. A map of the LaSalle County frac sand mines and associated St. Peter sandstone formation, along with the city of Chicago for some geographic perspective.
Most of this expansion is due to three critical distinguishing characteristics about the industry in LaSalle County:
The processing and export infrastructure (i.e., east-west rail) is in place and allows for mining to take place at times when other sand mining regions are mothballed,
Due to the large aggregation of parcels for farming purposes, companies can lease or outright purchase large amounts of land from relatively few landowners, and
Only the largest firms are active in the region, and with economies of scale they are not subject to the same types of shocks that smaller firms are when the price of oil collapses (like it did between June 2015 and February 2016). This means that the conflict will only be amplified in the coming months and years as the frac sand mining industry looks to supersede agriculture as LaSalle County’s primary economic driver.
However, all is not lost in North Central Illinois. This hope was stoked during our sojourn – and my subsequent trip in person – up to see The Nature Conservancy’s 3,600 acre preserve in Franklin Grove on the border of Lee and Ogle counties. As someone who is working hard to establish a small plot of prairie grasses and associated wildflowers at my home outside Cleveland, I was hoping to see what an established prairie looks like from the air. My primary goal, however, was to see what a healthy herd of native bison looks like.[2] The Nachusa bison are unique in that they came:
… from Wind Cave National Park in South Dakota and…Unlike most other American bison, animals from the Wind Cave herd have no history of cross-breeding with cattle. Bison from Wind Cave are the species’ most genetically pure and diverse specimens.
We were fortunate during our flight to have spotted the heard at the western edge of the preserve in what volunteer naturalist, Betty Higby, later told me the staff calls Oak Island. While I am not a person of faith, seeing these behemoths roaming freely and doing what 20-30 million of their ancestors used to do across much of North America moved me in a way I was not prepared for. I was immediately overwhelmed with a sense of awe and humility. How was I going to explain this beast’s former ubiquity and current novelty to my 5-year-old son, who shares a love of the North American Bison with me and would most certainly ask me what happened to this majestic creature?
Medina & Stark counties, Ohio NEXUS Pipeline flight
June 25, 2018
Ohio is currently home to 2,840 fracking permits, with 2,370 of these laterals having been drilled since September 2010. The growing concern around the fracking and petrochemicals conversation across much of the Midwest is the increasing number of FERC-permitted natural gas pipeline “proposals”[3] the industry is demanding it needs to maximize potential. Most residents in the path of these pipelines have strong objections to such development, citing the fact that imminent domain should not be invoked for corporate gain.
Much like all of the other patterns and processes we’ve documented and/or photographed at FracTracker, we felt that a flight over the latest FERC-approved pipeline – The NEXUS pipeline – would give us a better understanding of how this critical piece of infrastructure has altered the landscapes of Medina and Stark counties. Given the population density of these two northeastern Ohio counties, we also wanted to document the pipeline’s pathway with respect to urban and suburban centers.
Our flight on June 25th was delayed due to low clouds and last minute changes to the flight plan, but once we took off from Wadsworth Municipal Airport (3G3) with a local flight instructor it was clear that NEXUS is a pipeline that navigates a sinuous path in cities and townships like Green, Medina, Rittman, and Seville – coming dangerously close to thousands of homes and farms, as well as many schools and medical facilities.
Explore details from our NEXUS Pipeline tour by clicking on the images below:
Will this be the last FERC-approved pipeline to transverse Ohio in the name of “energy independence”? Will this pipeline and its brethren with names like the Utopia and ET Rover be monitored in real-time? If not, why? It is unfortunate, to say the least, that we so flippantly assume these pipelines are innocuous given their proximity to so many Ohioans. And, as if to add insult to injury, imminent domain is invoked. All this for a piece of oil and gas infrastructure that will profit companies on the global market, with only a fraction of the revenue returning to affected communities.
What’s Next?
I don’t know of a better way to understand the magnitude of these pipelines than flying over them at 1,000-1,500 feet, and I will continue to monitor and photograph oil and gas developments from the air with the assistance of amazing pilots like those affiliated with LightHawk and SouthWings.
To this end, I will be returning to West Central Wisconsin for yet another “morning flight” with the aforementioned La Crosse-area pilot and lawyer Tim Jacobson and frequent collaborator University of Wisconsin-Stout professor Tom Pearson.[4] Our flight plan will return us to the northern Wisconsin frac sand counties of Chippewa, Barron, Dunn, Eau Claire, and if we have time we’ll revisit the mines we photographed in August of last year. We’ve been told by Susan Bence, an environmental reporter out of Milwaukee Public Radio, that she is trying to convince the powers that be at NPR in Washington, DC that this is a story the entire country should hear about. Wish us luck!
Flyover Partners
By Ted Auch, Great Lakes Program Coordinator
Bird’s-Eye-View Endnotes
The first of my morning fracking flights was out of this airport back in June, 2012 along with the other passenger on this flight Paul Feezel of Carroll Concerned Citizens and David Beach of the Cleveland Museum of Natural History’s Green City Blue Lakes program.
The Conservancy initially brought at least 30 bison of different ages and genders to Nachusa. The bison graze on approximately 1,500 acres of the prairie and the site currently supports more than 120 bison according to site volunteer naturalist Betty Higby.
I put quotes around this word because in my travels across Ohio interviewing those in the path of these transmission pipelines it is clear that this is not the correct word because ‘proposals’ implies that these pipelines might not happen or are up for debate. Yet, neither could be further from the truth with most folks indicating that it was very clear very early in their interactions with FERC and the pipeline companies that there was never a chance that these pipelines were not going to happen with “imminent domain for private gain” being the common thread throughout my conversations.
Tom is the author of a recently published book on the topic “When the Hills Are Gone.”
https://www.fractracker.org/a5ej20sjfwe/wp-content/uploads/2018/07/Sand-Flyover-Feature.jpg400900Ted Auch, PhDhttps://www.fractracker.org/a5ej20sjfwe/wp-content/uploads/2025/09/2025-Wordmark-Logo.pngTed Auch, PhD2018-08-08 10:31:522021-04-15 14:57:41Documenting Fracking Impacts: A Yearlong Tour from a Bird’s-Eye-View
With the advent of hydraulic fracturing to increase production of oil and gas from tight geologic formations, such as shale, the demand for fracking sand (frac sand, or frack sand) has increased drastically in recent years. What does this process look like, you might ask. To help you understand this subsidiary of the oil and gas industry, we’ve compiled all of our frac sand photos into three albums on the topic.
Frac Sand Mining Photo Album
This album contains all of the photos we have amassed of frac sand mining and transportation operations – both from the ground and the sky.
All of these frac sand photos, and more, can also be found on our Energy Imagery page, organized by topic and also location.
If you have photos or videos that you would like to contribute to this growing collection of publicly available information, just email us at info@fractracker.org, along with where and when the imagery was taken, and by whom.
https://www.fractracker.org/a5ej20sjfwe/wp-content/uploads/2016/09/SandMining-Feature.jpg400900FracTracker Alliancehttps://www.fractracker.org/a5ej20sjfwe/wp-content/uploads/2025/09/2025-Wordmark-Logo.pngFracTracker Alliance2016-09-20 16:33:572021-04-15 15:04:26Frac Sand Photos Available on FracTracker.org
An Ottawa, IL resident’s letter to U.S. Silica regarding how the firm’s “frac” sand mines adjacent to Starved Rock State Park will alter the local economy.
Starved Rock State Park
As is so often the case, we find that those things we have taken most for granted are usually the things we miss most when they are gone. The list of what our nation has lost to industrial and commercial concerns couldn’t possibly be compiled in a single article. The short-sighted habits of economic progress have often led to long-term loss and ecologic disaster. That is why it took a man like Abraham Lincoln, a man of long-term vision and wisdom, to sign into existence our first national park, preserving for antiquity what surely would have been lost to our American penchant for development and overuse.
With that in mind, I have always found it amazing how the gears of our own local and state governments have continually chosen the economic path of least resistance and allowed the areas surrounding Starved Rock State Park to be ravaged and destroyed for what is, ultimately, minimal gain. I am no expert but I suspect it could be argued that a full 1/3 of LaSalle County’s economic engine is funded by the simple existence of Starved Rock State Park. Beyond the 2 million plus visitors to the park each year, it cannot be forgotten that nearly every municipality in LaSalle County has directly or indirectly benefited from the countless number of businesses that prosper from the magnetism of the park’s tranquil canyons.
As the 4-year battle with Mississippi Sand over development of the Ernat property has proved, there are many rational souls who truly acknowledge the importance of maintaining a healthy and productive park environment. With the recent sale of the Ernat property to U.S. Silica, we are again confronted with the prospect of irrational development of the eastern boundaries of Starved Rock State Park.
Given the gravity of these decisions, I would like to share a letter recently sent on behalf of many of those who have fought so hard and so long for preservation of that same eastern boundary. This letter was sent to Brian Shinn, CEO of U.S. Silica Holdings, INC. (SLCA) in Frederick, Maryland nearly a month ago, and we have yet to receive a response. In sharing this information on FracTracker’s website, I hope this letter will contribute to further discussion among our local representatives over a far more long-term vision of what LaSalle County wishes to be and what qualities, both environmental and economic, that it wishes to maintain and protect:
Letter to US Silica
Dear Mr. Shinn,
I am writing this letter on behalf of dozens of LaSalle County, Illinois residents who have, for the past several years, been intimately involved in the active pursuit of rational use and conservation of our local natural environment. As I am sure you are aware, the debate over use of the Ernat property as a functional sand mining operation has been a long and hard-fought battle. Years of litigation by the Sierra Club and other local environmental groups helped stall it’s development by Mississippi Sand, and have now led to the sale of the Ernat acreage to U.S. Silica. As irrational as the previous proposals were, the sale putting that acreage under your control has not lessened our concerns over the damaging use of that property as it relates to historic Highway 71 and the entire Starved Rock State Park area.
Obviously, sand mining operations have been a long-standing component of LaSalle County economics. Decades of mining under U.S. Silica supervision have not substantially reduced the quality of life for county residents or the natural environment as a whole. However, as can be specified by many local experts, the development and spoilage of the Ernat property will most certainly have longstanding and drastic impacts on both the ecology of Starved Rock State Park and the economic engine that it sustains. Starved Rock State Park attracts over 2 million visitors each year, with an estimated half million visitors using the Hwy. 71 entrance paralleling the Ernat farm as their main gateway into the park. The Ernat property’s river frontage has long been the tranquil eastern entry into the Illinois Canyon area, as well as an active nesting site for countless birds amidst bountiful wetlands and flat, open prairies. The Ernat property’s shared access to Horseshoe Creek has also made it essential to the entire Illinois Canyon ecosystem within the park. In short, any development of this property will most certainly have long-term negative impacts on both the economics and ecology of the Illinois River Basin.
In writing this letter, we are hoping that U.S. Silica, under your guidance, may consider the opportunity to preserve this indispensable parcel of land and examine ways in which U.S. Silica might make this land available as a gift or negotiated property to the state of Illinois. It would certainly be an important addition to the entire Starved Rock State Park area. I have included the signatures of many of our own local coalition. We hope you will consider the long-term impacts that this development would have to one of Illinois premier natural areas. Thank you.
Inspiring Action
I hope those who have signed this letter will be inspired to further action, and those who have not will reconsider their years of inaction. The natural heritage and local economies of our entire Illinois River Basin are depending on it.
Sincerely,
Paul Wheeler
Only when the last tree has died… and the last river been poisoned… and the last fish been caught… will we realize we cannot eat money.
https://www.fractracker.org/a5ej20sjfwe/wp-content/uploads/2016/08/StarvedRock-McCray-Feature.jpg400900Guest Authorhttps://www.fractracker.org/a5ej20sjfwe/wp-content/uploads/2025/09/2025-Wordmark-Logo.pngGuest Author2016-08-29 16:47:202020-03-11 16:46:26How Frac Sand Mining is Altering an Economy Dependent on Starved Rock State Park, IL
An Exploration of Sand Mining Impacts: Lasalle County, IL by way of Chicago’s South Side By Ted Auch, Great Lakes Program Coordinator
When it comes to high-volume hydraulic fracturing (HVHF), frac sand mining may be the most neglected aspect of the industry’s footprint. (HVHF demand on a per-well basis is increasing by 8% per year.)
To capture how this industry is changing several sand mining communities, I recently took a road trip to visit, photograph, and listen to the residents of this country’s primary frac sand areas. In total, I visited 7 sand mining communities in Illinois, Indiana, and Michigan.
This multimedia perspective is part of our ongoing effort to map and quantify the effects of silica sand mining on people, agriculture, wildlife, ecosystem services, and watersheds more broadly. Below is my attempt to give the FracTracker community a sense of what residents are hearing, seeing, and saying about the silica sand mining industry writ large.
Chicago’s South Side
Before heading to Illinois’ frac sand epicenter of Lasalle County, I couldn’t help but catch the South Shore Line out of Millennium Station. This station can be seen as you head south to the Hegewisch neighborhood on Chicago’s impoverished South Side, an area of greater Chicago-Gary, Indiana that has largely been forgotten by politicians in both states.
Figure 1. Average income per capita and Hardship Index (0-100 with 100 being the worst) for Chicago’s neighborhoods with Hegewisch highlighted in the city’s southeast corner.
This situation is a shame because collectively Hegewisch and the city of Whiting, IN are home to one of the largest – and getting larger – collections of oil refineries and oil sands infrastructure in the United States.
For an estimation of how difficult it is to live in various Chicago neighborhoods, see Figure 1, left.
This proliferation has not been without its dangers, including a compressor station explosion at BP PLC’s massive1 Whiting Refinery in August 2014. Unfortunately, that incident was just the latest in a long line of mishaps at this facility. The “operational incident,” as BP called it, rocked already stressed neighborhoods like MarkTown, IN – the aborted company town planned for steel maker Clayton Mark. MarkTown is on the National Register of Historic Places and is an example of a community that is being erased from the face of the earth in the name of Hydrocarbon Industrial Complex expansion. For those interested in architecture preservation, MarkTown’s rapid erasure is being conducted by BP itself and in the process we are losing an example of Conservatively Radical architect Howard Van Doren Shaw’s distinct English-style Tudor homes and urban planning. Residents speculate BP “may be buying up the properties because of concerns about liability.” The company counters they are just trying to create additional green space for residents.
Figure 2. Average daily oil refinery production per day across North America’s 152 Oil Refineries along with North American ports.
Luckily for everyone, operations following the aforementioned recent explosion were only “minimally impacted as a result of the incident and the refinery continue[d] to produce products for customers.” However, the more chronic concern is the tight supply-demand relationship between BP’s refinery and their Koch KCBX neighbor. Koch has made repeated headlines – and many neighbors turned enemies including the Southeast Environmental Task Force and its fearless leader Peggy Salazar – with its handling of the refinery’s annual production of 600,000 tons of petcoke a development Chicago Magazine called Mountains of Trouble. Petcoke is a byproduct of the refinery’s increased acceptance and processing of tar sands from Alberta Canada. Levels of production are likely to increase given BP’s completion in November 2014 of a “$4-billion revamp…to boost its intake of Canadian crude oil from 85,000 bpd to 350,000 bpd.”
Given how interconnected the hydrocarbon industry is, I thought it would be worth collecting some photos of the aforementioned infrastructure. When I saw that Koch KCBX’s terminal was also storing large amounts of silica sand, however, the connection between my next target(s) in LaSalle County was made even more obvious.
Lasalle County, Illinois is situated approximately 50-60 miles south-southwest of Chicago. When you try to compare demographics and commerce, however, it is worlds away.
Chicagoland encompasses nearly 10,900 square miles – 9.5 times the area of Lasalle County. While Chicago’s population is expanding by 95,681 people per year, LaSalle’s is shrinking by 2,734 per year (Table 1). Chicagoans, though not South Siders, are making more than two times that of LaSalle County residents (with the latter actually falling nearly $4,700 below the state average). Predictably the demographics of Chicago reflect more and more those of the US, while LaSalle is typical of rural America with a population that is 93% white and only 3.3% foreign born. Thirty-five percent of Chicagoans are likely to achieve a bachelor’s degree, while only 16% of LaSalle County residents are likely to do so. Rates of poverty and more specifically child poverty, on the other hand, are significantly higher in Chicago. Finally, LaSalle is one of the country’s preeminent farming counties; it ranks #4 in the state and #126 nationally thanks to the value of agricultural commodities produced amounting to $448.5 million net of farm subsidies. See Table 1.
Figure 3. La Salle County, IL Silica Sand Mines & St. Peter Sandstone Geology
The above contrast was made crystal clear as I traveled down Interstate 80 westbound towards exit 90 and LaSalle’s County seat Ottawa (pop. 18,562). Upon arriving in Ottawa I drove west on Madison Street to the first target of our expedition: U.S. Silica Company’s mine and processing facility at the corner of Madison Boyce Memorial Drive. Upon arriving, however, it became clear that I would not find a suitable location to photograph the company’s mine; the perimeter had been fenced off and mounded up to the tune of 10-15 feet. So I got back in our rental car and drove to the mine’s southern perimeter adjacent to the Bear Den Bar and Grill and the Vine St.-Fern St.-15th Ave. neighborhood where there was clear line of site. It was here that I got some of the best photos of the mine’s scale and scope with respect to land-use, reclamation, and hydrology.
Below is a sample of some of those images as well as several I took further down Route 34 between U.S. Silica’s active mine and a “reclaimed” Ottawa Silica Co. mine on the banks of the Illinois River.
After snapping several hundred shots of these two mines I headed to the I & M Canal State Trail between Utica and Ottawa emanating out of Buffalo Rock State Park and hiked east towards the Northern edge of U.S. Silica’s mine alongside a CSX railroad and recently constructed spur feeding into the mine’s loading terminal. The hope was that I would get a closer look at the mine but it turned out the angle was different but not better.
From the back of U.S. Silica’s Ottawa mine I traveled approximately 7 miles west to Unimin’s North Utica mine and a short dirt road off of 2803rd Road on the northern edge of the mine.
It was here that I photographed the mine’s reclamation plots, active mine pits, and developing water transport mechanisms. However, more importantly it was from here that I noticed off in the distance a bright red silica sand grain-size separator.
Curiously I did not – but do now – have this nascent and relatively small mine posted on our Frac Sands Mines and Related Facilities map at the time. Upon arriving at this site I found that the mine was owned and operated by a company called Northern White Sand a small mom & pop operation out of Utica, IL.
The photos I took of this mine were primarily from atop a vegetated berm to the southwest of the mine’s primary footprint. This vantage point allowed us to get some great shots of the types of infrastructure/equipment typical of this sized mine including the aforementioned modular grain-size separator, conveyor belts, retention ponds, and the pyramid-like piles of powdery white silica sand so desired by the HVHF industry.
Our final stop on the LaSalle County silica sand mine tour landed us in Troy Grove 13 miles north of North Utica by way of Interstate 39. It was here that I visited several vantage points around Technisand’s MBI Manley Bros. silica mine. The expanse included the site’s mixture of old and new processing infrastructure, what appeared to be an alluvial fan derived from sand waste and associated wetland, and the mine’s far reaches alongside a Chicago and North Western Transportation Company (CNW) railroad.
So now that I have outlined my tour of La Salle County I thought it would be helpful to share some of the stories residents told me during my travels and later by way of email.
Anna Mattes – La Salle County, IL
I live in LaSalle County, Illinois where I have prime farmland and Starved Rock State Park… the crown jewel of Illinois. I already have a fine farming industry and plenty of tourism as Starved Rock is visited by two million people annually. LaSalle County already has forty two quarries, gravel pits and sand mines. If I allow anymore the county will look as though it has been bombed. Empty sand pits will never produce food ever again. No amount of reclamation will restore this land to be productive…Each mine uses one million gallons of water daily. The LaSalle County Board has enlisted the USGS to do a hydrology study to determine how much water I have in our aquifer for municipalities and farming. Presently I have a moratorium in place on sand mines thru July 2016 and I hope forever. As a woman, wife and mother I am charged with the continuity of life. It is my job, profession, to raise healthy children, make a healthy breakfast and pack a nutritious lunch for my husband so he can do his job, and it generally falls to women to care for the elderly in families. With out clean air, pure water, healthy food what is the quality of life? Fracking is a dangerous business and I need to take better care of Planet Earth. Please do your part, I’m a Master Gardener and I’m doing my part.
Thomas Skomski – Wedron, IL
I am a resident of Wedron who has been severely impacted by Wedron Silica; and I want to report that there are many more problems associated with the influx of sand mines in LaSalle Co. than named in your recent article. In order to be fair to other residents who will be negatively affected by proximity to any sand mine I believe it is important to inform them and all concerned on the unmentioned problems associated with living near a sand mine. For example: the mountains of sand that are produced migrate everywhere the wind takes the particles. As I all know the winds are frequently fierce in this part of the country. One neighbor describes how in the morning when he sets his coffee cup down on his front porch and goes into his house to get the newspaper that he returns to find a layer of white sand covering his coffee. Another neighbor vacuums the sand off her living room rugs weekly while her husband regularly has to clean out sand-filled gutters. I do know that enabling pollutants on private property is technically criminal trespass. At the last EPA hearing in Wedron a retired mine employee admitted that Wedron Silica uses 100 million gallons of water per hour in sand processing. Some of this water is recycled. Since I have not confirmed those statistics, I prefer sticking to the fact that the mine has reversed the flow of the ground water. Who knows what the unseen consequences of that reversal might be? The toxic plume that Wedron Silica is in part responsible for creating migrates wherever the ground water moves. As a result of the threat of my well being poisoned my land, 23 acres has been devalued by the county to $1.00. All my five buildings are worth 40% of what they were before nine wells were poisoned in Wedron. Those wells were so toxic with benzene that water came out of the faucet orange and you could not breath it let alone use it to wash anything. Wedron Silica has begun buying homes in Wedron which will allow them to pursue their wealth with no concerns- BUT what about the water which I all know is in limited supply and susceptible to being polluted? So in summary, please include the human costs involved in a mine opening near you. My wife and I moved to the country to enjoy the solitude and quiet of living on a farm in our retirement years. The quality of our lives has been diminished, in addition the noise is disturbing; trains come in at all hours incessantly blowing their horns and the semi traffic is constant. Finally, I have heard a lot of what I consider negative criticism about the EPA. Having experienced this monumental problem directly it is perfectly clear to me that without the resources of a pro-environment organization I would be hard pressed to stand up to a corporation with multi billions in assets.
Ashley Williams – LaSalle County, IL
The nickname the “Silica Sand Capital of the World” has quickly transformed into a curse rather than a blessing for the citizens of LaSalle County, IL. Here, the frac sand industry continues to proliferate, endangering the health and safety of the people and local environment. Our precious life vessels: our air, water, and soil are under siege by a nexus of power that seeks to intimidate us into quiet submission, but I’ll be damned if I’m going to sit by and let that happen.
Stay Tuned
In Part 2 of this series, I will cover our frac sand tour in Michigan’s Monroe and Mason counties, where the aforementioned U.S. Silica along with Sargent Sand and Sylvania Minerals are making their presence felt in more ways than one.
Footnote
This facility alone processes nearly 2% of all oil in North America on a daily basis. This facility is the seventh-largest refinery in the United States and the largest outside of the Gulf Coast.
Many people ask us how many wells have been hydraulically fractured in the United States. It is an excellent question, but not one that is easily answered; most states don’t release data on well stimulation activities. Also, since the data are released by state regulatory agencies, it is necessary to obtain data from each state that has oil and gas data to even begin the conversation. We’ve finally had a chance to complete that task, and have been able to aggregate the following totals:
Oil and gas summary data of drilled wells in the United States.
While data on hydraulically fractured wells is rarely made available, the slant of the wells are often made accessible. The well types are as follows:
Directional: Directional wells are those where the top and the bottom of the holes do not line up vertically. In some cases, the deviation is fairly slight. These are also known as deviated or slant wells.
Horizontal: Horizontal wells are directional wells, where the well bore makes something of an “L” shape. States may have their own definition for horizontal wells. In Alaska, these wells are defined as those deviating at least 80° from vertical. Currently, operators are able to drill horizontally for several miles.
Directional or Horizontal: These wells are known to be directional, but whether they are classified as horizontal or not could not be determined from the available data. In many cases, the directionality was determined by the presence of directional sidetrack codes in the well’s API number.
Vertical: Wells in which the top hole and bottom hole locations are in alignment. States may have differing tolerances for what constitutes a vertical well, as opposed to directional.
Hydraulically Fractured: As each state releases data differently, it wasn’t always possible to get consistent data. These wells are known to be hydraulically fractured, but the slant of the well is unknown.
Not Fractured: These wells have not been hydraulically fractured, and the slant of the well is unknown.
Unknown: Nothing is known about the slant, stimulation, or target formation of the well in question.
Unknown (Shale Formation): Nothing is known about the slant or stimulation of the wells in question; however, it is known that the target formation is a major shale play. Therefore, it is probable that the well has been hydraulically fractured, with a strong possibility of being drilled horizontally.
Wells that have been hydraulically fractured might appear in any of the eight categories, with the obvious exception of “Not Fractured.” Categories that are very likely to be fractured include, “Horizontal”, “Hydraulically Fractured”, and “Unknown (Shale Formation),” the total of which is about 32,000 wells. However, that number doesn’t include any wells from Texas or Colorado, where we know thousands wells have been drilled into major shale formations, but the data had to be placed into categories that were more vague.
Oil and gas wells in the United States, as of February 2014. Location data were not available for Maryland (n=104), North Carolina (n=2), and Texas (n=303,909). To access the legend and other map tools, click the expanding arrows icon in the top-right corner.
The standard that we attempted to reach for all of the well totals was for wells that have been drilled but have not yet been plugged, which is a broad spectrum of the well’s life-cycle. In some cases, decisions had to be made in terms of which wells to include, due to imperfect metadata.
No location data were available for Maryland, North Carolina, or Texas. The first two have very few wells, and officials in Maryland said that they expect to have the data available within about a month. Texas location data is available for purchase, however such data cannot be redistributed, so it was not included on the map.
It should not be assumed that all of the wells that are shown in the map above the shale plays and shale basin layers are actually drilled into shale. In many cases, however, shale is considered a source rock, where hydrocarbons are developed, before the oil and gas products migrate upward into shallower, more conventional formations.
The raw data oil and gas data is available for download on our site in shapefile format.
https://www.fractracker.org/a5ej20sjfwe/wp-content/uploads/2014/03/US-ShaleViewer-Feature.jpg400900Matt Kelso, BAhttps://www.fractracker.org/a5ej20sjfwe/wp-content/uploads/2025/09/2025-Wordmark-Logo.pngMatt Kelso, BA2014-03-04 12:37:152020-07-21 10:41:55Over 1.1 Million Active Oil and Gas Wells in the US
Our latest Ohio-focused map shows the many companies involved in directional drilling in the state and the contact information for these firms.
Layer Descriptions
1. UNIVERSAL WELL SERVICES
Universal Well Services Inc. is a major firm involved in all manner of directional drilling services with an office in Wooster, OH, one in Allen, KY, six in Pennsylvania, six in Texas, and one in West Virginia
2. LLC & MLP’s
This is an inventory of 410 Ohio directional drilling affiliated LLC and MLP firms and contact information. Seventy-eight percent of these firms are domiciled in Ohio. The other primary states that house these firms are Pennsylvania (22), Texas (23), and West Virginia (9). The Economist wrote of these types of firms:
The move away from the C corporation began in earnest in 1975. Wyoming, that vibrant business hub, adopted a new entity structure, the limited-liability company (LLC). Imported from Panama, it provided the tax treatment of a partnership while preserving the corporate protection from individual liability for company debts and litigation. Other states followed in adopting the model. Businesses were quick to see the advantages. The various new types of firm that have risen in the wake of the LLC… make similar use of partnership structures. They have tended to be industry- or sector-specific, at least to begin with. The energy business has a lot of MLPs not only because it needs capital but because it is an easy place to set them up: since 1987, tax law has allowed “mineral or natural resource” companies to operate as listed partnerships, while withholding that privilege from others. But as with other pass-through structures, the constraints are being lowered and circumvented.
3. DRILLING FIRMS
This is an inventory of 393 Ohio Department of Natural Resources permitted directional and injection drilling firms with single locations and their contact information. Seventy-six percent of these firms are domiciled in Ohio with the other primary states of incorporation being Pennsylvania (15), Texas (14), Michigan (11), and West Virginia (9). Only 3 of these firms listed in the Ohio RBDMS Microsoft Access Database contained correct contact information or addresses. According to ODNR staff – and primary FOIA contact:
… it looks like the [active drillers] list [doesn’t contain] much information on the companies in general…We have mailing information for the operating companies, but a lot of the time they subcontract out to get their drillers. We do not require the information of the drillers they contract.
4. ADDITIONAL DRILLERS
This is an inventory of the 40 known locations for six firms permitted to drill in Ohio. The same lack of contact and address data for these firms were true for this data. The primary firms are Butch’s Rathole and Nomac Drilling Corporation. Given that the ODNR RBDMS does not indicate the actual location from which these companies migrated into the Ohio shale industry we decided to include all known locations for these firms.
5. CANADIAN FIRMS
This is an inventory of the 14 known locations for the 5 Canadian drilling firms permitted in Ohio. The primary firm is Savannah Drilling, which is composed of 10 locations across Alberta and Saskatchewan.
6. AMERICAN SUPPORTING CO.
This is an inventory of 1,837 Ohio energy firms operating in the Utica and Marcellus shale or servicing it in a secondary or tertiary fashion. Seventy-five percent (1,386) of these firms are domiciled in Ohio with secondary hotspots in Texas (76), West Virginia (65), Pennsylvania (49), Michigan (34), Colorado (27), Illinois (22), Oklahoma (21), California (16), New York and New Jersey (27), Kentucky (14).
7. ADDITIONAL SUPPORTING CO.
This shows an inventory of 10 Ohio energy firms operating in the Utica and Marcellus shale or servicing it in a secondary or tertiary fashion extracted from the ODNR RBDMS that did not contain locational or contact information.
8. CANADIAN SUPPORTING CO.
This is an inventory of 5 (1 company Mar Oil Company was not found) Canadian energy firms operating in the Utica and Marcellus shale or servicing it in a secondary or tertiary fashion.
9. BRINE HAULERS
This is an inventory of 505 ODNR permitted brine haulers active in the transport and disposal of hydraulic fracturing waste either via injection or waste landfill disposal. Seventy-six percent of these firms are domiciled in Ohio with the primary cities being Zanesville (18), Cambridge, Wooster, and Millersburg (12 each), Canton and Marietta (11 each), Columbus (9), Jefferson (9), Logan (8), and North Canton and Newark (7 each). Pennsylvania and West Virginia are home to 84 and 32 brine haulers, respectively.
https://www.fractracker.org/a5ej20sjfwe/wp-content/uploads/2014/02/Screen-Shot-2014-02-06-at-12.22.35-PM.png324696Ted Auch, PhDhttps://www.fractracker.org/a5ej20sjfwe/wp-content/uploads/2025/09/2025-Wordmark-Logo.pngTed Auch, PhD2014-02-06 10:24:172020-07-21 10:41:53Ohio Production and Injection Well Firms Map
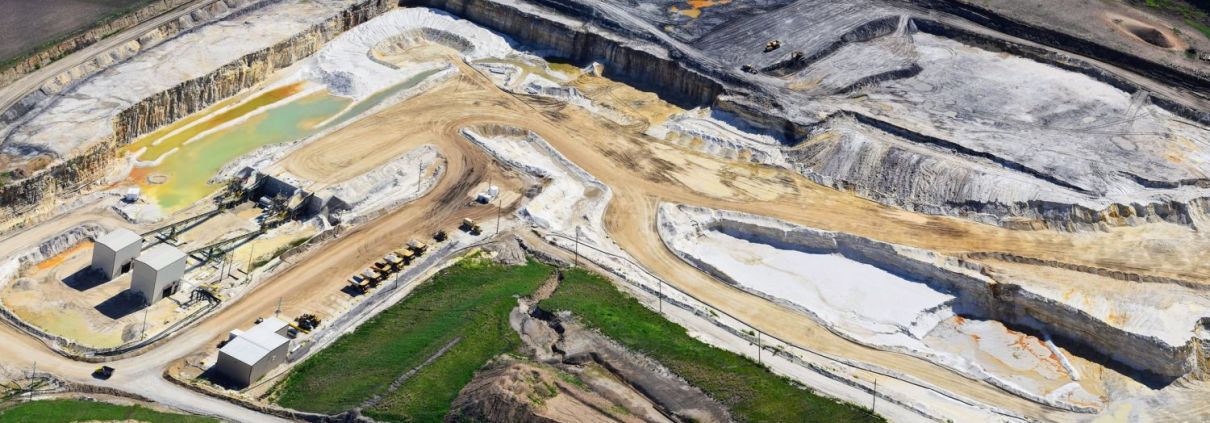
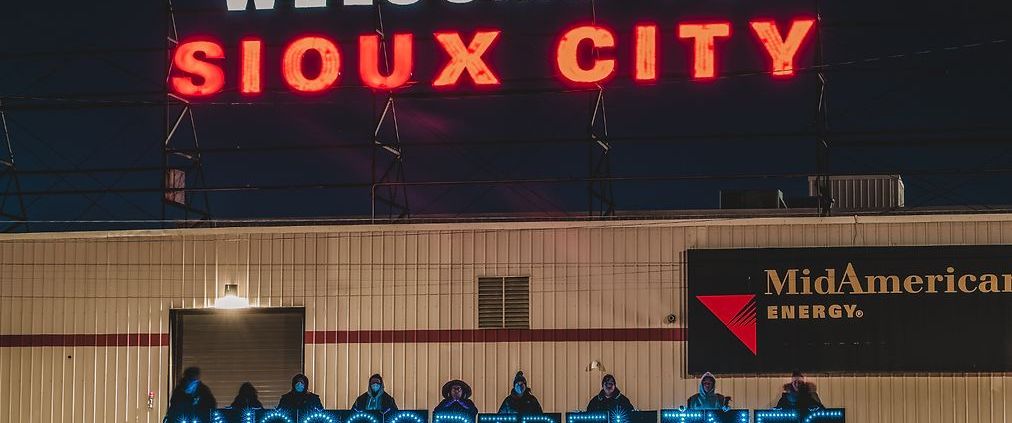 Great Plains Action Society
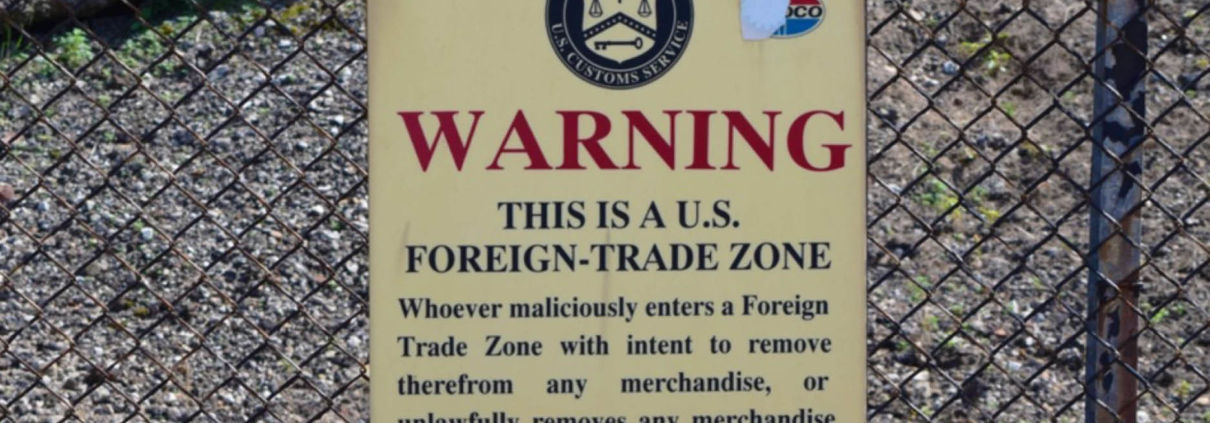
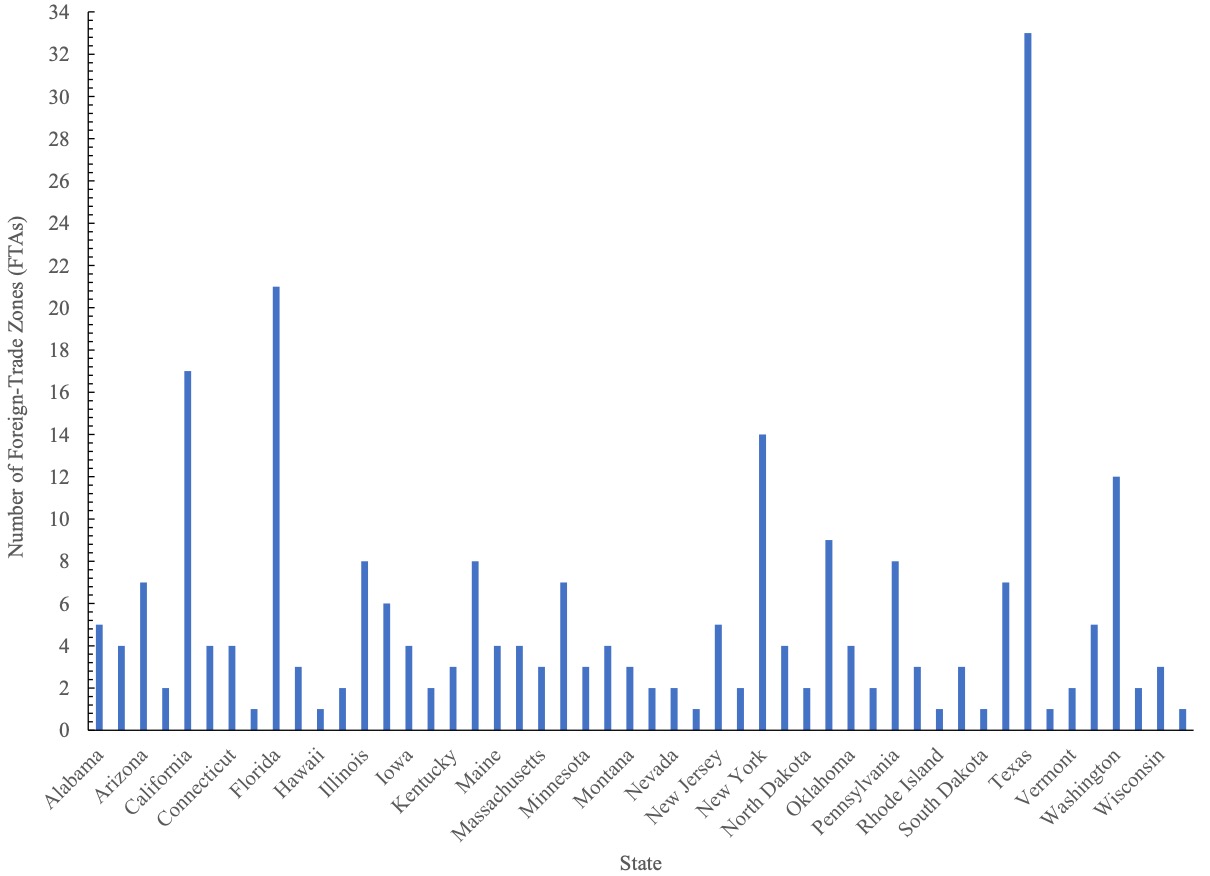
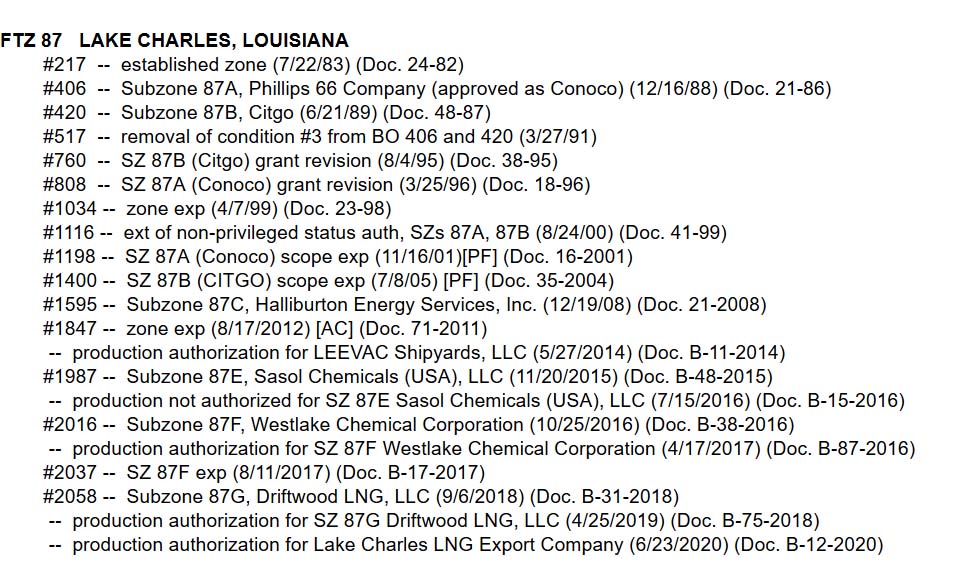
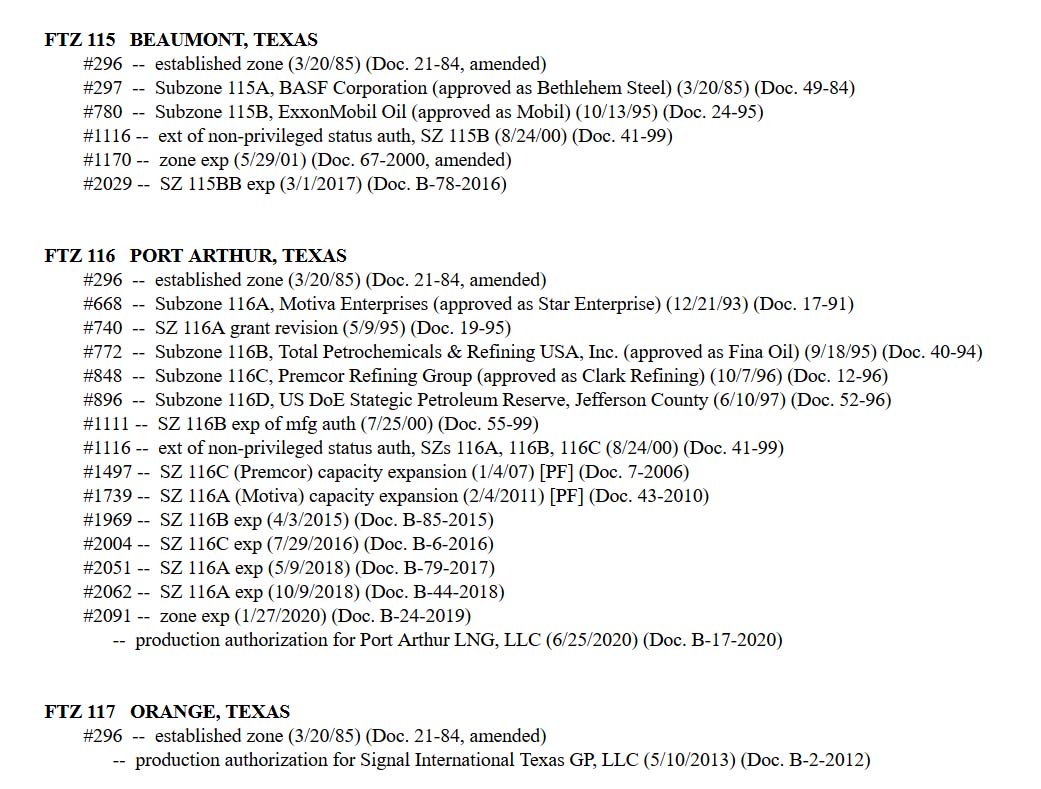
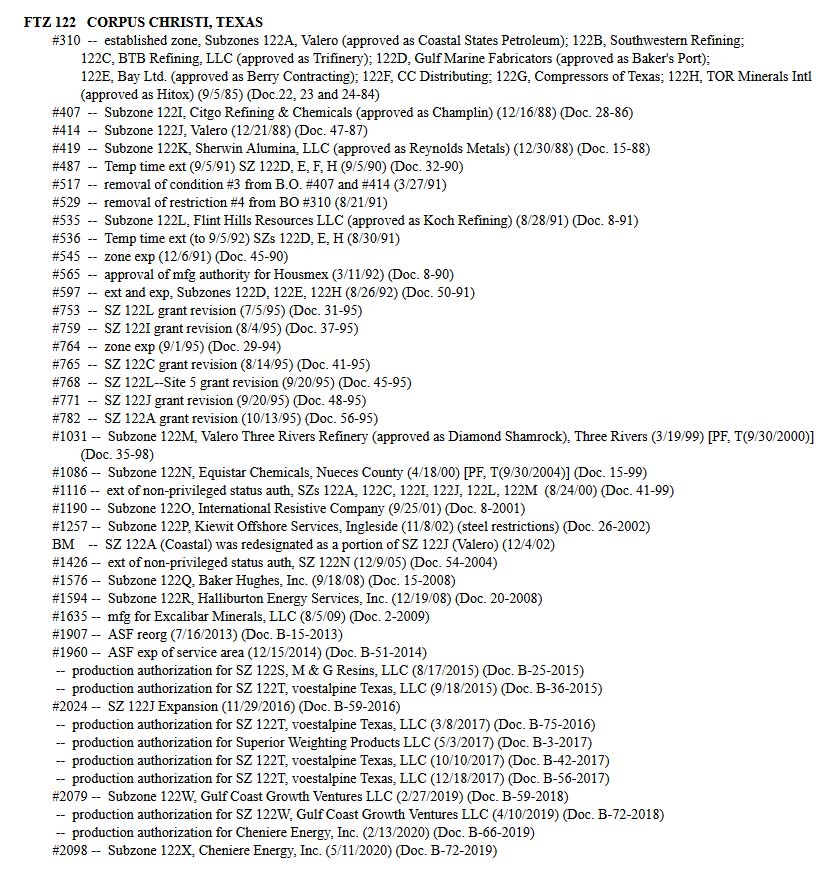
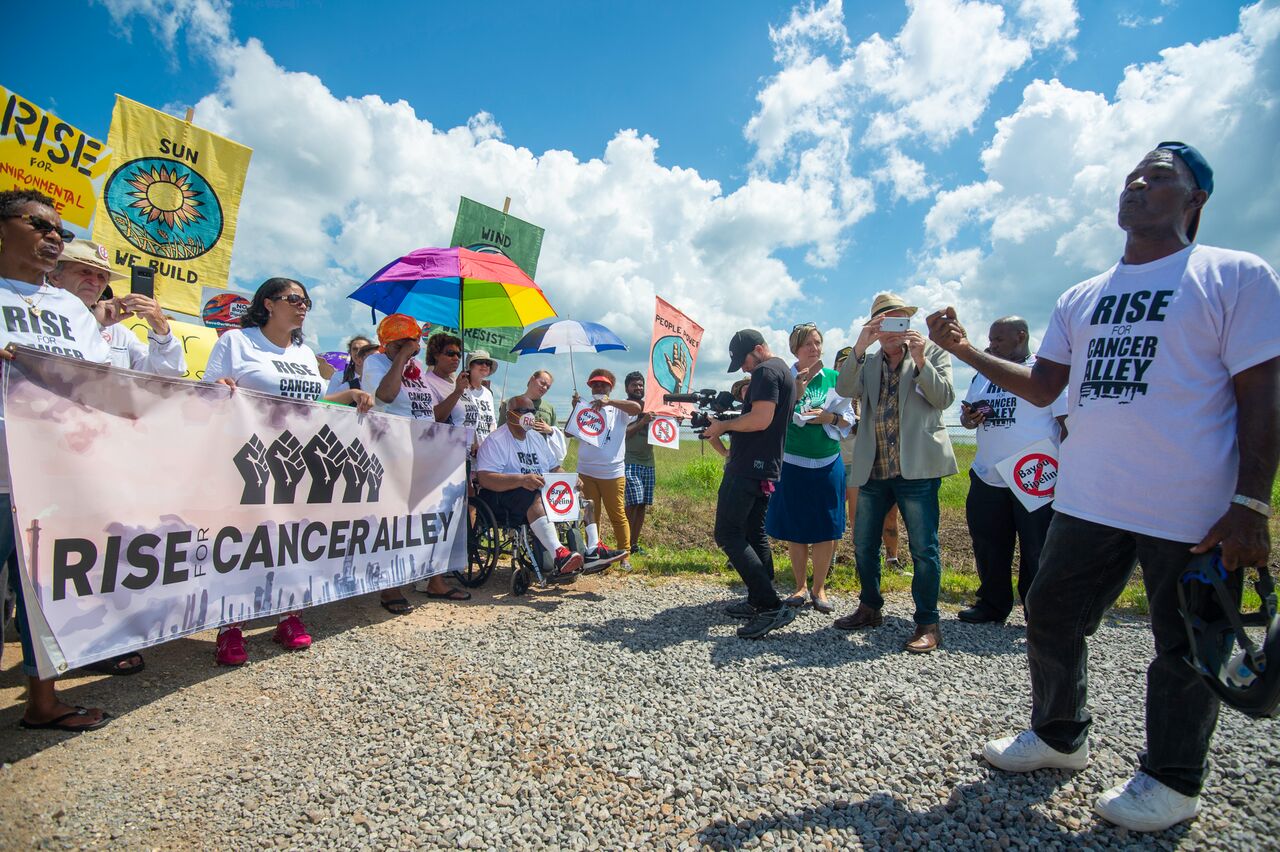
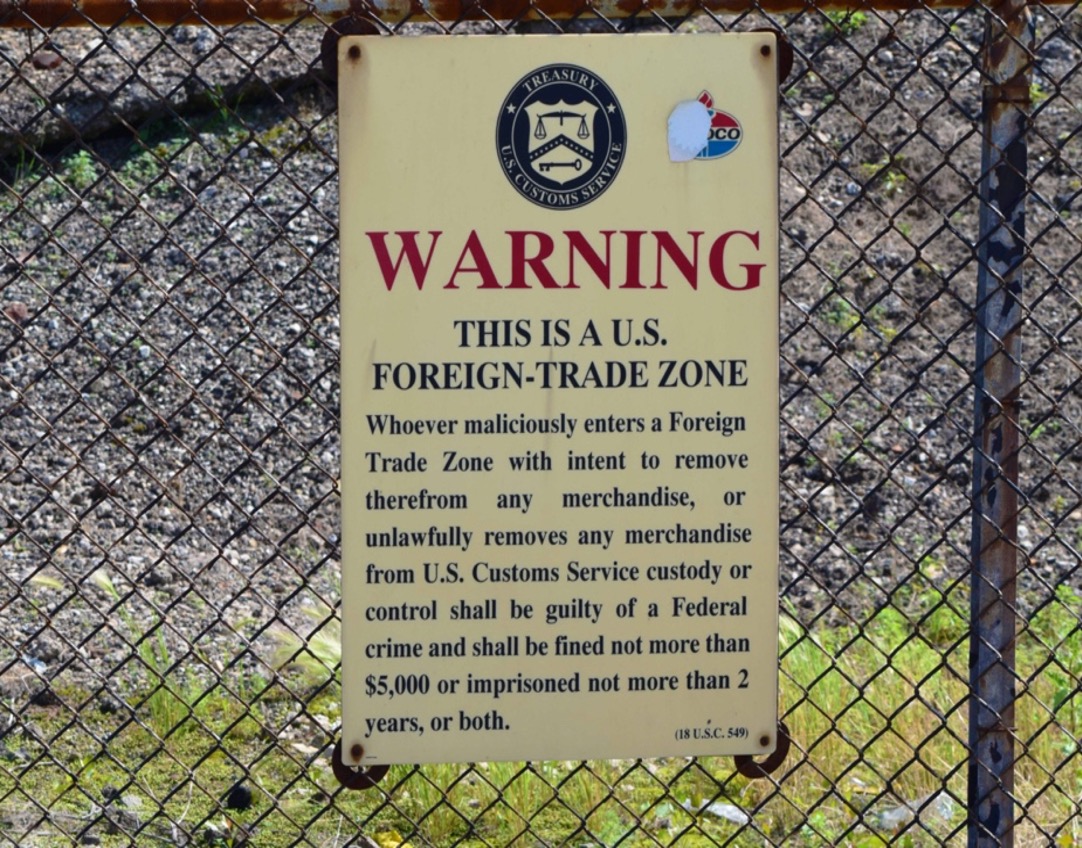


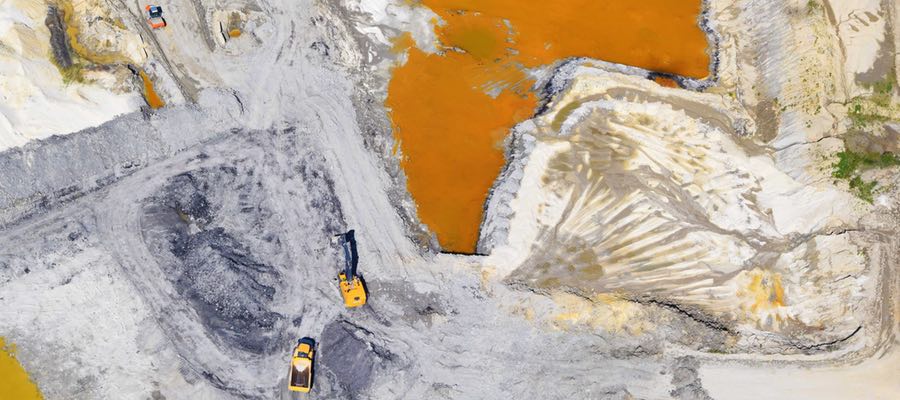
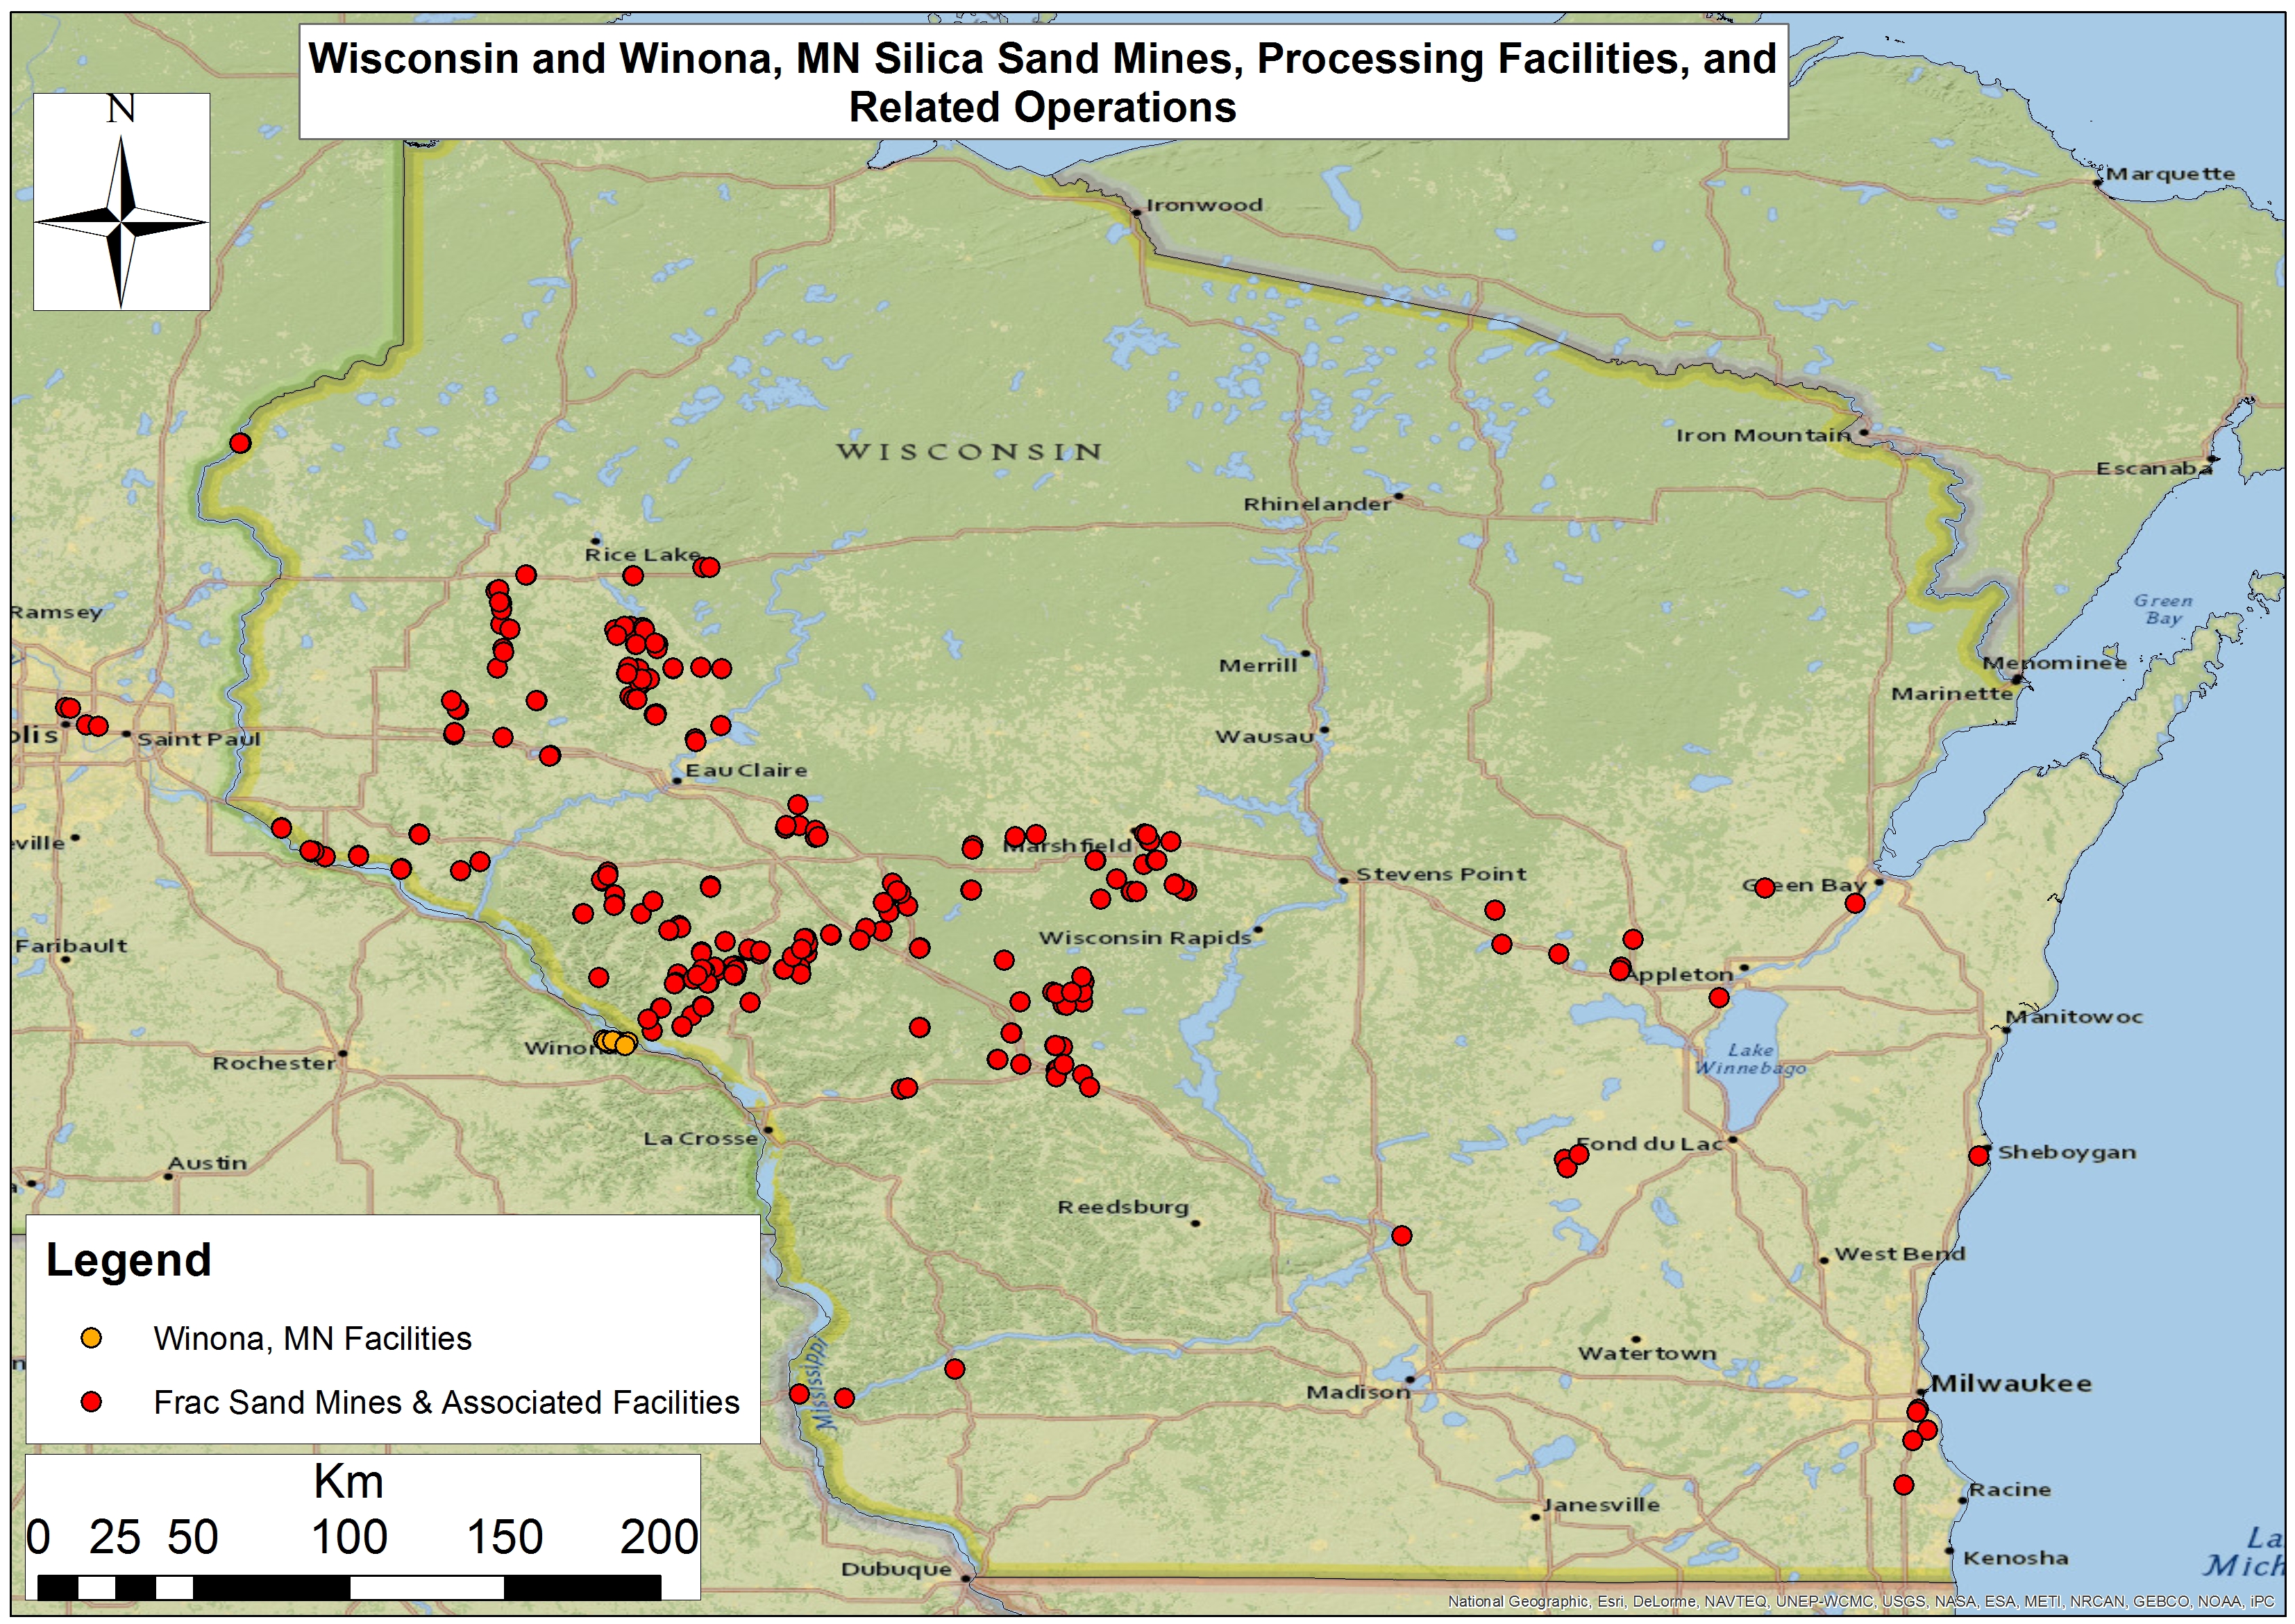
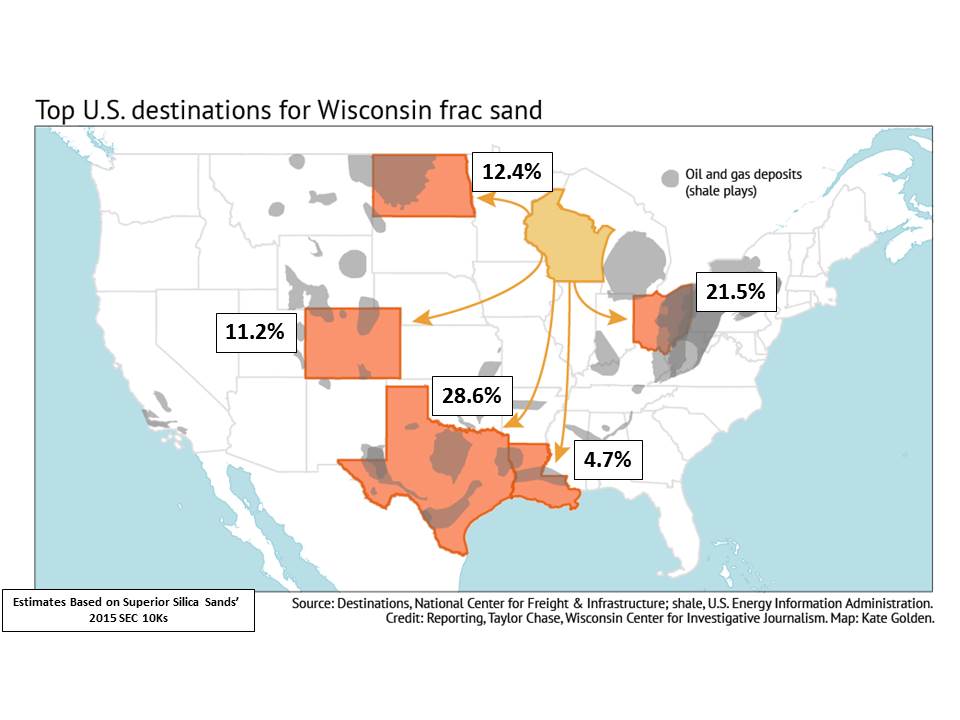
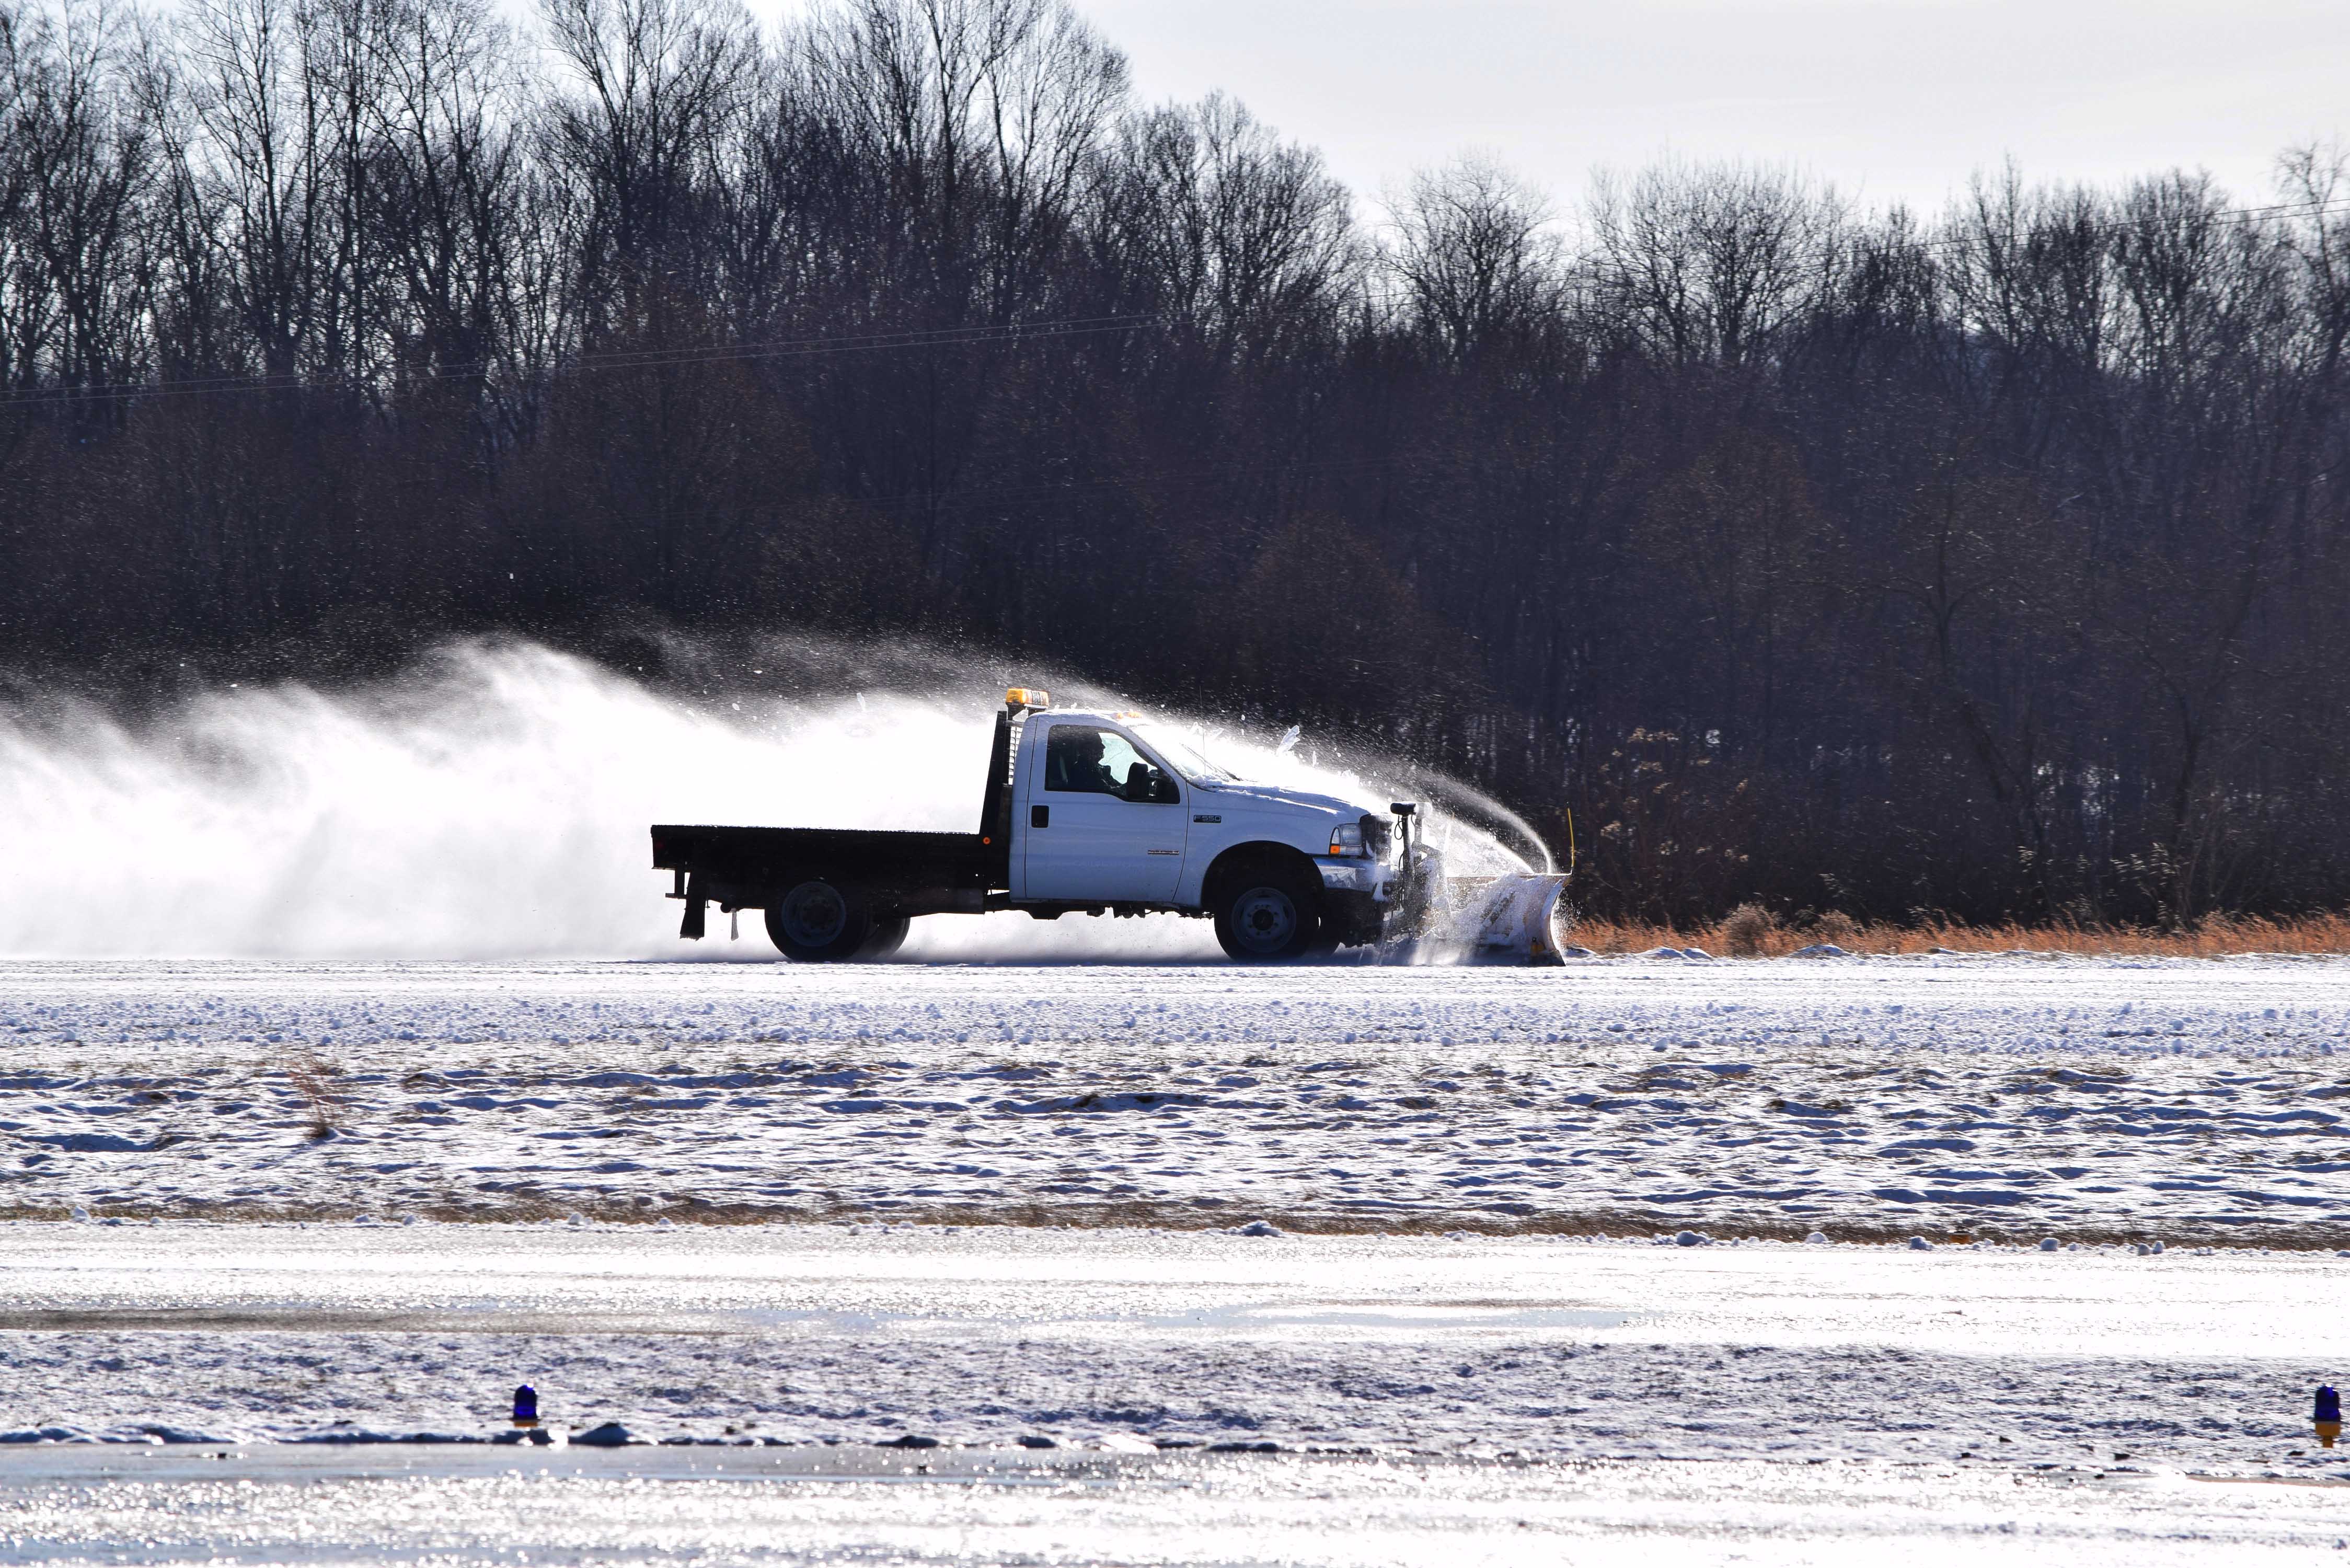
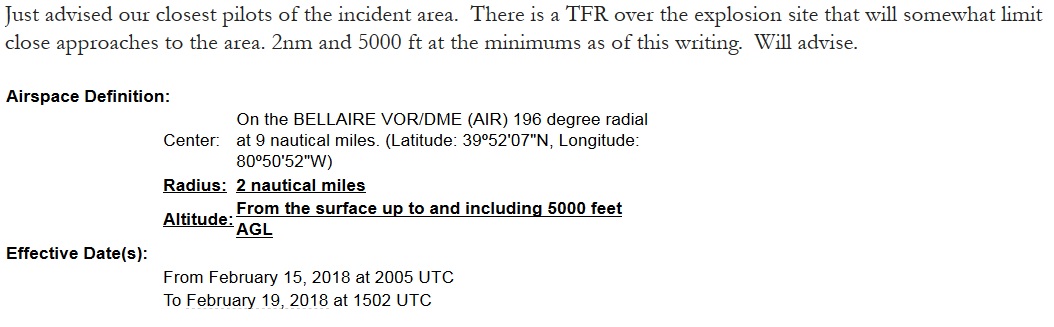

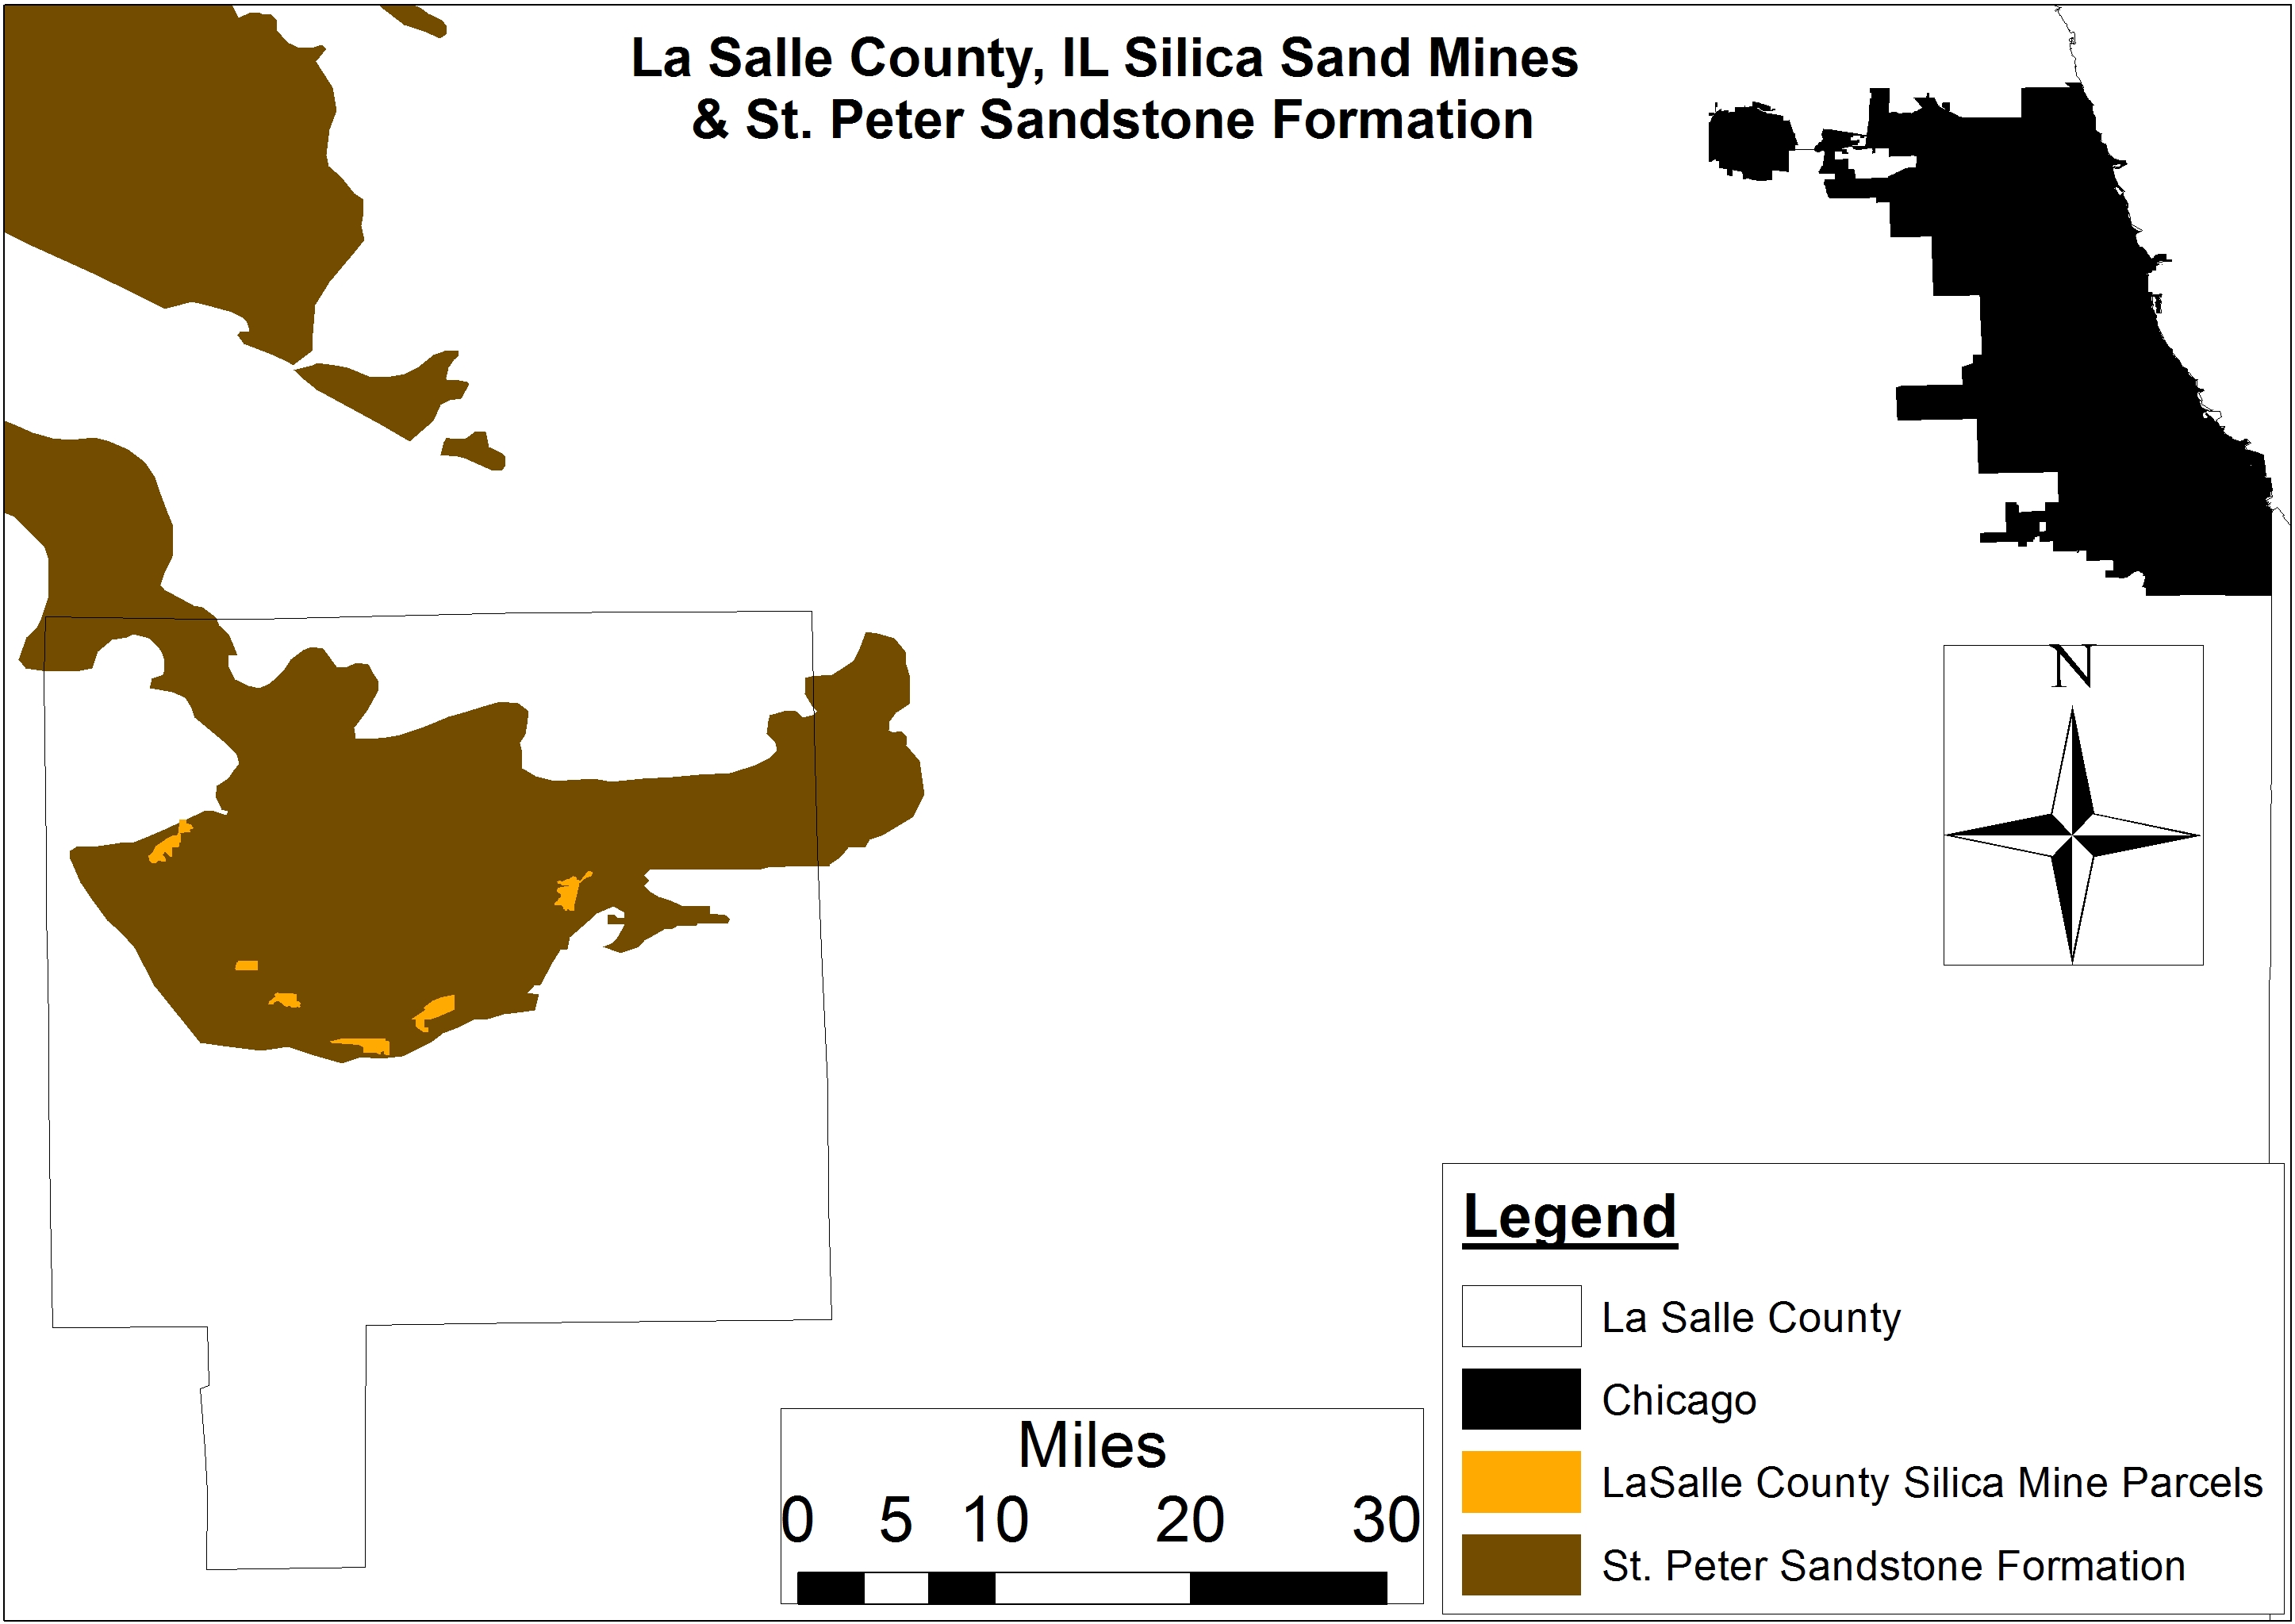


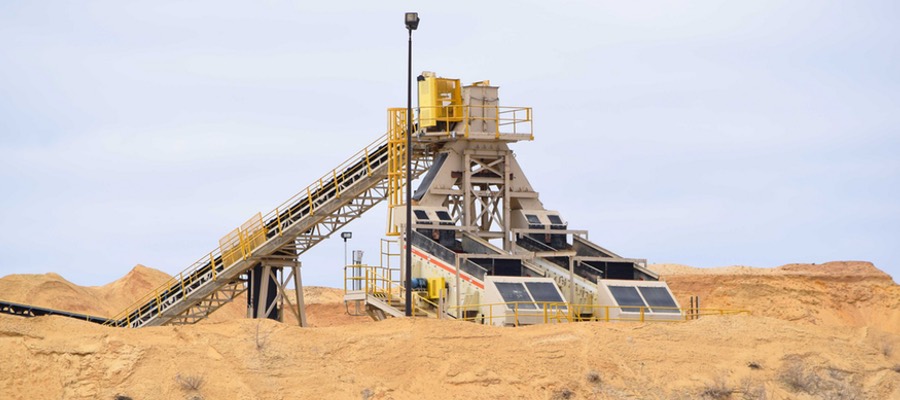


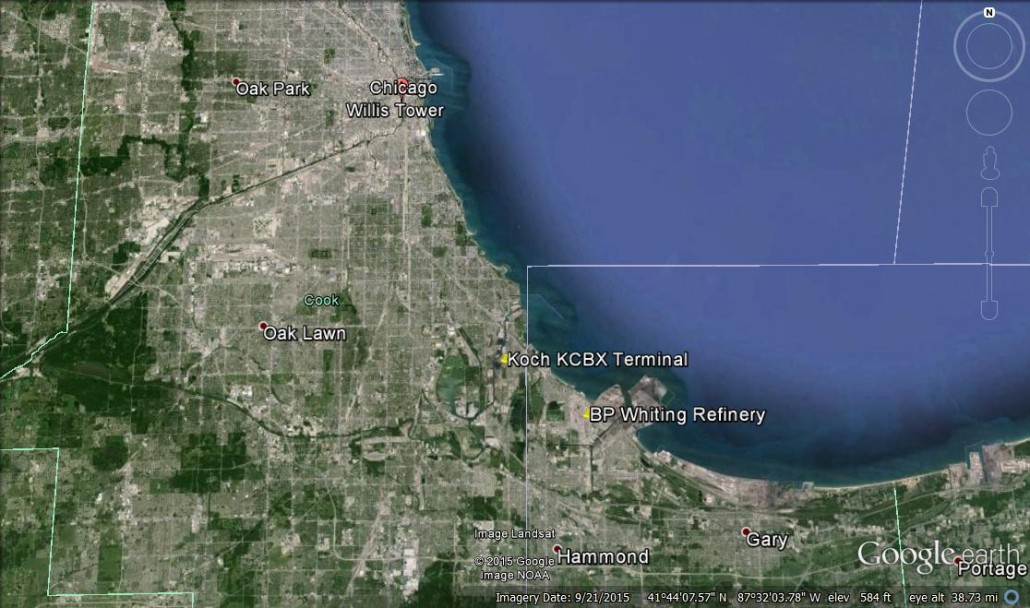
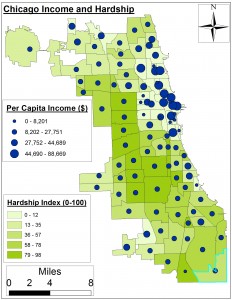
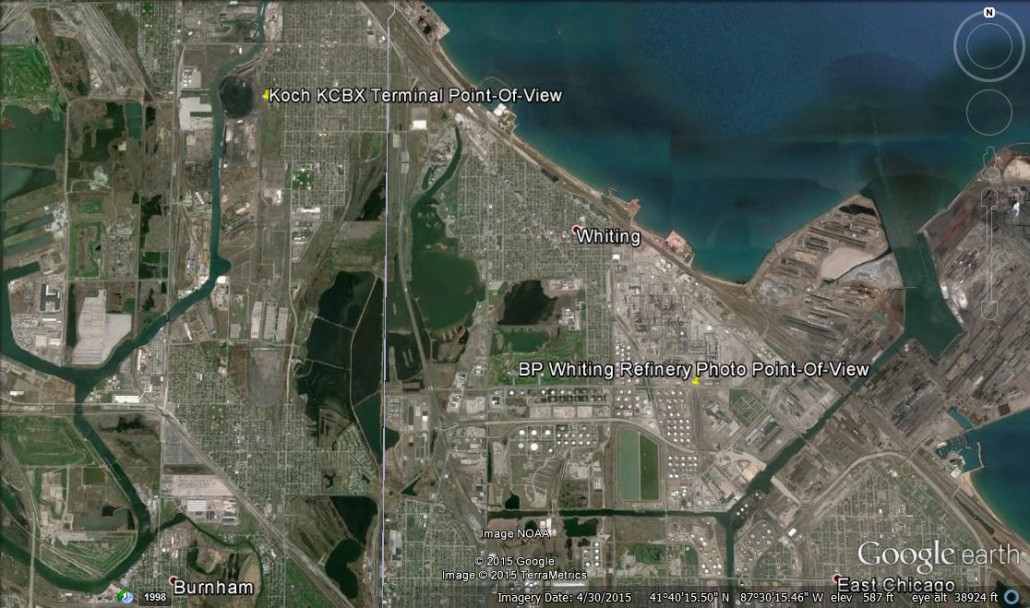
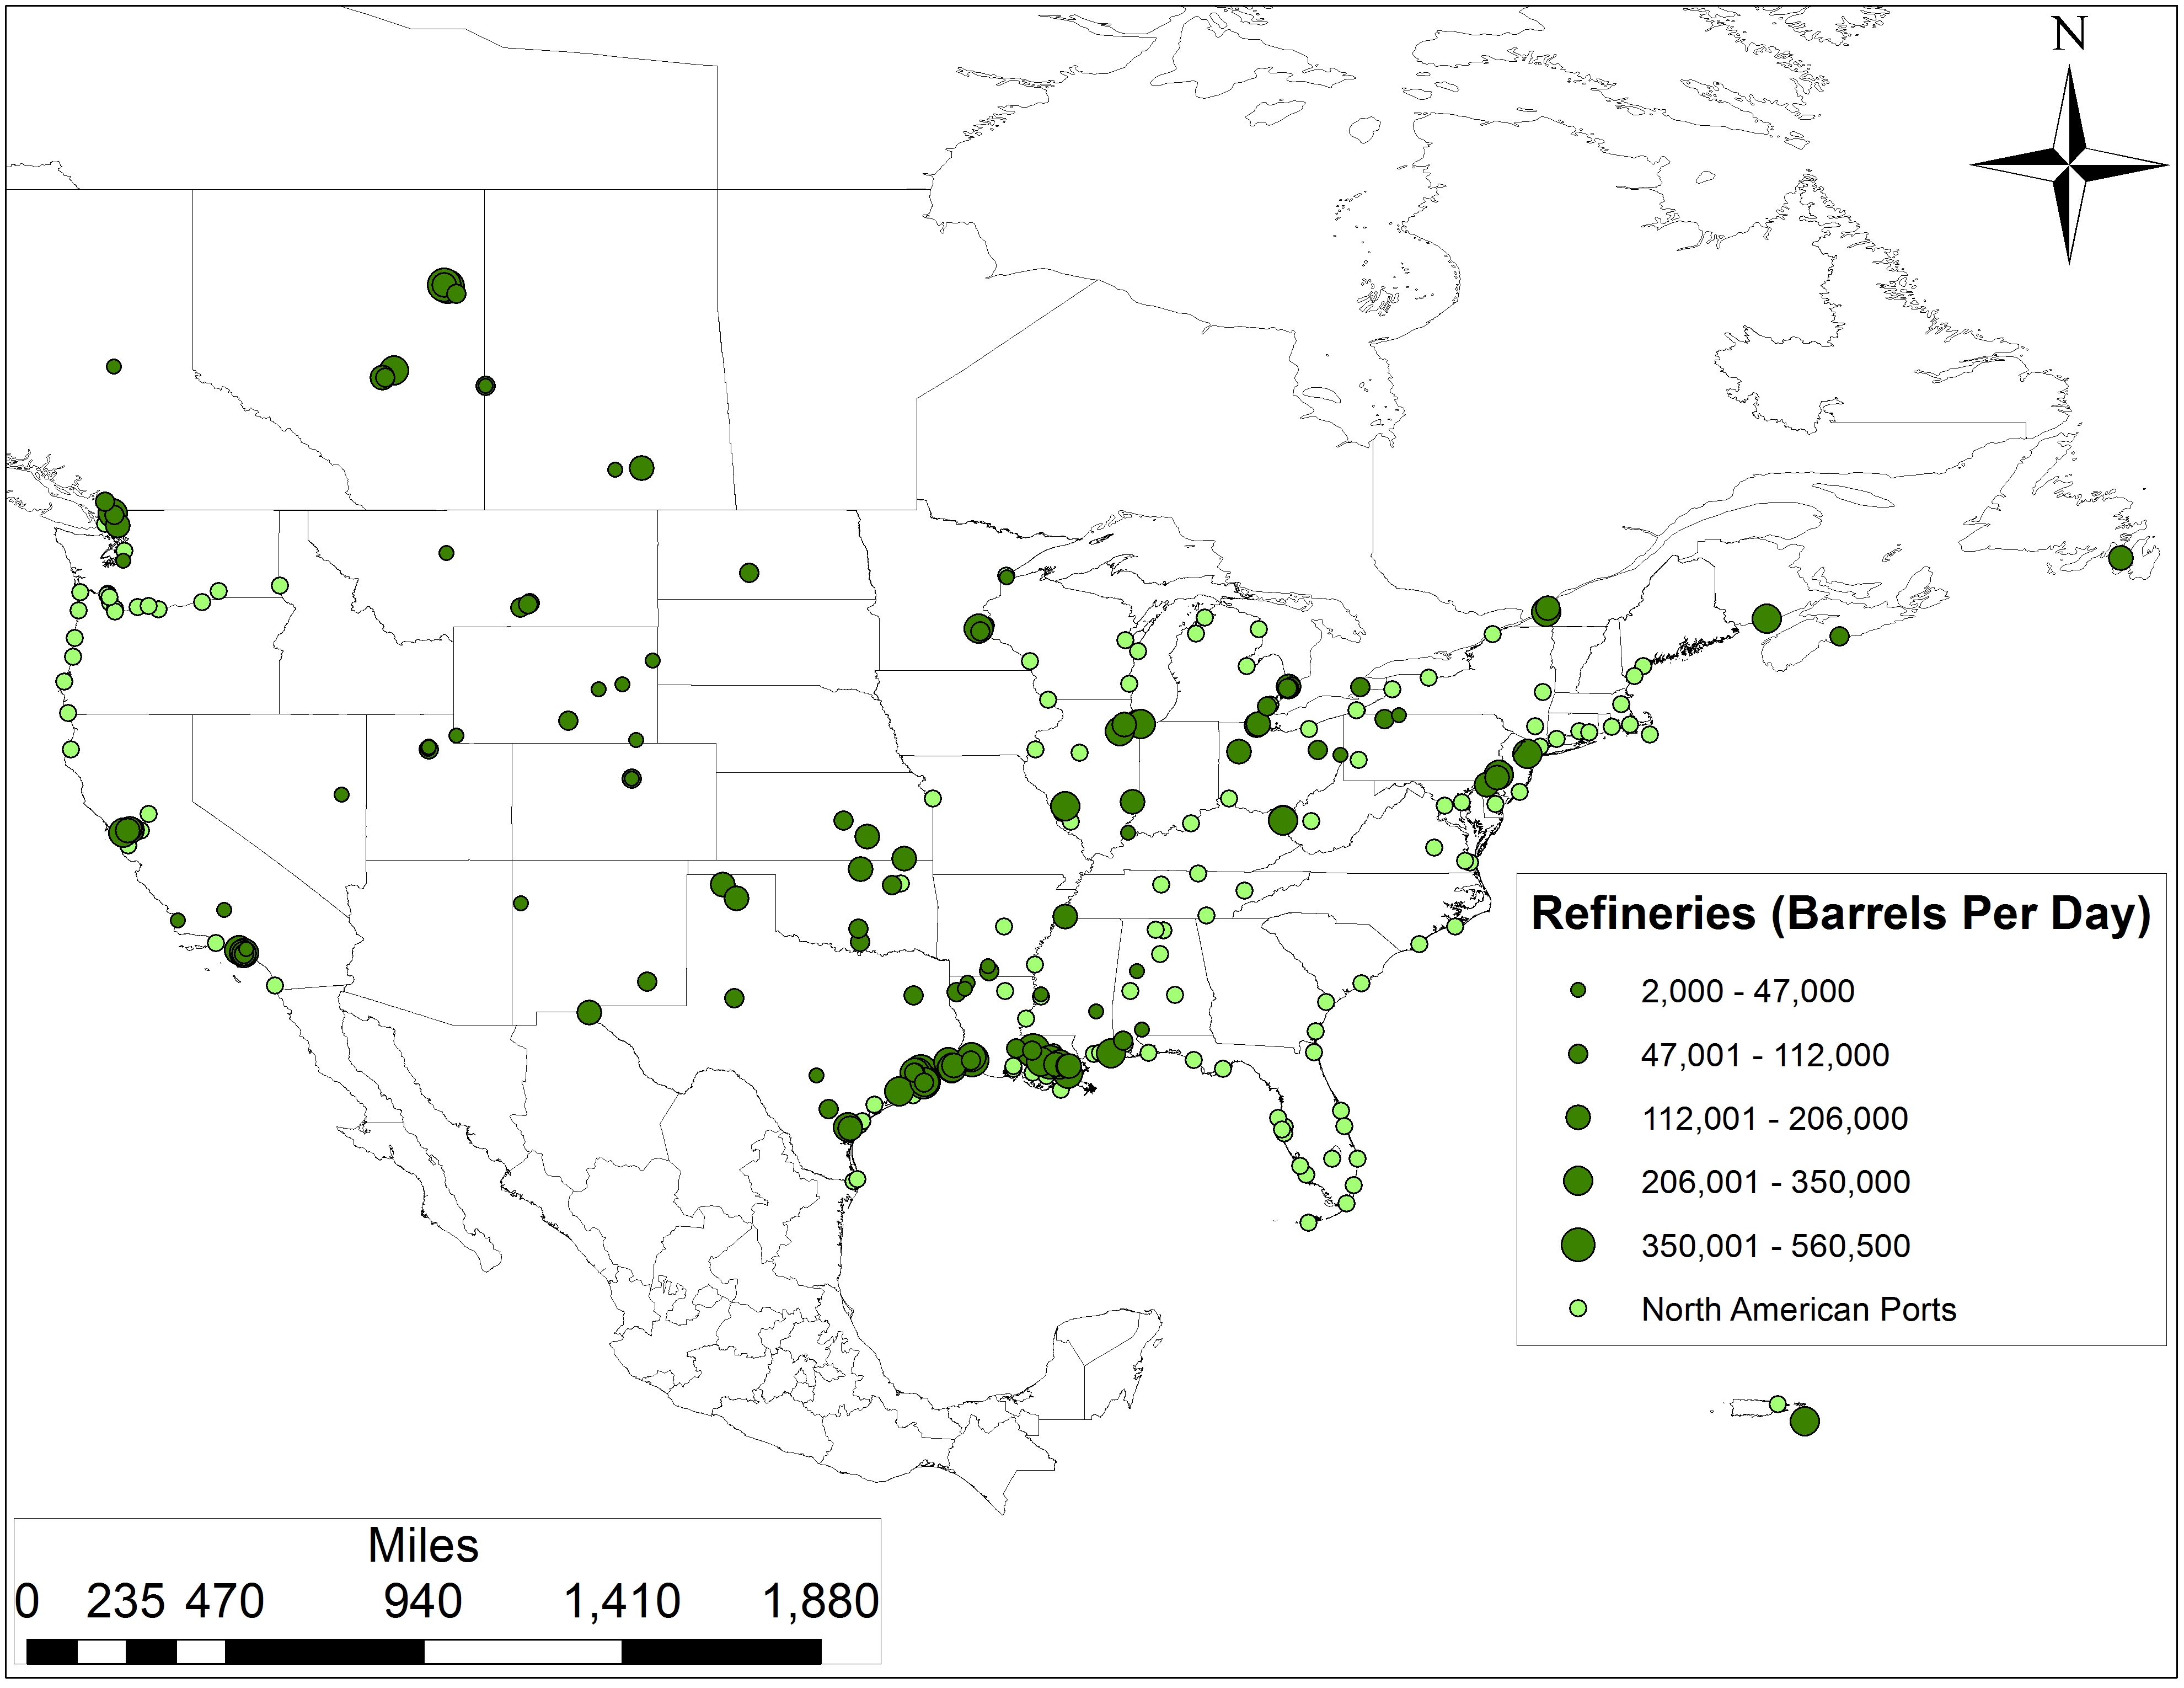


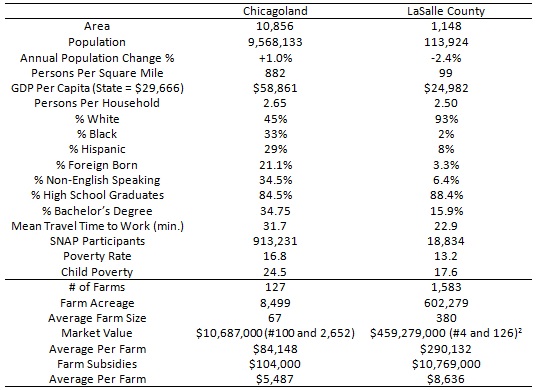
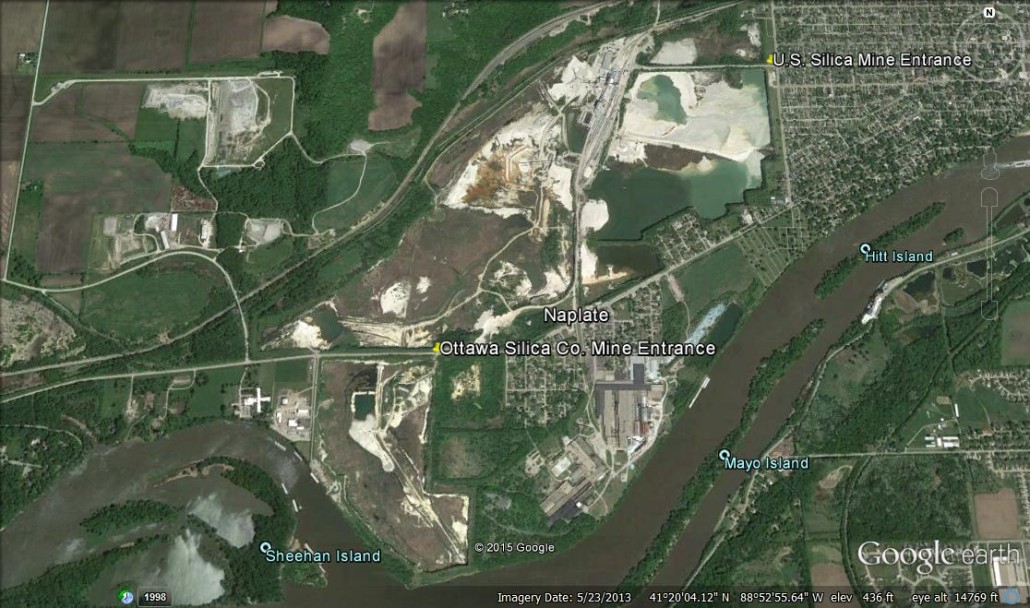


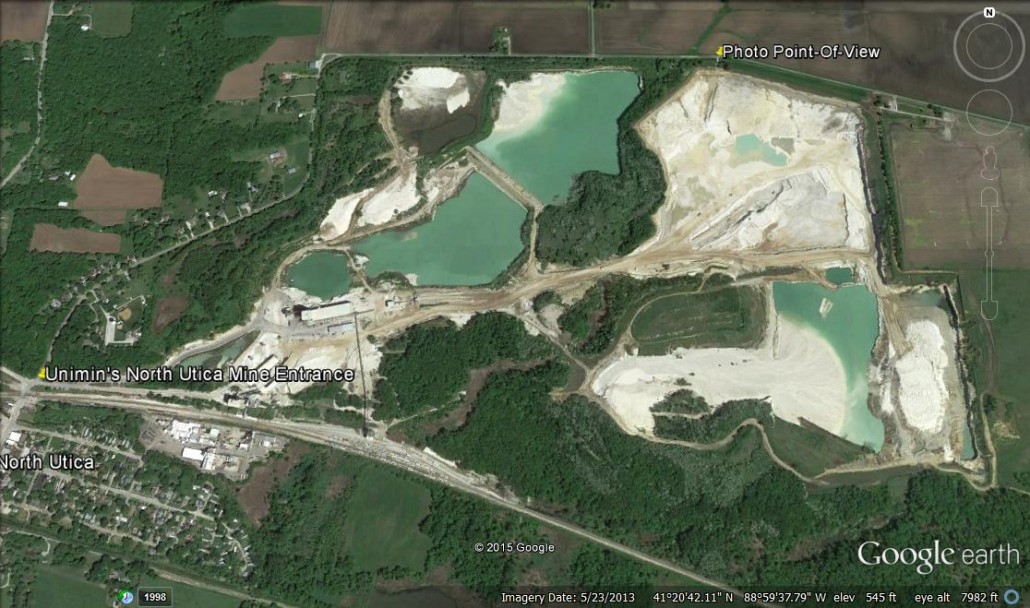


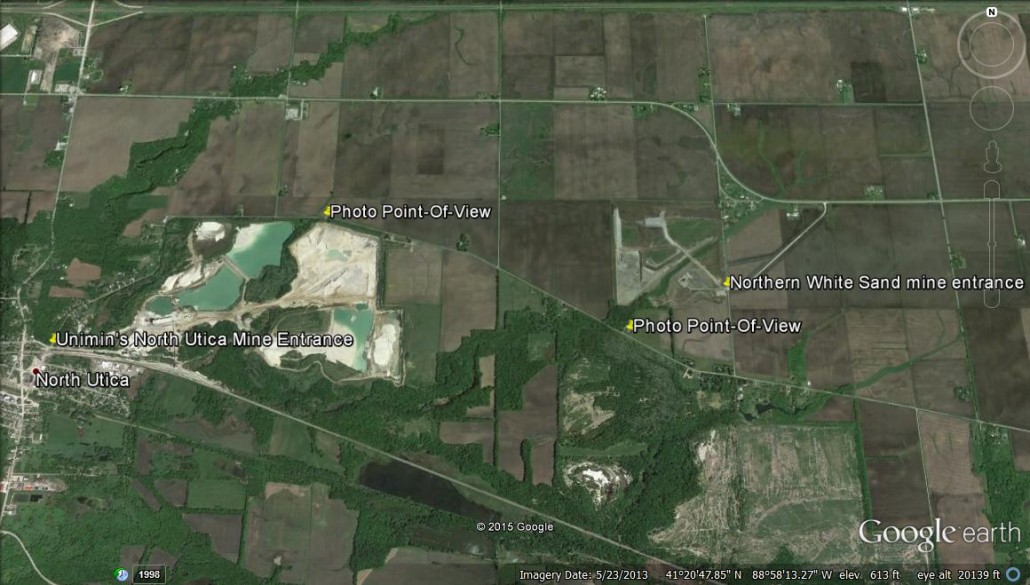
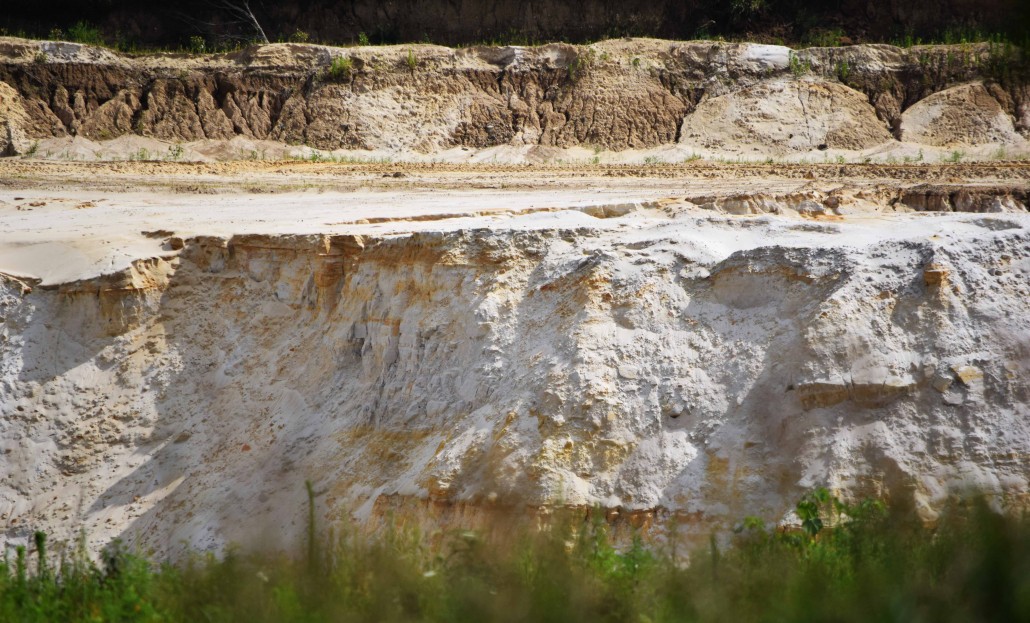
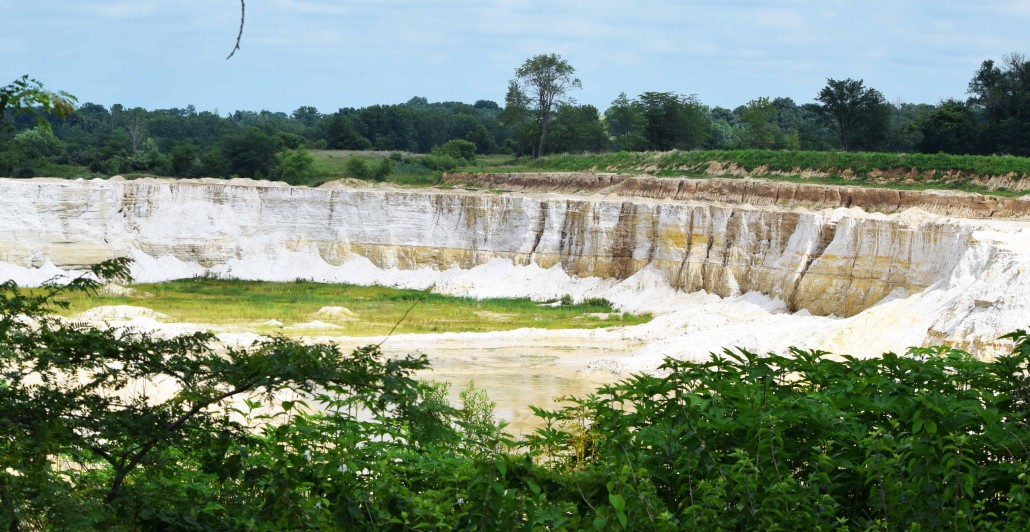
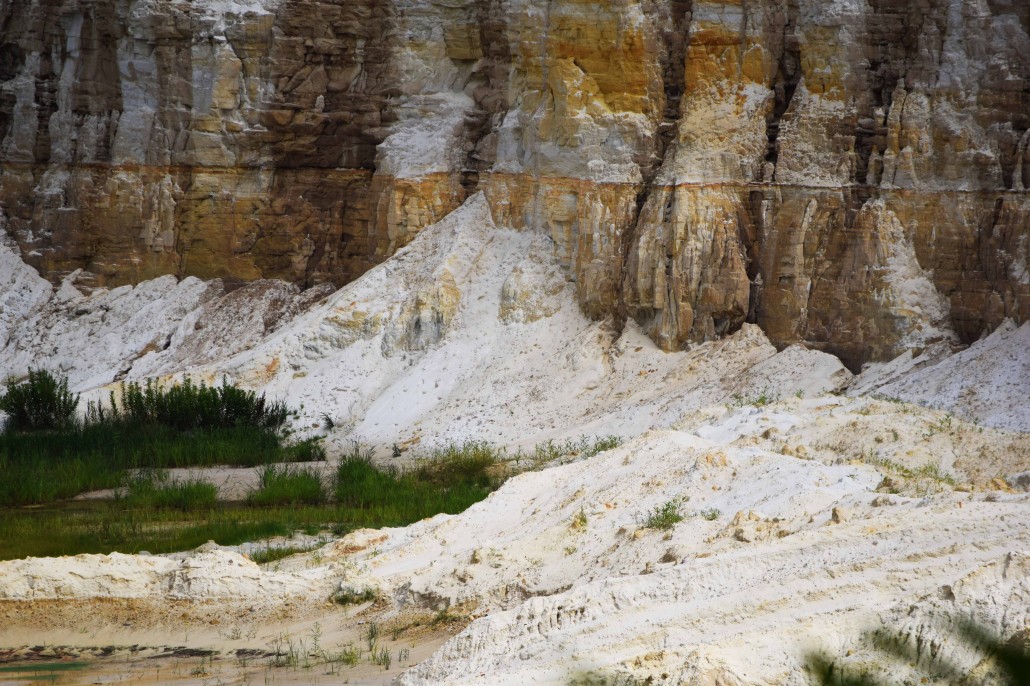
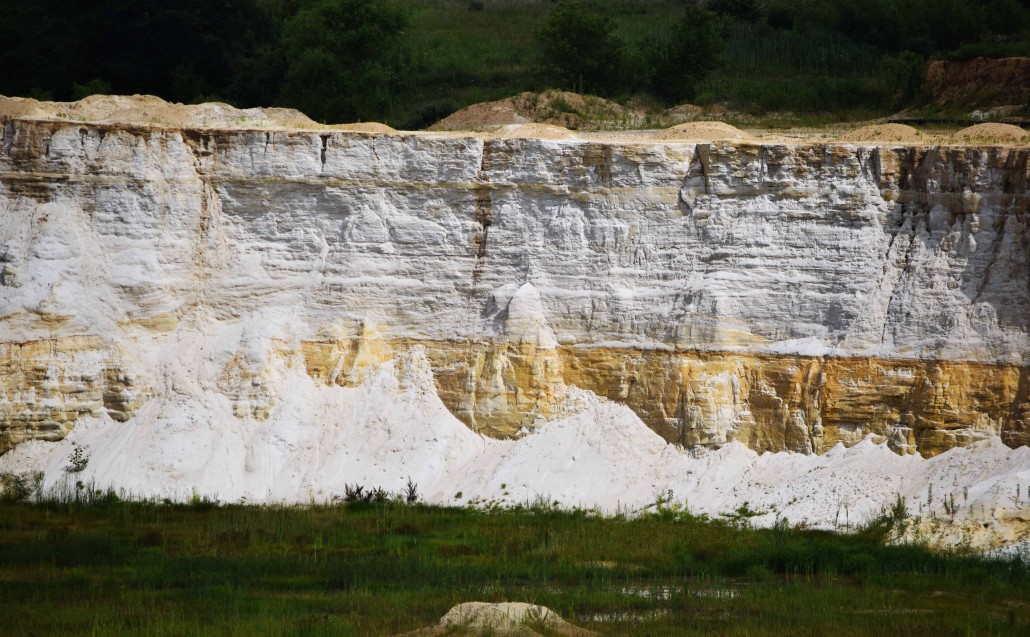
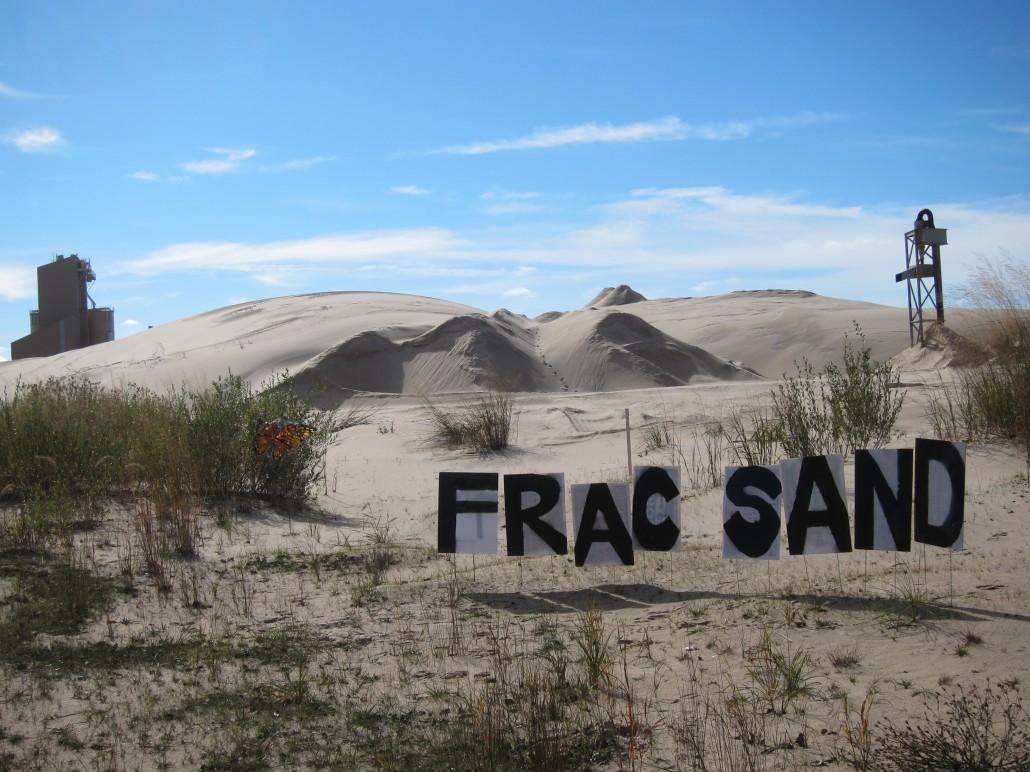

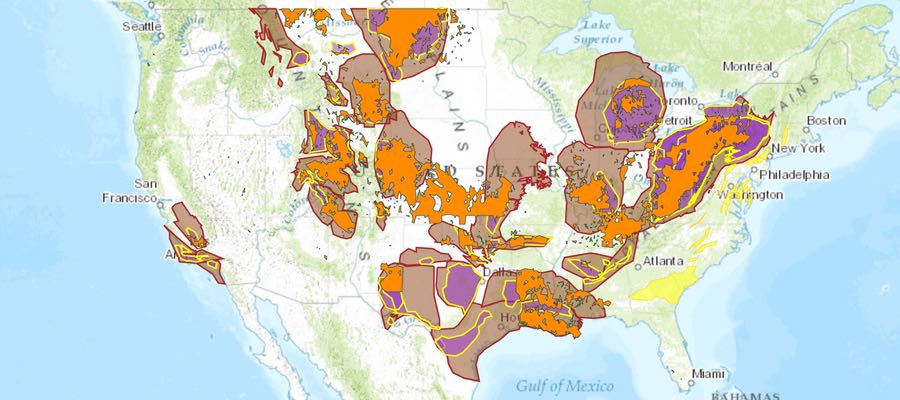
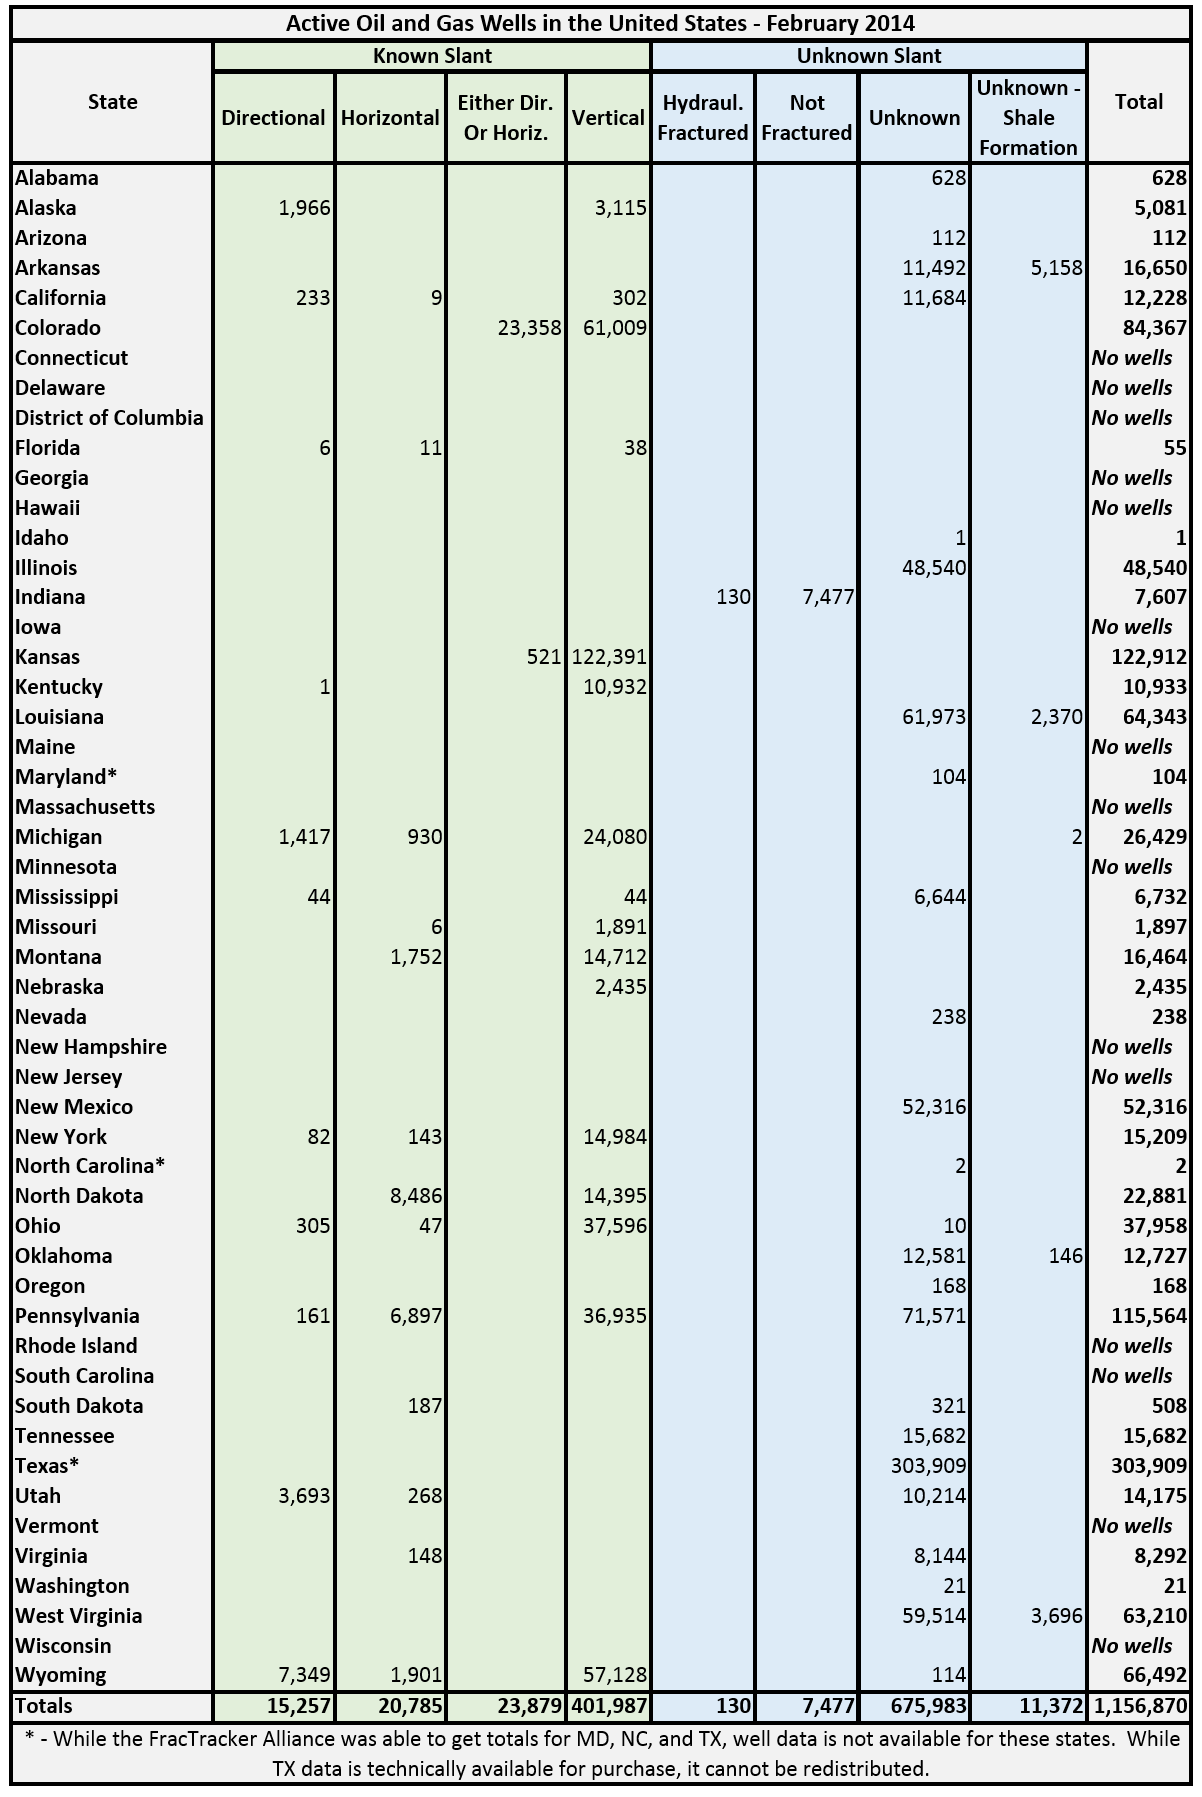
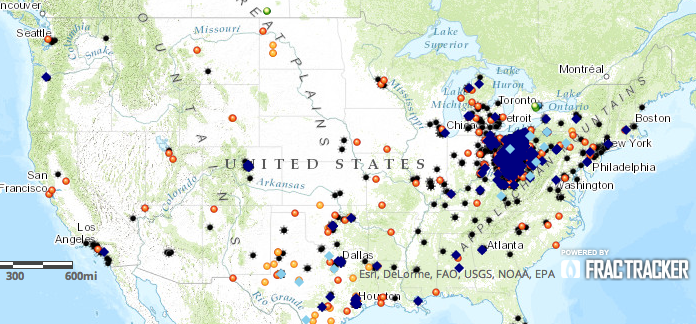
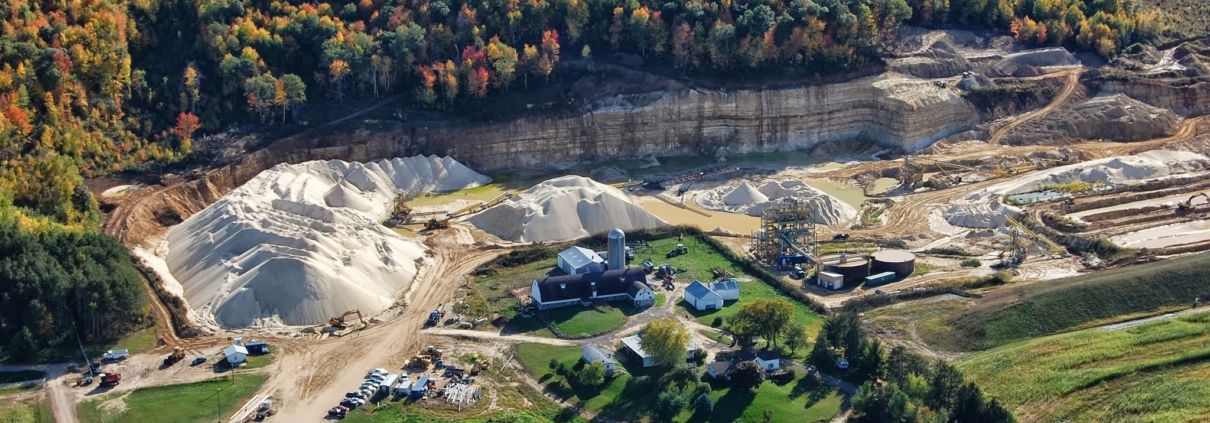
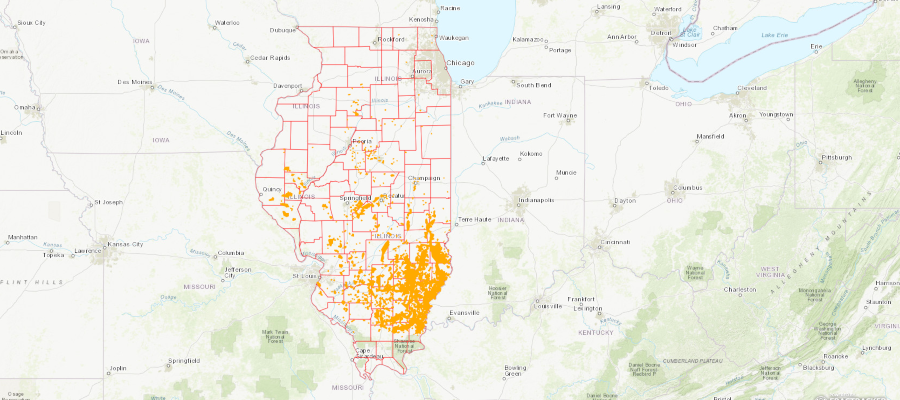
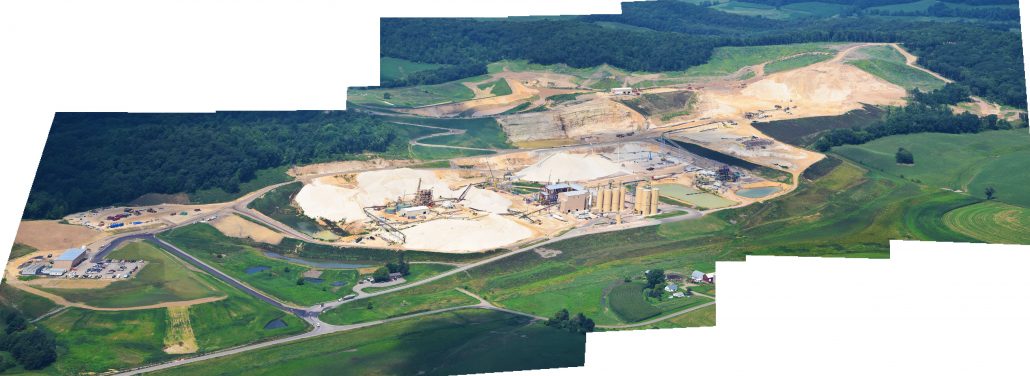
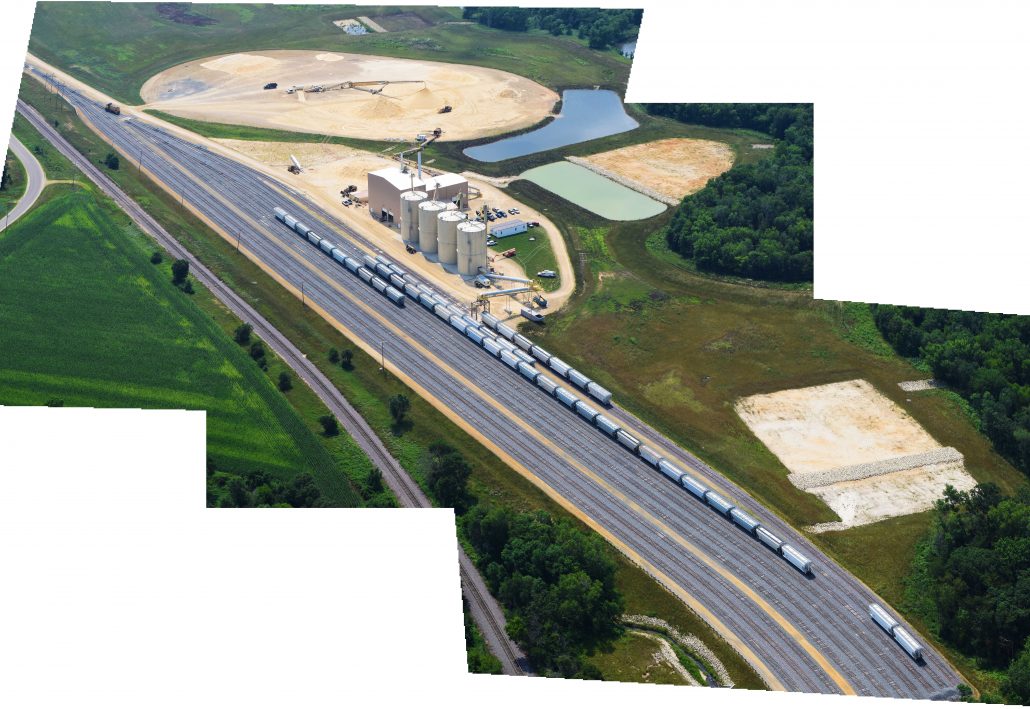
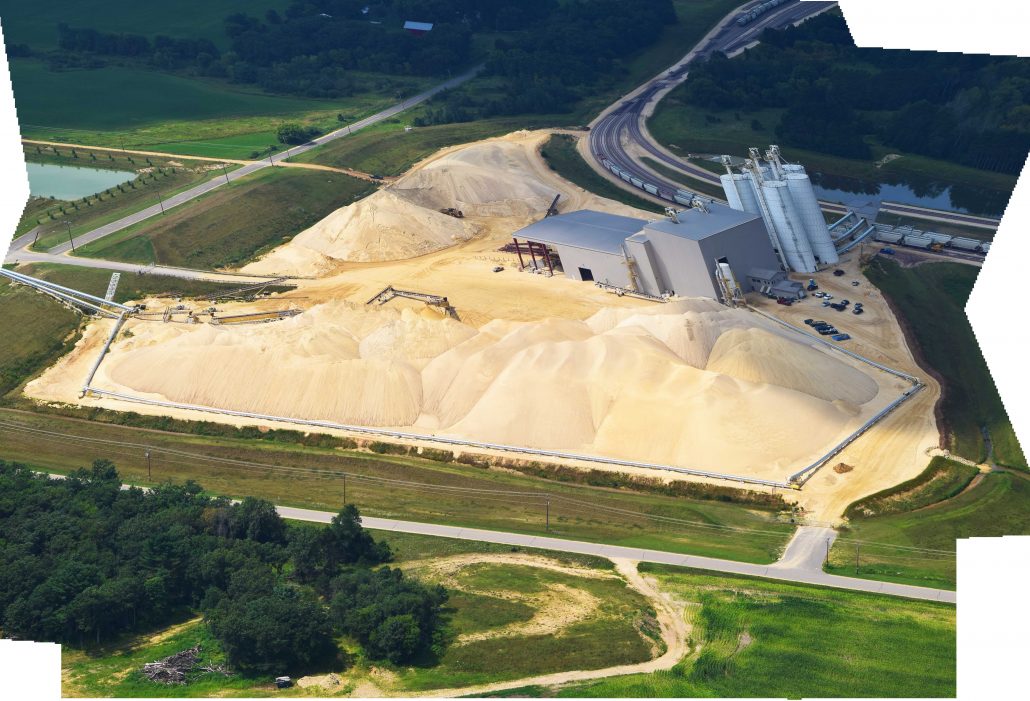
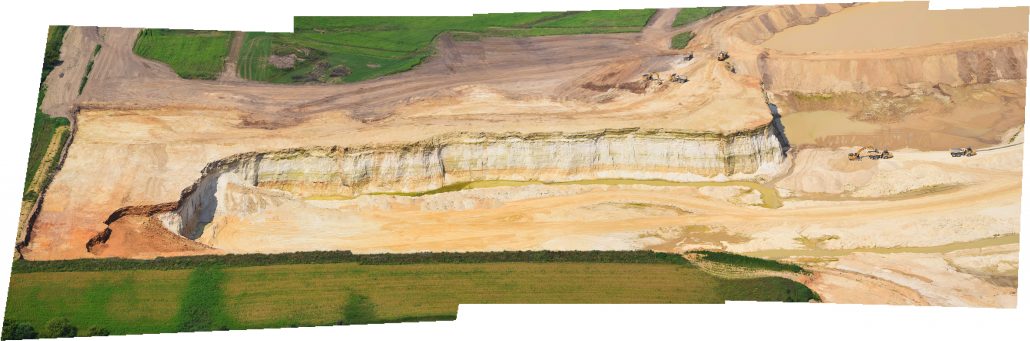
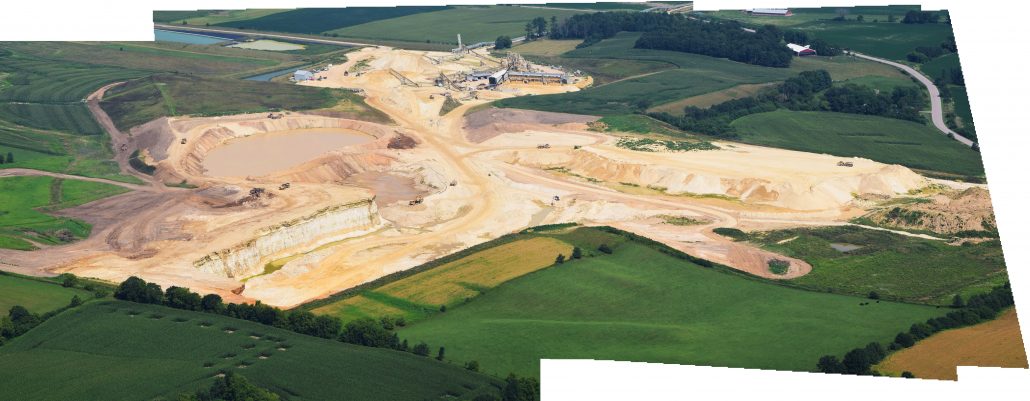
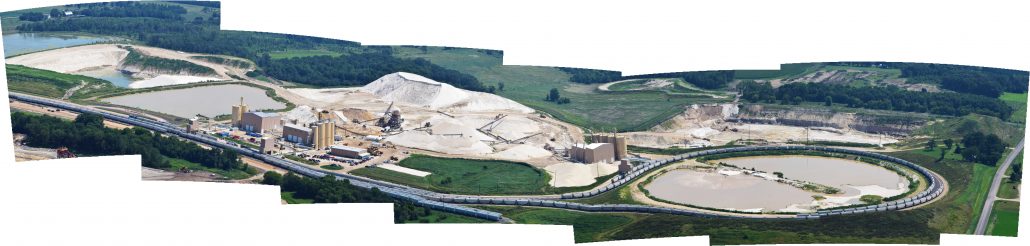
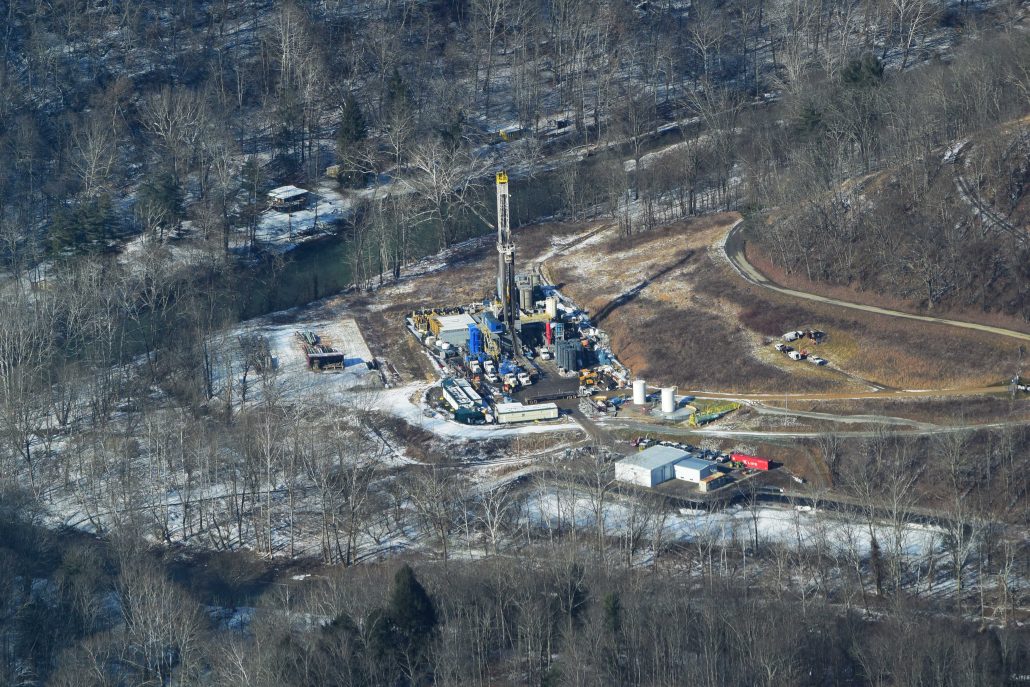
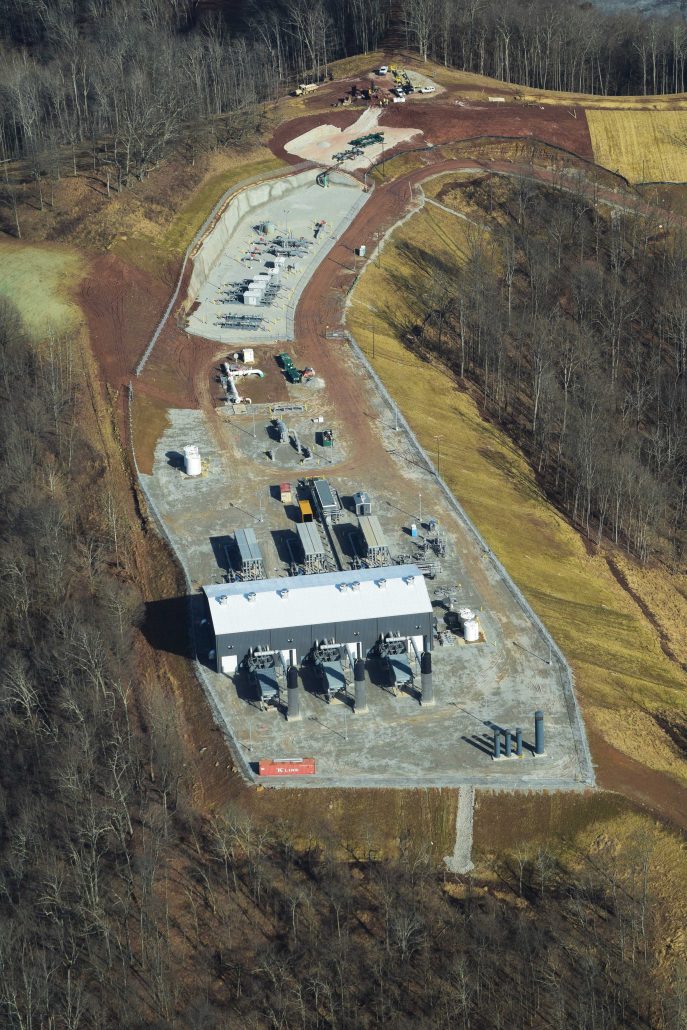
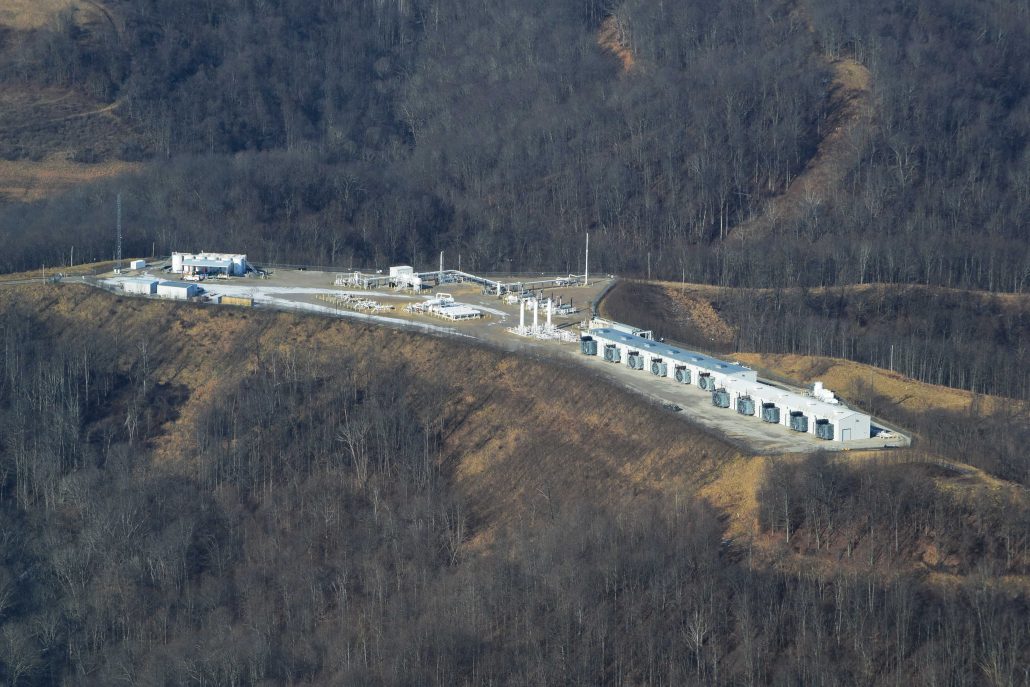
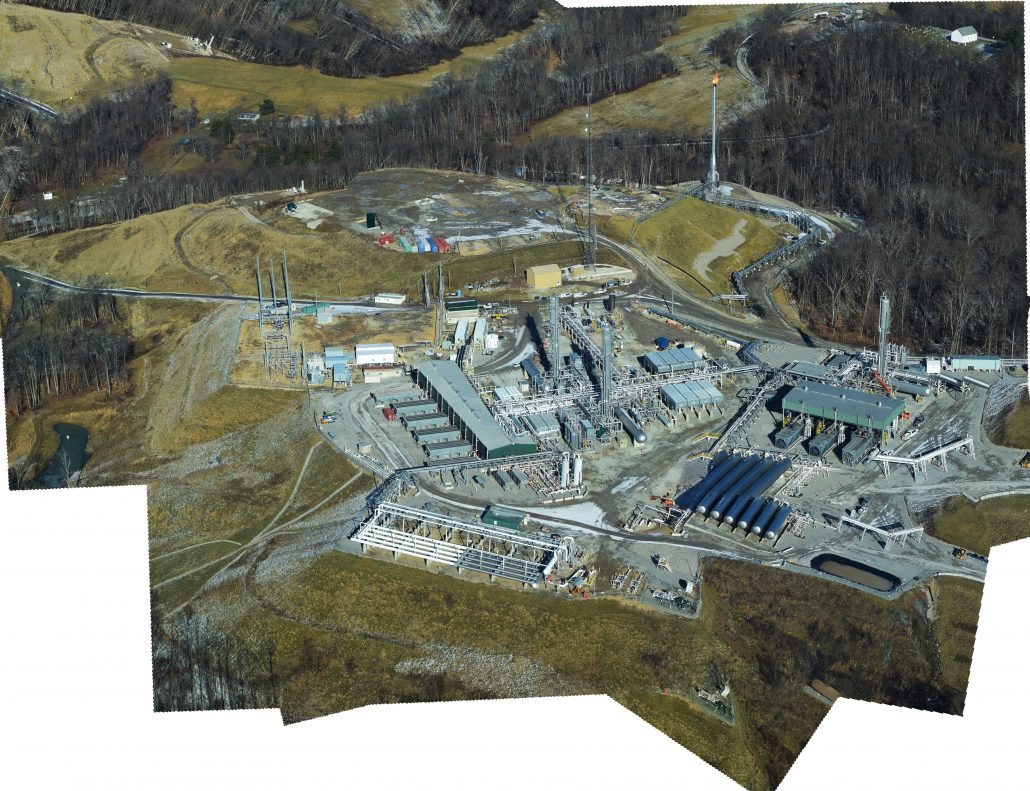
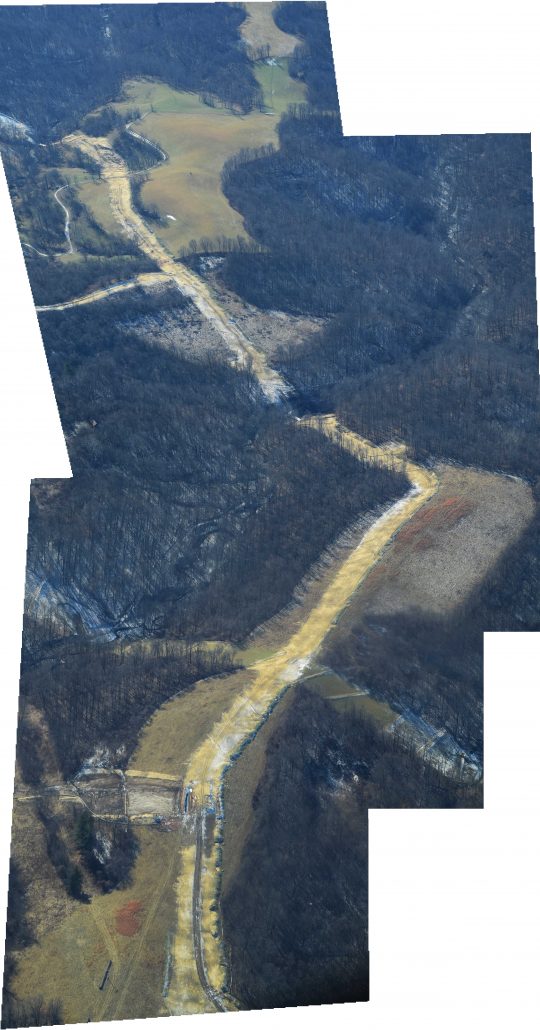
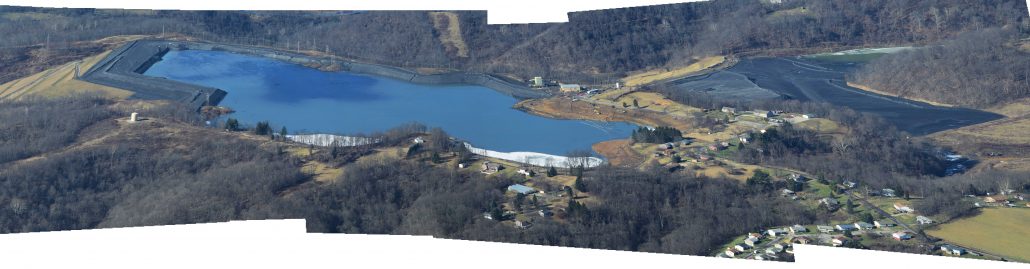
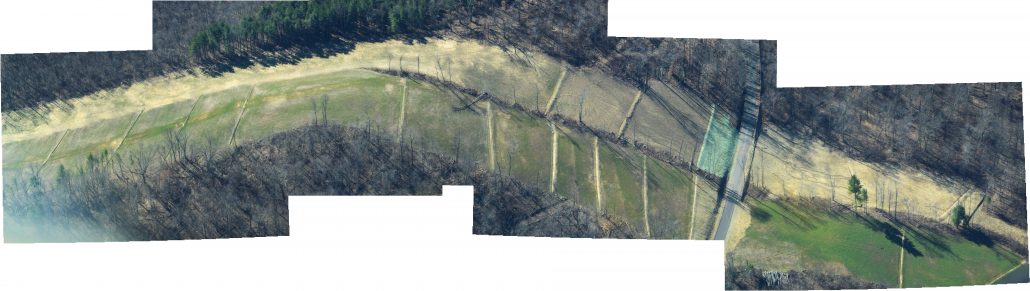
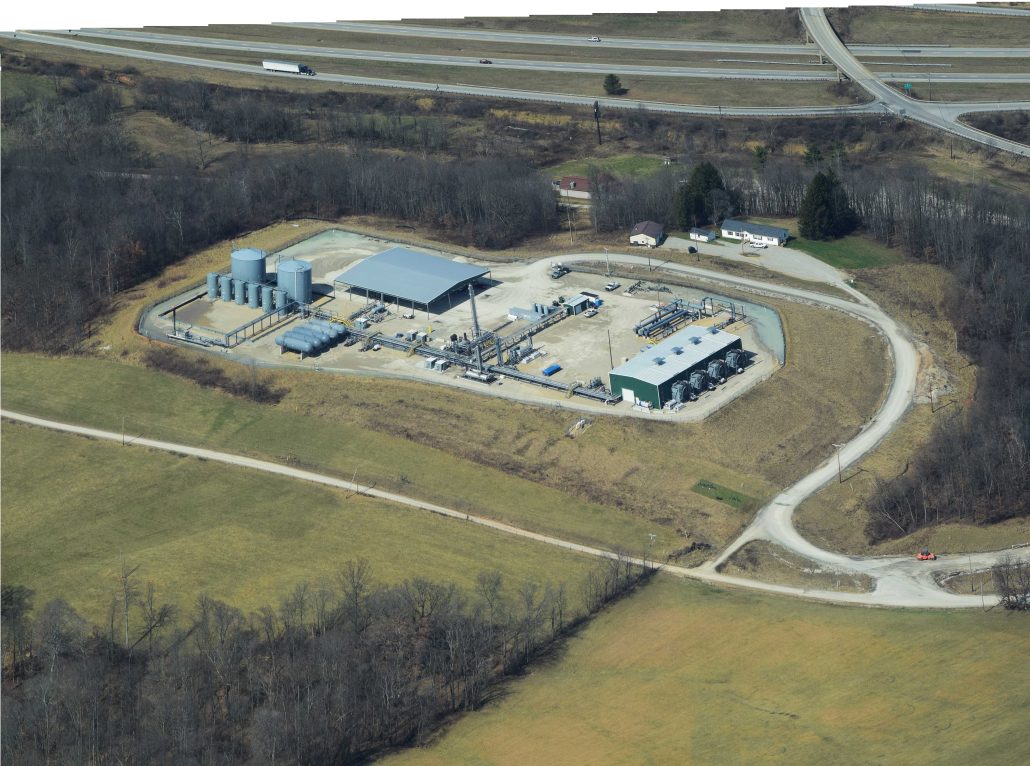
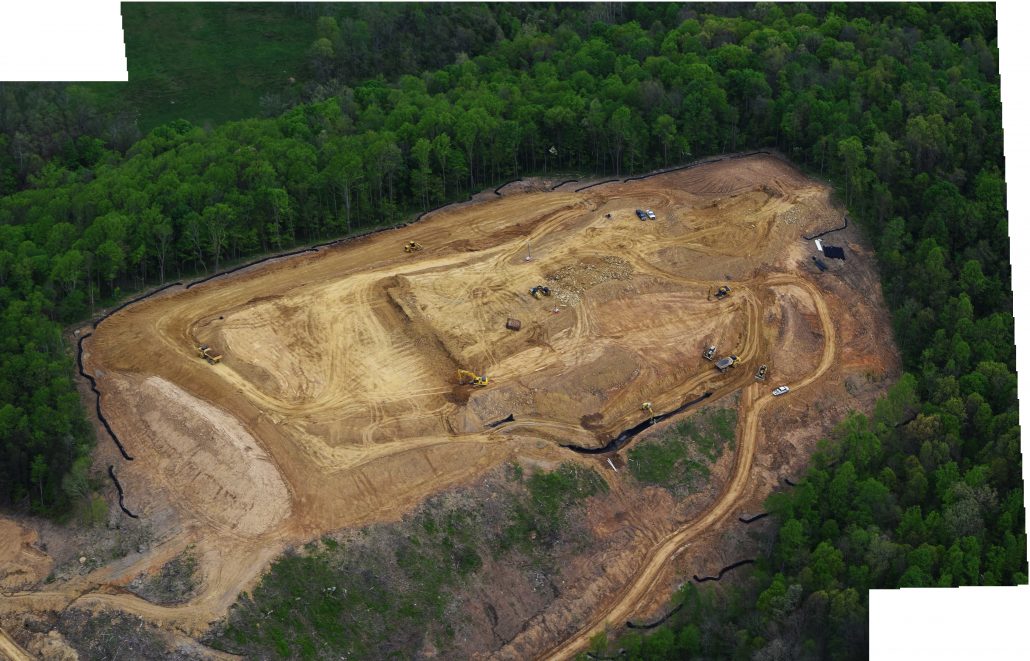
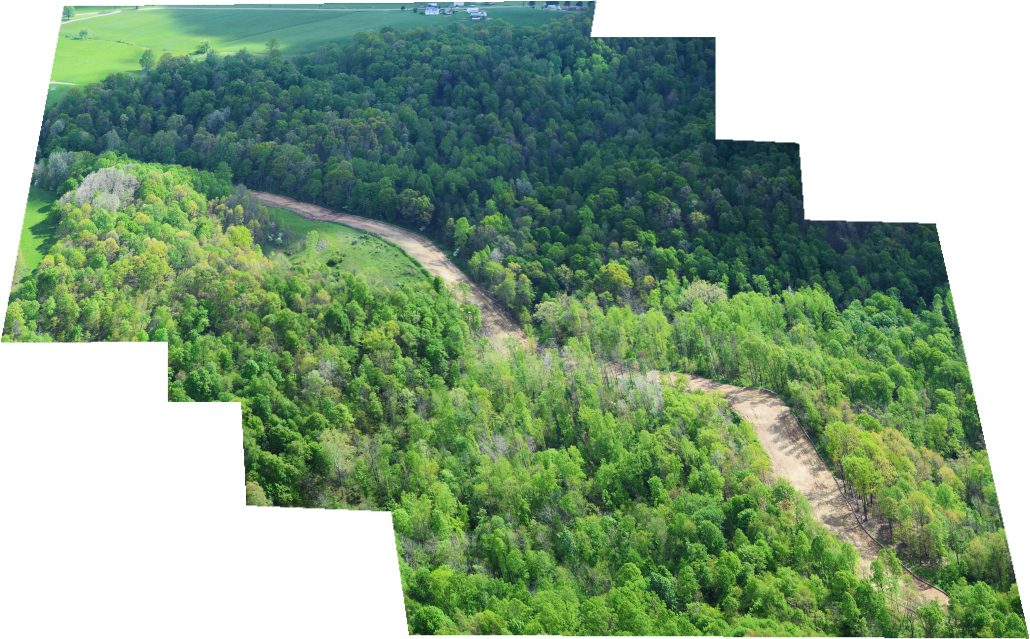
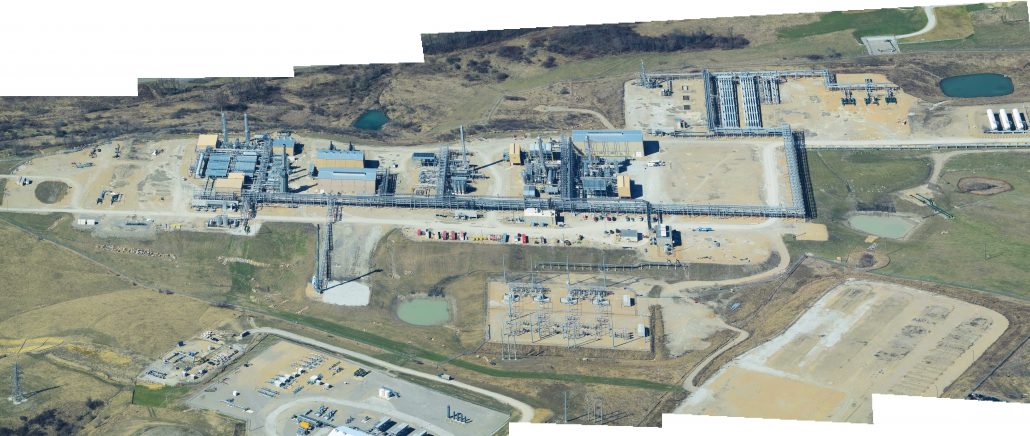
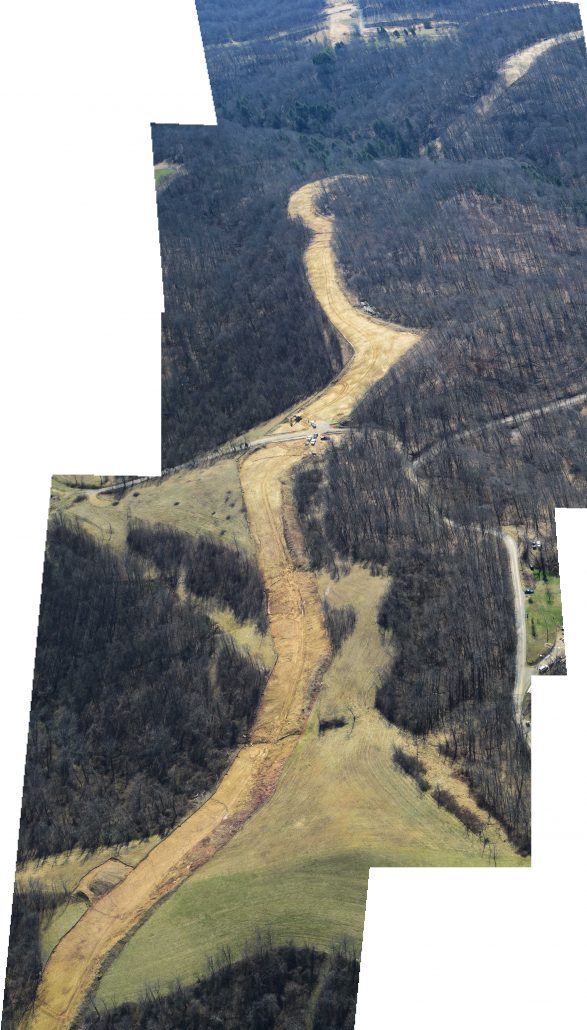
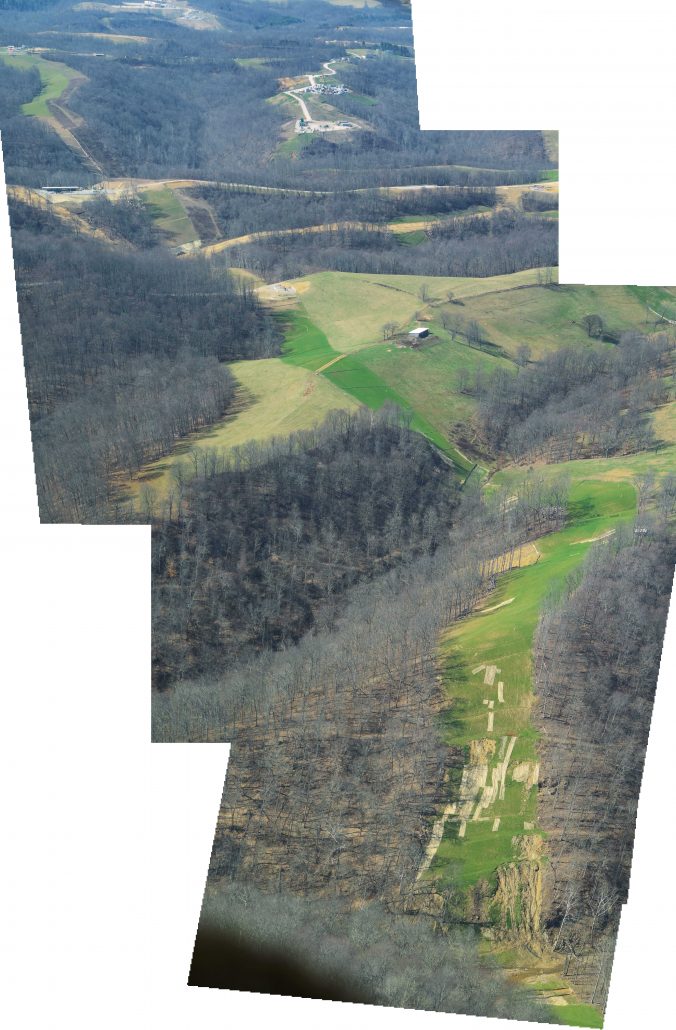
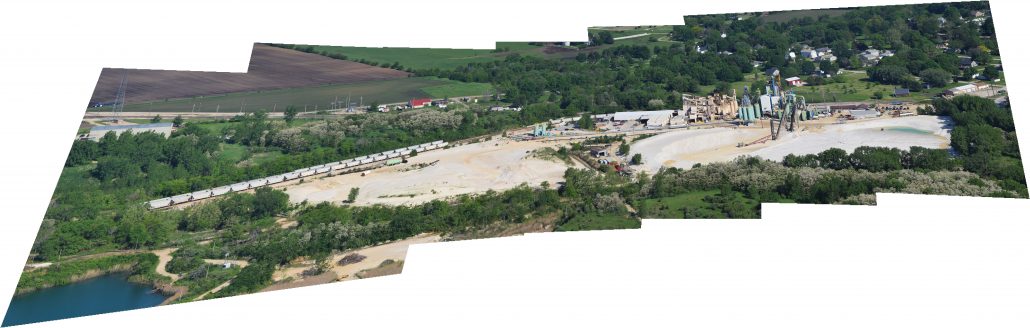
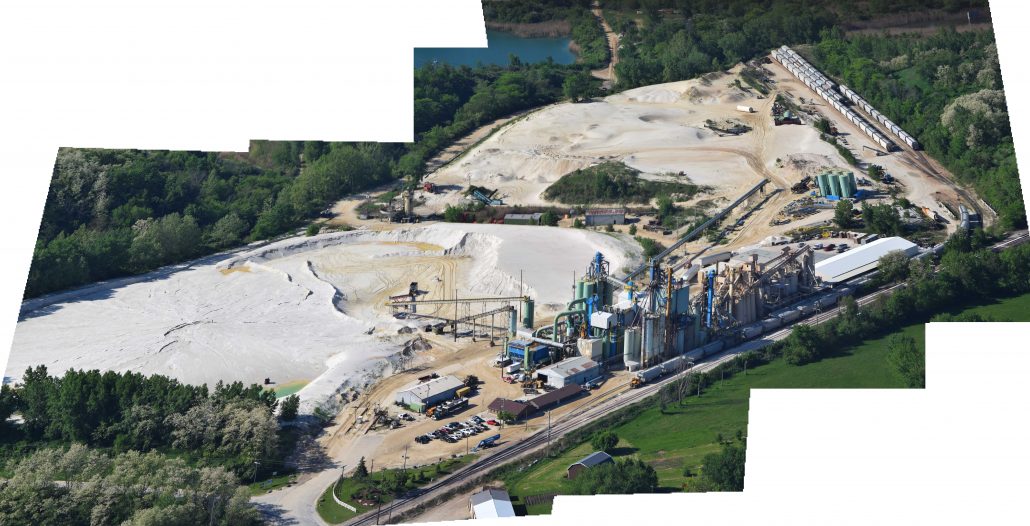
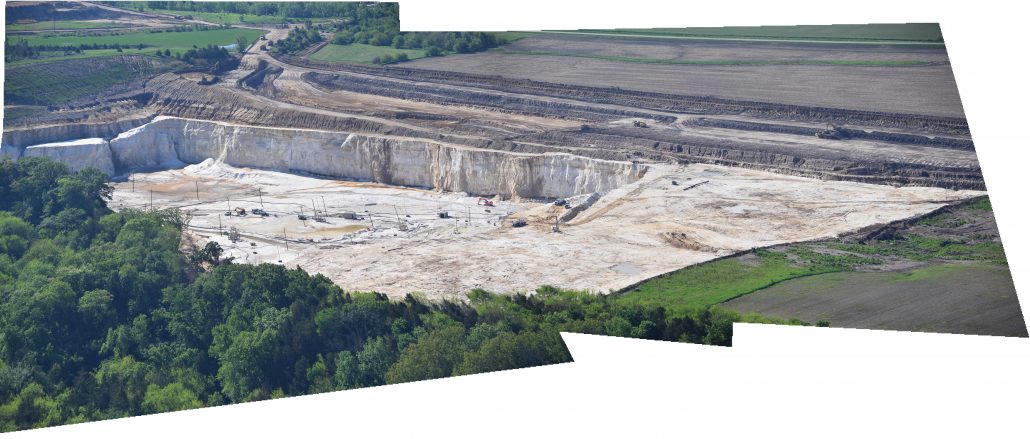
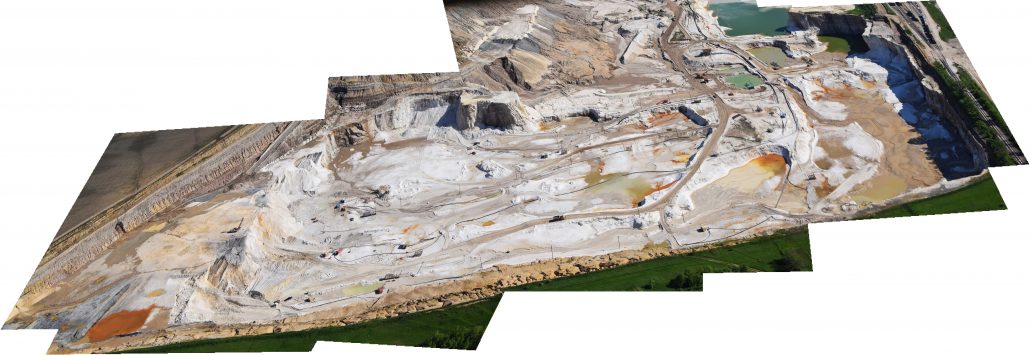
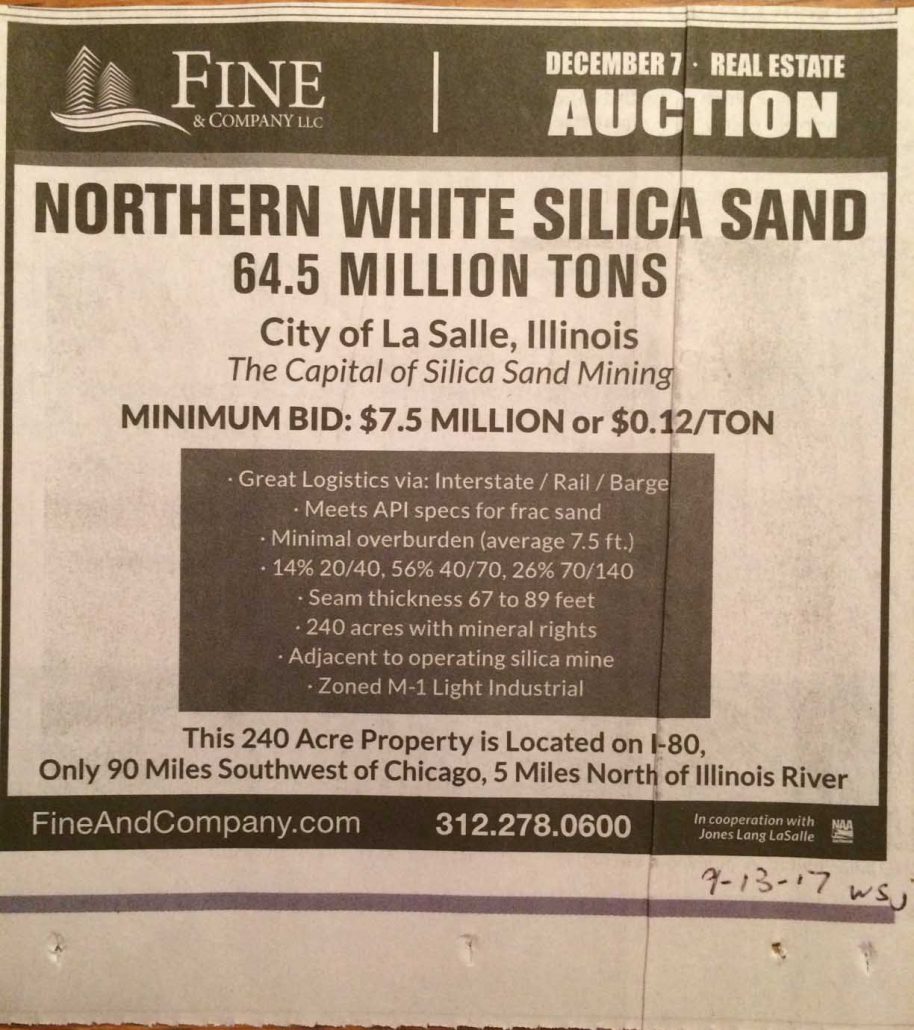
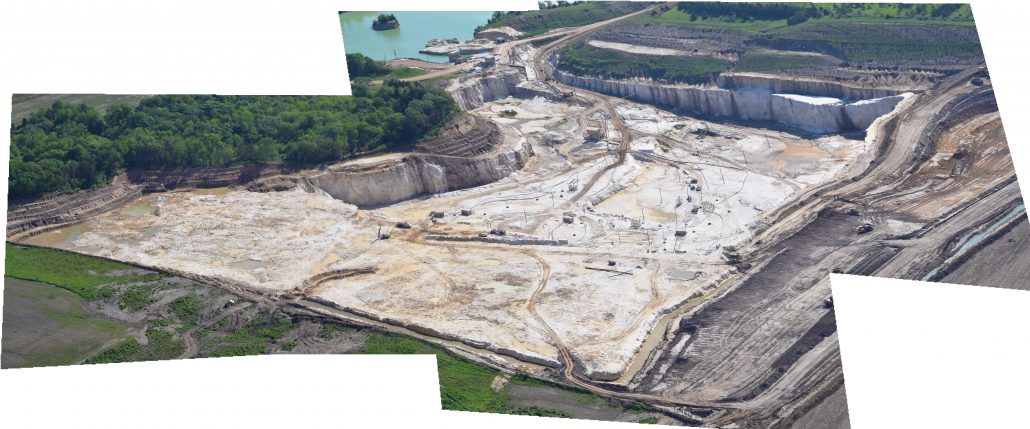