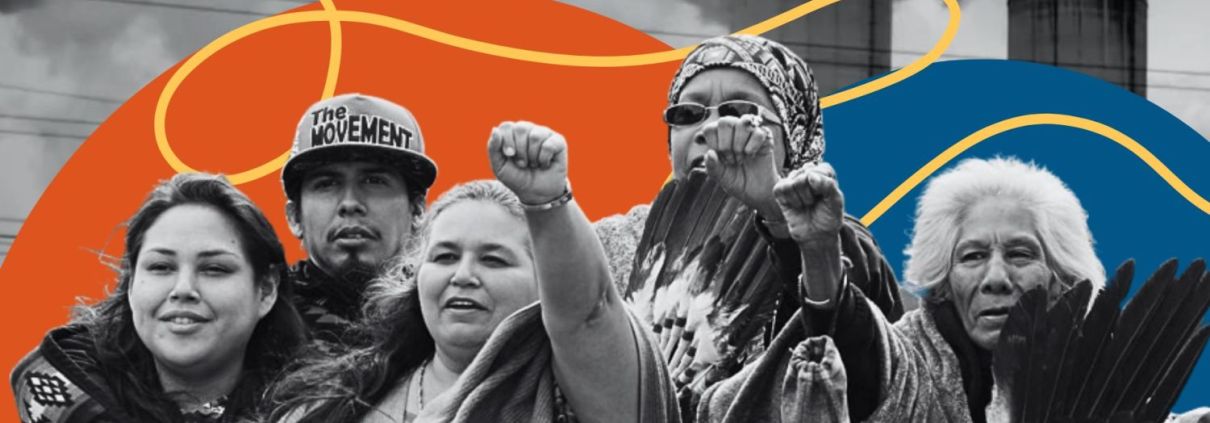
Announcing the 2023 Community Sentinel Awards for Environmental Justice
FracTracker Alliance is pleased announce the recipients of the 2023 Community Sentinel Award for Environmental Stewardship.
FracTracker Alliance is pleased announce the recipients of the 2023 Community Sentinel Award for Environmental Stewardship.
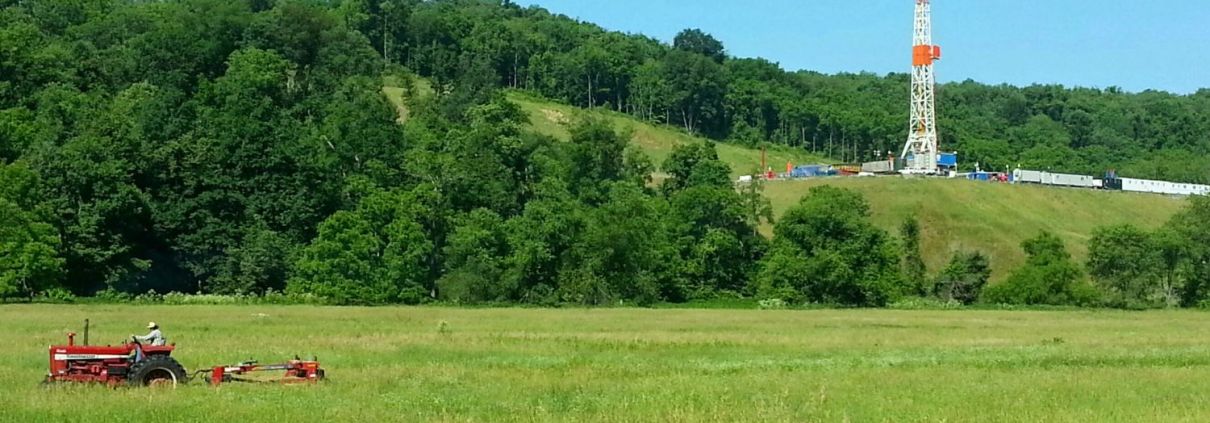
Open-FF is an open-source project that transforms the FracFocus data into an easier-to-use resource to help researchers, interested community members and activists find what they need about fracking chemicals.
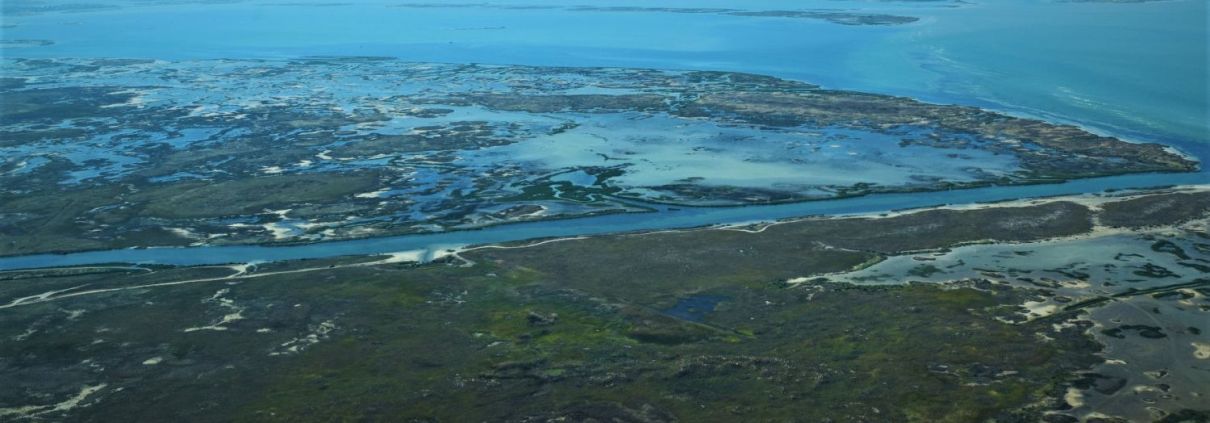
The SCOTUS decision in Sackett v. EPA has significant implications for wetland protection and the future trajectory of environmental regulation in the United States.
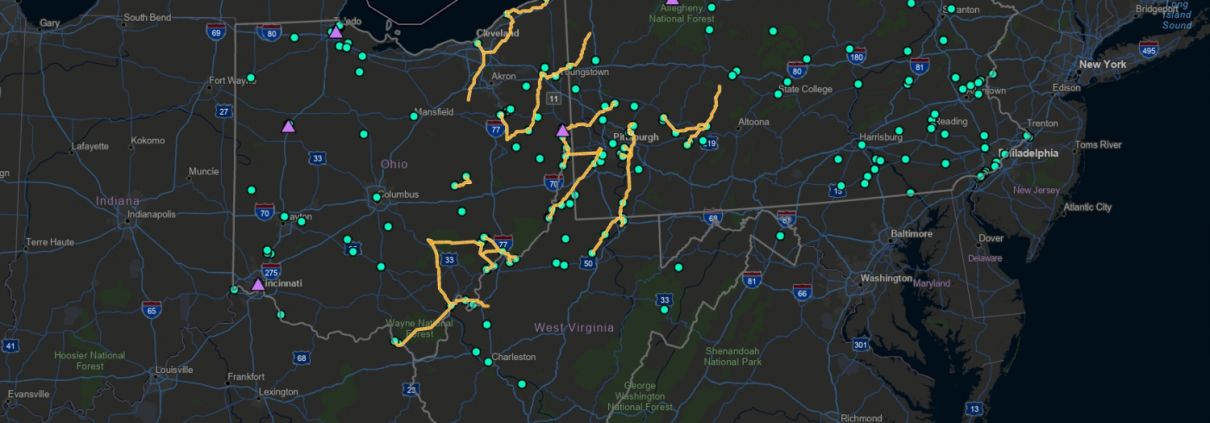
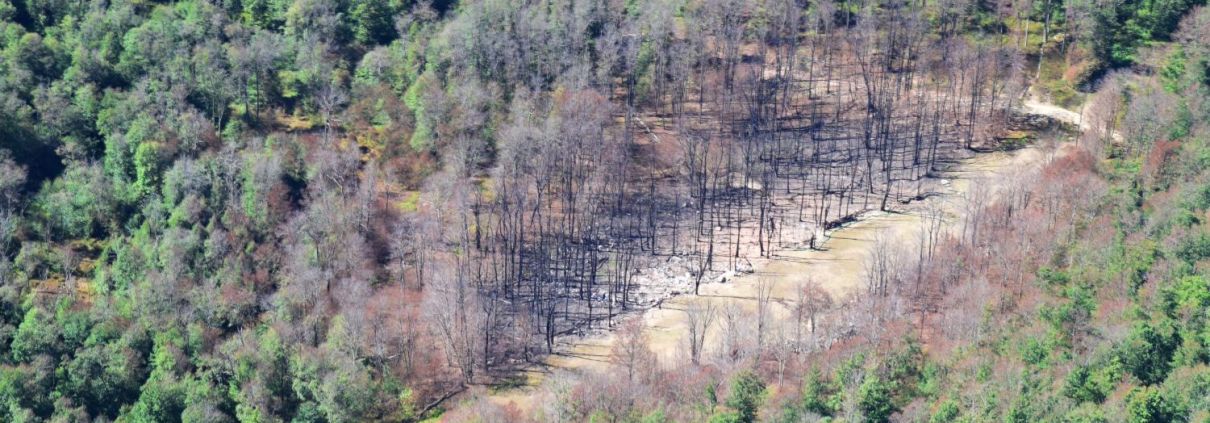
This analysis provides a top-level summary of pipeline incidents reported to the Pipeline and Hazardous Materials Safety Administration (PHMSA) and examines whether or not safe oversight of the industry is possible.
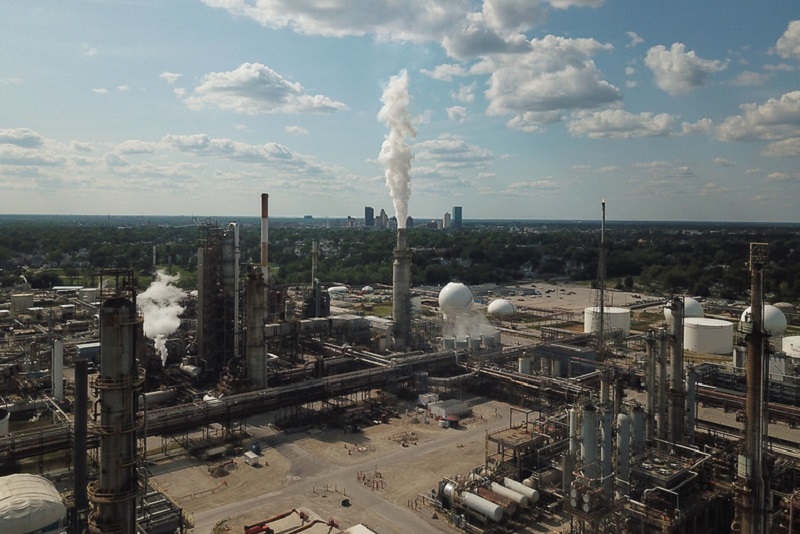
FracTracker Alliance supports strong federal methane rules and urges further improvements that are needed to curb dangerous methane emissions.
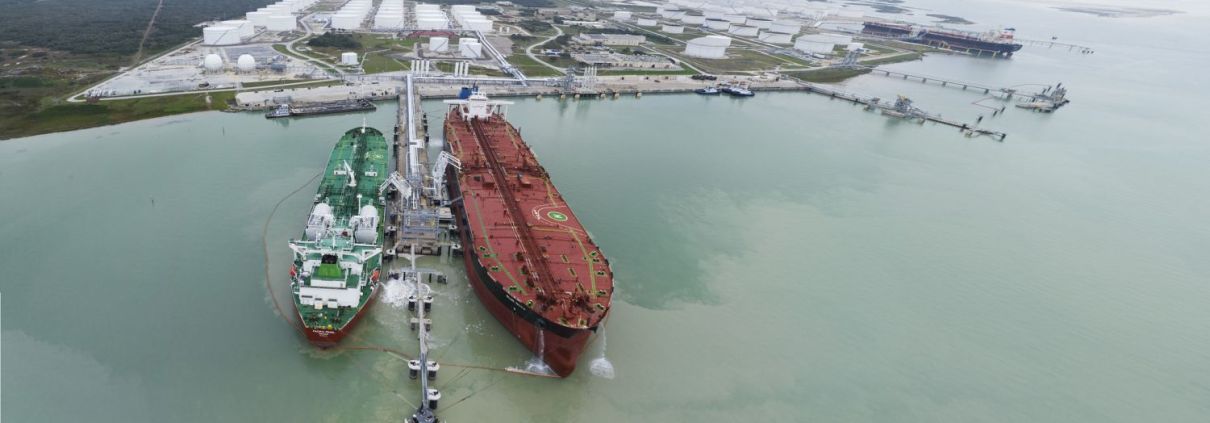
In second installment of this book review, Ted Auch, PhD, reviews chapters 4-8 of Public Responses to Fossil Fuel Export. Published in January 2022, this work explores the social dimensions of the global fossil fuel export system, with a focus on public perceptions and responses to new infrastructures.
In this book review, Ted Auch, PhD, reviews the first three chapters of Public Responses to Fossil Fuel Export. Published in January 2022, this work explores the social dimensions of the global fossil fuel export system, with a focus on public perceptions and responses to new infrastructures.
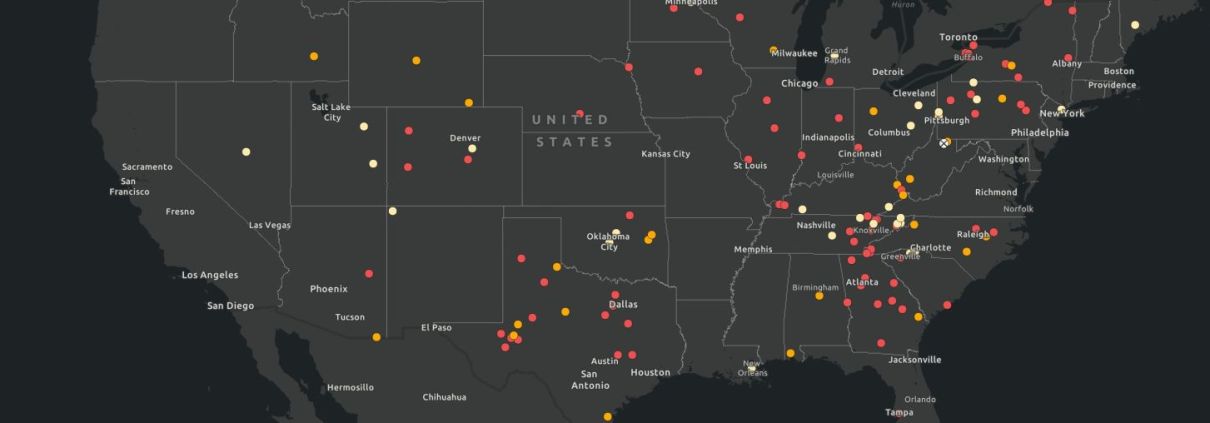
Since late 2021, FracTracker has been collecting information on cryptomining operations around the United States, and has partnered with Global Energy Monitor to further research, document, and map many more of these cryptocurrency mining operations.
A letter written to Equinor USA Operations Manager Chris Golden in September 2022 requesting that Equinor USA cease plans to invest in carbon capture and storage (CCS), carbon capture utilization and storage (CCUS), and hydrogen development in the United States.
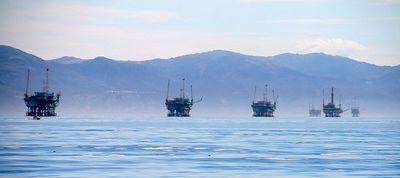
The federal government is accepting comments on a 5-Year Offshore Oil and Gas Lease Program. We need your voice to join in solidarity with communities in the Gulf and the Arctic and call for no new leases.
![]()
216 Franklin St, Suite 400, Johnstown, PA 15901
Phone: +1 (717) 303-0403 | info@fractracker.org
FracTracker Alliance is a 501(c)3 non-profit: Tax identification number: 80-0844297
 Ted Auch, FracTracker Alliance, 2022
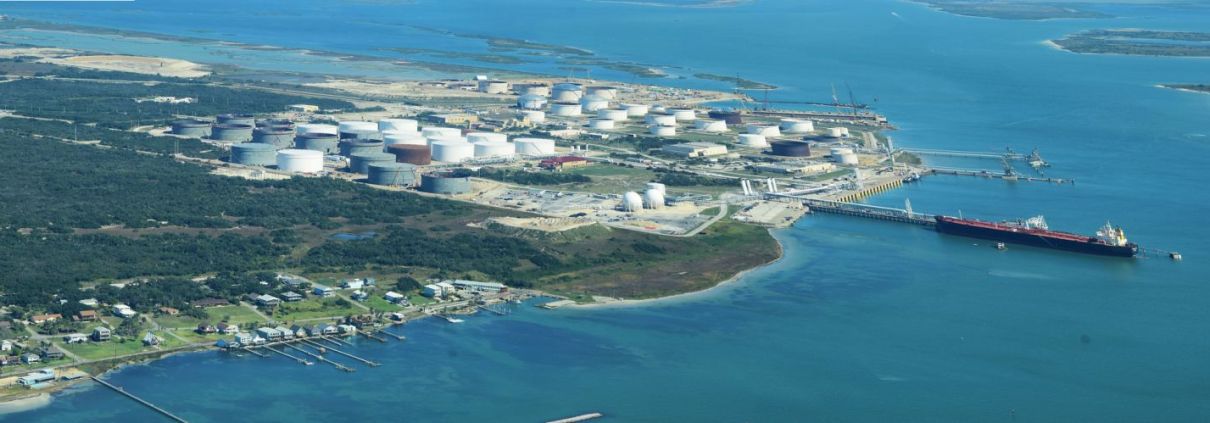 Ted Auch, FracTracker Alliance, 2019. Aerial support provided by LightHawk.