By Brook Lenker, Executive Director, FracTracker Alliance
We came to make a stand. People of every age from every corner of the country amassed in New York City on September 21, 2014 – 400,000 people transported by hope. It may have been the autumnal equinox, but the event was a solstice of human expression and determination.
Down Central Park West, across 59th Street, south on Avenue of the Americas, onward to Times Square. Like the circuitous path of the people’s climate march, lawmakers and society at large have meandered around our fossil fuel dependency for too long but take notice: the era of wasting time and wasting away the planet is over.
You could see it in the eyes of college students, parents, grandparents, and children, and I could see it in my daughter, an unfrackable resolve, stronger than any geology. A man remarked that he hadn’t seen so many young people mobilized since the Vietnam War. It will take the involvement of many, many more to move institutions and the public beyond the status quo – to adopt better technologies, modify lifestyles, and accept wholesale conservation.
Images from the March. Photos by Savanna Lenker
I believe we’ve reached a tipping point with the atmosphere and mankind. The former may be hemorrhaging, getting worse before any sign of recuperation – and that’s downright frightening (from rampaging weather to rising seas, life on earth is in for a helluva ride). But the latter has found a partial cure: intergenerational power lifting and embracing renewable energy and lighter ways for civilization.
Change starts with humility and introspection and gains with peer support. In the one-day, peaceful occupation of midtown Manhattan, warm hearts of spectators and a world in solidarity pushed us ahead. Feel the inertia. Join the ride. Because going forward, nothing will be the same.
OH Utica Production, Water Usage, and Waste Disposal by County Part II of a Multi-part Series
By Ted Auch, Great Lakes Program Coordinator, FracTracker Alliance
In this part of our ongoing “Water-Energy Nexus” series focusing on Water and Water Use, we are looking at how counties in Ohio differ between how much oil and gas are produced, as well as the amount of water used and waste produced. This analysis also highlights how the OH DNR’s initial Utica projections differ dramatically from the current state of affairs. In the first article in this series, we conducted an analysis of OH’s water-energy nexus showing that Utica wells are using an ave. of 5 million gallons/well. As lateral well lengths increase, so does water use. In this analysis we demonstrate that:
Drillers have to use more water, at higher pressures, to extract the same unit of oil or gas that they did years ago,
Where production is relatively high, water usage is lower,
As fracking operations move to the perimeter of a marginally productive play – and smaller LLCs and MLPs become a larger component of the landscape – operators are finding minimal returns on $6-8 million in well pad development costs,
Market forces and Muskingum Watershed Conservancy District (MWCD) policy has allowed industry to exploit OH’s freshwater resources at bargain basement prices relative to commonly agreed upon water pricing schemes.
At current prices1, the shale gas industry is allocating < 0.27% of total well pad costs to current – and growing – freshwater requirements. It stands to reason that this multi-part series could be a jumping off point for a more holistic discussion of how we price our “endless” freshwater resources here in OH.
In an effort to better understand the inter-county differences in water usage, waste production, and hydrocarbon productivity across OH’s 19 Utica Shale counties we compiled a data-set for 500+ Utica wells which was previously used to look at differenced in these metrics across the state’s primary industry players. The results from Table 1 below are discussed in detail in the subsequent sections.
Table 1. Hydrocarbon production totals and per day values with top three producers in bold
County
# Wells
Total
Per Day
Oil
Gas
Brine
Production
Days
Oil
Gas
Brine
Ashland
1
0
0
23,598
102
0
0
231
Belmont
32
55,017
39,564,446
450,134
4,667
20
8,578
125
Carroll
256
3,715,771
121,812,758
2,432,022
66,935
67
2,092
58
Columbiana
26
165,316
9,759,353
189,140
6,093
20
2,178
65
Coshocton
1
949
0
23,953
66
14
0
363
Guernsey
29
726,149
7,495,066
275,617
7,060
147
1,413
49
Harrison
74
2,200,863
31,256,851
1,082,239
17,335
136
1,840
118
Jefferson
14
8,396
9,102,302
79,428
2,819
2
2,447
147
Knox
1
0
0
9,078
44
0
0
206
Mahoning
3
2,562
0
4,124
287
9
0
14
Medina
1
0
0
20,217
75
0
0
270
Monroe
12
28,683
13,077,480
165,424
2,045
22
7,348
130
Muskingum
1
18,298
89,689
14,073
455
40
197
31
Noble
39
1,326,326
18,251,742
390,791
7,731
268
3,379
267
Portage
2
2,369
75,749
10,442
245
19
168
228
Stark
1
17,271
166,592
14,285
602
29
277
24
Trumbull
8
48,802
742,164
127,222
1,320
36
566
100
Tuscarawas
1
9,219
77,234
2,117
369
25
209
6
Washington
3
18,976
372,885
67,768
368
59
1,268
192
Production
Total
It will come as no surprise to the reader that OH’s Utica oil and gas production is being led by Carroll County, followed distantly by Harrison, Noble, Belmont, Guernsey and Columbiana counties. Carroll has produced 3.7 million barrels of oil to date, while the latter have combined to produce an additional 4.5 million barrels. Carroll wells have been in production for nearly 67,000 days2, while the aforementioned county wells have been producing for 42,886 days. The remaining counties are home to 49 wells that have been in production for nearly 8,800 days or 7% of total production days in Ohio.
Combined with the state’s remaining 49 producing wells spread across 13 counties, OH’s Utica Shale has produced 8.3 million barrels of oil as well as 251,844,311 Mcf3 of natural gas and 5.4 million barrels of brine. Oil and natural gas together have an estimated value of $2.99 billion ($213 million per quarter)4 assuming average oil and natural gas prices of $96 per barrel and $8.67 per Mcf during the current period of production (2011 to Q2-2014), respectively.
Potential Revenue at Different Severance Tax Rates:
Current production tax, 0.5-0.8%: $19 million ($1.4 Million Per Quarter (MPQ). At this rate it would take the oil and gas industry 35 years to generate the $4.6 billion in tax revenue they proposed would be generated by 2020.
Proposed, 1% gas and 4% oil: At Governor Kasich’s proposed tax rate, $2.99 billion translates into $54 million ($3.9 MPQ). It would still take 21 years to return the aforementioned $4.6 billion to the state’s coffers.
The bottom-line is that a production tax of 11-25% or more ($24-53 MPQ) would be necessary to generate the kind of tax revenue proposed by the end of 2020. This type of O&G taxation regime is employed in the states of Alaska and Oklahoma.
From an outreach and monitoring perspective, effects on air and water quality are two of the biggest gaps in our understanding of shale gas from a socioeconomic, health, and environmental perspective. Pulling out a mere 1% from any of these tax regimes would generate what we’ll call an “Environmental Monitoring Fee.” Available monitoring funds would range between $194,261 and $1.8 million ($16 million at 55%). These monies would be used to purchase 2-21 mobile air quality devices and 10-97 stream quantity/quality gauges to be deployed throughout the state’s primary shale counties to fill in the aforementioned data gaps.
Per-Day Production
On a per-day oil production basis, Belmont and Columbiana (20 barrels per day (BPD)) are overshadowed by Washington (59 BPD) and Muskingum (40 BPD) counties’ four giant Utica wells. Carroll is able to maintain such a high level of production relative to the other 15 counties by shear volume of producing wells; Noble (268 BPD), Guernsey (147 BPD), and Harrison (136 BPD) counties exceed Carroll’s production on a per-day basis. The bottom of the league table includes three oil-free wells in Ashland, Knox, and Medina, as well as seventeen <10 BPD wells in Jefferson and Mahoning counties.
With respect to natural gas, Harrison (1,840 Mcf per day (MPD)) and Guernsey counties are replaced by Monroe (7,348 MPD) and Jefferson (2,447 MPD) counties’ 26 Utica wells. The range of production rates for natural gas is represented by the king of natural gas producers, Belmont County, producing 8,578 MPD on the high end and Mahoning and Coshocton counties in addition to the aforementioned oil dry counties on the low end. Four of the five oil- or gas-dry counties produce the least amount of brine each day (BrPD). Coshocton, Medina, and Noble county Utica wells are currently generating 267-363 barrels of BrPD, with an additional seven counties generating 100-200 BrPD. Only four counties – 1.2% of OH Utica wells – are home to unconventional wells that generate ≤ 30 BrPD.
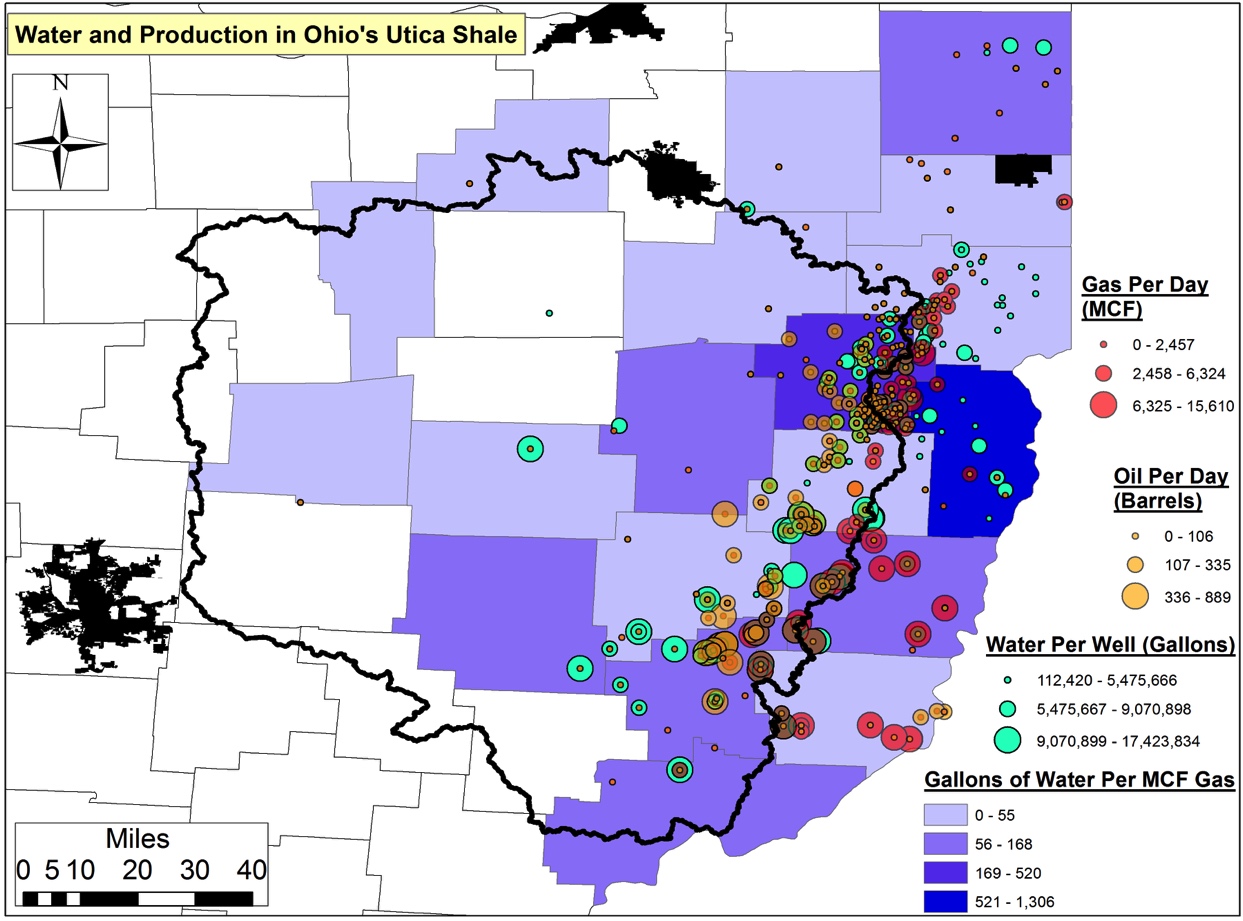
Water Usage
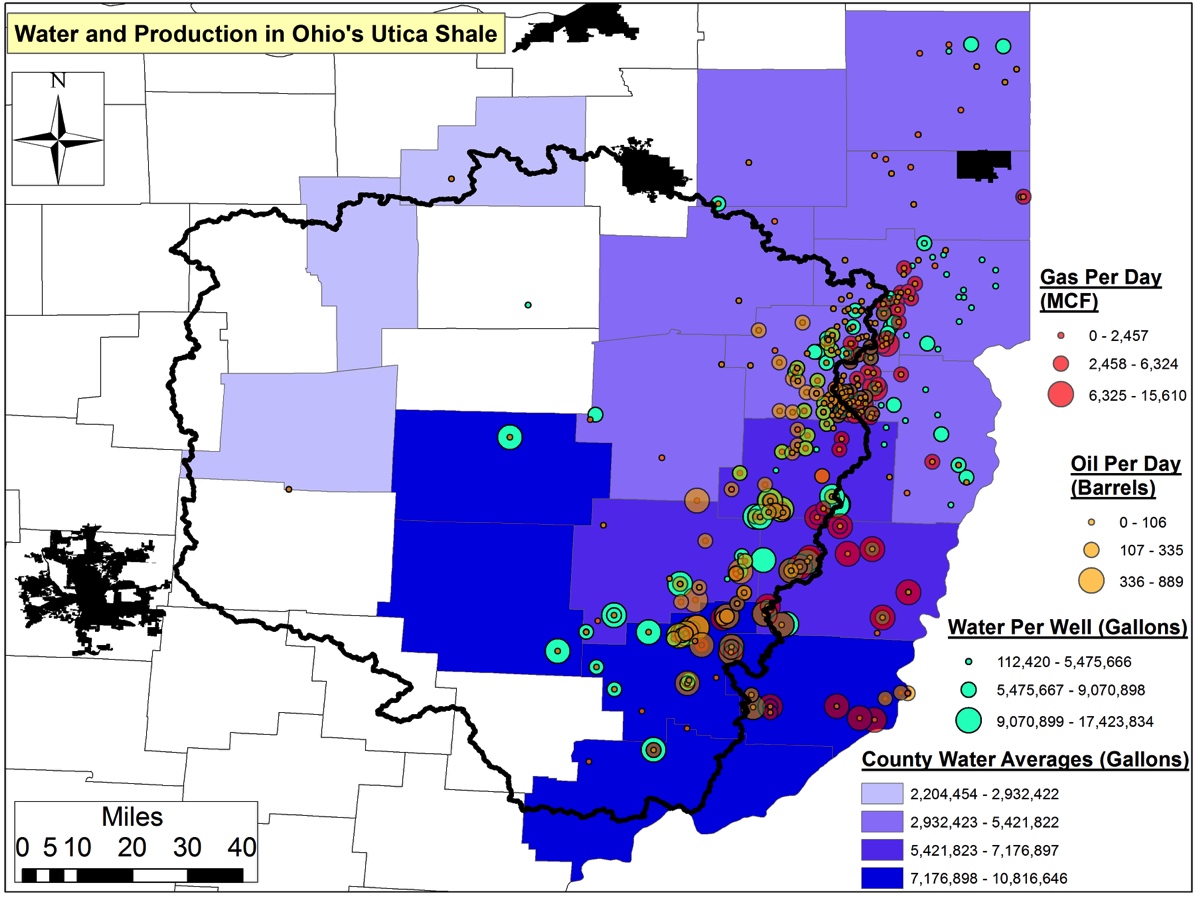
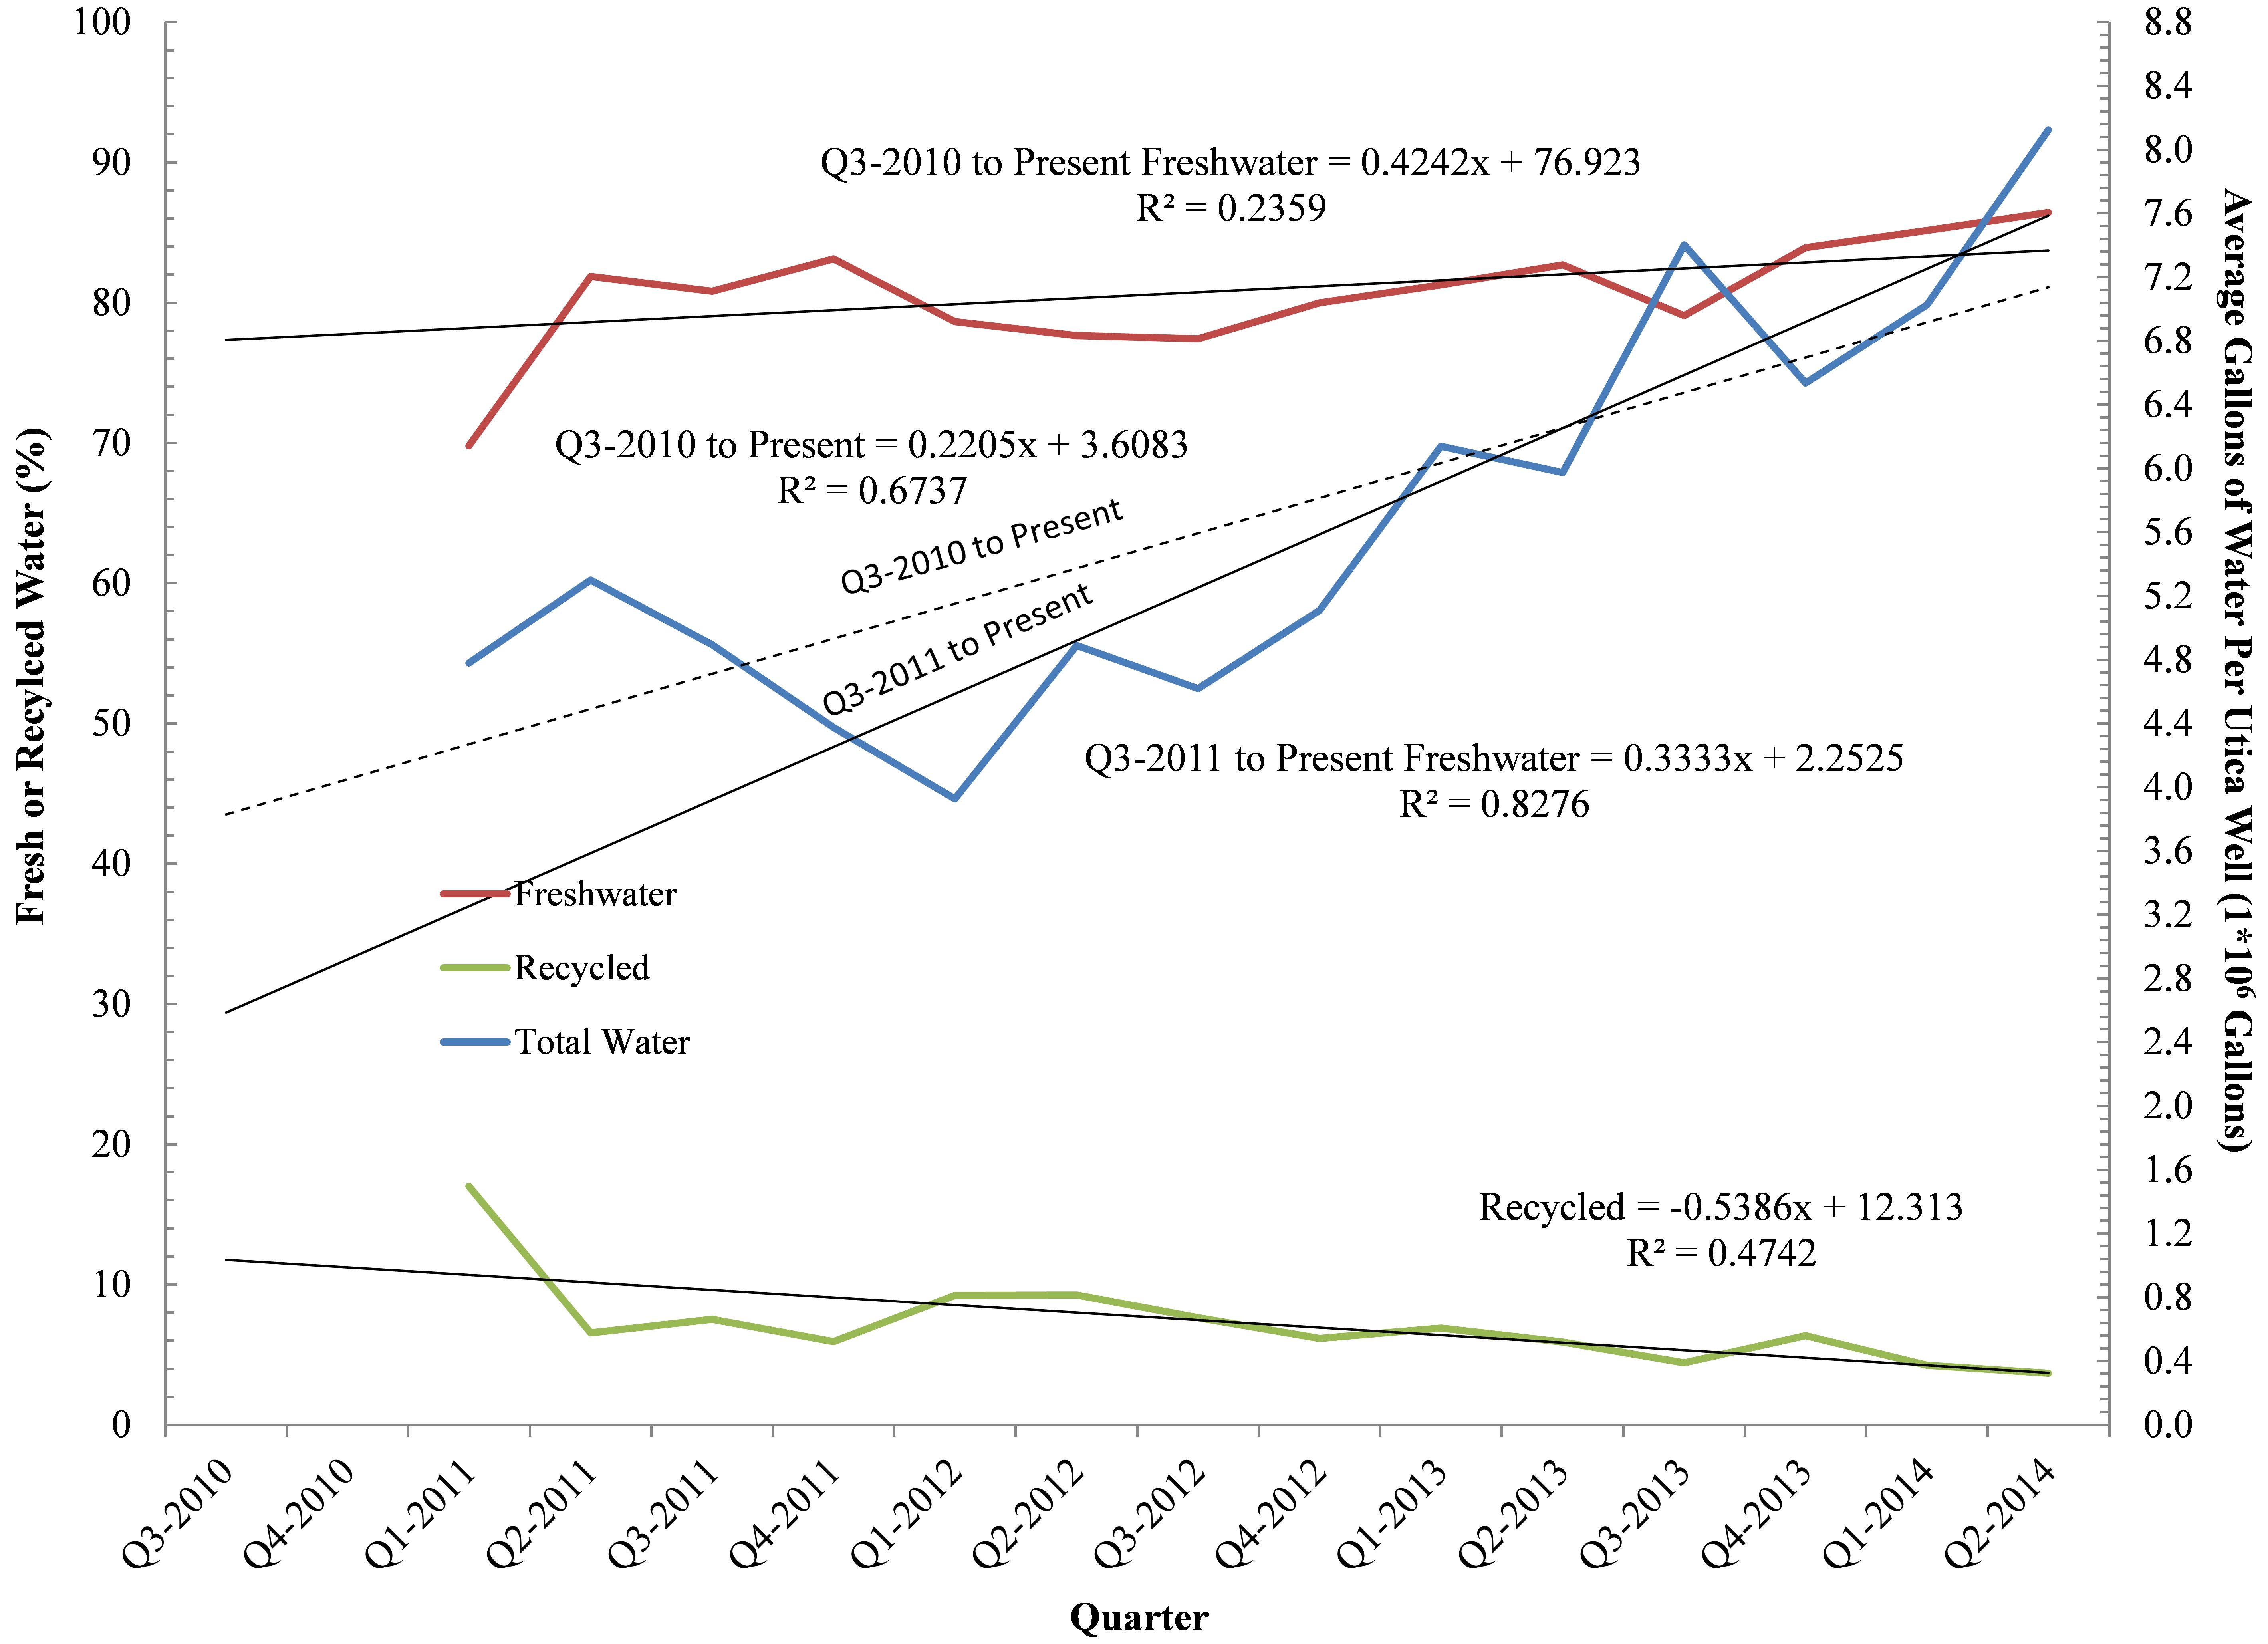
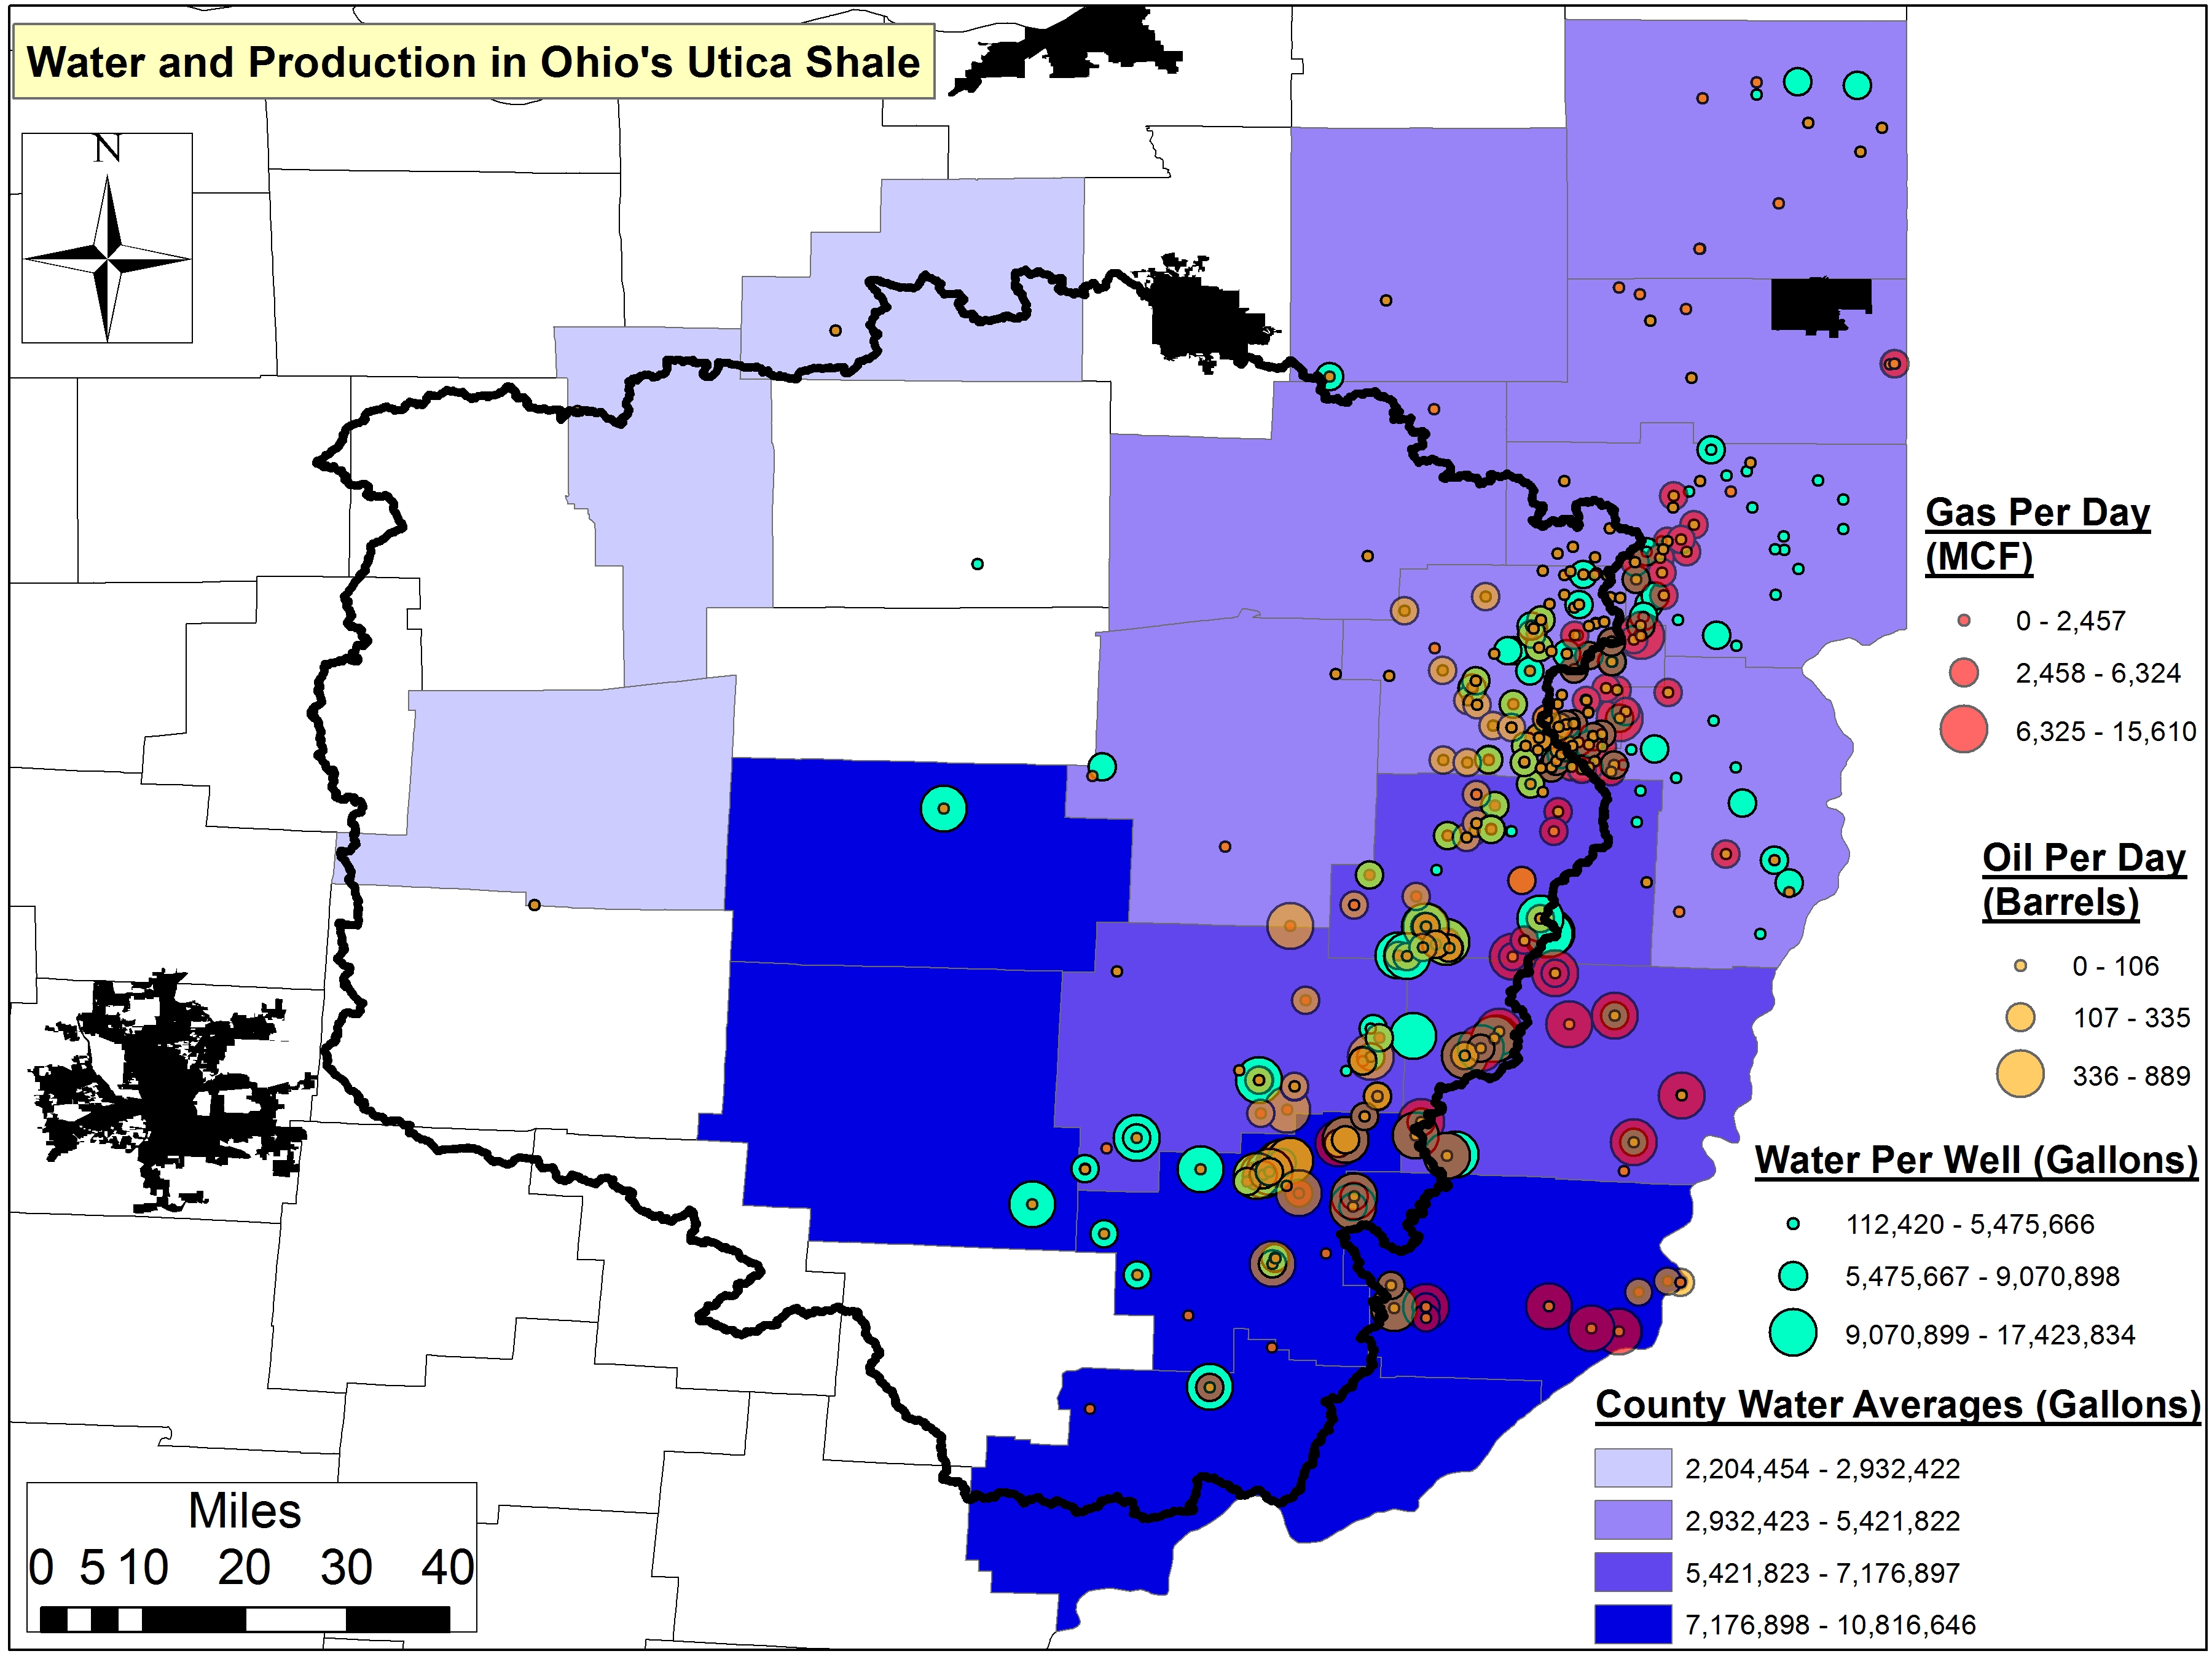
Freshwater is needed for the hydraulic fracturing process during well stimulation. For counties where we had compiled a respectable sample size we found that Monroe and Noble counties are home to the Utica wells requiring the greatest amount of freshwater to obtain acceptable levels of productivity (Figure 1). Monroe and Noble wells are using 10.6 and 8.8 million gallons (MGs) of water per well. Coshocton is home to a well that required 10.8 MGs, while Muskingum and Washington counties are home to wells that have utilized 10.2 and 9.5 MGs, respectively. Belmont, Guernsey, and Harrison reflect the current average state of freshwater usage by the Utica Shale industry in OH, with average requirements of 6.4, 6.9, and 7.2 MGs per well. Wells in eight other counties have used an average of 3.8 (Mahoning) to 5.4 MGs (Tuscarawas). The counties of Ashland, Knox, and Medina are home to wells requiring the least amount of freshwater in the range of 2.2-2.9 MGs. Overall freshwater demand on a per well basis is increasing by 220,500-333,300 gallons per quarter in Ohio with percent recycled water actually declining by 00.54% from an already trivial average of 6-7% in 2011 (Figure 2).
Figure 1. Average water usage (gallons) per Utica well by county
Figure 2. Average water usage (gallons) on per well basis by OH Utica Shale industry, shown quarterly between Q3-2010 & Q2-2014.
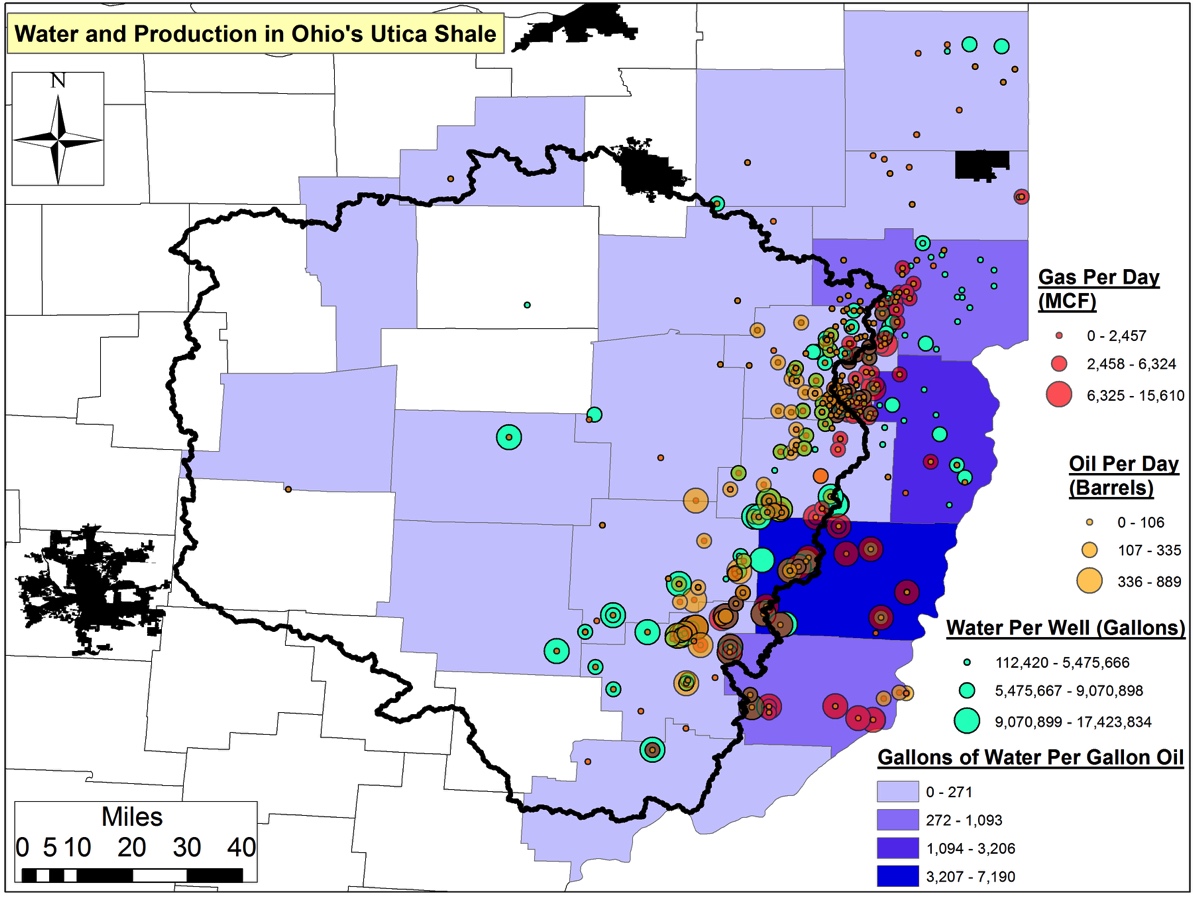
Belmont County’s 30+ Utica wells are the least efficient with respect to oil recovery relative to freshwater requirements, averaging 7,190 gallons of water per gallon of oil (Figure 3). A distant second is Jefferson County’s 14 wells, which have required on average 3,205 gallons of water per gallon of oil. Columbiana’s 26 Utica wells are in third place requiring 1,093 gallons of freshwater. Coshocton, Mahoning, Monroe, and Portage counties are home to wells requiring 146-473 gallons for each gallon of oil produced.
Belmont County’s 14 Utica wells are the least efficient with respect to natural gas recovery relative to freshwater requirements (Figure 4). They average 1,306 gallons of water per Mcf. A distant second is Carroll County’s 250+ wells, which have injected 520 gallons of water 7,000+ feet below the earth’s service to produce a single Mcf of natural gas. Muskingum’s Utica well and Noble County’s 39 wells are the only other wells requiring more than 100 gallons of freshwater per Mcf. The remaining nine counties’ wells require 15-92 gallons of water to produce an Mcf of natural gas.
Figure 3. Average water usage (gallons) per unit of oil (gallons) produced across 19 Ohio Utica counties
Figure 4. Average water usage (gallons) per unit of gas produced (Mcf) across 19 Ohio Utica counties
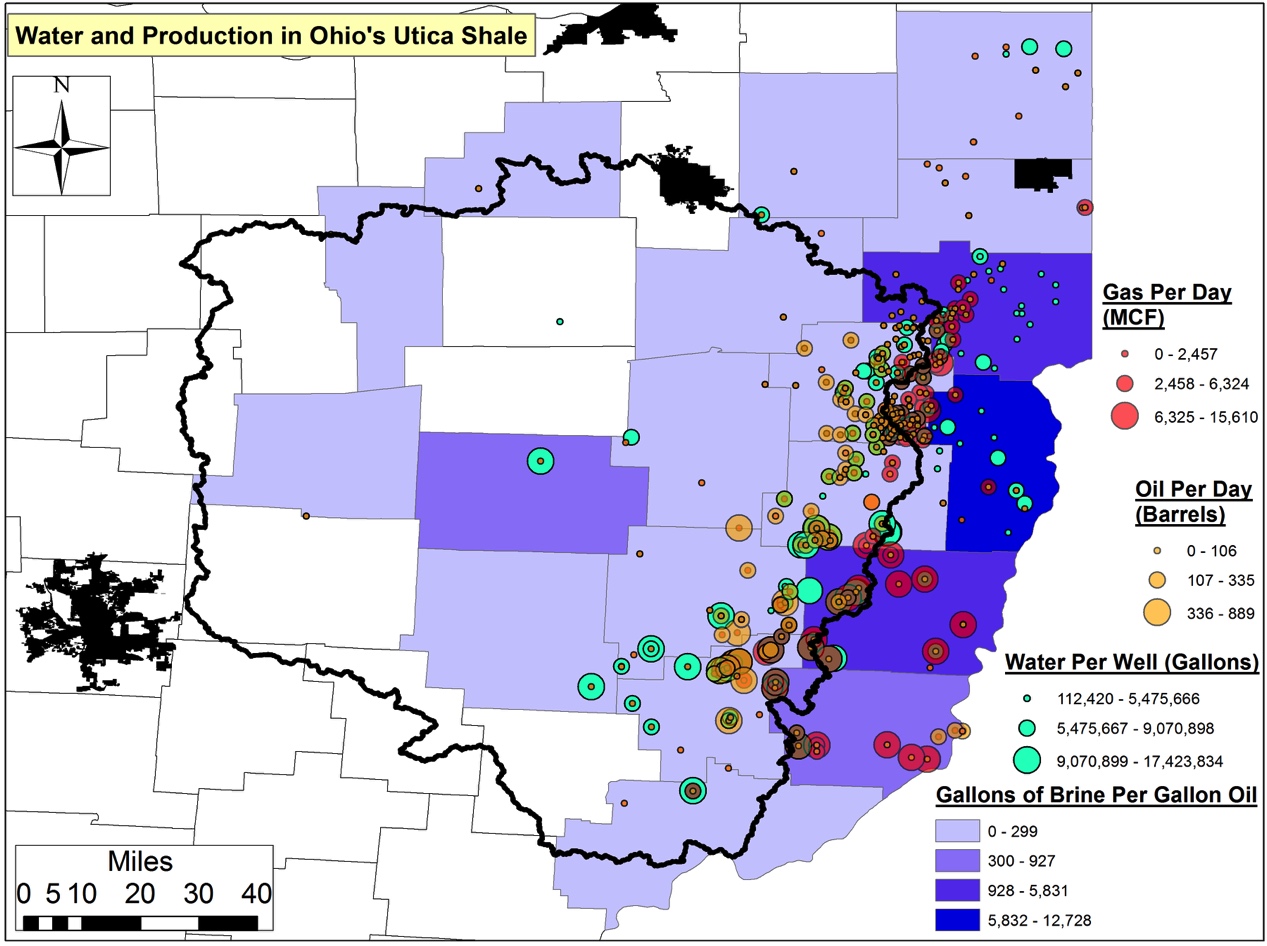
Waste Production
The aforementioned Jefferson wells are the least efficient with respect to waste vs. product produced. Jefferson wells are generating 12,728 gallons of brine per gallon of oil (Figure 5).6 Wells from this county are followed distantly by the 32 Belmont and 26 Columbiana county wells, which are generating 5,830 and 3,976 gallons of brine per unit of oil.5 The remaining counties (for which we have data) are using 8-927 gallons of brine per unit of oil; six counties’ wells are generating <38 gallons of brine per gallon of oil.
Figure 5. Average brine production (gallons) per gallon of oil produced per day across 19 Ohio Utica Counties
The average Utica well in OH is generating 820 gallons of fracking waste per unit of product produced. Across all OH Utica wells, an average of 0.078 gallons of brine is being generated for every gallon of freshwater used. This figure amounts to a current total of 233.9 MGs of brine waste produce statewide. Over the next five years this trend will result in the generation of one billion gallons (BGs) of brine waste and 12.8 BGs of freshwater required in OH. Put another way…
233.9 MGs is equivalent to the annual waste production of 5.2 million Ohioans – or 45% of the state’s current population.
Due to the low costs incurred by industry when they choose to dispose of their fracking waste in OH, drillers will have only to incur $100 million over the next five years to pay for the injection of the above 1.0 BGs of brine. Ohioans, however, will pay at least $1.5 billion in the same time period to dispose of their municipal solid waste. The average fee to dispose of every ton of waste is $32, which means that the $100 million figure is at the very least $33.5 million – and as much as $250.6 million – less than we should expect industry should be paying to offset the costs.
Environmental Accounting
In summary, there are two ways to look at the potential “energy revolution” that is shale gas:
Using the same traditional supply-side economics metrics we have used in the past (e.g., globalization, Efficient Market Hypothesis, Trickle Down Economics, Bubbles Don’t Exist) to socialize long-term externalities and privatize short-term windfall profits, or
We can begin to incorporate into the national dialogue issues pertaining to watershed resilience, ecosystem services, and the more nuanced valuation of our ecosystems via Ecological Economics.
The latter will require a more real-time and granular understanding of water resource utilization and fracking waste production at the watershed and regional scale, especially as it relates to headline production and the often-trumpeted job generating numbers.
We hope to shed further light on this new “environmental accounting” as it relates to more thorough and responsible energy development policy at the state, federal, and global levels. The life cycle costs of shale gas drilling have all too often been ignored and can’t be if we are to generate the types of energy our country demands while also stewarding our ecosystems. As Mark Twain is reported to have said “Whiskey is for drinking; water is for fighting over.” In order to avoid such a battle over the water-energy nexus in the long run it is imperative that we price in the shale gas industry’s water-use footprint in the near term. As we have demonstrated so far with this series this issue is far from settled here in OH and as they say so goes Ohio so goes the nation!
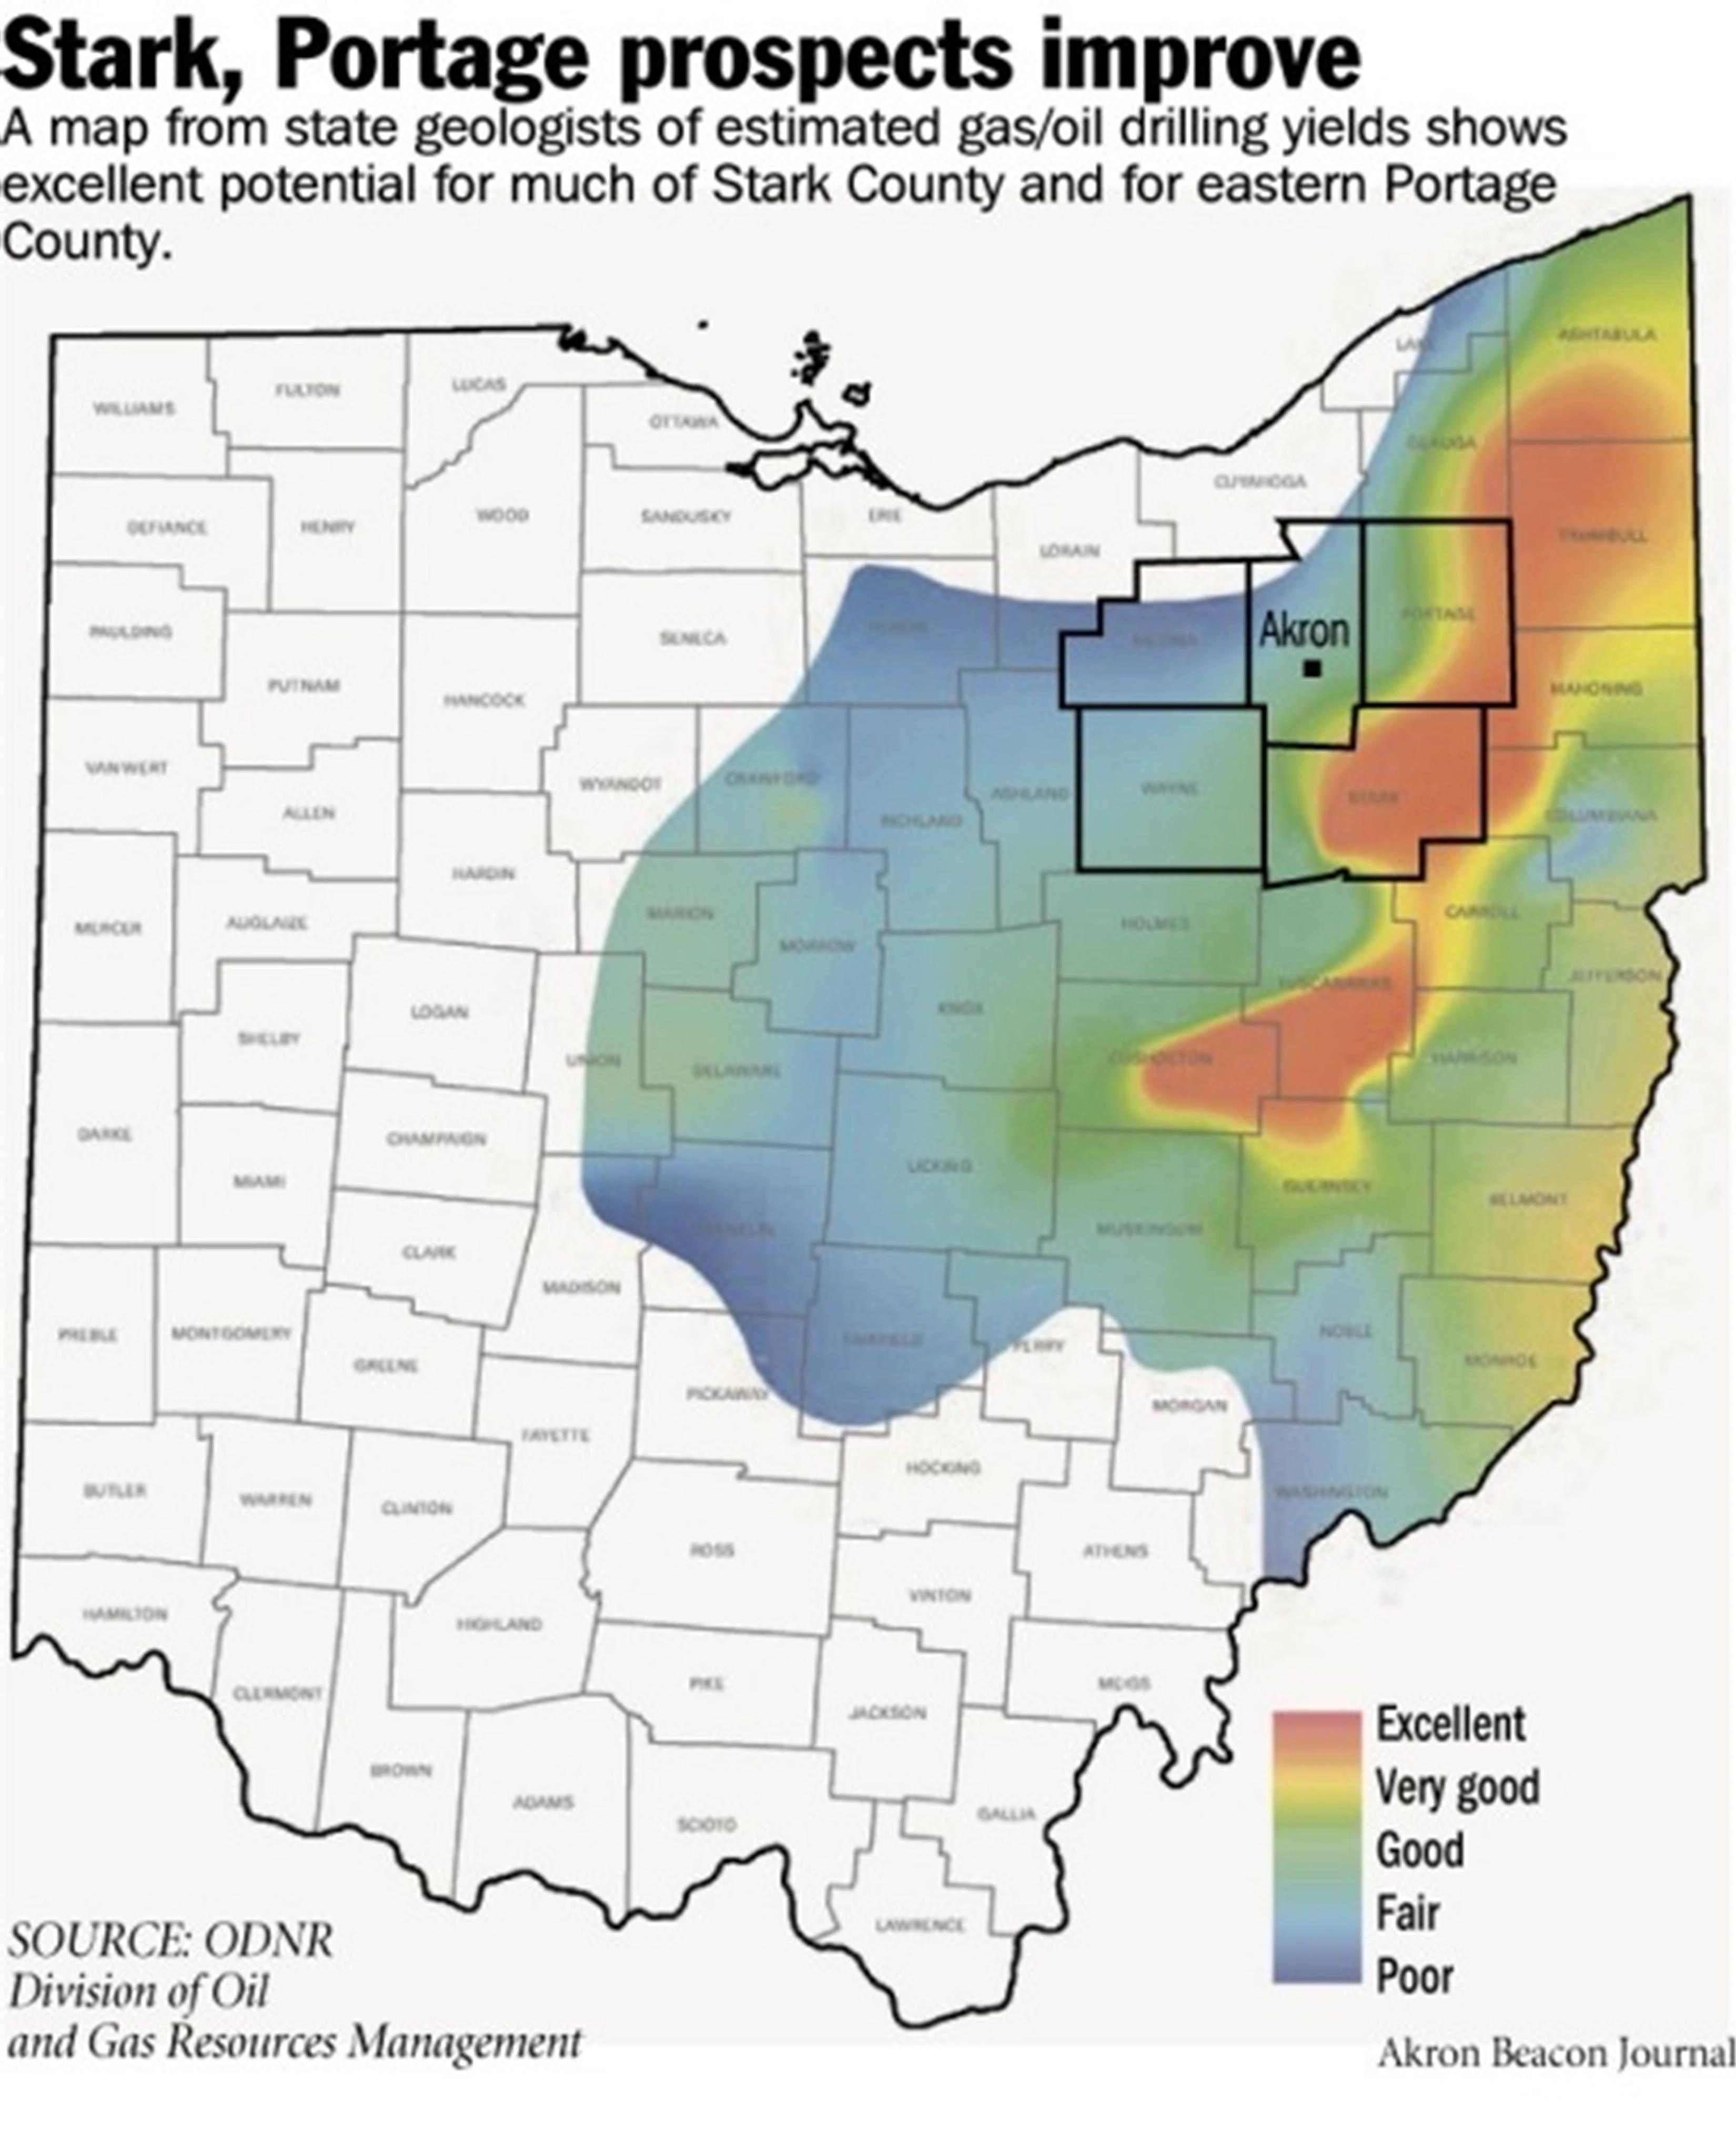
A Moving Target
Figure 6. ODNR projection map of potential Utica productivity from spring 2012
OH’s Department of Natural Resources (ODNR) originally claimed a big red – and nearly continuous – blob of Utica productivity existed. The projection originally stretched from Ashtabula and Trumbull counties south-southwest to Tuscarawas, Guernsey, and Coshocton along the Appalachian Plateau (See Figure 6).
However, our analysis demonstrates that (Figures 7 and 8):
This is a rapidly moving target,
The big red blob isn’t as big – or continuous – as once projected, and
It might not even include many of the counties once thought to be the heart of the OH Utica shale play.
This last point is important because counties, families, investors, and outside interests were developing investment and/or savings strategies based on this map and a 30+ year timeframe – neither of which may be even remotely close according to our model.
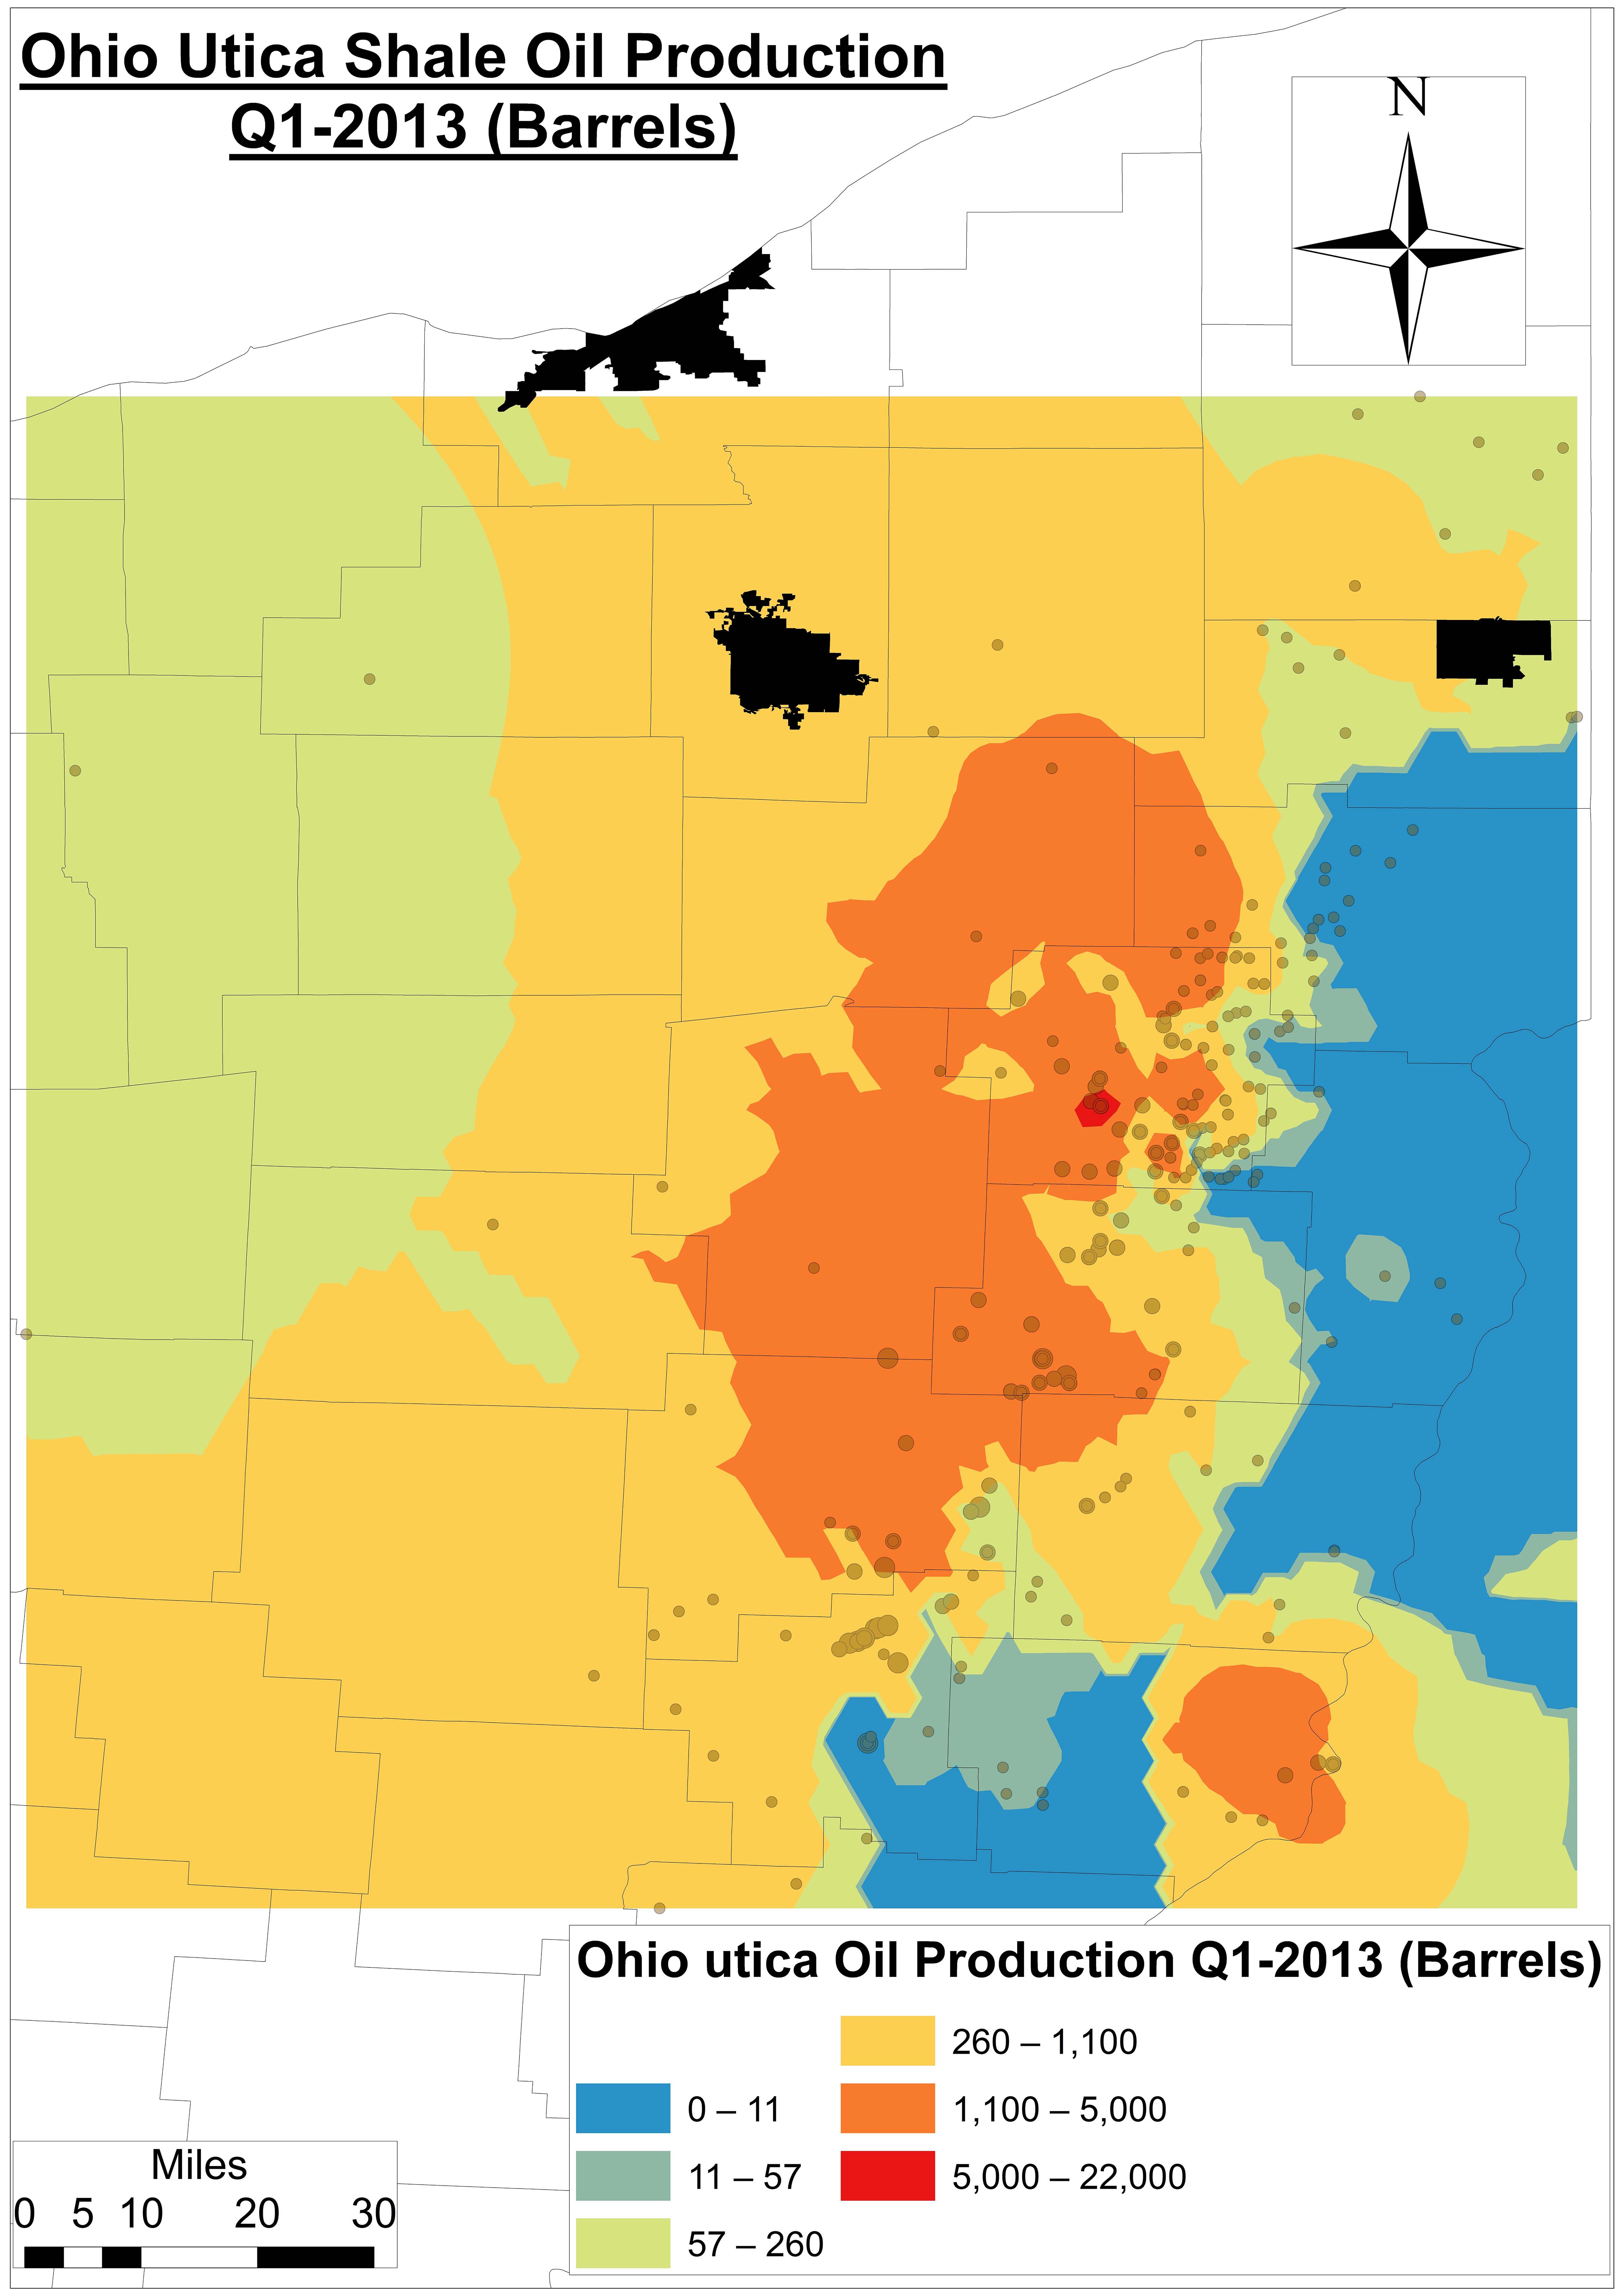
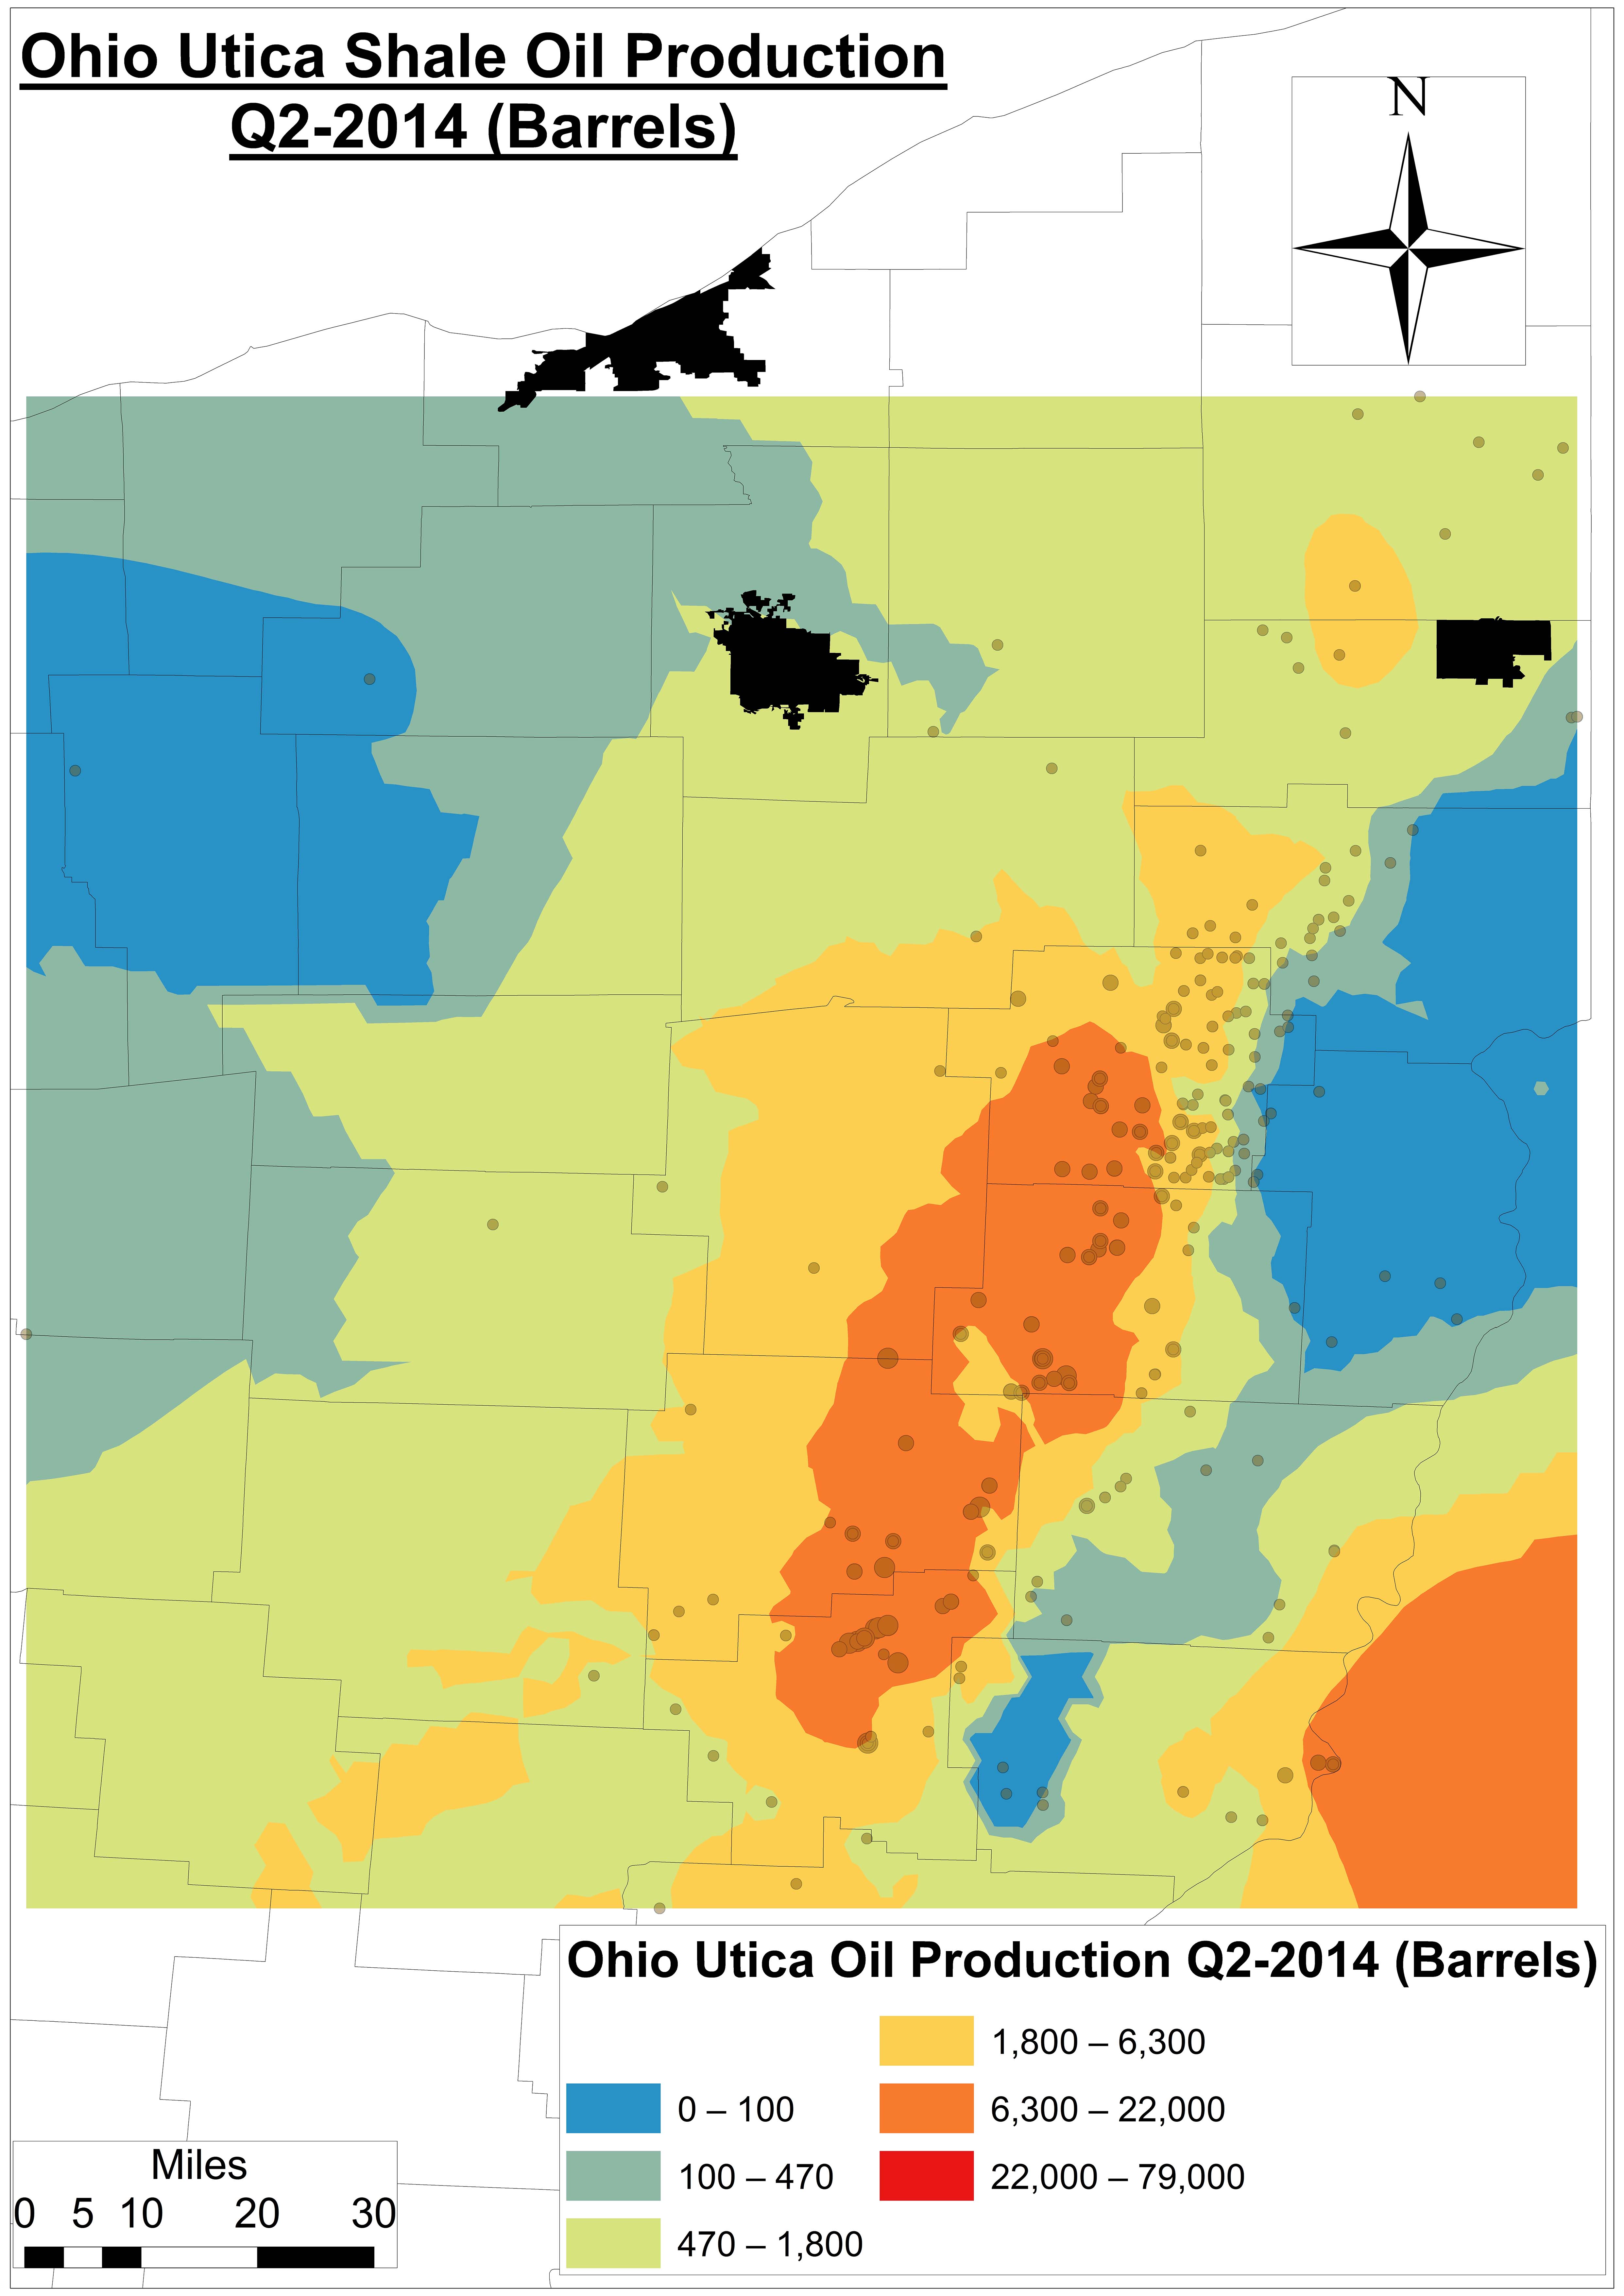
Figure 7a. An Ohio Utica Shale oil production model using Kriging6 for Q1-2013
Figure 7b. An Ohio Utica Shale oil production model using Kriging for Q2-2014
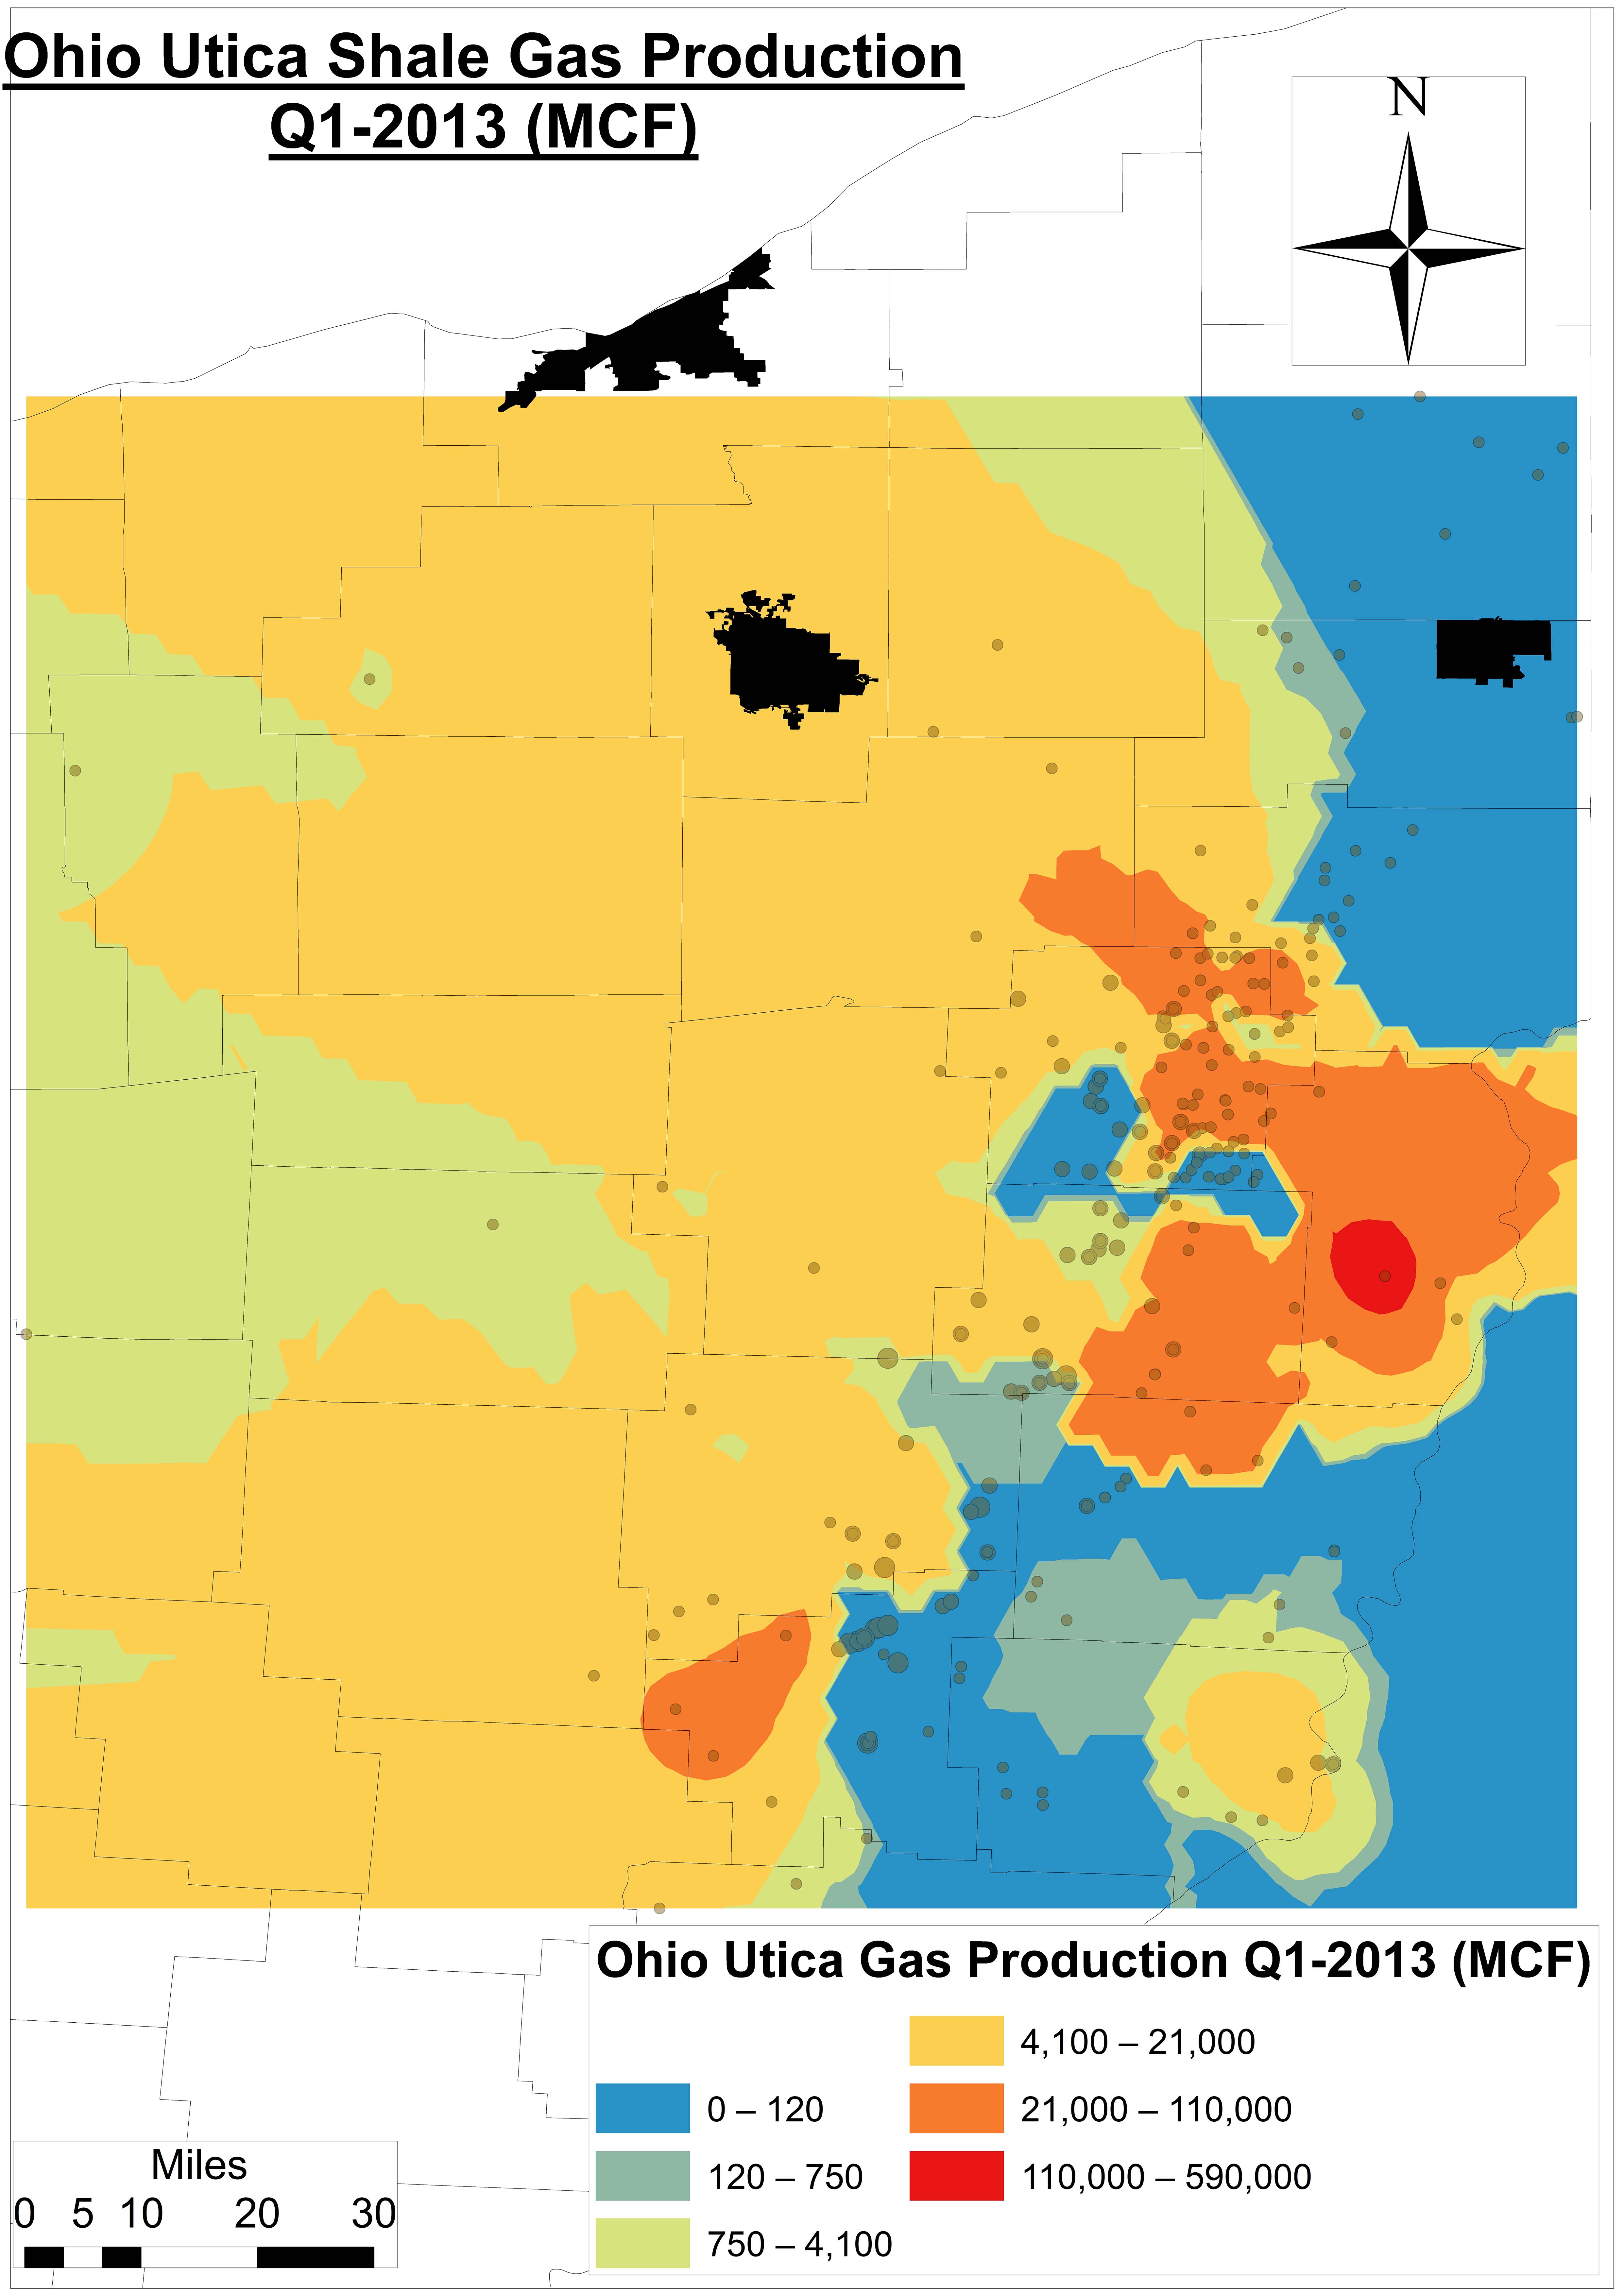
Figure 8a. An Ohio Utica Shale gas production model using Kriging for Q1-2013
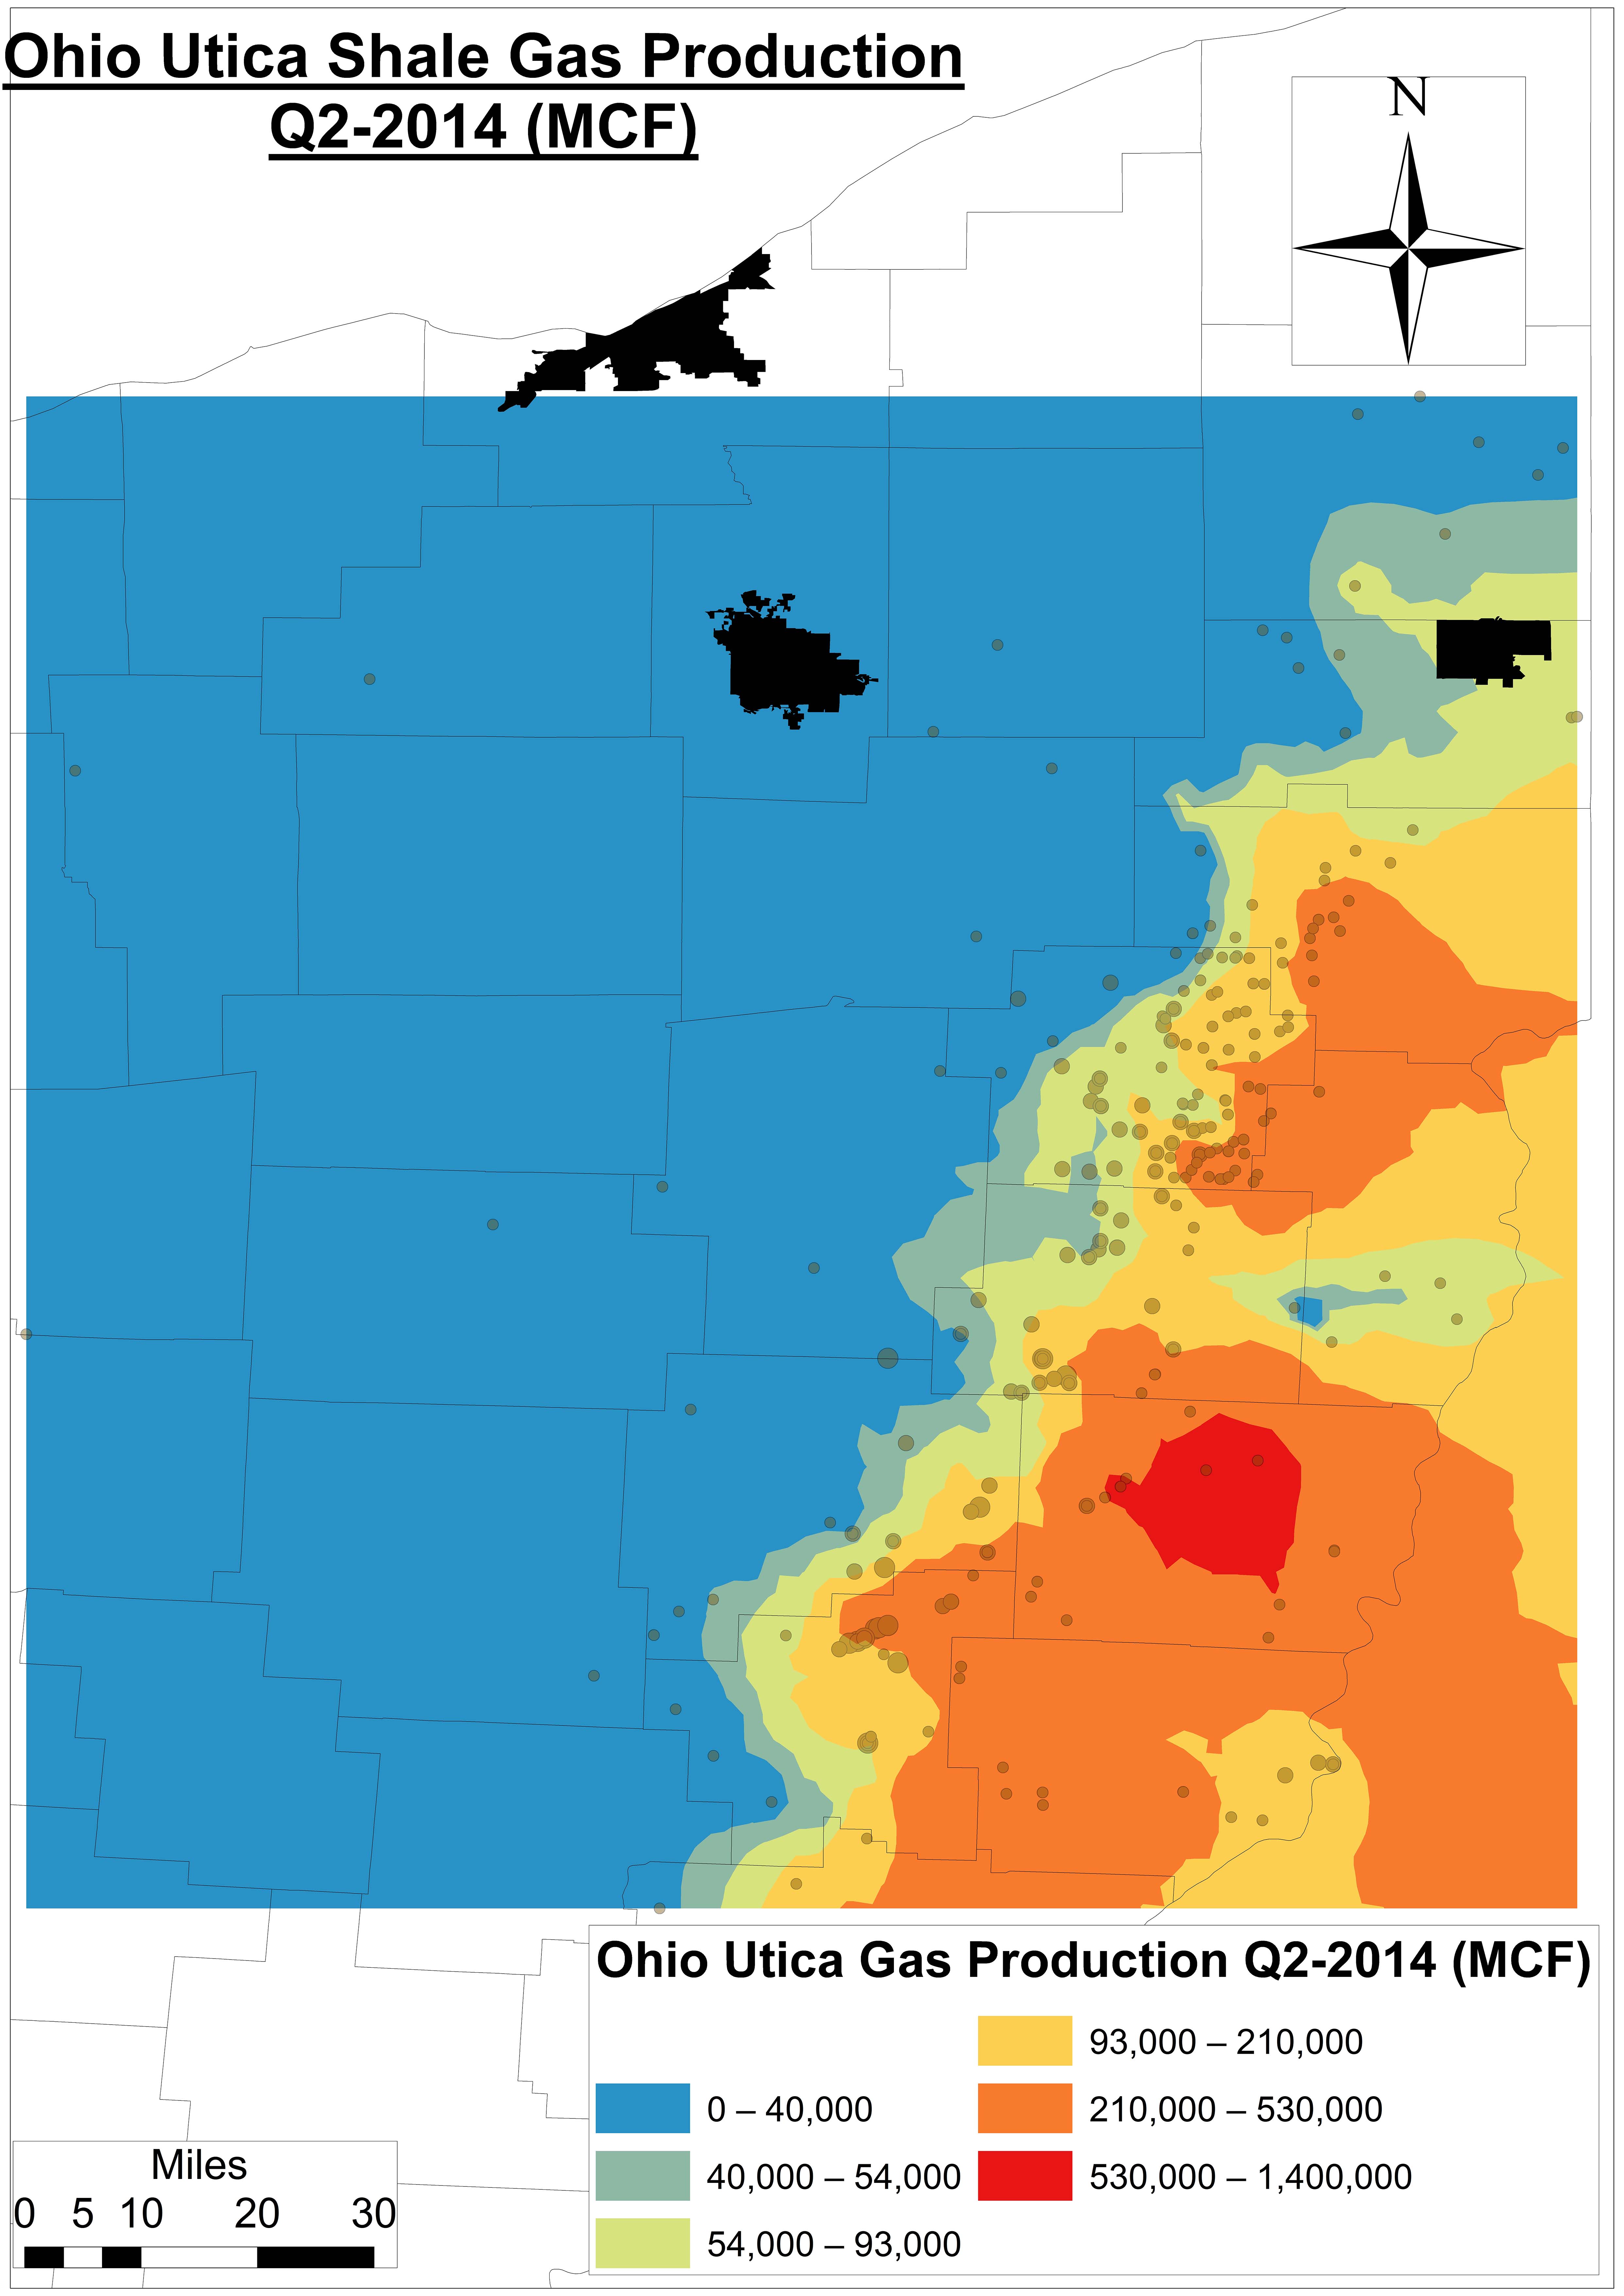
Figure 8b. An Ohio Utica Shale gas production model using Kriging for Q2-2014
Footnotes
$4.25 per 1,000 gallons, which is the current going rate for freshwater at OH’s MWCD New Philadelphia headquarters, is 4.7-8.2 times less than residential water costs at the city level according to Global Water Intelligence.
Carroll County wells have seen days in production jump from 36-62 days in 2011-2012 to 68-78 in 2014 across 256 producing wells as of Q2-2014.
One Mcf is a unit of measurement for natural gas referring to 1,000 cubic feet, which is approximately enough gas to run an American household (e.g. heat, water heater, cooking) for four days.
Assuming average oil and natural gas prices of $96 per barrel and $8.67 per Mcf during the current period of production (2011 to Q2-2014), respectively
On a per-API# basis or even regional basis we have not found drilling muds data. We do have it – and are in the process of making sense of it – at the Solid Waste District level.
https://www.fractracker.org/a5ej20sjfwe/wp-content/uploads/2014/11/Nexus2-Feature.png400900Ted Auch, PhDhttps://www.fractracker.org/a5ej20sjfwe/wp-content/uploads/2021/04/2021-FracTracker-logo-horizontal.pngTed Auch, PhD2014-11-17 17:00:262020-07-21 10:34:07The Water-Energy Nexus in Ohio, Part II
When the unconventional oil and gas extraction boom hit Pennsylvania in the mid-2000s small, local operators were among the first on the scene. As shale plays continued to develop, many of these smaller companies were bought out by larger, national corporations. Larger oil and gas development companies often maintain that they are better able to handle the expected regulatory requirements, and so FracTracker wanted to determine if there was a change in the compliance record for wells that changed hands. Does having more resources available to them translate into stronger compliance standards for oil and gas drillers, better training for their employees, and a greater burden to get things right? Investigating these questions by looking into compliance data and the sale of wells, however, was no easy task.
Analysis Methods
There are no indications in either the drilled wells or permits datasets available from the DEP that a well has changed hands; in both of these sources, one operator’s name is simply substituted for the other. It is possible to comb through old news stories, and find that East Resources sold its assets to Shell in 2010, for example. However, this approach is piecemeal, and would not lead to satisfactory results on an industry-wide analysis.
Major obstacles to our analysis included:
Lack of information on the transfer of oil and gas wells from one operator to another
There is often a lag time between the time violations occur and when they are reported
Errors in compliance reporting. For example, one API Number was found to have the operator listed as “Not Assigned” (It was later discovered that this well was never sold).
Results
Unlike wells and permits, any items on the compliance dataset are attributed to whichever company was operating the well at the time the violation was issued. So while FracTracker could not do the analysis that we wanted to because of the limitations of available data, we were able to isolate 30 wells that have changed hands between January 1, 2000 and November 4, 2014 (Table 1). One well has been bought and sold twice, with each of the three operators being issued violations.
In some instances the original well owner was reported to be out of compliance more times than the second owner. For example, API Number 013-20012 had 11 violations reported under its first owner and only 1 since it has been sold. The contrary also occurred, however, such as in the case of API Number 065-26481, which had 4 violations reported under its first owner and 14 under its second owner. There are not enough data points to determine which scenario is the trend in the data – if in fact there is one.
Due to limitations in the data, we cannot currently evaluate whether the notion that larger companies can improve the track record of problematic wells. In fact, many of the wells that were issued violations for multiple operators really just changed hands from one big operator who wanted to get out of the Marcellus to another big operator who wanted to get in. Our small sample doesn’t include any of the wells that were issued violations to only one company, of all the wells that changed hands over the years. To accurately assess the scenario, more data would have to be released, specifically the date when wells changed hands from one company to another.
Table 1. Wells with violations by API number that have changed ownership
API Number
First Owner
Last Known Date Of Ownership
Second Owner
First Known Date Of Ownership
Third Owner
First Known Date Of Ownership
013-20012
Chief Oil & Gas LLC
5/24/10
Chevron Appalachia LLC
2/5/13
015-20033
Belden & Blake Corp
4/10/09
Chesapeake Appalachia LLC
12/7/11
015-20051
Consol Gas Co
6/16/04
Range Resources Appalachia LLC
8/9/05
Talisman Energy USA Inc
11/16/11
019-21494
Phillips Exploration Inc
6/10/08
XTO Energy Inc
7/24/13
019-21680
Phillips Exploration Inc
4/6/10
XTO Energy Inc
3/13/13
065-26481
Dannic Energy Corp
5/11/11
Mieka LLC
11/10/11
065-26832
Dannic Energy Corp
3/2/11
Mieka LLC
4/11/12
081-20062
Chief Oil & Gas LLC
1/6/09
Exco Resources Pa LLC
8/16/11
081-20069
Chief Oil & Gas LLC
5/21/08
Exco Resources Pa LLC
3/28/11
081-20128
Chief Oil & Gas LLC
11/15/10
Exco Resources Pa LLC
6/27/11
081-20144
Chief Oil & Gas LLC
7/21/10
Exco Resources Pa LLC
3/15/12
081-20149
Chief Oil & Gas LLC
1/10/11
Exco Resources Pa LLC
2/21/12
081-20244
Chief Oil & Gas LLC
5/20/10
Exco Resources Pa LLC
11/15/12
081-20255
Chief Oil & Gas LLC
11/15/10
Exco Resources Pa LLC
11/29/11
081-20279
Chief Oil & Gas LLC
12/3/10
Exco Resources Pa LLC
4/20/12
081-20298
Chief Oil & Gas LLC
5/26/10
Exco Resources Pa LLC
6/27/11
083-53843
Anschutz Exploration Corp
4/7/09
Chesapeake Appalachia LLC
3/20/13
113-20025
Chief Oil & Gas LLC
2/15/11
Exco Resources Pa LLC
3/16/11
113-20049
Chief Oil & Gas LLC
11/30/10
Exco Resources Pa LLC
4/13/11
115-20052
Turm Oil Inc
9/24/08
Chesapeake Appalachia LLC
8/21/14
115-20169
Alta Opr Co LLC
11/24/09
WPX Energy Appalachia LLC
4/13/11
115-20174
Alta Opr Co LLC
4/16/10
Wpx Energy Appalachia LLC
4/29/11
115-20191
Alta Opr Co LLC
12/1/09
Wpx Energy Appalachia LLC
6/1/11
115-20214
Alta Opr Co LLC
7/19/10
Wpx Energy Appalachia LLC
8/16/10
115-20231
Alta Opr Co LLC
4/8/10
Wpx Energy Appalachia LLC
6/1/11
117-20197
East Resources Inc
4/8/08
Talisman Energy USA Inc
1/26/11
117-20280
East Resources Inc
5/19/10
Swepi LP
8/28/14
117-20330
East Resources Inc
12/18/09
Talisman Energy USA Inc
2/20/13
117-20394
East Resources Inc
12/14/09
Swepi LP
10/25/11
117-20538
East Resources Inc
12/18/10
Swepi LP
5/27/10
https://www.fractracker.org/a5ej20sjfwe/wp-content/uploads/2014/11/Comparison-Feature.png400900FracTracker Alliancehttps://www.fractracker.org/a5ej20sjfwe/wp-content/uploads/2021/04/2021-FracTracker-logo-horizontal.pngFracTracker Alliance2014-11-12 14:47:302025-05-02 14:46:09Comparison of Oil and Gas Violations and the Sale of Wells
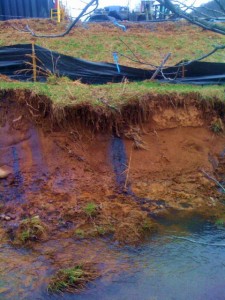
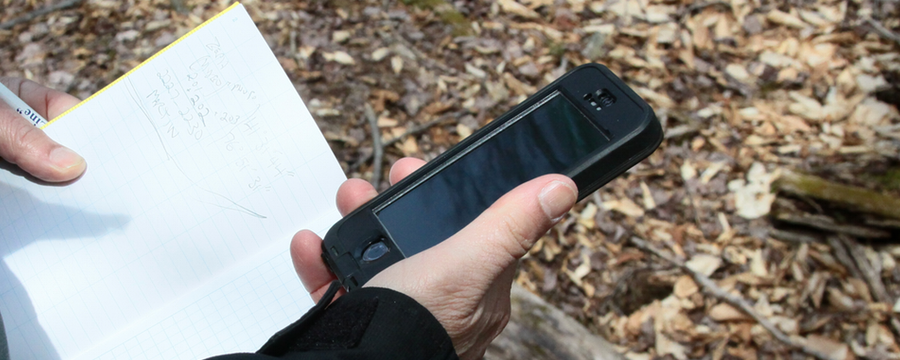
Pittsburgh, PA – FracTracker Alliance announces the release of our free iPhone app – designed to collect and share experiences related to oil and gas drilling across the United States. As unconventional drilling or “fracking” intensifies, so too do the innovative ways in which citizens can track, monitor, and report potential issues from their smart phones.
The app allows users to submit oil and gas photos or reports. Users can also view a map of wells drilled near them and user-submitted reports. This map shows wells that have been drilled both unconventionally and conventionally.
“FracTracker’s app contributes to the collective understanding of oil and gas impacts and provides a new opportunity for public engagement,” explains Brook Lenker, Executive Director of the FracTracker Alliance. “We hope that our mobile app will revolutionize how people share oil and gas information.”
Development Partners
Several organizations and community groups helped to test and improve the app during its development. To address questions about the impacts of oil and gas development across landscapes, FracTracker joined with the National Parks Conservation Association (NPCA) to create a crowd-sourced digital map with photos detailing the scale of oil and gas development near North Dakota’s Theodore Roosevelt National Park using the app. The photo map is part of a NPCA’s campaign designed to educate citizens about the cross-landscape impacts of oil and gas development near America’s national parks. NPCA is hosting two events this week in support of this campaign work – in Pittsburgh and Philadelphia.
“FracTracker’s new app allows us to tell a visual story about fracking’s impacts to national parks and their local communities,” said Nick Lund, who manages the NPCA’s Landscape Conservation program. “With this week’s public events in Pittsburgh and Philadelphia, we will show the dramatic impact that fracking continues to have, in just a few years, near Theodore Roosevelt National Park. These images can help inform the public and our elected officials as they finalize drilling regulations in Pennsylvania. We hope this information will lead to strong protections for our national parks, our forests, and our drinking water.”
Beta testing and reviews of the app were also conducted by Mountain Watershed Association, Responsible Drilling Alliance, Audubon PA, PA Forest Coalition, Southwest PA Environmental Health Project, and Save Our Streams PA. The app was developed in collaboration with Viable Industries, L.L.C.
Like NPCA, groups can use the FracTracker app to collect visual data and develop customized maps for their own projects. Contact FracTracker to learn more: info@fractracker.org.
Download the App
Download the free app from the iTunes store or visit FracTracker.org to learn more: www.fractracker.org/apps. Currently the app is only available for only iPhone users, but an Android platform is due out later this year.
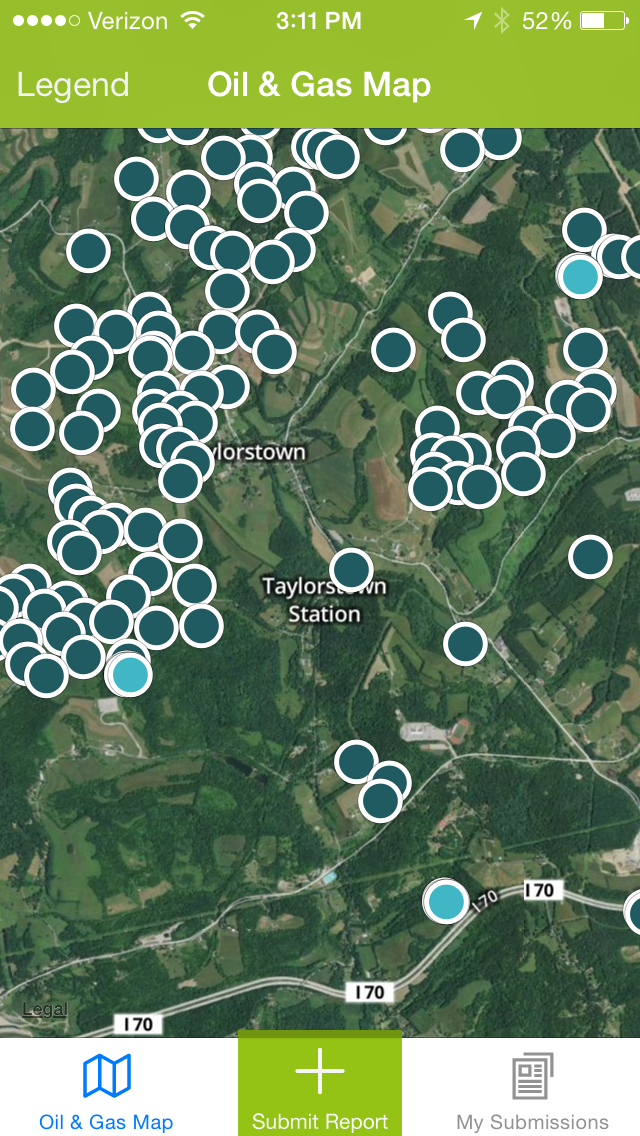
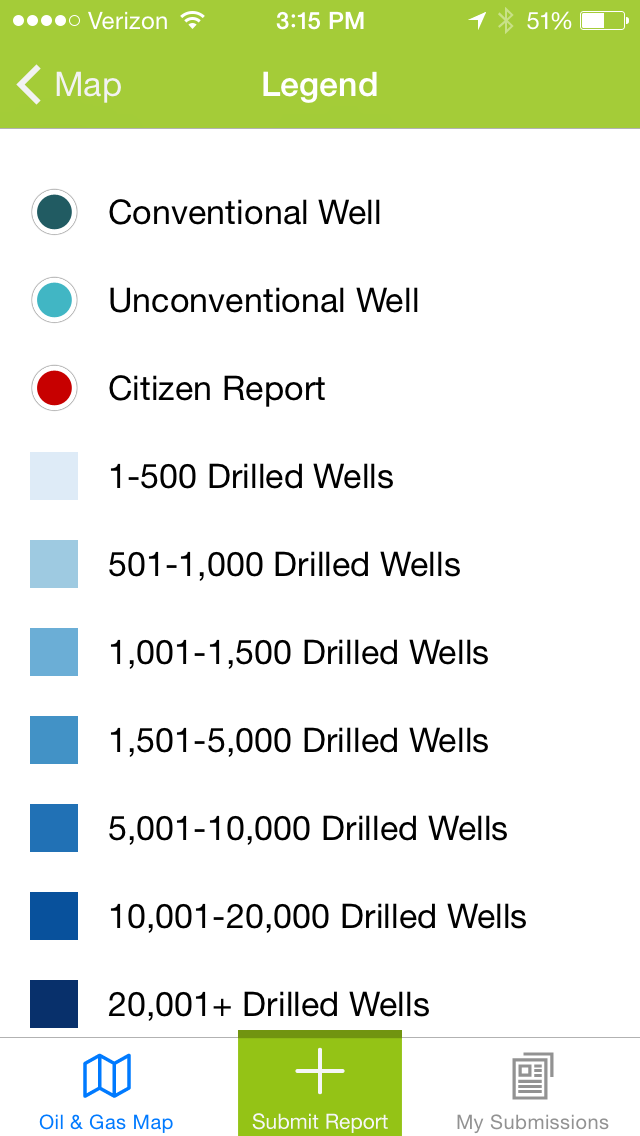
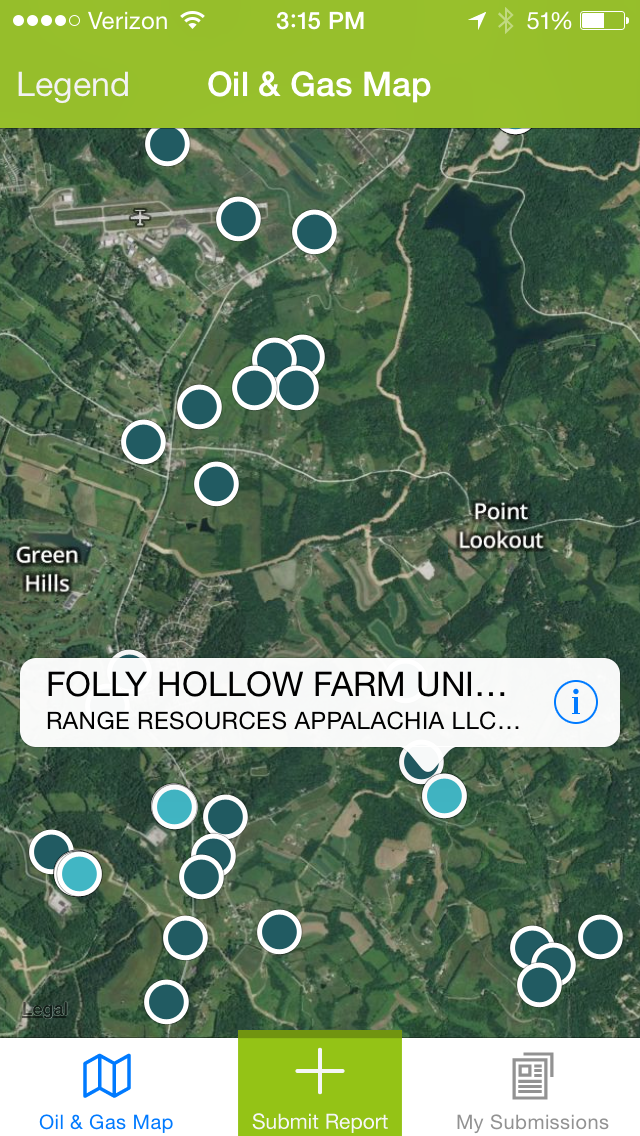
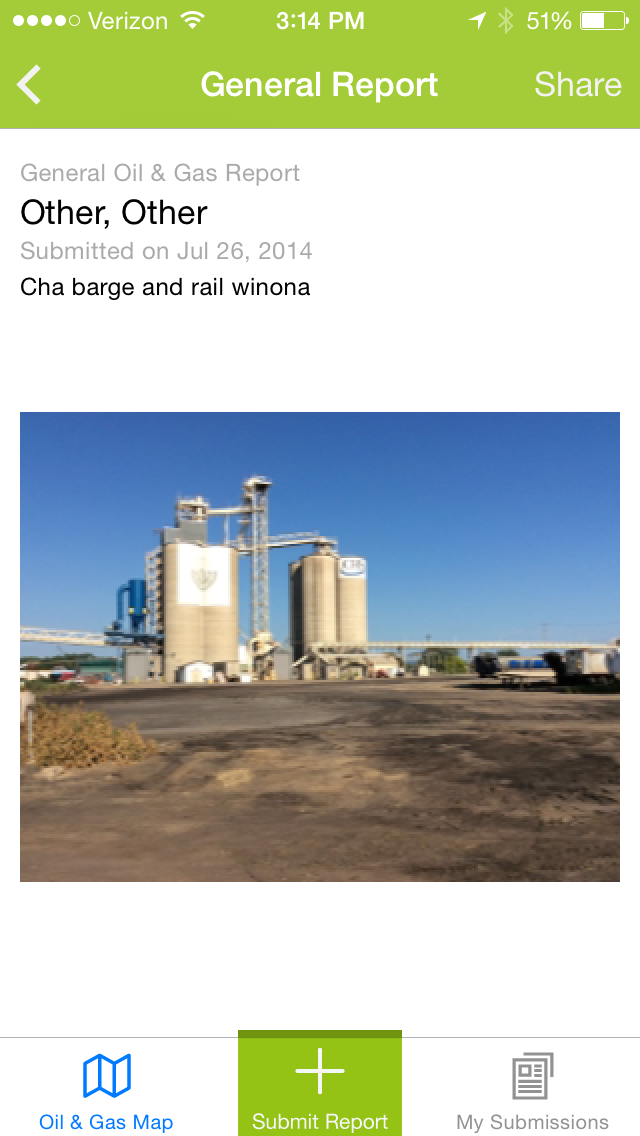
App Screenshots
See a map of wells near you or submit a report.
The legend describes the points on the map in more detail.
Clicking on a dot shows the record/well
Clicking the “i” shows you more information about the point
FracTracker Alliance is a non-profit organization with offices in PA, OH, NY, WV, and CA that shares maps, data, and analyses to communicate impacts of the global oil and gas industry and inform actions that positively shape our energy future. Learn more about FracTracker at www.fractracker.org.
National Parks Conservation Association: Since 1919, the nonpartisan National Parks Conservation Association has been the leading voice of the American people in protecting and enhancing our National Park System. NPCA, its one million members and supporters, and many partners work together to protect the park system and preserve our nation’s natural, historical, and cultural heritage for our children and grandchildren. For more information, please visit www.npca.org.
https://www.fractracker.org/a5ej20sjfwe/wp-content/uploads/2014/11/iPhone-App-Feature.png400900FracTracker Alliancehttps://www.fractracker.org/a5ej20sjfwe/wp-content/uploads/2021/04/2021-FracTracker-logo-horizontal.pngFracTracker Alliance2014-11-12 09:43:012020-07-21 10:34:06FracTracker Launches Oil and Gas Tracking App
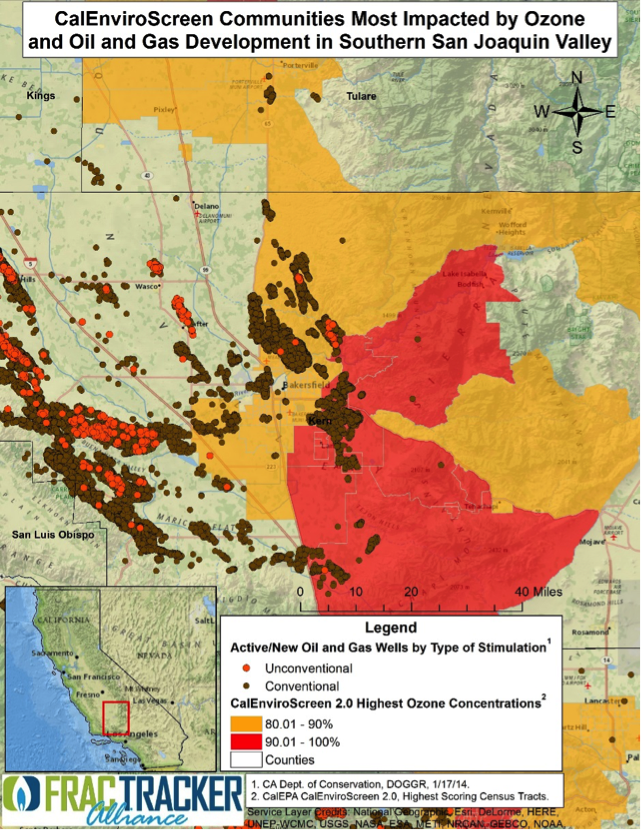
New Report from FracTracker and the Natural Resources Defense Council By Kyle Ferrar, CA Program Coordinator, FracTracker Alliance
The FracTracker Alliance recently contributed to a report released by the Natural Resources Defense Council (NRDC), titled Drilling in California: Who’s at Risk?. In the report, we find that many communities disproportionally burdened by environmental and public health degradation also live in the areas most impacted by oil and gas (O&G) development, including hydraulic fracturing and acidizing. Additionally, the communities most impacted by such oil and gas activity are disproportionately non-white. Key points of the report are listed below, as outlined by the NRDC:
Key Points of “Drilling in California” Report
Expanding oil production in California, in areas already heavily drilled or in new areas, can threaten the health of communities.
New analysis shows that, already, approximately 5.4 million Californians live within a mile of one, or more, of the more than 84,000 existing oil and gas wells.
More than a third of the communities living with oil and gas wells are also burdened with the worst environmental pollution, as measured by CalEPA’s CalEnviroScreen 2.0. These communities, with heightened risks, are 92 percent people of color.
To prevent further environmental damage and public health threats, major improvements are required before hydraulic fracturing, acidizing, and other stimulation techniques are allowed to continue in California.
The analysis used the California Environmental Protection Agency (CalEPA) Office of Health Hazard and Assessment’s (OEHHA) impact screening tool CalEnviroScreen 2.0, which ranks all the census tracts in CA based on various indicators of environmental and public health degradation due to pollution sources. Stimulated and non-stimulated O&G well-site data came from multiple sources including the Division of Oil, Gas and Geothermal Resources; the South Coast Air Quality Management District; and FracFocus.
Visualizing the Data
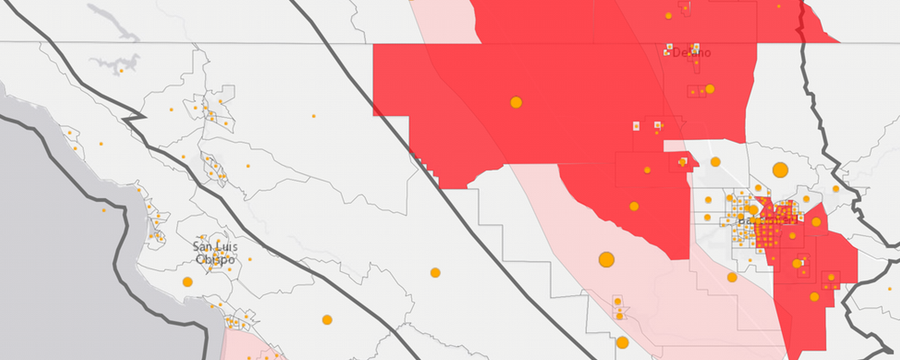
The interactive web map below (Figure 1) provides a visual understanding of how these areas may be additionally burdened by California’s industrial oil and gas extraction activities. The CalEnviroscreen 2.0 dataset of census tract scores was mapped spatially to show the areas in CA disproportionately burdened by existing environmental stressors and health impacts. The locations of CA’s O&G production wells were overlaid on these maps since the CalEnviroscreen ranks did not specifically take into account the role of O&G extraction activity in communities. The top 20th percentile of total scores are shown in the map’s default view, and more CalEnviroscreen scores are displayable under the “Layers” tab (top right).
Figure 1. The top 20th percentile of highest CalEnviroscreen 2.0 total scores are shown in the map above along with well counts by census tract. Increasing well counts are portrayed with orange circles that increase in size with the number of wells. Click here to explore.
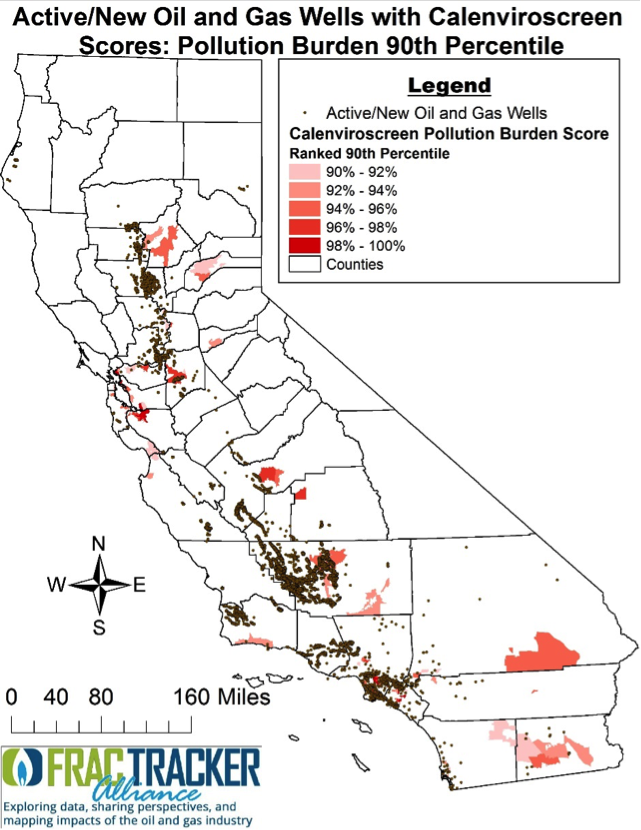
Figures 2-7 below are provide printable examples of several of CalEnviroscreen’s 2.0’s most important rankings when considering O&G extraction activity.
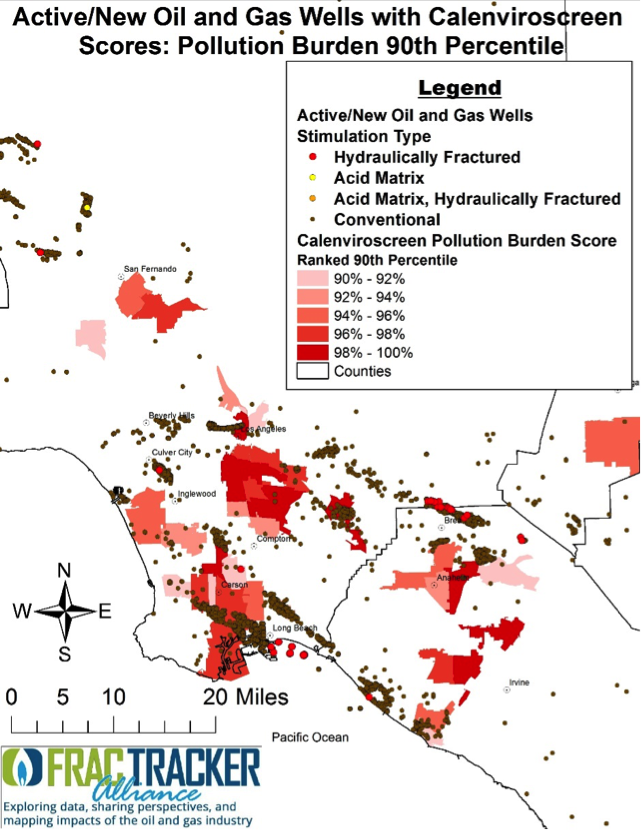
Figure 2. CalEnviroscreen 2.0 highest 20th percentile of census tracts with the most pollution burden from various sources in all of California. The census tract scores are overlaid with active oil and gas (O&G) wells.
Figure 3. Focus on the Greater Los Angeles Basin. Shows the CalEnviroscreen 2.0 highest 20th percentile of census tracts with the most pollution burden from various sources. Census tract scores are overlaid with active O&G wells. Many of the areas most impacted by existing pollution also host much of the O&G extraction activity.
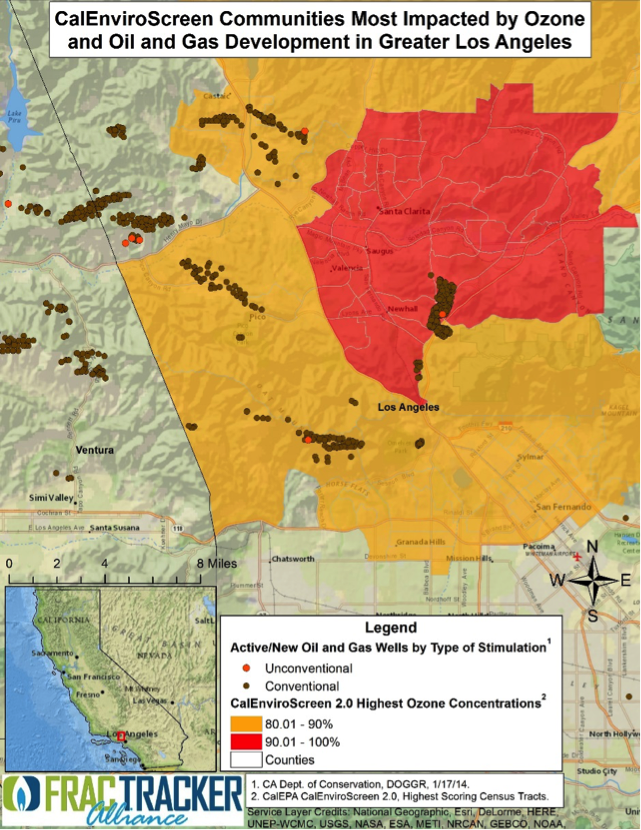
Figure 4. Focus on Los Angeles County, with some of the highest ranking scores for Ozone pollution. These areas also host and are surrounded by many oil/gas wells.
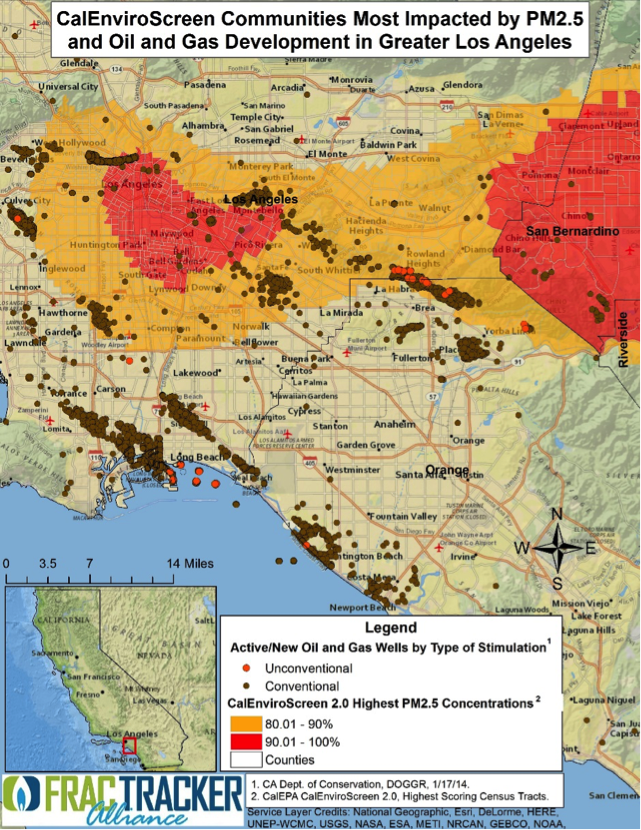
Figure 5. Focus on the Greater Los Angeles Basin. Shows the CalEnviroscreen 2.0 highest 20th percentile of census tracts with the worst air quality impacts resulting from particulate matter (PM2.5) pollution. Census tract scores are overlaid with active O&G wells. Many of the areas most impacted by PM2.5 also host much of the O&G extraction activity.
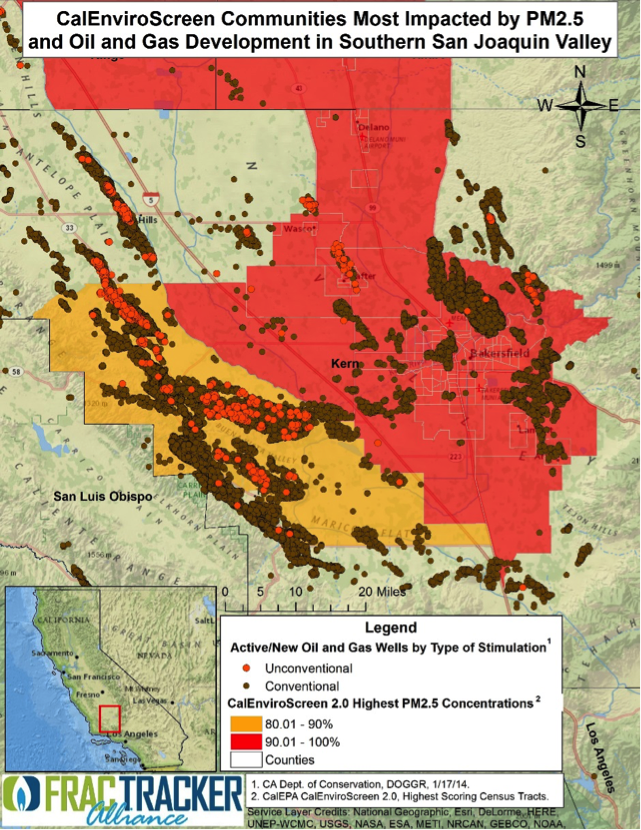
Figure 6. Focus on Kern County in the Central San Joaquin Valley. Shows the CalEnviroscreen 2.0 highest 20th percentile of census tracts with the worst air quality impacts resulting from particulate matter (PM2.5) pollution. Census tract scores are overlaid with active oil and gas wells. Many of the areas most impacted by PM2.5 also host much of the O&G extraction activity.
Figure 7. Focuses on the areas of Kern County with the CalEnviroscreen 2.0 highest 20th percentile of census tracts with the worst air quality impacts resulting from ambient ozone pollution. Census tract scores are overlaid with active oil and gas wells. Many of the areas most impacted by ozone also host much of the O&G extraction activity.
https://www.fractracker.org/a5ej20sjfwe/wp-content/uploads/2014/10/NRDCFeature.png400900Kyle Ferrar, MPHhttps://www.fractracker.org/a5ej20sjfwe/wp-content/uploads/2021/04/2021-FracTracker-logo-horizontal.pngKyle Ferrar, MPH2014-10-31 10:12:112020-07-21 10:34:06Disproportionate Drilling and Stimulations in California
One of the potentially troubling aspects of oil and gas development is that there are usually people who live in the vicinity of the wells. Pennsylvania now has over 8,000 active unconventional wells; there are any number of issues that can occur with these modern, industrial-scale sites, including road degradation, contaminated water, and health impacts, among others. In addition, there are over 93,000 of the smaller, conventional wells in operation throughout the Commonwealth. While these garner far less attention than their unconventional counterparts, they are also prone to producing similar impacts, not to mention that since many of them are older wells, they not only have potentially been subject to deterioration and occasional neglect, but were constructed during a period with less stringent requirements than are currently expected.
Petroleum engineers are now capable of drilling horizontally for tens of thousands of feet. For the most part, however, this technology is employed to maximize production, rather than to ameliorate impacts on people who live near the product. But who are these people? To help to answer this question, the FracTracker Alliance calculated the number of people living in a half-mile radius around active wells in the state.
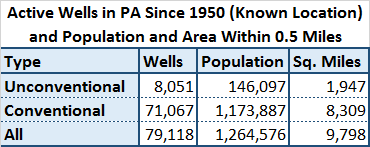
More than 1.2 million Pennsylvanians live within the impact area.
Of the 93,754 wells that have been drilled in the state since 1950 that have not yet been plugged, the Pennsylvania DEP only has location data for 79,118 of them. All but one of the 14,636 missing locations are for wells that are categorized as Conventional. While one must presume that there is some overlap in coverage within the half-mile zone, the extent of this region – and therefore the population that lives within it – cannot be determined.
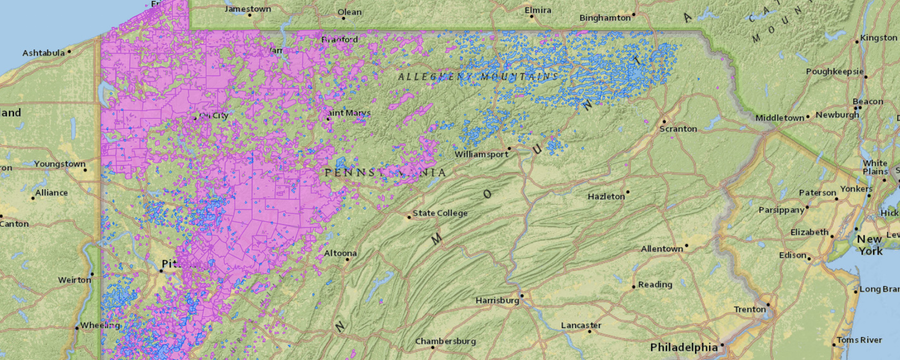
Fig. 1. PA Populations Near Oil and Gas Wells. Click here to access written description and additional map tools.
To maximize the reliability of our calculations, this map was created using a custom Albers equal-area projection centered on Pennsylvania. A half-mile buffer around each well type was created, and the resulting layer was clipped to Census tract data. The ratio of the smaller clipped area to the full Census tract area was calculated, and that ratio was then multiplied by the population totals from the 2010 Census to obtain our population estimates of the half-mile zone. The area in the study area is larger than six states, while the calculated population is larger than that of eight states.
Fig. 2. Number of people in PA near oil and gas wells (79,118 active wells for which location data are available). Note that some regions are with a half-mile of both conventional and unconventional wells.
The county most impacted, in terms of area, for unconventional wells is Bradford, with 353 square miles (See Figure 2). Washington County had the most people living in the zone, however, with 20,566. For conventional wells, the drilling landscape is the largest in Indiana County, affecting 761 square miles, while Erie County has the most people in the half-mile zone, with 212,900. When considering all wells together, the numbers are almost identical to conventional wells. Indiana County leads with 762 square miles, while the drill zone in Erie County represents 211,903 people, or 76% of the county’s population in 2010.
https://www.fractracker.org/a5ej20sjfwe/wp-content/uploads/2014/10/PA-Wells-Feature.png400900Matt Kelso, BAhttps://www.fractracker.org/a5ej20sjfwe/wp-content/uploads/2021/04/2021-FracTracker-logo-horizontal.pngMatt Kelso, BA2014-10-30 11:23:432020-07-21 10:34:06Over 1.2 Million Pennsylvanians Within 1/2 Mile of a Well
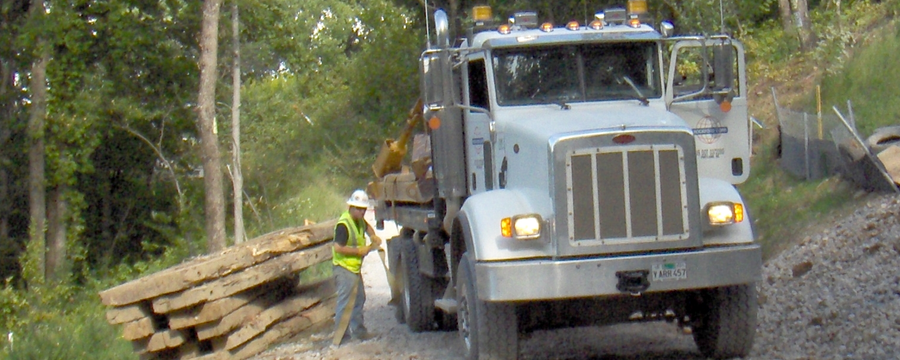
Recently, I was observing how Statoil was managing their gas well traffic, how well it was moving, and whether local residential traffic was being significantly delayed.
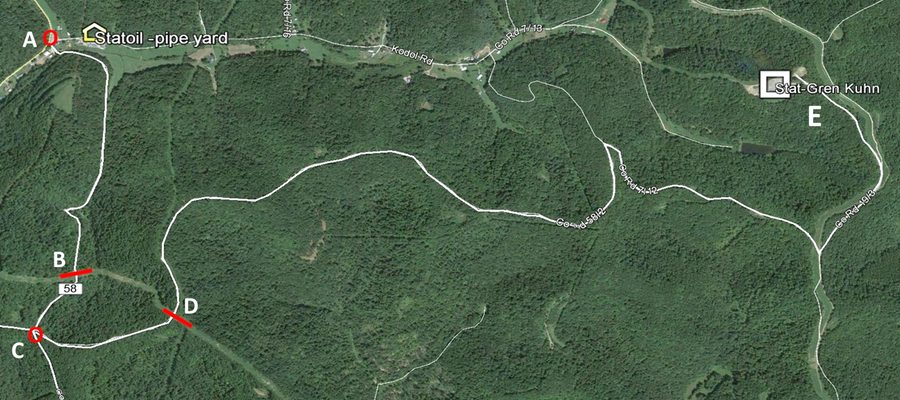
Figure 1. Road map referred to throughout text
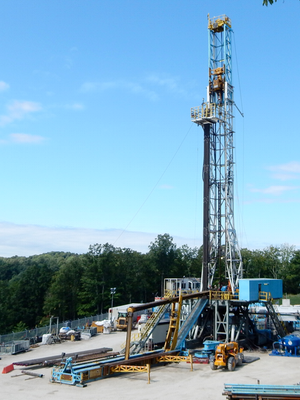
In Wetzel County, WV, gas trucks travel 4.5 miles from a Statoil pipe yard (Fig 1. Location A) in Uniontown to the Statoil Kuhn well pad (E). This trip can take at least 15 minutes for each truck. Rockford is also doing pipeline work along this route (B and D).
The roadway Statoil is using, even though it is small gravel lane, is a public route. Routine well pad traffic was moving between the pad and pipe yard. When I attempted to travel out to the well pad, I noticed some issues around the pipeline crossing. A large truck was blocking the road and all traffic was stopped. At 3:59 pm, a large dump truck hauling drill cuttings left the well pad coming towards the pipeline. Statoil personnel radioed the flagger at the pipe yard to stop traffic there.
The dump truck was stopped at the pipeline crossing, point D at 4:09 pm, where the road was blocked. It was not until 4:34 pm that traffic was finally able to proceed. This section of road was closed for 35 minutes, as was the lower road at the pipe yard.
For the past few days, Statoil has been stopping all traffic as soon as any truck leaves the well pad, whether the pipeliners have the road blocked or not.
Associated Issues
There are three serious factors that significantly hamper traffic flow along this route:
Statoil’s Kugh Well Pad
Statoil has flagger-radio personnel stationed at the pipe yard and at the pad, but not at the top of the hill (C) about a mile from the pipe yard. As a result, there was no way to allow any local traffic to come up the hill even when they intend to continue heading west or southeast. With a flagger-radio at the top of the hill, local traffic could be up the hill and long gone before any large trucks got to there. (Note: After a few weeks a traffic person was then stationed at the top of the hill).
Not all Statoil subcontractors trucks are equipped with CB radios, so it is impossible to track their progress or location on this road.
Rockford and Statoil do not use any common radio band. They do not appear to communicate with each other even though they are working along this same truck route.
This traffic block incident luckily did not include emergency vehicle traffic. If there had been any accident on or near the well pad or the pipeline right of way, no one would have been able to get through. It would seem that it is in the best interest of the companies and their employees to make sure the road is clear, all the time. When I discussed this with the tool pusher* on the well pad, he agreed. He was also concerned that there was no helicopter landing area nearby in the event of a serious accident. He runs a safe well drilling operation but wanted to be certain that an emergency vehicle could get through.
* A tool pusher is the boss man who runs the whole drilling operation as a subcontractor to the gas operator.
OH Utica Production, Water Usage, and Changes in Lateral Length
Part I of a Multi-part Series By Ted Auch, OH Program Coordinator, FracTracker Alliance
As shale gas expands in Ohio, how too does water use? We conducted an analysis of 500+ Utica wells in an effort to better understand the water-energy nexus in Ohio between production, water usage, and lateral length across 500+ Utica wells. The following is a list of the primary findings from this analysis:
Lateral Length
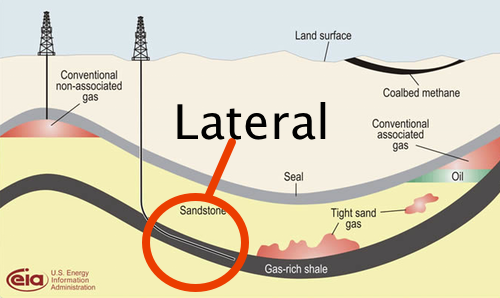
Figure 1. Modified EIA schematic highlighting the lateral portion of the unconventional well
In unconventional oil and gas drilling, often operators need to drill both vertically and then laterally to follow the formation underground. This process increases the amount of shale that the well contacts (see the modified EIA schematic in Figure 1). As a general rule Ohio’s Utica wells transition to the horizontal or lateral phase at around 6,800 feet below the earth’s surface.
1. The average Utica lateral is increasing in length by 51-55 feet per quarter, up from an average of 6,369 feet between Q3-2010 and Q2-2011 to 6,872 feet in the last four quarters. Companies’ lateral length growth varies, for example:
Gulfport is increasing by 46 feet (+67,206 gallons of water),
R.E. Gas Development and Antero 92 feet (+134,412 gallons of water), and
Chesapeake 28 feet (+40,908 gallons of water).
2. An increase in lateral length accounts for 40% of the increase in the water usage, as we have discussed in the past.
3. As a general rule, every foot increase in lateral length equates to an increase of 1,461 gallons of freshwater.
Regional and County-Level Trends
This section looks into big picture of shale gas drilling in OH. Herein we summarize the current state of water usage by the Utica shale industry relative to hydrocarbon production, as a percentage of residential water usage, as well as long-term water usage and waste production forecasts.
1. Freshwater Use
Across 516 wells, we found that the average OH Utica well utilizes 5.04-5.69 million gallons of freshwater per well.
This figure includes a ratio of 12:1 freshwater to recycled water used on site.
Water usage is increasing by 221-330,000 gallons per well per quarter.
Note: In neighboring – and highly OH freshwater reliant-West Virginia, the average Marcellus well uses 6.1-6.6 million gallons per well, with a trend increase of 189-353,000 gallons per quarter per well.
Water usage is up from 4.88 million gallons per well between 2010 and the summer of 2011 to 7.27 million gallons today.
Over the next five years, we will likely see 18.5 billion gallons of freshwater used for shale gas drilling in OH.
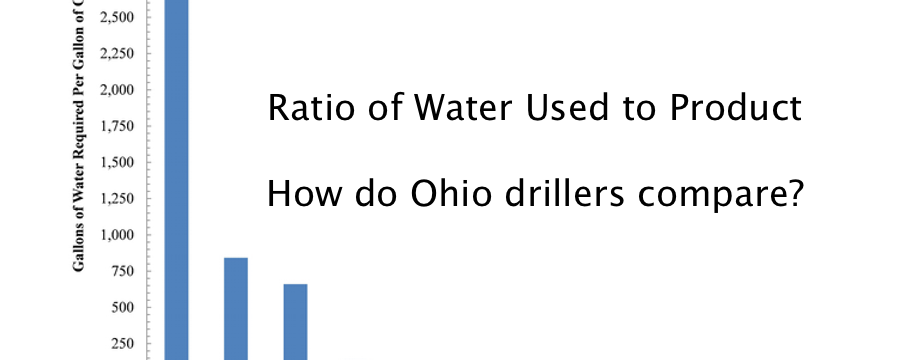
On average, drilling companies use 588 gallons of water to get a gallon of oil.
Average: 338 gallons of water required to get 1 MCF of gas
Average: 0.078 gallons of brine produced per gallon of water
2. Residential Water Allocation
A portion of residential water (3.8-6.1% of usage) is being allocated to the Utica drilling boom.
This figure is as high as 81% of residential water requirements in Carroll County.
And amounts to 2.2-3.5% of the available water in the Muskingum River Watershed.
The allocation will increase over time to amount to 8.2-10.5% of residential usage or 4.4-5.6% of Muskingum River available water.
3. Permitted Wells Potential
If all permitted Utica wells were to come online (active), we could expect 299.7 million gallons of additional brine to be produced and an additional 220 million gallons of freshwater a year to be used.
This trend amounts to 1.1 billion gallons of fracking brine waste looking for a home within 5 years.
4. Waste Disposal
Stallion Oilfield Services has recently purchased several Class II Injection wells in Portage County.
These waste disposal sites are increasing their intake at a rate of 2.13 million gallons per quarter, 4.76 times that of the rest of OH Class II wells.
Water Usage By Company
The data trends we have reviewed vary significantly depending on the company that is assessed. Below we summarize the current state of water usage by the major players in Ohio’s Utica shale industry relative to hydrocarbon production.
1. Overall Statistics
The 15 biggest Water-To-Oil offenders are currently averaging 16,844 Gallons of Water per gallon of oil (PGO) (i.e., Shugert 2-12H, Salem-Grubbs 1H, Stutzman 1 and 3-14H, etc).
Removing the above 15 brings the Water-To-Oil ratio down from 588 to 52 gallons of water PGO.
The 9 biggest Water-To-Gas offenders are currently averaging 16,699 gallons of water per MCF of gas.
Removing the above 9 brings the Water-To-Gas ratio down from 338 to 27 gallons of water per MCF of gas.
Company differences are noticeable (Figure 2):
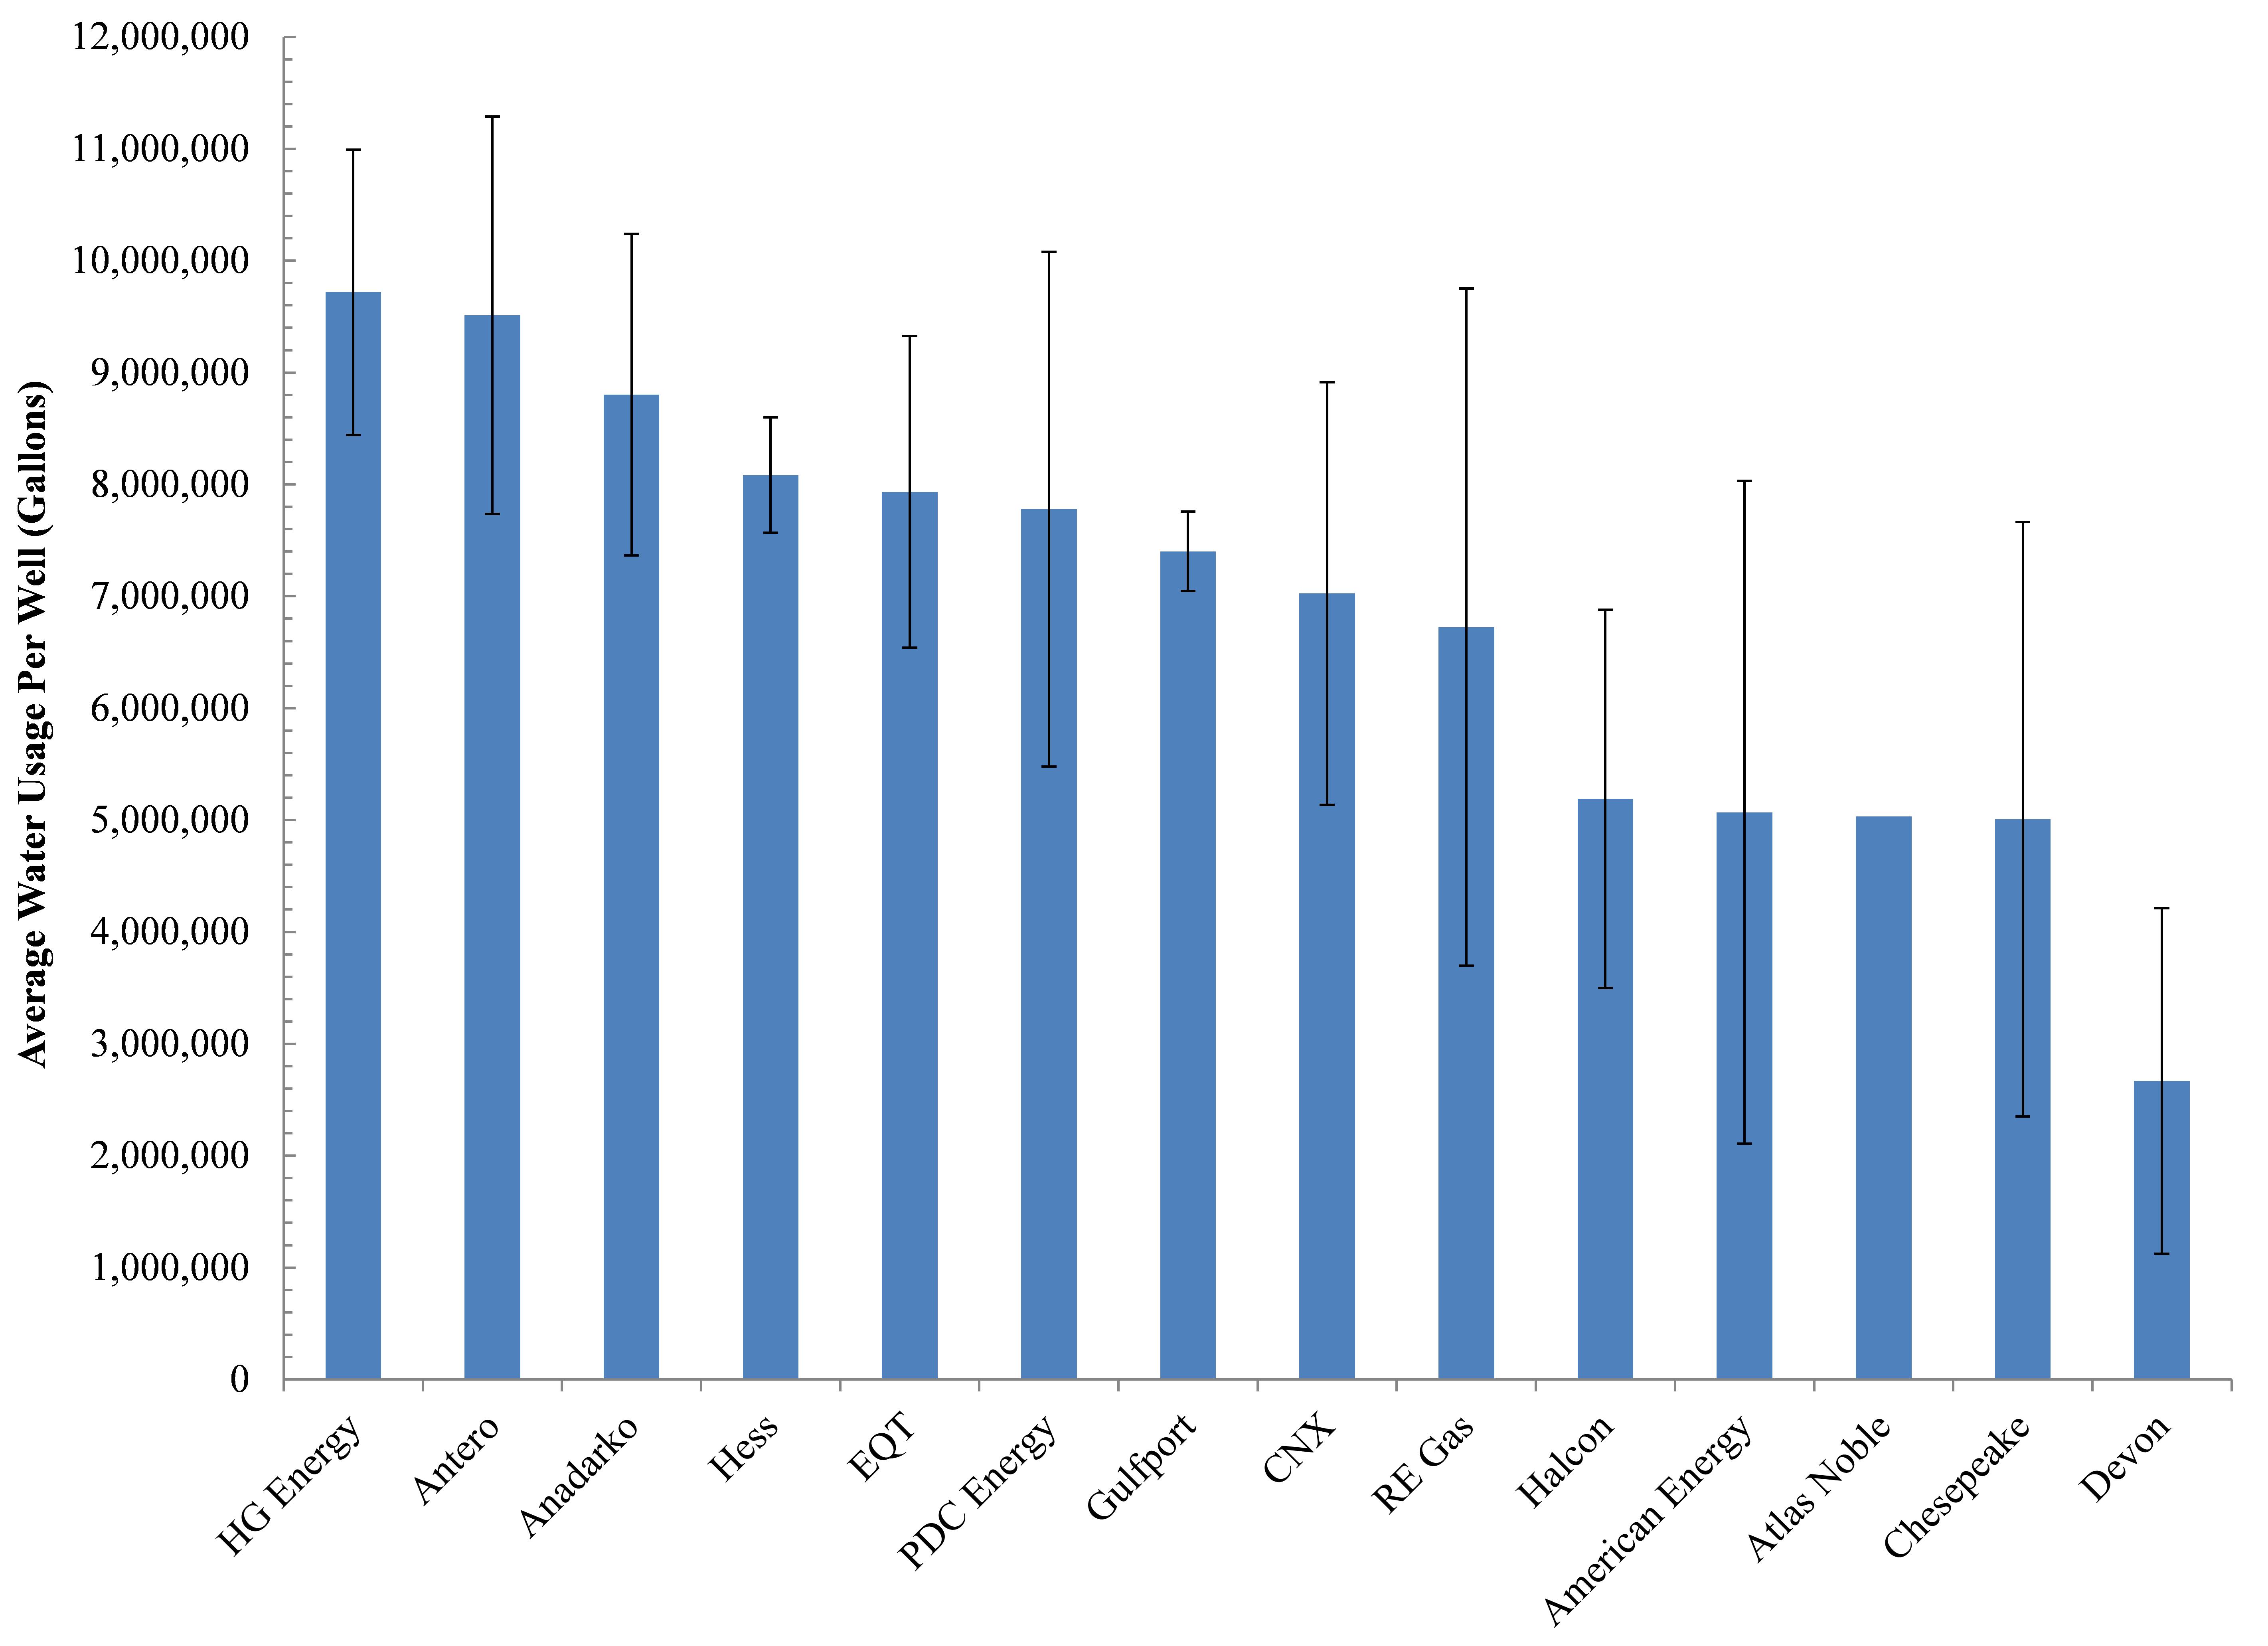
Figure 2. Average Freshwater Use Among OH Utica Operators
Antero and Anadarko used an average of 9.5 and 8.8 MGs of water per well during the course of the 45-60 drilling process, respectively (Note: HG Energy has the wells with the highest water usage but a limited sample size, with 9.8 MGs per well).
Six companies average in the middle with 6.7-8.1 MGs of water per well.
Four companies average 5 MGs per well, including Chesapeake the biggest player here in OH.
Devon Energy is the one firm using less than 3 MGs of freshwater for each well it drills.
2. Water-to-Oil Ratios
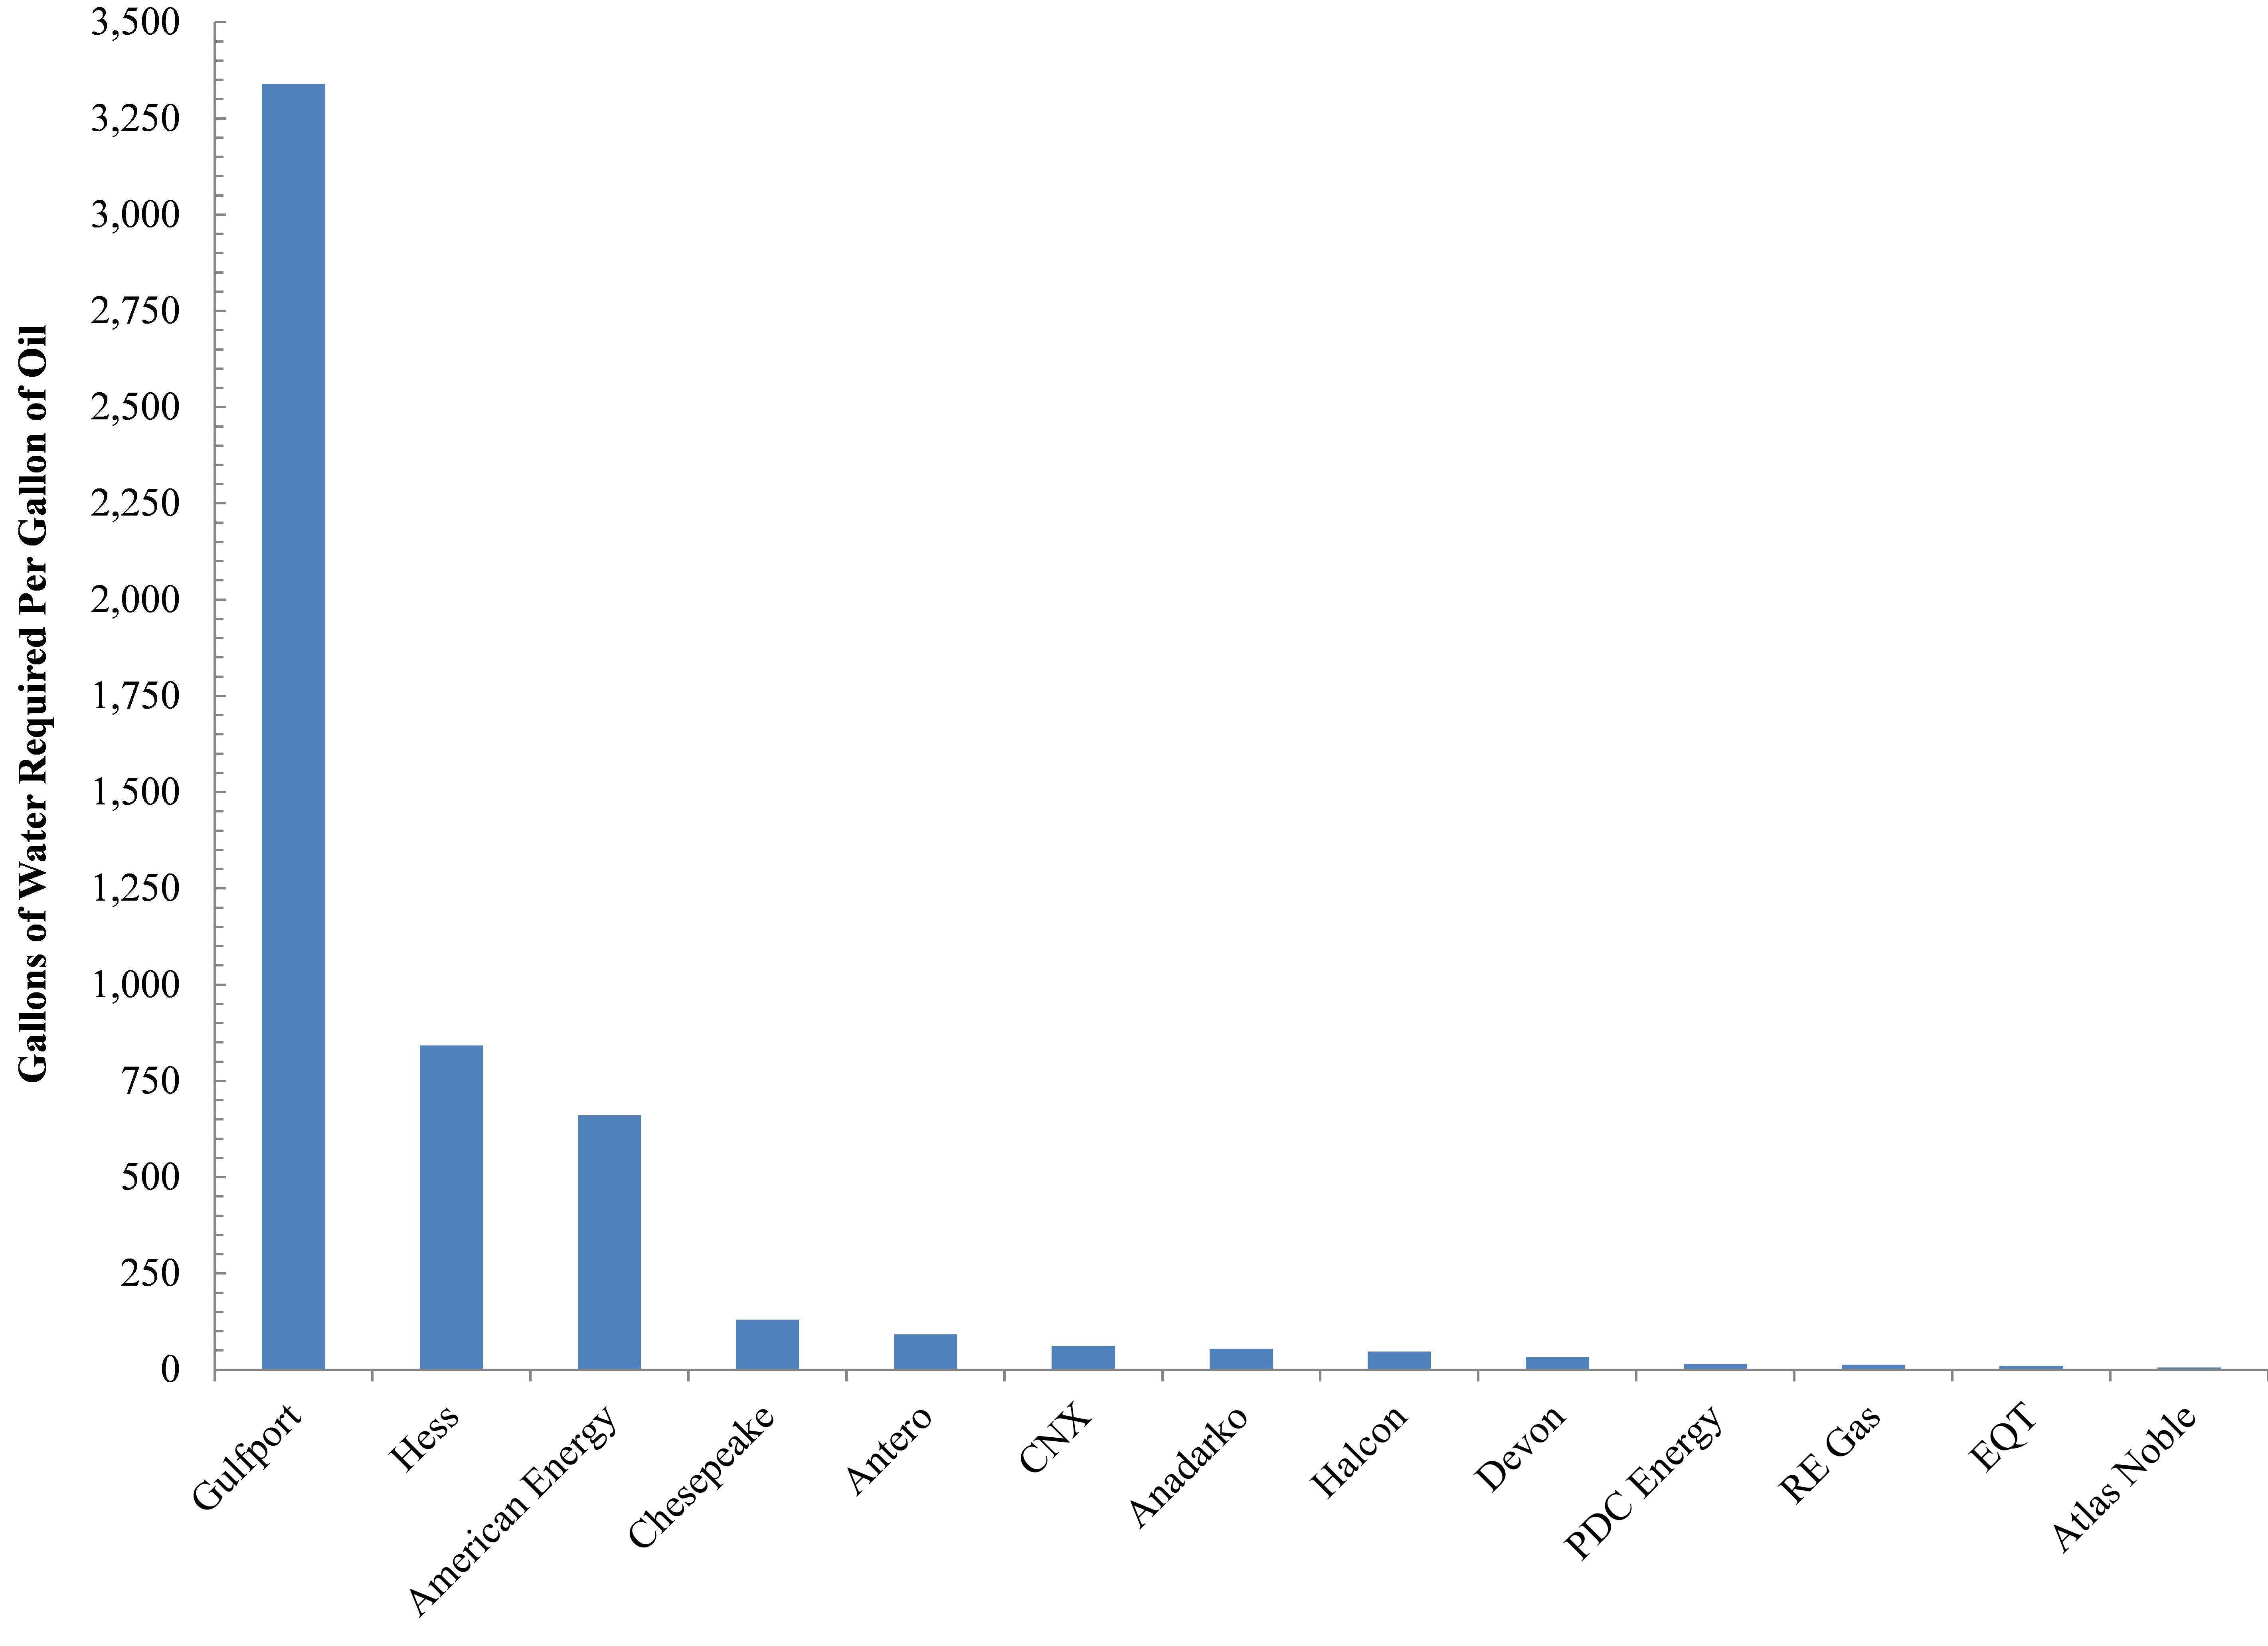
Figure 3. Water-to-Oil Ratios Among OH Utica Operators
Freshwater usage is increasing by 3.6 gallons per gallon of oil. Companies vary less in this metric, except for Gulfport (Figure 3):
Gulfport is by far the least efficient user of freshwater with respect to oil production, averaging 3,339 gallons of water to extract one gallon of oil.
Intermediate firms include American Energy and Hess, which required 661 and 842 gallons of freshwater to produce a gallon of oil.
The remaining eleven firms used anywhere from 6 (Atlas Noble) to 130 (Chesapeake) gallons of freshwater to get a unit of oil.
3. Water-to-Gas Ratios (Figure 4)
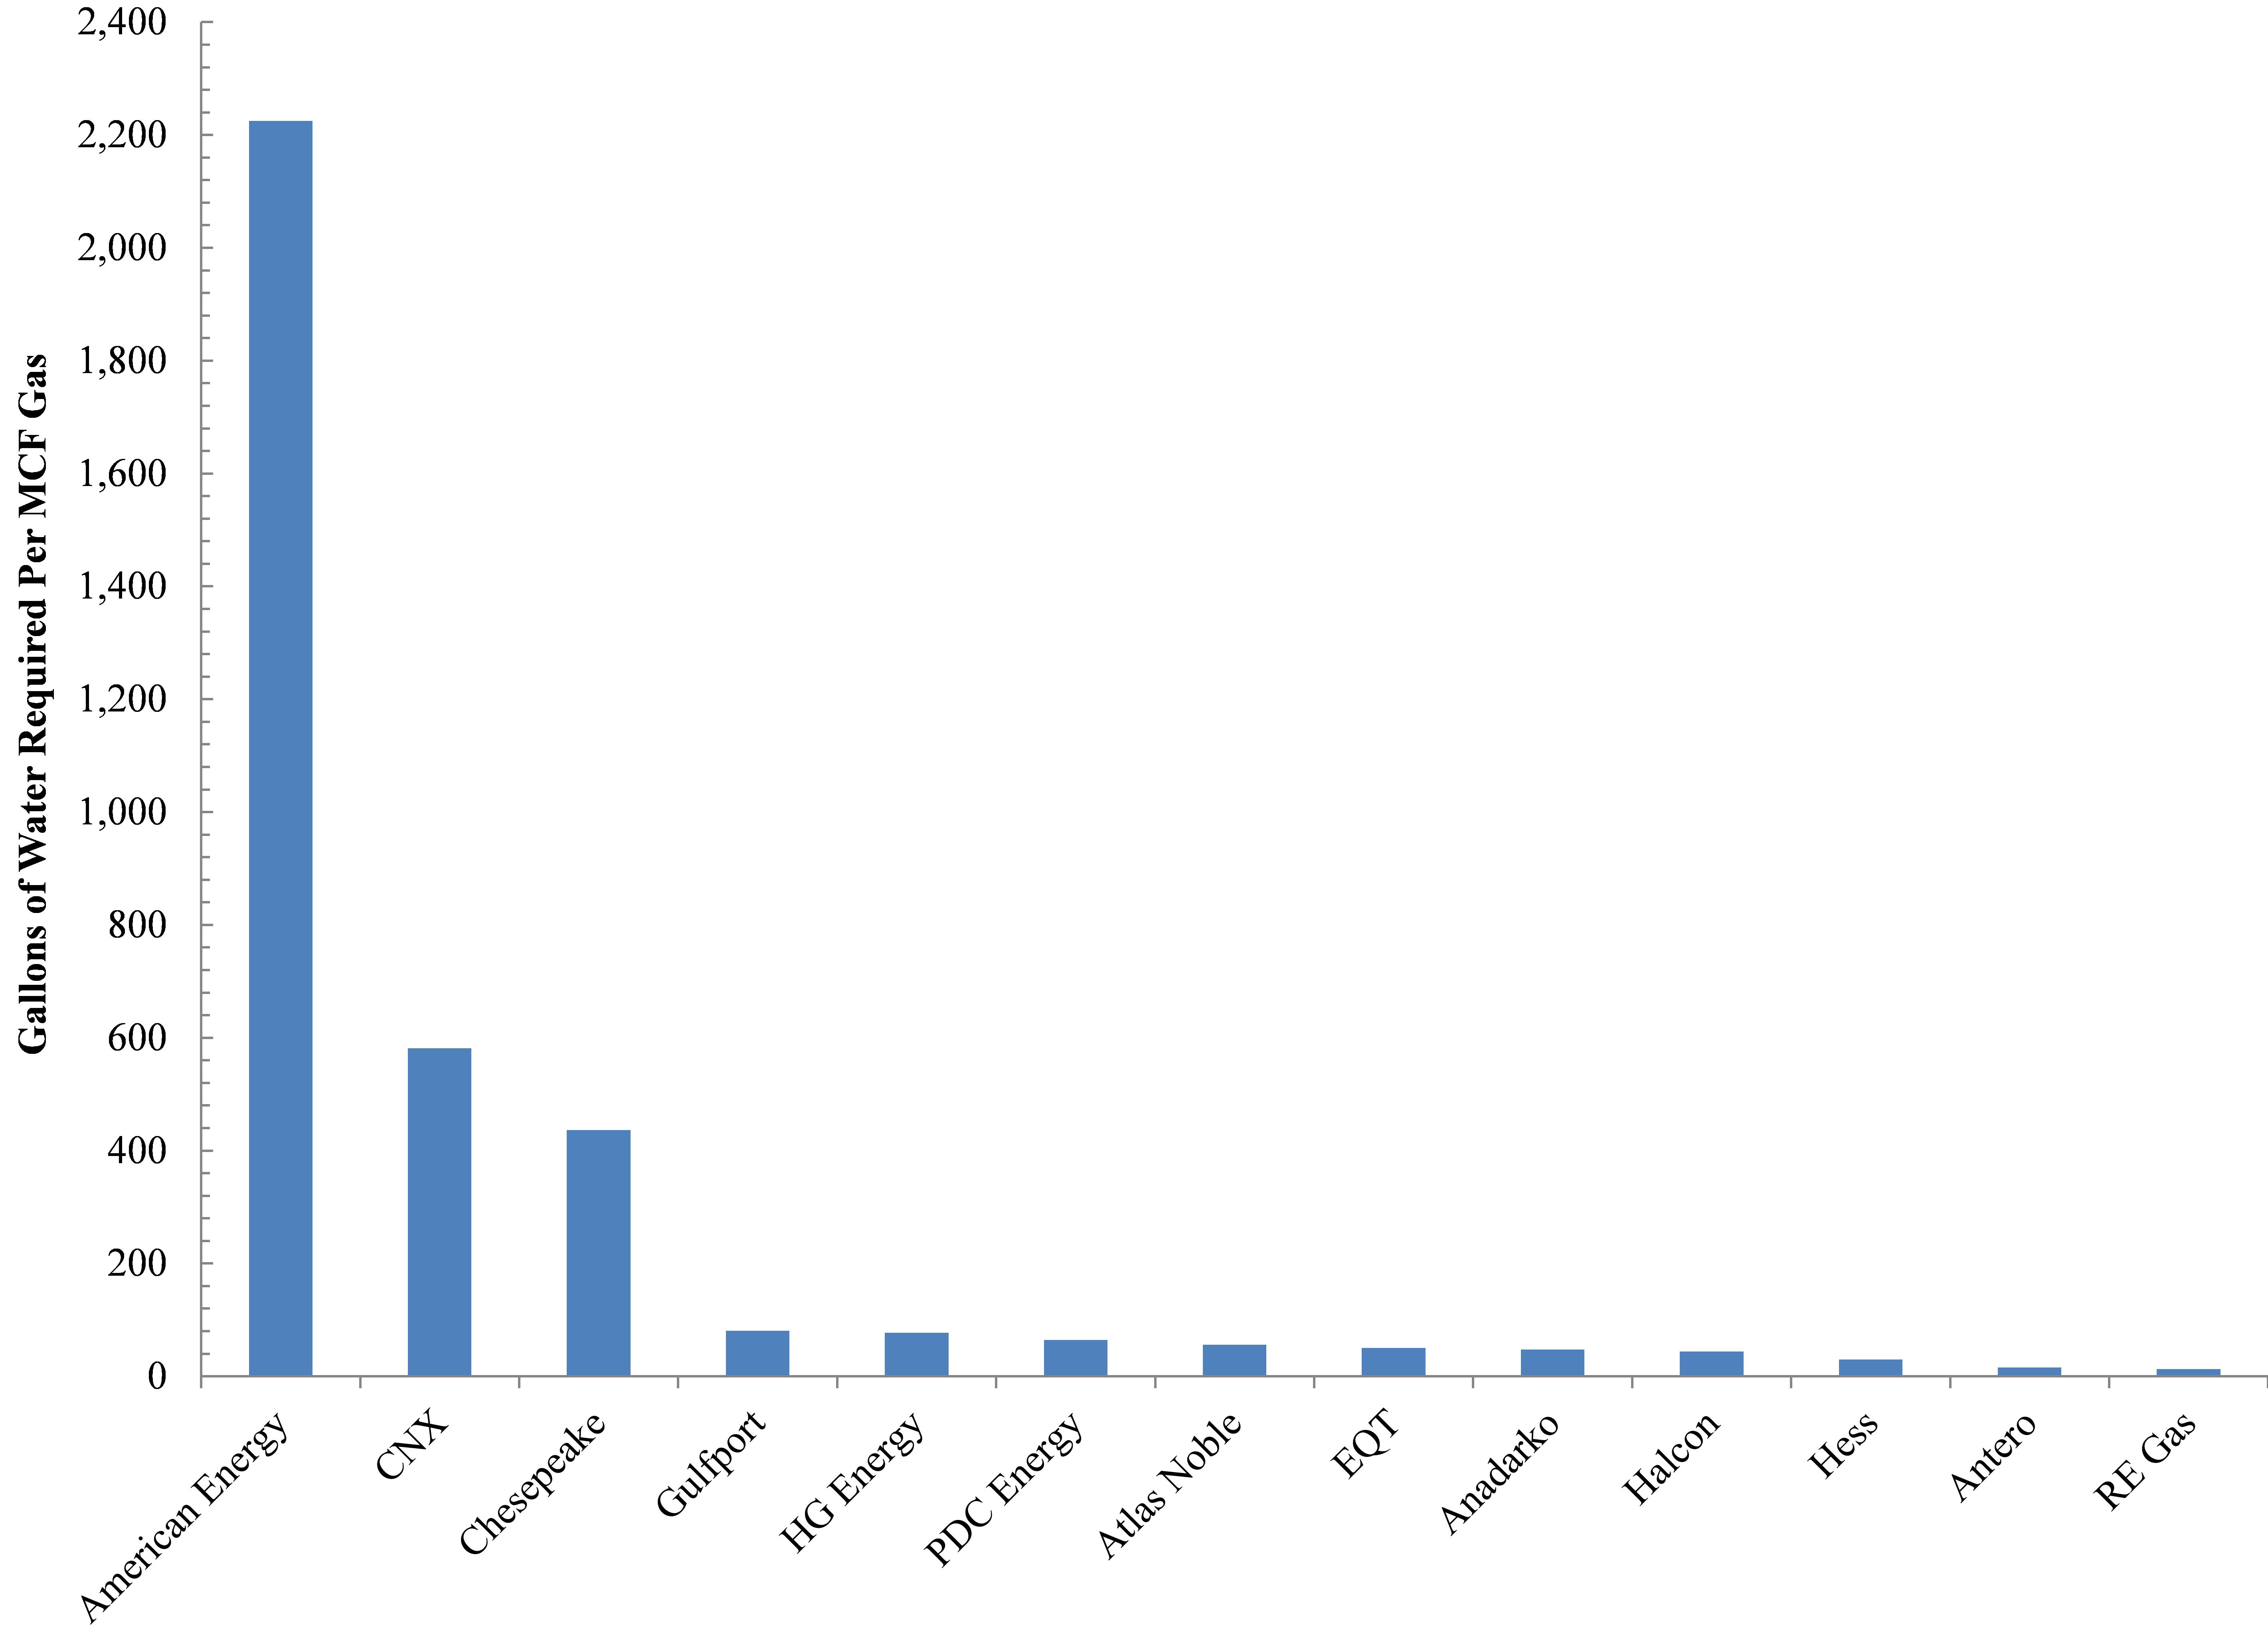
Figure 4. Water-to-Gas Ratio Among OH Utica Operators
American Energy is also quite inefficient when it comes to natural gas production utilizing >2,200 gallons of freshwater per MCF of natural gas produced
Chesapeake and CNX rank a distant second, requiring 437 and 582 gallons of freshwater per MCF of natural gas, respectively.
The remaining firms for which we have data are using anywhere from 13 (RE Gas) to 81 (Gulfport) gallons of freshwater per MCF of natural gas.
4. Brine Production (Figure 5)
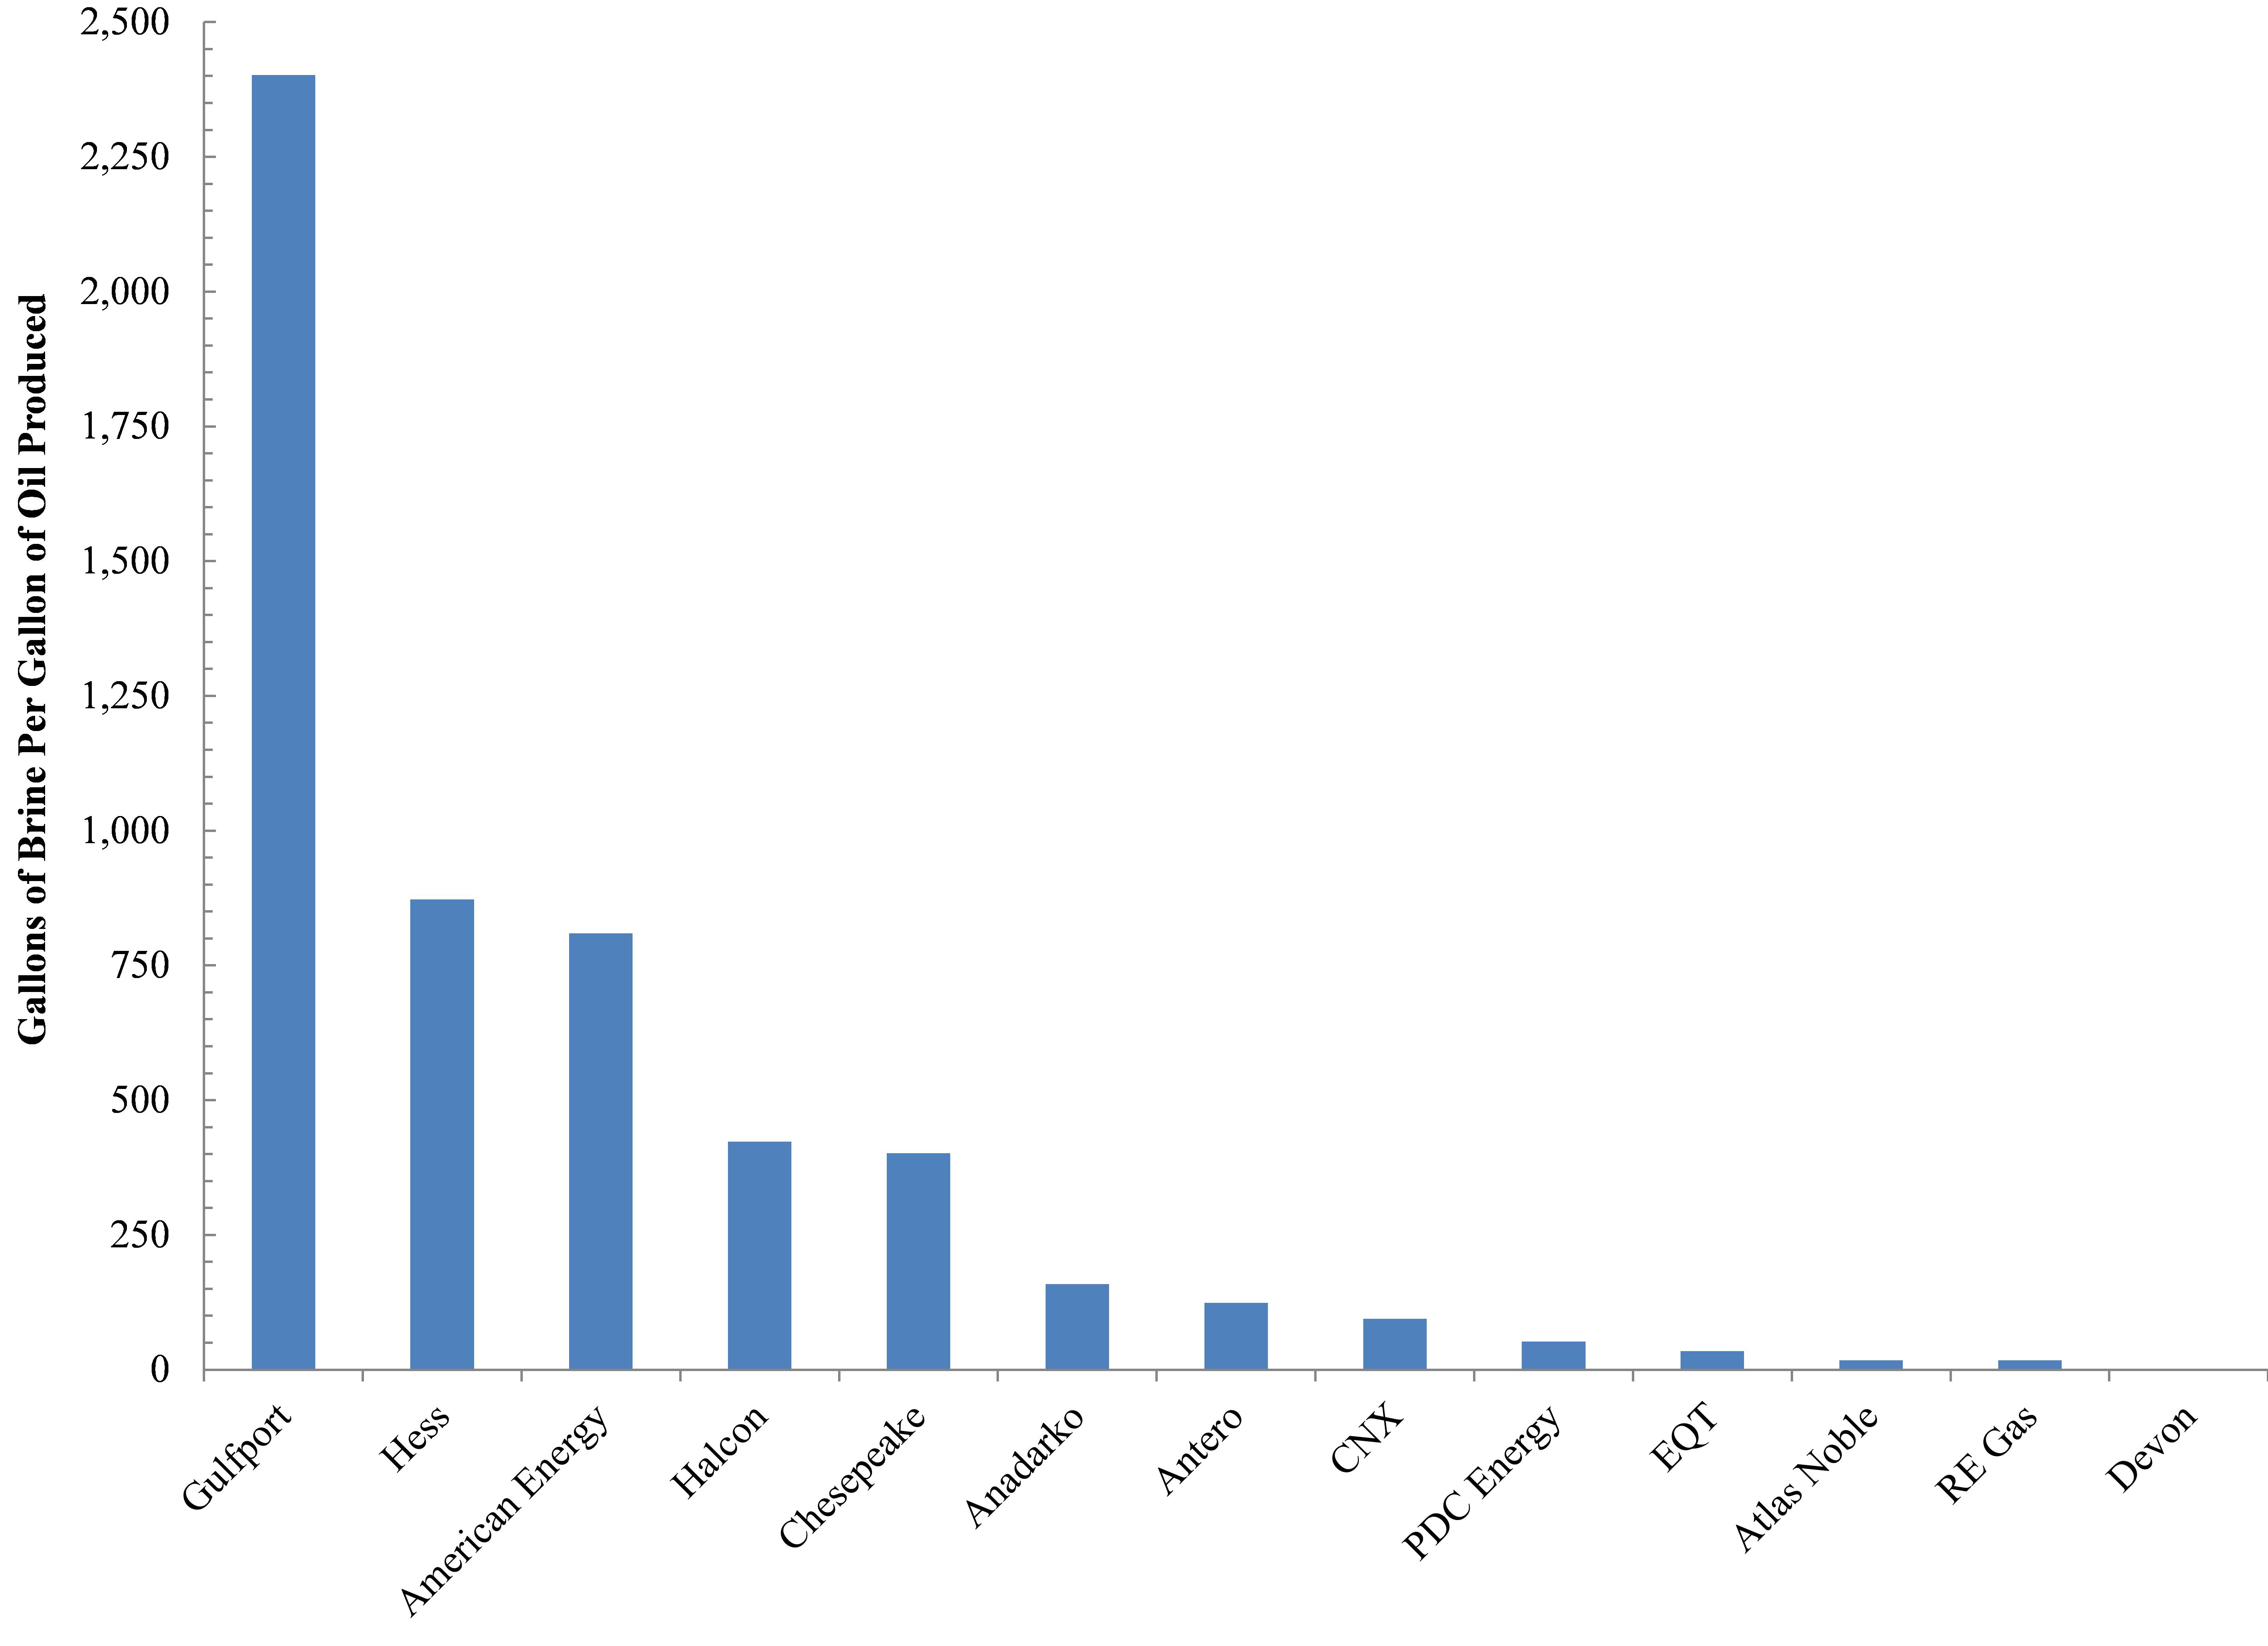
Figure 5. Brine-to-Oil Ratios among Ohio Utica Operators
With respect to the relationship between hydrocarbon and waste generation, we see that no firm can match Oklahoma City-based Gulfport’s inefficiencies with an average of 2,400+ gallons of brine produced per gallon of oil.
American Energy and Hess are not as wasteful, but they are the only other firms generating more than 750 gallons brine waste per unit of oil.
Houston-based Halcon and OH’s primary Utica player Chesapeake Energy are generating slightly more than 400 gallons of brine per gallon of oil.
The remaining firms are generating between 17 (Atlas Noble and RE Gas) and 160 (Anadarko) gallons of brine per unit of oil.
Part II of the Series
In the next part of this series we will look into inter-county differences as they relate to water use, production, and lateral length. Additionally, we will also examine how the OH DNR’s initial Utica projections differ dramatically from the current state of affairs.
Water and Production in Ohio’s Utica Shale – Water Per Well
https://www.fractracker.org/a5ej20sjfwe/wp-content/uploads/2014/10/Production-Feature.png400900Ted Auch, PhDhttps://www.fractracker.org/a5ej20sjfwe/wp-content/uploads/2021/04/2021-FracTracker-logo-horizontal.pngTed Auch, PhD2014-10-24 11:19:272020-07-21 10:34:05The Water-Energy Nexus in Ohio, Part I
Seeing is believing, as the saying goes. Without physically observing the amount of waste generated from hydraulic fracturing of unconventional oil and gas wells, it is difficult to comprehend the volume and scope of the waste produced.
The Pennsylvania Department of Environmental Protection (PADEP) makes a considerable amount of waste production data publicly available, speaking to the quantities of fluids and solids produced by 25 oil and gas operators across 25 counties. This figure, however, is only about 40% of all of the operators according to StateImpactPA. Also, complete data is not available for the 25 companies that are included, but let’s dig into some waste data simply as an exercise.
Dig Into Basic Cabot Waste Statistics
In order to gain a sense for industry trends we decided to look at data pertaining to Cabot Oil and Gas Corporation, specifically, whose entire 2013 inventory of oil and gas wells were in Susquehanna County and the surrounding region. The first and second halves of 2013 contain fairly complete records for Cabot – such as well location, waste facility location, waste type, waste quantity, and disposal method. It is interesting to note that in the comments section, all but a few of the well permit sites read “Entire water fraction of waste stream recycled at a centralized treatment plant for reuse by Cabot,” even for drill cuttings that were taken to a landfill.
The following analysis focuses on the waste generated by 264 Cabot wells during this period. All of Cabot’s unconventional oil and gas wells in Pennsylvania during 2013 were in Susquehanna County and the surrounding region.
Waste Produced
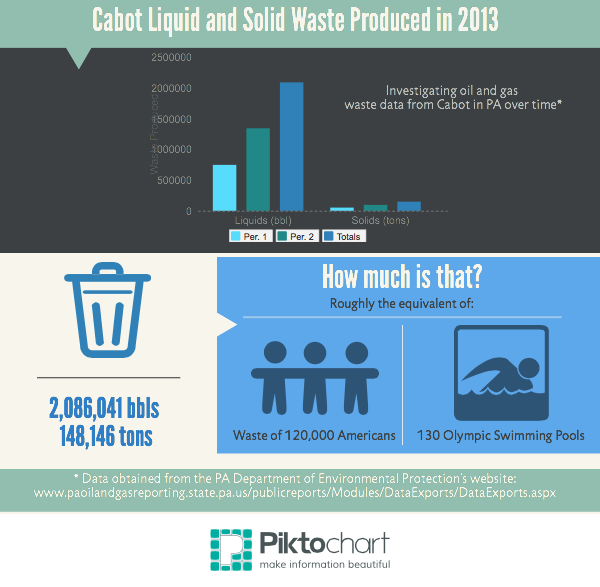
In the first 6 months of 2013 (Period 1), liquid waste – consisting of produced fluid, servicing fluid, hydraulic fracturing fluid (frac fluid) waste, and drilling fluid waste – totaled 745,898 barrels (Bbl) or over 30,000,000 gallons. Solid waste – or drill cuttings – totaled 51,981 tons.1 To put this into perspective, 745,898 Bbls is equivalent to the water usage requirements of about 4 wells in West Virginia.2 The 51,981 tons of drill cuttings weighs about the same as the average amount of garbage produced by 65,029 Americans per year, or 1.5 times the population of Susquehanna County. The fluid waste is also enough to fill approximately 48 Olympic swimming pools.
Period 2 (July through December) of 2013, consisting of 319 reporting wells, experienced a 77% increase in liquid waste, climbing past the 1 million Bbl mark to 1,340,143 Bbl. This figure is the equivalent of filling almost 85 Olympic swimming pools. Similarly, drill cuttings increased to 96,165 tons, almost double the amount generated in Period 1. The total amount of waste generated by Cabot for the entire year yields more than 2 million Bbl of liquid waste and nearly 150,000 tons of solid waste from drill cuttings1 – more than 130 Olympic swimming pools worth of water and a weight of solid waste equivalent to the average waste generated by more than 120,000 American per year- over 2.8 times the population pf Susquehanna County (see infographic below).
Waste Composition
According to Cabot’s waste data, most of the liquid waste is made up of produced fluid,1 which is the saline water that returns to the surface as a byproduct of the drilling process. This fluid can be up to 10 times saltier than ocean water and can also be radioactive.3 Frac fluid waste3 contributed to the next largest amount of waste, followed by drilling fluid waste and servicing fluid. Produced fluid tripled from Period 1 to Period 2, while frac fluid waste remained fairly steady, and drilling fluid waste decreased slightly. However, the amount of servicing fluid waste generated between the first and second half of 2013 increased more than 12 times.1 Overall, the following increases were seen between Period 1 and Period 2 in 2013:
Fluid waste from hydraulic fracturing rose by nearly 80%
Solid waste rose by 85%
The number of unconventional oil and gas reporting wells only increased by about 20%, from 264 to 319.
Examining the data from FracFocus that is available for these reporting wells,4 it is interesting to note that the average true vertical depth of the wells decreased by about 100 feet between the two periods. Therefore, it is difficult to understand why the amount of drill cuttings increased by 85% in Period 2. Why is there such a large increase in both solid and liquid waste between these two periods when there was only a 20% increase in the number of wells? There are various theories that could result in such a dramatic increase in period 2 compared to the 6 months prior, including but not limited to:
The use of more liquids for the construction or drilling processes,
Longer lateral distances per horizontal well,
More lax operating procedures,
More detailed reporting by Cabot, and/or
Stricter reporting/enforcement by the PADEP.
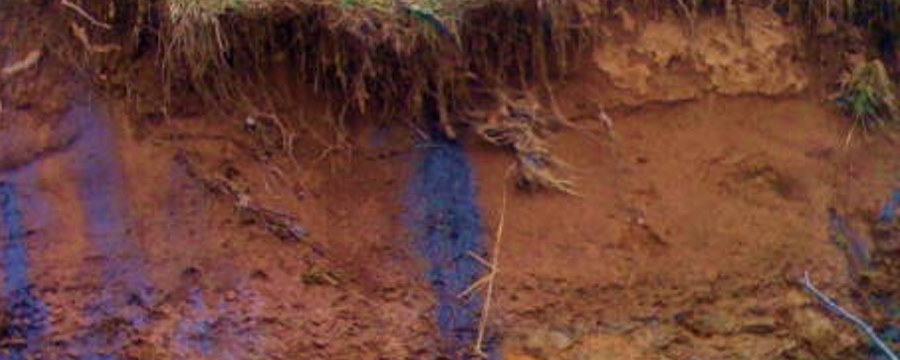
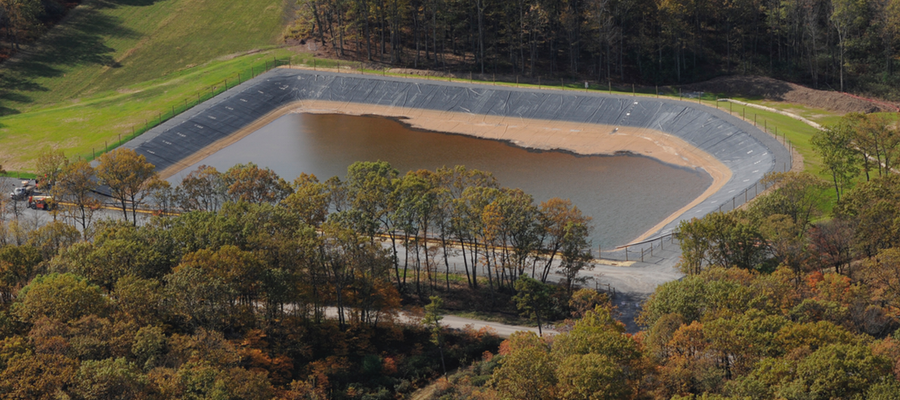
Waste Impoundment – Photo by Pete Stern 2013
Waste Produced Means Waste Transported
Although Cabot is responsible for producing large amounts of waste, they also are recycling their liquid waste (as is listed for every site in the Period 2 data). To do so, the company transports their waste to a centralized treatment plant. There, the water is filtered so that it can be mixed with more freshwater and chemicals and be reused at another well site. However, hauling so much fluid to the centralized treatment plant requires numerous trips by tanker trucks, as well as dump trucks and trailer trucks taking drill cuttings to landfills. Some treatment facilities for PA waste are located as far away as Ohio, West Virginia, and New York. Cabot trucks travelled approximately 114,000 miles5 in Period 1 of 2013, and over 1,122,000 miles were travelled in Period 2 of 2013. The total miles travelled to transport Cabot’s waste is equivalent to almost 50 times around the earth – for one company in one state, operating in only two counties.1
Additional Considerations
Further analysis should examine the air pollution and carbon footprint generated from such extensive traffic. The miles make a difference, considering that a highly efficient tractor trailor only gets ~10 miles per gallon.
While reusing the majority of liquid waste in an effort to reduce the amount of fresh water needed for hydraulic fracturing is a positive step, transporting recycling water by truck still results in fuel used, pollutants emitted, and traffic impacts.
Cabot Oil and Gas Corp. was the second largest unconventional shale gas producer in PA behind Chesapeake Appalachia LLC, which had more than 809 reporting wells in Period 2 of 2013. With a total of 62 companies operating in PA at this time,6 the cumulative effects of waste transportation undoubtedly add up. Serious efforts should be made on the part of all oil and gas companies to reduce their waste and provide accurate and timely waste reports.
https://www.fractracker.org/a5ej20sjfwe/wp-content/uploads/2014/10/Waste-Data-Feature.png400900FracTracker Alliancehttps://www.fractracker.org/a5ej20sjfwe/wp-content/uploads/2021/04/2021-FracTracker-logo-horizontal.pngFracTracker Alliance2014-10-22 12:26:262020-07-21 10:42:47Digging into Waste Data
FracTracker Alliance and the CREATE Lab at CMU are seeking volunteers to track oil trains on October 21st near Pittsburgh, PA for 2-hour segments from 7:00am – 7:00pm.
Sign up to participate (Link Deactivated, Archived Event)
Approximately 400,000 barrels of oil are transported daily from the west, following tracks from North Dakota’s Bakken Shale Play, which typically run through populated urban areas such as Pittsburgh. These trains have been known to derail and cause immense damage. The most recent of cases occurred in Québec in July of 2013, when a derailed train and the subsequent explosions resulted in the deaths of 47 people. The transportation of volatile crude oil from western states to major cities up and down the Eastern seaboard poses a major risk to any town or city through which these trains pass. FracTracker and affiliated groups want to understand the true risk that these volatile train cars pose to our region.
FracTracker and CREATE Lab will use the data collected during this project to analyze the frequency and risk of crude oil freight trains passing through the Pittsburgh area, but we need your help.
We are looking for volunteers that can commit to a two-hour shift throughout the day on October 21st. Volunteers will be equipped with a video camera, tripod, and of course coffee and snacks in order to record the passing of trains in either direction throughout a two-hour shift. The video footage will allow us to identify a plaque that is required to be displayed on cars carrying oil, as well as whether the cars are empty or full.
If you are interested in volunteering with FracTracker and this freight train project, follow the link above to sign up for a shift. Please do not hesitate to contact us with any questions or concerns at (412) 802-0273 or Malone@FracTracker.org. We hope to see you there!
About Us
FracTracker Alliance is a non-profit with an office in the Pittsburgh area whose mission is to share maps, data, and analyses to communicate impacts of the global oil and gas industry and to inform actions that positively shape our energy future. www.fractracker.org
The Community Robotics, Education and Technology Empowerment Lab (CREATE Lab) explores socially meaningful innovation and deployment of robotic technologies and is based out of Carnegie Mellon University. www.cmucreatelab.org
https://www.fractracker.org/a5ej20sjfwe/wp-content/uploads/2014/10/Train-Image.jpg400900FracTracker Alliancehttps://www.fractracker.org/a5ej20sjfwe/wp-content/uploads/2021/04/2021-FracTracker-logo-horizontal.pngFracTracker Alliance2014-10-15 15:21:272020-07-21 10:42:47Help Us to Track Oil Trains in Pittsburgh and Beyond