Fracking has made a real mess of things – sullying our air, befouling our water, disrupting communities. Ethane and other hydrocarbons feed plastic production, accelerating the global plastic pollution crisis while the planet warms out of control.
It’s an all-hands-on-deck moment.
Last week I traveled to Wyalusing, Pennsylvania, a quiet town along the Susquehanna, the mother river to the treasured Chesapeake Bay. Around Wyalusing, fracking consumes the landscape, and a planned 265-acre natural gas liquefaction complex promises more madness: around the clock trucking of volatile cargoes. Imagine watching a field behind your home morph into a sprawling industrial site with hazardous emissions. That story is real. Enough is enough – we need your help.
FracTracker works to illuminate the incursions of this rogue industry. Our maps, data, and analyses support the mounting pushback on infrastructure – from sand mines to pipelines, production wells to waste injection wells. The spectrum of harms is daunting, but our team is motivated to highlight risk and injustice wherever they arise, giving the public the tools and information they need in these David vs. Goliath battles.
Wyalusing is a Native American word meaning “home of the warrior.” Like the people standing their ground in that place today or the army of organizations across America with whom we collaborate, we’re all warriors fighting for a healthy future near and far.
Please give to FracTracker this holiday season. Your donation offers us hope and strength, powering actions that aid, inspire, and facilitate victory. It’s a gift that keeps on giving.
FracTracker will soon eclipse one million unique visitors to our website, underscoring that we are and shall remain a valued resource for advocacy, education, and research until the glorious day fossil fuels fade into history. Until then, on behalf of our staff and board, thank you for your ongoing support and warm wishes for a safe and joyous holiday season.
https://www.fractracker.org/a5ej20sjfwe/wp-content/uploads/2016/12/Rig-OH-Feature.jpg400900Guest Authorhttps://www.fractracker.org/a5ej20sjfwe/wp-content/uploads/2021/04/2021-FracTracker-logo-horizontal.pngGuest Author2018-12-27 07:40:512021-04-15 14:57:02Please give to FracTracker Alliance in 2018
Pittsburgh, PA – Yesterday, the Pennsylvania Department of Environmental Protection (DEP) announced their decision to issue a permit for the construction of Shell’s Falcon ethane pipeline project in southwest PA. FracTracker Alliance is extremely disappointed that DEP is allowing this project to proceed despite heavy opposition from the public and unaddressed concerns for the safety and well-being of nearby residents and the surrounding environment.
The past year has seen countless issues from the construction of new pipelines in the Commonwealth – from hundreds of “inadvertent returns,” (spills of bentonite drilling mud) along the path of the Mariner East II project to the catastrophic explosion of the week-old Revolution Pipeline in Beaver County. These reoccurring and serious incidents make it clear that oil and gas midstream companies are rushing to put infrastructure in place, and DEP and other regulatory agencies have been failing in their mission to adequately supervise the process.
According to data from the US Pipeline and Hazardous Materials Safety Administration, there were 108 pipeline incidents in Pennsylvania between January 2010 and mid-July 2018, resulting in 8 fatalities, 15 injuries, requiring over 1,100 people to be evacuated from their homes, and causing more than $66 million in property damage. This track record, which does not include the Revolution Pipeline explosion in September of 2018, is frankly unacceptable.
Certainly, the Commonwealth has invested heavily in the Shell Ethane Cracker facility, offering steep tax subsidies and even paying the global petrochemical giant $2.10 for every barrel of ethane it consumes from Pennsylvania wells, equivalent to $1.6 billion over the next 25 years. It appears to FracTracker that these business arrangements have made the continued extraction and exploitation of hydrocarbons the priority for DEP, not protecting the environment and health and safety of Pennsylvanians, as the mission of the Department suggests is their focus. DEP’s decision also traces an unfortunate pattern of opaqueness and poor timing by announcing unpopular decisions right before the holidays.
Fundamentally, oil and gas companies like Shell exist to make profits, and will therefore make decisions to maximize earnings and limit their costs, if left to their own devices. This approach is often directly at odds with public safety, so Pennsylvania entrusts DEP to oversee the operations. FracTracker feels that with their decision to move forward with the project on December 20, 2018, DEP brushed over dozens of substantial concerns regarding the Falcon ethane pipeline project, and therefore failed in this mission. We remain unconvinced that the “appropriate construction techniques and special conditions” required by DEP will adequately protect the environment and health and safety of residents along the Falcon pipeline route.
Dec. 21st Update: After this article was written, FracTracker learned that Ohio’s EPA issued an air quality permit for the cracker plant in Belmont County, Ohio on December 21st. The short public comment period and the rush to issue permits again illustrates that significant public health and environmental concerns are given minimal importance versus corporate wishes and political expediency. The regulatory paradigm is broken. The public has been ill served by the agencies entrusted to safeguard their interests. A collective regional voice should be raised in protest.
Started in 2010 as a southwestern Pennsylvania area website, FracTracker Alliance is now a national organization with regional offices across the United States in Pennsylvania, Washington DC, New York, Ohio, and California. The organization’s mission is to study, map, and communicate the risks of oil and gas development to protect our planet and support the renewable energy transformation. Its goal is to support advocacy groups at the local, regional and national level, informing their actions to positively shape our nation’s energy future. www.fractracker.org
Learn more about FracTracker’s coverage of the Falcon ethane pipeline project by exploring the posts below:
Last month, the Department of Energy (DOE) submitted a report titled Ethane Storage and Distribution Hub in the United States to Congress. The report sums up several other recent geologic studies and economic analyses that evaluate the potential to create a large petrochemical hub in southwest Pennsylvania, Ohio, West Virginia, and northeastern Kentucky.
Most people call this region Appalachia because of the mountains, or the Ohio River Valley because of the namesake river. The petrochemical industry looks deeper: they’ve branded it Shale Crescent USA, after the shale gas thousands of feet underground. This article summarizes recent developments on storing natural gas liquids, including ethane, in this region – whatever you prefer to call it.
Background
The United States currently produces more natural gas than any other country in the world, with much of the fracked gas coming from the Marcellus and Utica shales in Appalachia. The DOE report predicts that production in this region will continue growing from an estimated at 8.19 trillion cubic feet (Tcf) in 2017, to 13.55 Tcf in 2025 and 19.5 Tcf in 2050.
Natural Gas Production Estimates:
8.19 Tcf in 2017
13.55 Tcf in 2025
19.5 Tcf in 2050
In addition to oil and gas, fracking produces natural gas liquids (NGLs), such as ethane, propane, and butane. NGLs are a key component of the petrochemical industry, which takes these resources and converts them into plastics and resins. As industry extracts more natural gas, it will also be left with more NGLs to manage.
Hoping to profit off NGLs, the oil and gas industry is investing in petrochemical production. In the Appalachian basin, the DOE predicts that production of ethylene from ethane will reach 640,000 barrels a day by 2025 (this is 20 times the amount the region produced in 2013). The Gulf Coast of the U.S., as well as countries in Asia and the Middle East, are also growing their production capacities. Globally, ethylene production is projected to grow 31% from 2017 to 2025.
The rise of the petrochemical industry comes at a point when there’s an increasing global awareness of the disaster that is plastic pollution. As much as 12.7 million tons of plastic waste goes into the ocean each year, affecting over 700 species of marine animals. On land, plastic waste is often shipped to less developed nations, where it ends up polluting poor communities and contaminating their drinking water and air.
Nevertheless, politicians in PA, OH, and WV are working hard to attract petrochemical build-out in Appalachia. The region already houses much of the infrastructure needed for a petrochemical hub, such as fracked wells that pump out NGLs and processing plants to separate these liquids from the rest of the natural gas stream. One thing it’s missing, however, is significant capacity to store natural gas liquids – particularly ethane.
Why does industry need storage?
Ethane storage offers several benefits to the petrochemical industry. For one, it would serve as a steady supply of ethane for plants like ethane crackers, which “crack” ethane into ethylene to make polyethylene plastic. With this constant supply (transported to crackers via pipeline), plants can operate 24 hours a day, year round, and avoid using energy to shutdown and restart. Storage also allows industry to adapt to fluctuations in demand and price.
Another argument for expanding petrochemical activity in Appalachia is to diversify the industry’s geography. The current petrochemical hub in Texas and Louisiana (where over 95% of the country’s ethylene production takes place) is subject to extreme weather events. In 2017, Hurricane Harvey caused over half of the nation’s polyethylene production capacity to shut down. The report mentions “extreme weather events” multiple times as justification for building a petrochemical hub in Appalachia. This stance strongly suggests that the DOE is preparing for increased hurricanes and flooding from climate change, although this is never explicitly stated. Unsurprisingly, the industry’s role in causing climate change is left out from the report as well.
What does storage look like?
While the term ‘natural gas liquid’ may seem like an oxymoron, it refers to the different forms the substances take depending on temperature and pressure. At normal conditions, NGLs are a gas, but when pressurized or exposed to extremely cold temperatures, they act as a liquid. NGLs occupy significantly less space as a liquid, and are therefore moved and stored as a pressurized or refrigerated liquid.
Storage can be in above ground tanks, but is often underground in gas fields or underground caverns. NGLs are highly volatile, and storing them above ground puts workers and surrounding communities at risk. For example – last week, an above ground storage tank exploded at a natural gas processing plant in Washington County, PA, sending four people to the hospital. While underground storage is perceived as “safer,” it still poses significant risks, particularly in a geography like Appalachia full of wells, coal mines, and pipelines. This underground infrastructure can cause NGLs to leak during storage or the land above them to collapse.
A study out of West Virginia University, titled “A Geologic Study to Determine the Potential to Create an Appalachian Storage Hub For Natural Gas Liquids,” identified three different types of storage opportunities along the Ohio and Kanawha river valleys:
Underground storage options
Mined-rock cavern: Companies can mine caverns in formations of limestone, dolomite, or sandstone. The formation must be at least 40 feet thick to hold NGLs. This study focused on formations of the Greenbrier Limestone, which occurs throughout southwestern Pennsylvania, West Virginia, and Kentucky.
Salt cavern: Developing salt caverns involves injecting water underground to create a void, and then pumping NGLs into the cavern. Suitable salt caverns have “walls” at least 100 feet thick above and below the cavern. The study recommended salt caverns 1,500 to 3,000 feet deep, but considered those as deep as 6,700 feet.
Gas field: NGLs can also be stored in natural gas fields or depleted gas fields in underground sandstone reservoirs. Suitable gas fields are 2,000 feet deep or more according to the WVU study.
Where could storage sites be located?
The West Virginia University study identified and ranked thousands of gas fields, several salt caverns, and many regions in the Greenbrier Limestone that could serve as NGL storage. Most of the top-ranked opportunities are in West Virginia, near the state’s borders with Ohio and Pennsylvania, and several cross beneath the Ohio or Kanawha rivers. The researchers conclude with three “prospects,” which are circled in Figure 1.
The table below lists the specific storage opportunities in each prospect, as well as the available data on depth, thickness, and acreage of the formations. Also listed are the counties that the storage facility would cross into.
Northern Prospect
Name
Type
Depth (feet)
Thickness (feet)
Counties
Land Size (acres)
Salina F4 Salt cavern
Salt cavern
–
>100 to 150
Primarily Columbiana, OH, also Hancock, WV & Beaver, PA
83,775
Salina F4 salt cavern
Salt cavern
–
100 to 150
Primarily Jefferson, OH, also Brooke & Hancock WV, & Washington, PA
2 possibilities for a cavern- one in northern Putnam & Roane WV, the other in Kanawha & Boone, WV
> 530,000 and >170,000
Burdett-St. Albans Field
Depleted gas field
1,824 to 2,510
4 to 27
Primarily Putnam, also Lincoln & Kanawha, WV
50,000
The Elk-Poca (Sissonville) Field
Depleted gas field
4,140 to 5,497
14
Putnam, Jackson, Kanawha, WV
245,000
Campbell Creek Field
Depleted gas field
4,825
15
Kanawha, WV
21,000
Ripley Field
Existing natural gas storage
4,660 to 5,012
15 to 56
Jackson, WV
>9000
North Ripley Field
Depleted gas field
5,379
77
Jackson, WV
19,000
Rocky Fork
Depleted gas field
5,623
140
Kanawha, Putnam ,WV
42,000
Cooper Creek
Depleted gas field
5,754
30
Kanawha, WV
8,600
Kanawha Forest
Depleted gas field
5,378
48
Kanawha, Boone, WV
28,000
Existing NGL Storage
Storage in the United States
The U.S. has two major NGL storage hubs (both in salt caverns): One is in Mont Belvieu, Texas and the other in Conway, Kansas. These facilities are strategically located near the petrochemical industry’s hub along the Gulf Coast. There is also underground storage in Sarnia, Ontario.
Industry in Appalachia is connected to these storage facilities via pipelines, including Sunoco’s Mariner West that transports ethane to Sarnia, and the Appalachia-Texas-Express (ATEX) pipeline that takes ethane to Mont Belvieu. However, as suggested above, NGL storage in Appalachia is also under development.
Appalachia Storage & Trading Hub
Appalachia Development Group LLC is heading the development of the Appalachia Storage & Trading Hub initiative. The company has not announced the specific location for underground storage, but has been working hard to secure the funds for this development.
In September of 2017, Appalachia Development Group submitted part 1 of a 2-part application for a $1.9 billion loan to the US DOE Loan Program Office. The DOE approved the application the following January, inviting the company to submit the second part, which is currently pending. This second part goes through the DOE’s Title XVII innovative clean energy projects loan program.
According to the DOE, this program “provides loan guarantees to accelerate the deployment of innovative clean energy technology.” Paradoxically, this means the DOE may give clean energy funds to the petrochemical industry, which is fueled by fossil fuels and does not provide energy but rather plastic and resins.
Steven Hedrick, the CEO of Appalachia Development Group, was part of a West Virginia trade delegation that traveled to China in 2017 to meet with China’s largest energy company. This meeting, which included President Trump and China’s President Xi Jinping, resulted in China Energy agreeing to invest $83.7 billion to support natural gas and petrochemical development in West Virginia. (Of note: This agreement has faced uncertainty following Trump’s tariffs on Chinese goods). West Virginia Governor Jim Justice later criticized Hedrick’s involvement in the meeting, where he promoted the interests of his private company.
Mountaineer NGL Storage Project
Another company, Energy Storage Ventures LLC, has plans to construct NGL storage near Clarington, Ohio. This facility would be on land formerly belonging to Quarto Mining Company’s Powhatan Mine No. 4. Called “Mountaineer NGL Storage,” the project would develop salt caverns to store propane, ethane, and butane. Each cavern could store 500,000 barrels (21 million gallons) of NGLs.
The video below, made by the Energy Storage Ventures, describes the process of developing salt caverns for storage.
The Mountaineer NGL Storage Project location is about 12 miles south of the PTTGC ethane cracker (if built), in Dilles Bottom Ohio. It’s also roughly 60 miles south of the Shell ethane cracker (under construction) in Potter Township, PA. If developed, the project could supply these plants with ethane and allow them to continuously operate. According to Energy Storage Ventures President, David Hooker, the project would also trigger $500 million in new pipelines in the region and $1 billion in fractionation facilities to separate NGLs.
Energy Storage Ventures wants to build three pipelines beneath the Ohio River. Two pipelines (one for ethane and one for propane and butane) would deliver NGLs to the storage site from Blue Racer Natrium, a fractionation plant that separates dry natural gas from NGLs. A third pipeline would take salt brine water from the caverns to the Marshall County chlorine plant (currently owned by Westlake Chemical Corp). These facilities, as well as the locations of the two ethane crackers storage could serve, are in the map below. This map also includes the potential storage opportunities the researchers at West Virginia University identified.
Referring to concerns about building pipelines and caverns near the Ohio River, a drinking water source for 5 million people, the company’s president David Hooker stated, “This is not rocket science. These things have operated safely for years… Salt, at depth, is impermeable. You won’t see any migration out of the salt.”
This video is a rendering of what the 200-acre site will look like, including the salt water impoundment structure (capable of holding 3.25 million barrels), and the infrastructure needed to deliver products and equipment by rail and truck:
The company has stated that it owns both the land and mineral rights it needs to develop the caverns, but the project has also faced delays.
Where is this plastic going?
One common argument for a petrochemical hub in Appalachia is the region’s proximity to the downstream sector of petrochemical industry. Manufacturers such as PPG Industries, Dow Chemical Inc., and BASF are all based in the area and could make use of the feedstock from an Appalachian hub.
However, the report doesn’t make it clear where the plastic and resin end products will land. It does state that the demand in the United States isn’t enough to swallow up two major petrochemical hubs worth of plastic.
Export markets
The DOE report states that, “the development of new petrochemical capacity in Appalachia is not necessarily in conflict with Gulf Coast expansion.” Since the Gulf Coast already has the infrastructure for export, it could focus on international markets while Appalachia meets domestic demand. Alternatively, the Appalachian hub could serve European destinations while the Gulf Coast hub delivers to Pacific Basin and South American destinations. Plastic consumption is highly correlated with population, so countries with large, growing populations such as India and China are likely markets.
It’s important to note that the U.S. isn’t the only country increasing its production of petrochemical derivatives, and as the report notes, exports from the US “may face a challenge from global capacity surplus.” Figure 2 shows that global production of ethylene is expected to surpass global consumption, shown in Figure 3. The graph of consumption likely ignores the impact of plastic-reducing policies that hundreds of countries and cities are implementing. As such, it may be an over-estimation.
Figure 2. Historical and future ethylene production by global region. Source
Figure 3. Ethylene consumption by global region. Source
In the end, it appears that the industry’s plan is to build first, and worry about markets later, hoping that a growing supply of affordable plastic will increase consumption.
Perhaps the reason industry is so eager to forge a market is because oil and gas is struggling with a lot of debt. A study out of the Sightline Institute found that as of the first half of 2018, “US fracking-focused oil and gas companies continued their eight-year cash flow losing streak.” The Center for International Environmental Law found that petrochemicals generally have a larger profit margin than oil and gas: “In 2015, ExxonMobil’s Chemicals segment accounted for roughly 10% of its revenues but more than 25% of its overall profits.”
Plastic is one way to subsidize this dying industry…
Beyond Storing Natural Gas Liquids
The motive behind developing storage is to catalyze and support a major industry. The DOE report states that the new infrastructure required “would include gathering lines, processing plants, fractionation facilities, NGLs storage facilities, ethane crackers, and then…plants for polyethylene, ethylene dichloride, ethylene oxide, and other infrastructure.” A hub would require more fracking and wastewater injection wells, cause even more heavy truck traffic that adds stress to roadways, and require additional power plant capacity to serve its electricity demand.
In other words, an Appalachian petrochemical hub would profoundly impact the region. The report contains an in-depth analysis of the economic impacts, but fails to mention any environmental concerns, social impacts on communities, or health effects. The other major studies on this buildout, mentioned above, follow a similar pattern.
A quick look at industry along the Gulf Coast tells you that environmental, social, and health concerns are very real and produce their own economic debts. The petrochemical industry has created a “cancer alley” in Texas and Louisiana, disproportionately impacting low-income and minority communities. Yet, industry is preparing another hub without a single comprehensive environmental impact assessment or health assessment for the region. As each pipeline, fracked well, and plant is permitted separately, we can’t properly assess the cumulative negative impacts this development will have on our waterways, forests, soil, or air quality. Therefore, we also won’t know how it will affect our health.
Looking into the future
The report analyzes the industry through 2050. It states that NGL output in Appalachia:
… will continue to grow throughout the forecast period. As natural gas production gradually migrates away from liquids-rich gas areas, which are expected to slowly deplete, to dryer areas, the rate of growth in NGPL production will slow relative to the rate of natural gas production growth.
In 31 years, the kids growing up in Appalachia right now could be left with brownfields, dried-up wells, and abandoned ethane crackers. But it doesn’t have to be this way. Last year, the DOE reported that there are more jobs in clean energy, energy efficiency, and alternative vehicles than in fossil fuels. By using funds such as the DOE’s Title XVII innovative clean energy loan – for actual clean energy – we can bring economic development to the region that will be relevant past 2050 and that won’t sacrifice our health and natural resources for short-term private gains.
By Erica Jackson, Community Outreach and Communications Specialist
https://www.fractracker.org/a5ej20sjfwe/wp-content/uploads/2018/12/Appalachian-Storage-Feature.jpg400900Erica Jacksonhttps://www.fractracker.org/a5ej20sjfwe/wp-content/uploads/2021/04/2021-FracTracker-logo-horizontal.pngErica Jackson2018-12-19 12:31:022025-01-14 15:37:24Storing Natural Gas Liquids in Appalachia
Can you believe the end of the year is almost here? How time flies when you’re busy…
We are reaching out to you today to ask if you could help us spread the cheer this holiday season. For any donations FracTracker receives in the month of December, we will share half the contributions equally amongst four worthy organizations selected by this year’s Community Sentinel Award for Environmental Stewardship recipients.
Any time you give to FracTracker you help us support frontline oil and gas communities and organizations with pivotal insights and resources to protect what they hold dear. With just $100, we can provide a custom map to a community fighting the environmental and health impacts of the oil and gas industry.
And in December your money will go even further! In the spirit of the Sentinel Awards, help us spread the cheer by donating before January 1st.
With Much Gratitude,
Brook Lenker
Executive Director and Sentinel Award Coordinator
FracTracker Alliance
https://www.fractracker.org/a5ej20sjfwe/wp-content/uploads/2018/12/Spreadthecheer-Free-Feature.jpg400900Guest Authorhttps://www.fractracker.org/a5ej20sjfwe/wp-content/uploads/2021/04/2021-FracTracker-logo-horizontal.pngGuest Author2018-12-12 11:25:182021-04-15 14:57:03Help us spread the cheer this holiday season!
Pipelines play a major role in the oil and gas extraction industry, allowing for the transport of hydrocarbons from well sites to a variety of infrastructure, including processing plants, petrochemical facilities, power generation plants, and ultimately consumers. There are more than 2.7 million miles of natural gas and hazardous liquid pipelines in the United States, or more than 11 times the distance from Earth to the moon.
With all of this infrastructure in place, pipelines are inevitably routed close to homes, schools, and other culturally or ecologically important locations. But how safe are pipelines, really? While they are typically buried underground and out of sight, many residents are concerned about the constant passage of volatile materials through these pipes in close proximity to these areas, with persistent but often unstated possibility that something might go wrong some day.
Safety talking points
In an attempt to assuage these fears, industry representatives and regulators tend to throw around variants of the word “safe” quite a bit:
Pipelines are the safest and most reliable means of transporting the nation’s energy products.
— Keith Coyle, Marcellus Shale Coalition
Although pipelines exist in all fifty states, most of us are unaware that this vast network even exists. This is due to the strong safety record of pipelines and the fact that most of them are located underground. Installing pipelines underground protects them from damage and helps protect our communities as well.
— Pipeline and Hazardous Materials Safety Administration (PHMSA)
Pipelines are an extremely safe way to transport energy across the country.
— Pipeline 101
Knowing how important pipelines are to everyday living is a big reason why we as pipeline operators strive to keep them safe. Pipelines themselves are one of the safest ways to transport energy with a barrel of crude oil or petroleum product reaching its destination safely by pipeline 99.999% of the time.
— American Petroleum Institute
But are pipelines really safe?
Given these talking points, the general public can be excused for being under the impression that pipelines are no big deal. However, PHMSA keeps records on pipeline incidents in the US, and the cumulative impact of these events is staggering. These incidents are broken into three separate reports:
Gas Distribution (lines that take gas to residents and other consumers),
Gas Transmission & Gathering (collectively bringing gas from well sites to processing facilities and distant markets), and
Hazardous Liquids (including crude oil, refined petroleum products, and natural gas liquids).
Below in Table 1 is a summary of pipeline incident data from 2010 through mid-November of this year. Of note: Some details from recent events are still pending, and are therefore not yet reflected in these reports.
Table 1: Summary of pipeline incidents from 1/1/2010 through 11/14/2018
Report
Incidents
Injuries
Fatalities
Evacuees
Fires
Explosions
Damages ($)
Gas Distribution
934
473
92
18,467
576
226
381,705,567
Gas Transmission & Gathering
1,069
99
24
8,614
121
51
1,107,988,837
Hazardous Liquids
3,509
24
10
2,471
111
14
2,606,014,109
Totals
5,512
596
126
29,552
808
291
4,095,708,513
Based on this data, on average each day in the US 1.7 pipeline incidents are reported (a number in line with our previous analyses), requiring 9 people to be evacuated, and causing almost $1.3 million in property damage. A pipeline catches fire every 4 days and results in an explosion every 11 days. These incidents result in an injury every 5 days, on average, and a fatality every 26 days.
Data shortcomings
While the PHMSA datasets are extremely thorough, they do have some limitations. Unfortunately, in some cases, these limitations tend to minimize our understanding of the true impacts. A notable recent example is a series of explosions and fires on September 13, 2018 in the towns of Lawrence, Andover, and North Andover, in the Merrimack Valley region of Massachusetts. Cumulatively, these incidents resulted in the death of a young man and the injuries to 25 other people. There were 60-80 structure fires, according to early reports, as gas distribution lines became over-pressurized.
The preliminary PHMSA report lists all of these Massachusetts fires as a single event, so it is counted as one fire and one explosion in Table 1. As of the November 14 download of the data, property damage has not been calculated, and is listed as $0. The number of evacuees in the report also stands at zero. This serves as a reminder that analysis of the oil and gas industry can only be as good as the available data, and relying on operators to accurately self-report the full extent of the impacts is a somewhat dubious practice.
This map shows pipeline incidents in the US from 1/1/2010 through 11/14/2018. Source: PHMSA. One record without coordinates was discarded, and 10 records had missing decimal points or negative (-) signs added to the longitude values. A few obvious errors remain, such as a 2012 incident near Winnipeg that should be in Texas, but we are not in a position to guess at the correct latitude and longitude values for each of the 5,512 incidents.
Another recent incident occurred in Center Township, a small community in Beaver County, Pennsylvania near Aliquippa on September 10, 2018. According to the PHMSA Gas Transmission & Gathering report, this incident on the brand new Revolution gathering line caused over $7 million in damage, destroying a house and multiple vehicles, and required 49 people to evacuate. The incident was indicated as a fire, but not an explosion. However, reporting by local media station WPXI quoted this description from a neighbor:
A major explosion, I thought it was a plane crash honestly. My wife and I jumped out of bed and it was just like a light. It looked like daylight. It was a ball of flame like I’ve never seen before.
From the standpoint of the data, this error is not particularly egregious. On the other hand, it does serve to falsely represent the overall safety of the system, at least if we consider explosions to be more hazardous than fires.
Big picture findings
Comparing the three reports against one another, we can see that the majority of incidents (64%) and damages (also 64%) are caused by hazardous liquids pipelines, even though the liquids account for less than 8% of the total mileage of the network. In all of the other categories, however, gas distribution lines account for more than half of the cumulative damage, including injuries (79%), deaths (73%), evacuees (62%), fires (71%), and explosions (78%). This is perhaps due to the vast network (more than 2.2 million miles) of gas distribution mains and service lines, as well as their nature of taking these hazardous products directly into populated areas. Comparatively, transmission and hazardous liquids lines ostensibly attempt to avoid those locations.
Is the age of the pipeline a factor in incidents?
Among the available attributes in the incident datasets is a field indicating the year the pipeline was installed. While this data point is not always completed, there is enough of a sample size to look for trends in the data. We determined the age of the pipe by subtracting the year the pipe was installed from the year of the incident, eliminating nonsensical values that were created when the pipeline age was not provided. In the following section, we will look at two tables for each of the three reports. The first table shows the cause of the failure compared to the average age, and the second breaks down results by the content that the pipe was carrying. We’ll also include a histogram of the pipe age, so we can get a sense of how representative the average age actually is within the sample.
A. Gas distribution
Each table shows some fluctuation in the average age of pipeline incidents depending on other variables, although the variation in the product contained in the pipe (Table 3) are minor, and may be due to relatively small sample sizes in some of the categories. When examining the nature of the failure in relation to the age of the pipe (Table 2), it does make sense that incidents involving corrosion would be more likely to afflict older pipelines, (although again, the number of incidents in this category is relatively small). On average, distribution pipeline incidents occur on pipes that are 33 years old.
When we look at the histogram (Figure 1) for the overall distribution of the age of the pipeline, we see that those in the first bin, representing routes under 10 years of age, are actually the most frequent. In fact, the overall trend, excepting those in the 40 t0 50 year old bin, is that the older the pipeline, the fewer the number of incidents. This may reflect the massive scale of pipeline construction in recent decades, or perhaps pipeline safety protocol has regressed over time.
Age of Pipeline - Histogram
Figure 1. Age of pipeline histogram for gas distribution line incidents between 1/1/2010 and 11/14/2018. Incidents where the age of the pipe is unknown are excluded.
Age/Cause of Incidents - Table 2
Table 2. Average age of pipe and cause for failure in gas distribution line incidents
Cause of Failure
Incidents – Total
Incidents – Pipe Age Known
Avg. Pipe Age
Corrosion Failure
18
15
53
Equipment Failure
47
41
30
Excavation Damage
271
239
32
Incorrect Operation
62
51
34
Material Failure Of Pipe Or Weld
63
56
40
Natural Force Damage
72
61
42
Other Incident Cause
96
53
41
Other Outside Force Damage
305
227
28
Grand Total
934
743
33
Age/Product Transported - Table 3
Table 3. Average age of pipe and material being transported in gas distribution lines
Product
Incidents – Total
Incidents – Pipe Age Known
Ave. Pipe Age
Natural Gas
862
706
34
Other Gas
3
Propane Gas
11
7
25
Synthetic Gas
1
1
38
(Blank)
57
29
27
Grand Total
934
743
33
B. Gas Transmission & Gathering
Transmission & Gathering line incidents occur on pipelines routes that are, on average, five years older than their distribution counterparts. Corrosion, natural force damage, and material failures on pipes and welds occur on pipelines with an average age above the overall mean, while excavation and “other outside force” incidents tend to occur on newer pipes (Table 4). The latter category would include things like being struck by vehicles, damaged in wildfires, or vandalism. The contents of the pipe does not seem to have any significant correlation with the age of the pipe when we take sample size into consideration (Table 5).
The histogram (Figure 2) for the age of pipes on transmission & gathering line incidents below shows a more normal distribution, with the noticeable exception of the first bin (0 to 10 years old) ranking second in frequency to the fifth bin (40 to 50 years old).
It is worth mentioning that, “PHMSA estimates that only about 5% of gas gathering pipelines are currently subject to PHMSA pipeline safety regulations.” My correspondence with the agency verified that the remainder is not factored into their pipeline mileage or incident reports in any fashion. Therefore, we should not consider the PHMSA data to completely represent the extent of the gathering line network or incidents that occur on those routes.
Age of Pipeline - Histogram
Figure 2. Age of pipeline histogram for transmission & gathering line incidents between 1/1/2010 and 11/14/2018. Incidents where the age of the pipe is unknown are excluded.
Age/Cause of Incidents - Table 4
Table 4. Average age of pipe and cause for failure in gas transmission & gathering line incidents
Cause of Failure
Incidents – Total
Incidents – Pipe Age Known
Ave. Pipe Age
Corrosion Failure
220
212
46
Equipment Failure
327
271
25
Excavation Damage
135
126
52
Incorrect Operation
59
52
26
Material Failure Of Pipe Or Weld
122
119
51
Natural Force Damage
82
76
32
Other Incident Cause
60
46
30
Other Outside Force Damage
64
52
40
Grand Total
1069
954
38
Age/Material Transported - Table 5
Table 5. Average age of pipe and material being transported in gas transmission & gathering lines
Product
Incidents – Total
Incidents – Pipe Age Known
Ave. Pipe Age
Hydrogen Gas
1
1
0
Landfill Gas
1
1
17
Natural Gas
1024
916
38
Other Gas
9
7
33
(Blank)
34
29
38
Grand Total
1069
954
38
C. Hazardous Liquids
The average incident on hazardous liquid lines occurs on pipelines that are 27 years old, which is 6 years younger than for distribution incidents, and 11 years younger than their transmission & gathering counterparts. This appears to be heavily skewed by the equipment failure and incorrect operation categories, both of which occur on pipes averaging 15 years old, and both with substantial numbers of incidents. On the other hand, excavation damage, corrosion, and material/weld failures tend to occur on pipes that are at least 40 years old (Table 6).
In terms of content, pipelines carrying carbon dioxide happen on pipes that average just 11 years old, although there are not enough of these incidents to account for the overall departure from the other two datasets (Table 7).
The overall shape of the histogram (Figure 3) is similar to that of transmission & gathering line incidents, except that the first bin (0 to 10 years old) is by far the most frequent, with more than 3 and a half times as many incidents as the next closest bin (4o to 50 years old). Operators of new hazardous liquid routes are failing at an alarming rate. In descending order, these incidents are blamed on equipment failure (61%), incorrect operation (21%), and corrosion (7%), followed by smaller amounts in other categories. The data indicate that pipelines installed in previous decades were not subject to this degree of failure.
Age of Pipeline - Histogram
Figure 3. Age of pipeline histogram for hazardous liquid line incidents between 1/1/2010 and 11/14/2018. Incidents where the age of the pipe is unknown are excluded.
Age/Cause of Incidents - Table 6
Table 6. Average age of pipe and cause for failure in hazardous liquid line incidents
Cause of Failure
Incidents – Total
Incidents – Pipe Age Known
Avg. Pipe Age
Corrosion Failure
711
465
42
Equipment Failure
1589
879
15
Excavation Damage
126
102
46
Incorrect Operation
500
287
15
Material Failure Of Pipe Or Weld
249
207
41
Natural Force Damage
156
100
29
Other Incident Cause
108
63
33
Other Outside Force Damage
70
53
39
Grand Total
3509
2156
27
Age/Material Transported - Table 7
Table 7. Average age of pipe and material being transported in hazardous liquid lines
Product
Incidents – Total
Incidents – Pipe Age Known
Avg. Pipe Age
Biofuel / Ethanol Blends
4
2
30
CO2 (Carbon Dioxide)
50
40
11
Crude Oil
1764
1090
25
Highly Volatile Liquids*
546
383
23
Refined Petroleum Product
1145
641
32
Grand Total
3509
2156
27
* Highly volatile liquids are transported as liquids but would revert to a gaseous state in ambient conditions, including natural gas liquids like ethane, propane, and butane.
Conclusions
When evaluating quotes, like those listed above, that portray pipelines as a safe way of transporting hydrocarbons, it’s worth taking a closer look at what they are saying.
Are pipelines the safest way of transporting our nation’s energy products? This presupposes that our energy must be met with liquid or gaseous fossil fuels. Certainly, crude shipments by rail and other modes of transport are also concerning, but movements of solar panels and wind turbines are far less risky.
Does the industry have the “strong safety record” that PHMSA proclaims? Here, we have to grapple with the fact that the word “safety” is inherently subjective, and the agency’s own data could certainly argue that the industry is falling short of reasonable safety benchmarks.
And what about the claim that barrels of oil or petroleum products reach their destination “99.999% of the time? First, it’s worth noting that this claim excludes gas pipelines, which account for 92% of the pipelines, even before considering that PHMSA only has records on about 5% of gas gathering lines in their pipeline mileage calculations. But more to the point, while a 99.999% success rate sounds fantastic, in this context, it isn’t good enough, as this means that one barrel in every 100,000 will spill.
For example, the Dakota Access Pipeline has a daily capacity of 470,000 barrels per day (bpd). In an average year, we can expect 1,715 barrels (72,030 gallons) to fail to reach its destination, and indeed, there are numerous spills reported in the course of routine operation on the route. The 590,000 bpd Keystone pipeline leaked 9,700 barrels (407,400 gallons) late last year in South Dakota, or what we might expect from four and a half years of normal operation, given the o.001% failure rate. In all, PHMSA’s hazardous liquid report lists 712,763 barrels (29.9 million gallons) were unintentionally released, while an additional 328,074 barrels (13.8 million gallons) were intentionally released in this time period. Of this, 284,887 barrels (12 million gallons) were recovered, meaning 755,950 barrels (31.7 million gallons) were not.
Beyond that, we must wonder whether the recent spate of pipeline incidents in new routes is a trend that can be corrected. Between the three reports, 1,283 out of the 3,853 (32%) incidents occurred in pipelines that were 10 years old or younger (where the year the pipeline’s age is known). A large number of these incidents are unforced errors, due to poor quality equipment or operator error.
One wonders why regulators are allowing such shoddy workmanship to repeatedly occur on their watch.
By Matt Kelso, Manager of Data and Technology, FracTracker Alliance
Reflecting back on the Community Sentinel award reception, held on November 26th, I can’t help but be in awe of the raw grit and determination that filled the room. It was a cold, blustery day in Pittsburgh – and yet the hall felt warm from the passion each of the Community Sentinels awardees exuded. FracTracker Alliance and our many award sponsors and partners were so very proud to award Nalleli Cobo of California, Rebecca Roter and Ellen Gerhart of Pennsylvania, and Natasha Léger of Colorado with the 2018 Community Sentinel Award for Environmental Stewardship. (On a more personal note… This is the first year that all of the recipients have been women. Kudos!)
The Program on November 26th
As I nervously re-checked the AV equipment for the presentations to be led by our emcee from Rootskeeper, David Braun, attendees spent time networking and getting to know the awardees. We met people from all walks of life – each of them concerned about the negative impacts the oil and gas industry.
Rebekah Sale, of the Property Rights and Pipeline Center, kicked off the event with introductions, followed by David Braun to set the stage. Lauren Davis, of The 11th Hour Project, then graciously gave the keynote address. During her formative years as a funder, Lauren met many frontline communities – from the people facing the impacts of oil and gas development in their backyards to volunteers responding to the Deepwater Horizon oil spill along the Gulf. Working with these early community sentinels served as a critical juncture in her career. Lauren thanked them for the many lessons they taught her about perseverance, patience, and integrity.
Each year during the Community Sentinel Awards program we honor activists who valiantly fought against the harms of dirty energy but passed away in the past year in a presentation called “Legacy of Heroes.” During this year’s program we celebrated the lives and passions of Ben Stout of West Virginia, Ray Beiersdorfer of Ohio, and Carol Zagrocki of Pennsylvania. On behalf of all of the award partners and sponsors, a heartfelt thank you goes out to these incredible advocates who are truly leaving behind a Legacy of Heroes. Learn more about their inspiring work below.
And last but not least, the four recipients of the 2018 Community Sentinel award were presented with their awards.
David Braun introduced Nalleli Cobo, who became an activist at a young age after experiencing severe health impacts from nearby urban drilling. Nalleli has been a critical voice in the movement to end oil drilling in Los Angeles’ neighborhoods. Veronica Coptis of Center for Coalfield Justice presented the award to Ellen Gerhart, a renowned but reluctant activist in Pennsylvania. She has fearlessly stood in the way of Sunoco/Energy Transfer Partners for the past few years in order to protect her family’s home from the Mariner East pipelines. Matt Mehalik of the Breathe Project then introduced Natasha Léger. Natasha, a steadfast and eloquent lawyer by training, is currently leading a team of dedicated people in protecting the North Fork Valley of Delta County Colorado from irresponsible oil and gas development and fracking. Raina Rippel of the Southwest Pennsylvania Environmental Health Project then presented the final award to Rebecca Roter. Rebecca, who moved out of PA to escape the health effects of oil and gas development near her home, still works tirelessly to protect communities from fracking’s impacts through strategic advocacy and on-the-ground research.
On behalf of all those who benefit from your resolute endeavors – Thank You, Dear Sentinels.
Check out the Community Sentinels in action | Reception slideshow
At age nine, Nalleli Cobo unknowingly engaged in community activism. Her journey began when she noticed she was often ill. Her frequent headaches, stomach pains, nosebleeds, and body spasms worsened to asthma and heart palpitations. Soon after, Nalleli learned others in her community were also having similar problems. Nalleli lived in an apartment complex in South L.A. across from AllenCo’s oil drilling operations. Terrible odors would take over her community every day. After calling regulatory agencies, Nalleli noticed the smells from the oil well only getting worse. Nalleli and her neighbors took action – creating a grassroots campaign called People Not Pozos (Wells). Through grassroots activism, Nalleli strengthened her community’s voice by fighting the oil company poisoning her neighborhood. After a hard fight, AllenCo temporarily closed in November 2013. Her community is fighting to close it permanently.
Nalleli is a member of the South Los Angeles Youth Leadership Coalition. This group, along with Communities for a Better Environment Youth from Wilmington, sued the City of Los Angeles for environmental racism and violation of CEQA. Nalleli is a member of STAND LA (Stand Together Against Neighborhood Drilling – Los Angeles). STAND LA works tirelessly to establish a 2500-ft buffer between oil extraction, homes, and sensitive land.
Ellen Gerhart
Being an activist was not on Ellen Gerhart’s bucket list for retirement. She was born 63 years ago in Monaca, PA, a small steel mill town near Pittsburgh. She attended Penn State University, where she received a BS in linguistics, teaching certification in deaf-ed, English as a 2nd language, and biology and general science. Ellen also met her husband Stephen there. They bought a house in Huntingdon County, where they raised two daughters, Lyra and Elise. After 28 years of teaching, Ellen retired. That same year, 2015, the fight against the Energy Transfer Partners (ETP) Mariner East 2 pipeline began.
In the three years since, Ellen has had three acres of woodlands and wetlands seized through eminent domain; helped establish a resistance camp and aerial blockade known as Camp White Pine; supported tree sits on her property; been heavily surveilled, threatened, and harassed; and arrested 3 times (released from a 2-6 month jail sentence on September 26, 2018). She most recently attended an ETP unit holders meeting in Dallas, TX where she and other activists confronted CEO Kelcy Warren.
Rebecca Roter
Rebecca Roter grew up in West Philadelphia. Her parents’ involvement in the civil rights and anti-war movements instilled values of standing witness and speaking truth to power. In 1986, when she moved to Susquehanna County, she had no clue the Marcellus Shale under her feet would spur her advocacy for public health. After the first test well was drilled in the county in 2006, she organized an EPA citizen Marcellus listening session, spearheaded a grassroots community billboard campaign, gave guided tours and interviews to national and international media, facilitated the Duke University NEPA ground water studies, and worked with Clean Air Council – winning PA DEP public hearings for compressors. She networked at every turn with federal and state agencies advocating for scientific research, fact-driven discussion, and public health
In 2013, Rebecca co-founded the grassroots group Breathe Easy Susquehanna County (BESC) striving to unify a community long divided over natural gas, air quality, and public health. BESC arranged local radio interviews with health care professionals about air pollution, natural gas infrastructure and public health; collaborated with Public Lab to design a Community Formaldehyde Monitoring project; collected citizen science formaldehyde data used in a peer reviewed article; and has a seat on an academic stakeholder advisory board. BESC partnered with researchers from University of London for a citizen science air study generating seven months of continuous PM2.5 data county wide. Data near the Williams Central Compressor was shared with federal and state health agencies.
EPA follow up testing was used for an ATSDR Health Consultation. Two days after this consultation was publicly released , PA DEP announced plans for Air Quality Stations in shale counties. As of 10.25.18 , the continuous PM2.5 PA DEP monitoring station was operational in Susquehanna County; a victory for public health brought home by citizen science.
Natasha Léger
Natasha Léger is the Executive Director (Interim) of Citizens For A Healthy Community (CHC). CHC is a grassroots nonprofit dedicated to protecting air, water and foodsheds in the Delta County region of Southwest Colorado from the impacts of oil and gas development. Before stepping in as Interim ED, Natasha served on the board. She brings to CHC legal, location, ecosystem, and industry analysis experience. Natasha is an international trade attorney, turned independent business consultant, turned editor of a location intelligence magazine, turned author of Travel Healthy: A Road Warrior’s Guide to Eating Healthy. She believes clean air, water, soils, and nouri (a word to describe what we should be eating for optimum health) are a basic human right.
Under her leadership, CHC has developed new strategic partnerships with state, regional, and national impacted citizens groups and environmental and conservation groups, and developed tools for empowering the community to respond to threats from oil and gas activity in the North Fork Valley. She championed the ground breaking community cost-benefit analysis of a proposed natural gas project, and contributed to the first food-shale production map to highlight the risks to our food supply of overlapping oil and gas activity with farms. She also exposed the regulatory black hole around rural gas-gathering pipelines. Her work in empowering the community has led to withdrawal of projects and leasing proposals that threaten the community, and an unprecedented number of public comments and widespread opposition to oil and gas development in the North Fork Valley, which serves a unique role in Colorado’s food supply, recreation economy, and biodiversity.
Legacy of Heroes Presentation
Use the slideshow controls on the right to learn about the dedication of Ben, Ray, and Carol.
In the fleeting passage of days, FracTracker enjoyed a long history with Dr. Ben Stout. The infamous biology professor at Wheeling Jesuit University served on the FracTracker board since the inception of the organization in 2012. Brook Lenker, FracTracker executive director reflects: “While we didn’t get to spend as much time with him as we would have liked, each reunion was a pleasure, a reconnection with an old friend.”
Ben was wily and wiry, casual and confident. He exuded a passion for protecting people and nature from industry run amok. As a scientist and educator, he was thorough and curious, yet always bold and engaged; he genuinely cared about the Appalachian communities he knew so well. The Intelligencer in Wheeling noted how he was viewed as an environmental hero. He was too humble to accept such a label, but his revelatory research and staunch advocacy warrant the honor.
On August 3rd, at age 60, Ben died from recurring cancer. Even heroes can’t live forever, but this one’s legacy won’t soon fade away. Ben Stout’s work lives on as an inspiration to so many other people.
Ray Beiersdorfer of Ohio
Ray Beiersdorfer was a renowned professor at Youngstown State University who didn’t let his work stop at the walls of academia. His series of public lectures on Energy and the Environment were an example of that effort. He recruited top notch speakers explaining the technical, legal, social, economic, and environmental issues associated with energy production in a way that non-technical attendees could understand. He also gave countless lectures in person and virtually to lay audiences all over.
As Dr. Weatherington-Rice wrote in giving us her thoughts on Ray: “I agree that Ray and Ben Stout are huge losses this year. We simply are not making scientists of their caliber fast enough to replace their loss to the scientific community and to the greater community of this region. They leave huge holes in the fabric of our universe.”
Ray was an elegant and engaging presenter of the data that speaks to the myriad issues associated with quakes resulting from the injection of hydraulic fracturing waste into Class II injection wells. Such a complex issue is not the easiest topic to explain or make palatable to the general public, but he did it with ease. Ray passed away this year from complications of a heart attack.
Carol Zagrocki of Pennsylvania
Carol Zagrocki was dedicated to many environmental projects, and her passion shown in every aspect of her work. Her grants on behalf of the Colcom Foundation supported so many worthy causes – from watershed monitoring and grassroots organizing, to conservation groups and critical research at universities like Carnegie Mellon, Duquesne, and Wheeling Jesuit.
Her husband Rege writes: “Thank you for this honor being bestowed on Carol. She truly loved working with all her grantees. She took great pride in their accomplishments, and it did not matter to her if it was a one-person operation or a national organization, she was at her happiest when the grants got approved by her board.”
On a Saturday morning after breakfast, Carol died suddenly in her home of a heart attack – a condition that runs in her family. She went quickly and hopefully without pain. Carol’s passing was recognized by a humbling assortment of organizations, such as The National Aviary and Carnegie Library. The Pittsburgh Botanical Gardens will soon have a garden dedicated in her honor, as well.
Sponsors and Partners
The Sentinels’ program and reception requires financial support – for monetary awards, awardee travel, and many other costs. As such, each year we call upon dedicated sponsors and partners to provide resources to enable this endeavor to continue. The often-thankless jobs that community sentinels do each day in protecting our health and the environment deserve no less.
Thank you to our incredible 2018 award sponsors: The 11th Hour Project, The Heinz Endowments, The Foundation for Pennsylvania Watersheds and a generous anonymous donor. We could not do this work without your support.
And a big thank you to our partners in presenting the award: Allegheny-Blue Ridge Alliance, Breathe Project, Center for Coalfield Justice, Crude Accountability, Earthworks, Food and Water Watch, Halt the Harm Network, Ohio Valley Environmental Coalition, Property Rights and Pipeline Center, Save the Hills Alliance, Sierra Club, Southwest Pennsylvania Environmental Health Project, and Viable Industries.
Nominees
This year, 23 people were nominated by their peers to receive this distinguished award (listed below).
Richard Averitt – Nellysford, VA
Odessa, Gunner, Kylan, and Nels Bjornson – Scenery Hill, PA
Mark Borchardt – Marshfield, NY
Shelley Brock – Eagle, ID
Genevieve Butler – Freetown, LA
John Childe – Dauphin, PA
Malinda Clatterbuck – Holtwood, PA
Nalleli Cobo – San Gabriel, CA*
Torch Can Do – Coolville, OH
Karen Feridun – Kutztown, PA
Friends of Buckingham – Buckingham, VA
Ellen Gerhart – Huntington, PA*
Bill Huston – Dimock, PA
April Keating – Buckhannon, WV
Natasha Léger – Paonia, CO*
Megan Mcdonough – Elizabeth, PA
Janice Milburn – Ligonier, PA
Misha Mitchell – Plaquemine, LA
Anne Rolfes – New Orleans, LA
Rebecca Roter – Montrose, PA and Nicholson, GA*
Douglas Shields – Pittsburgh, PA
Diane Sipe – Evans City, PA
Joe Spease – Overland Park, KS
* Denotes 2018 award recipient
Judges
Many thanks to the following judges for donating their time to review all of the nominations.
Jill Hunkler – Activist, Ohio
Raina Rippel – Southwest Pennsylvania Environmental Health Project
Dan Shaffer – Allegheny-Blue Ridge Alliance and Dominion Pipeline Monitoring Coalition
Elena Sorokina – Crude Accountability
Dan Xie – Student PIRGs (Public Interest Research Groups)
Never has the saying “adding fuel to the fire” been so literal.
California wildfires have been growing at unheard of rates over the last five years, causing record breaking destruction and loss of life. Now that we’ve had a little rain and perhaps a reprieve from this nightmare wildfire season, it is important to consider the factors influencing the risk and severity of fires across the state.
Oil and gas extraction and consumption are major contributors to climate change, the underlying factor in the recent frequent and intense wildfires. A lesser-known fact, however, is that many wildfires have actually burned in oil fields in California – a dangerous circumstance that also accelerates greenhouse gas emissions. Our analysis shows where this situation has occurred, as well as the oil fields most likely to be burned in the future.
First, we looked at where wildfires are currently burning across the state, shown below in Map 1. This map is from CAL FIRE and is continuously updated.
Map 1. The CAL FIRE 2018 Statewide Incidents Map
CAL FIRE map showing the locations and perimeters of California wildfires
California’s recent fire seasons
The two largest wildfires in California recorded history occurred last year. The Mendocino Complex Fire burned almost a half million acres (1,857 square kilometers) in Mendocino National Forest. The Thomas Fire in the southern California counties of Ventura and Santa Barbara burned nearly 282,000 acres (1,140 square kilometers). A brutal 2017 fire season, however is now overshadowed by the ravages of 2018’s fires.
With the effects of climate change increasing the severity of California’s multi-year drought, each fire season seems to get worse. The Woolsey Fire in Southern California caused a record amount of property damage in the hills of Santa Monica and Ventura County. The Camp Fire in the historical mining town of Paradise resulted in a death toll that, as of early December, has more than tripled any other wildfire. And many people are still missing.
The Thomas Fire
A most precarious situation erupts when a wildfire spreads to an oil field. Besides having a surplus of their super flammable namesake liquid, oil fields are also storage sites for various other hazardous and volatile chemicals. The Thomas Fire was such a scenario.
The Thomas fire burned through the steep foothills of the coastal Los Padres mountains into the oil fields. When in the oil fields, the oil pumped to the surface for production and the stores of flammable chemicals provided explosive fuel to the wildfire. While firefighters were able to get the majority of the fire “contained,” the oil fields were too dangerous to access. According to the community, oil fires remained burning for weeks before they were able to be extinguished.
The Ventura office of the Division of Oil Gas and Geothermal Resources (DOGGR) reported that the Thomas Fire burned through the Taylor Ranch oil fields and a half dozen other oil fields including the Ventura, San Miguelito, Rincon, Ojai, Timbe Canyon, Newhall-Portrero, Honor Rancho and Wayside Canyon. DOGGR Ventura officials said Newhall-Potrero was “half burned over.” Thomas also burned within a 1/3 mile of the Sespe oil field. Schools and other institutions closed down throughout the Los Angeles Basin, but DOGGR said there was no impact on oil and gas operations that far south. The fire spurred an evacuation of the Las Flores Canyon Exxon oil storage facility but thankfully was contained before reaching the facility.
The Thomas Fire was not the first time or the last time an oil field burned in a California wildfire. Map 2 above shows state wildfires from the last 20 years overlaid with maps of California oil fields, oil wells, and high threat wildfire zones. The map shows just the oil fields and oil and gas wells in California that have been burned by a wildfire.
We found that 160 of California’s 517 oil fields (31%) have been burned by encroaching wildfires, affecting more than 10,000 oil and gas well heads.
An ominous finding: the state’s highest threat zones for wildfires are located close to and within oil and gas fields.
The map shows that wildfire risk is greatest in Southern California in Ventura and Los Angeles counties due to the arid environment and high population density. Over half the oil fields that have burned in California are in this small region.
Who is at fault?
Reports show that climate change has become the greatest factor in creating the types of conditions conducive to uncontrollable wildfires in California. Climate scientists explain that climate change has altered the natural path of the Pacific jet stream, the high-altitude winds that bring precipitation from the South Pacific to North America.
In a recent study, researchers from the University of Idaho and Columbia University found that the impact of global warming is growing exponentially. Their analysis shows that since 2000, human-caused climate change prompted 75% more aridity — causing peak fire season to expand every year by an average of nine days. The Fourth National Climate Assessment details the relationship between climate change and wildfire prevalence, and comes to the same conclusion: impacts are increasing.
On the cause of wildfires, the report explains:
Compound extremes can include simultaneous heat and drought such as during the 2011–2017 California drought, when 2014, 2015, and 2016 were also the warmest years on record for the state; conditions conducive to the very large wildfires, that have already increased in frequency across the western United States and Alaska since the 1980s.
Both 2017 and 2018 have continued the trend of warmest years on record, and so California’s drought has only gotten worse. The report goes on to discuss the threat climate change poses to the degradation of utilities’ infrastructure. Stress from climate change-induced heat and drought will require more resources dedicated to maintaining utility infrastructure.
The role of public utilities
The timing of this report could not be more ironic considering the role that utilities have played in starting wildfires in California. Incidents such as transformer explosions and the degradation of power line infrastructure have been implicated as the causes of multiple recent wildfires, including the Thomas Fire and the most recent Woolsey and Camp wildfires – three of the most devastating wildfires in state history. As public traded corporations, these utilities have investors that profit from their contribution to climate change which, in turn, has created the current conditions that allow these massive wildfires to spread. On the other hand, utilities in California may be the least reliant on fossil fuels. Southern California Edison allows customers to pay a surcharge for 100% renewable service, and Pacific Gas and Electric sources just 20% of their electricity from natural gas.
The CPUC is one of the government agencies tasked with ensuring that investor-owned utilities operate a safe and reliable grid… An essential component of providing safe electrical service is the financial wherewithal to carry out safety measures.
Along with regulation and oversight, part of the agency’s work involves ensuring utilities are financially solvent enough to carry out safety measures.
Conclusion
January 1, 2019 will mark the seventh year of drought in California. Each fall brings anxiety and dread for state residents, particularly those that live in the driest, most arid forests and chaparral zones. Data show that the wildfires continue to increase in terms of intensity and frequency as the state goes deeper into drought induced by climate change.
While California firefighters have been incredibly resourceful, over 70% of California forest land is managed by the federal government whose 2019 USDA Forest Service budget reduces overall funding for the National Forest System by more than $170 million. Moving forward, more resources must be invested in supporting the health of forests to prevent fires with an ecological approach, rather than the current strategy which has focused predominantly on the unsustainable practice of fuel reduction and the risky tactics of “fire borrowing”. And of course, the most important piece of the puzzle will be addressing climate change.
By Kyle Ferrar, Western Program Coordinator, FracTracker Alliance
Feature image by Marcus Yam, LA Times
https://www.fractracker.org/a5ej20sjfwe/wp-content/uploads/2018/11/ThomasFire_MarcusYam_LATimes_re.jpg400900Kyle Ferrar, MPHhttps://www.fractracker.org/a5ej20sjfwe/wp-content/uploads/2021/04/2021-FracTracker-logo-horizontal.pngKyle Ferrar, MPH2018-12-04 13:32:592021-04-15 14:57:06California’s Oil Fields Add Fuel to the Fire
In 2012, a battle between Ohio, West Virginia, and Pennsylvania was underway. Politicians and businesses from each state were eagerly campaigning for the opportunity to host Royal Dutch Shell’s “world-class” petrochemical facility. The facility in question was an ethane cracker, the first of its kind to be built outside of the Gulf Coast in 20 years. In the end, Pennsylvania’s record-breaking tax incentive package won Shell over, and construction on the ethane cracker plant began in 2017.
Once completed, the ethane cracker will convert ethane from fracked wells into 1.6 million tons of polyethylene plastic pellets per year.
Shell’s ethane cracker, under construction in Beaver County, PA. Image by Ted Auch, FracTracker.
Aerial support provided by LightHawk.
Ohio and West Virginia, however, have not been left out of the petrochemical game. In addition to the NGL pipelines, cryogenic plants, and fractionation facilities in these states, plans for ethane cracker projects are also in the works.
In 2017, PTT Global Chemical (PTTGC) put Ohio in second place in the “race to build an ethane cracker,” when it decided to build a plant in Belmont County, Ohio.
But first, why is the petrochemical industry expanding in the Ohio River Valley?
Fracking has opened up huge volumes of natural gas in the Marcellus and Utica shales in Pennsylvania, Ohio, and West Virginia. Fracked wells in these states extract methane, which is then transported in pipelines and used as a residential, industrial, or commercial energy source. The gas in this region, however, contains more than just methane. Classified as “wet gas,” the natural gas stream from regional wells also contains natural gas liquids (NGLs). These NGLs include propane, ethane, and butane, and industry is eager to create a market for them.
Plastic pellets, also called “nurdles,” the end product of ethane crackers.
Major processing facilities, such as cryogenic and fractionation plants, receive natural gas streams and separate the NGLs, such as ethane, from the methane. After ethane is separated, it can be “cracked” into ethylene, and converted to polyethylene, the most common type of plastic. The plastic is shipped in pellet form to manufacturers in the U.S. and abroad, where it is made into a variety of plastic products.
By building ethane crackers in the Ohio River Valley, industry is taking advantage of the region’s vast underground resources.
PTTGC ethane cracker: The facts
PTTGC’s website states that the company “is Thailand’s largest and Asia’s leading integrated petrochemical and refining company.” While this ethane cracker has been years in the making, the company states that “a final investment decision has not been made.” The image below shows land that PTTGC has purchased for the plant, totaling roughly 500 acres, in Dilles Bottom, Mead Township.
According to the Ohio EPA, the plant will turn ethylene into:
700,000 tons of high density polyethylene (HDPE) per year
900,000 tons Linear low-density polyethylene (LLDPE)
HDPE is a common type of plastic, used in many products such as bags, bottles, or crates. Look for it on containers with a “2” in the recycling triangle. LLDPE is another common type of plastic that’s weaker and more flexible; it’s marked with a “4.”
The ethane cracker complex will contain:
An ethylene plant
Four ethylene-based derivatives plants.
Six 552 MMBtu/hour cracking furnaces fueled by natural gas and tail gas with ethane backup
Three 400 MMBTU/hr steam boilers fueled by natural gas and ethane
A primary and backup 6.2 MMBtu/hour thermal oxidizer
A high pressure ground flare (1.8 MMBtu/hour)
A low pressure ground flare (0.78 MMBtu/hour)
Wastewater treatment systems
Equipment to capture fugitive emissions
Railcars for pygas (liquid product) and HDPE and LLDPE pellets
Emergency firewater pumps
Emergency diesel-fired generator engines
A cooling tower
Impacts on air quality
The plant received water permits last year, and air permits are currently under review. On November 29, 2018, the Ohio EPA held an information session and hearing for a draft air permit (the permit can be viewed here, by entering permit number P0124972).
The plant will be built in the community of Dilles Bottom, on the former property of FirstEnergy’s R.E. Burger Power Station, a coal power plant that shut down in 2011. The site was demolished in 2016 in preparation for PTTGC’s ethane cracker. In 2018, PTTGC also purchased property from Ohio-West Virginia Excavating Company. In total, the ethane cracker will occupy 500 acres.
R.E. Burger Power Station, which has been demolished for the PTTGC Ethane Cracker. Image Source
Table 1, below, is a comparison of the previous major source of air pollution source, the R.E. Burger Power Station, and predictions of the future emissions from the PTTGC ethane cracker. The far right column shows what percent of the former emissions the ethane cracker will release.
Table 1: Former and Future Air Emissions in Dilles Bottom, Ohio
Pollutant
R.E.Burger Power Station (2010 emissions, tons per year)
PTTGC Ethane Cracker (predicted emissions, tons per year)
Percent of former emissions
CO (carbon monoxide)
143.33
544
379.5%
NOx (nitrogen oxides)
1861.2
164
8.81%
SO2 (sulfur dioxide)
12719
23
0.18%
PM10 (particulate matter, 10)
179.25
89
49.65%
PM2.5 (particulate matter, 2.5)
77.62
86
110.8%
VOCs (volatile organic compounds)
0.15
396
264000%
As you can see, the ethane cracker will emit substantially less sulfur dioxide and nitrogen dioxides compared with the R.E. Burger site. This makes sense, as these two pollutants are associated with burning coal. On the flip side, the ethane cracker will emit almost four times as much carbon monoxide and 263,900% more volatile organic compounds (percentages bolded in Table 1, above).
In addition to these pollutants, the ethane cracker will emit 38 tons per year of Hazardous Air Pollutants (HAPS), a group of pollutants that includes benzene, chlorine, and ethyl chloride. These pollutants are characterized by the EPA as being “known or suspected to cause cancer or other serious health effects, such as reproductive effects or birth defects, or adverse environmental effects.”
Finally, the ethane cracker is predicted to emit 1,785,043 tons per year of greenhouse gasses. In the wake of recent warnings on the urgent need to limit greenhouse gas emissions from the Intergovernmental Panel on Climate Change and National Climate Assessment, this prediction is highly concerning.
While these emission numbers seem high, they still meet federal requirements and nearly all state guidelines. If the ethane cracker becomes operational, pollutant monitoring will be important to ensure the plant is in compliance and how emissions impact air quality. The plant will also attract more development to an already heavily industrialized area; brine trucks, trains, pipelines, fracked wells, compressor stations, cryogenic facilities, and natural gas liquid storage are all part of the ethane-to-plastic manufacturing process. The plastics coming from the plant will travel to facilities in the U.S. and abroad to create different plastic products. These facilities are an additional source of emissions.
Air permitting does not consider the full life cycle of the plant, from construction of the plant to its demolition, or the development associated with it.
As such, this plant will be major step back for local air quality, erasing recent improvements in the Wheeling metropolitan area, historically listed as one of the most polluted metropolitan areas in the country. Furthermore, the pollutants that will be increasing the most are associated with serious health effects. Over short term exposure, high levels of VOCs are associated with headaches and respiratory symptoms, and over long term exposure, cancer, liver and kidney damage.
Emergency preparedness
In addition to air quality impacts, ethane cracker plants also pose risks from fires, explosions, and other types of unplanned accidents. In 2013, a ruptured boiler at an ethane cracker in Louisiana caused an explosion that sent 30,000 lbs. of flammable hydrocarbons into the air. Three hundred workers evacuated, but sadly there were 167 suffered injuries and 2 deaths.
While researching Shell’s ethane cracker in Beaver County, FracTracker worked with the Emergency Operations Center (EOC) in St. Charles Parish, Louisiana, to learn about emergency planning around the petrochemical industry. Emergency planners map out two and five mile zones around facilities, called emergency planning zones, and identify vulnerabilities and emergency responders within them.
With this in mind, the map below shows a two and five-mile radius around PTTGC’s property, as reported by Belmont County Auditor. Within these emergency planning zones are the locations of schools, day cares, hospitals, fire stations, emergency medical services, hospitals, and local law enforcement offices, reported by Homeland Infrastructure Foundation Level Data.
The map also includes census data from the EPA that identifies potential environmental justice concerns. By clicking on the census block groups, you will see demographic information, such as income status, age, and education level. These data are important in recognizing populations that may already be disproportionately burdened by or more vulnerable to environmental hazards.
Finally, the map displays environmental data, also from the EPA, including a visualization of particulate matter along the Ohio River Valley, where massive petrochemical development is occurring. By clicking on a census block and then the arrow at the top, you will find a number of other statistics on local environmental concerns.
Emergency planning zones for Shell’s ethane cracker are available here.
Within the 5 mile emergency planning zone, there are:
9 fire or EMS stations
17 schools and/or day cares
1 hospital
6 local law enforcement offices
Within the 2 mile emergency planning zone, there are:
3 fire or EMS stations
7 schools and/or day cares
No hospitals
3 local law enforcement offices
Sites of capacity, such as the fire and EMS stations, could provide emergency support in the case of an accident. Sites of vulnerability, such as the many schools and day cares, should be aware of and prepared to respond to the various physical and chemical risks associated with ethane crackers.
The census block where the ethane cracker is planned has a population of 1,252. Of this population, 359 are 65 years or older. That is well above national average and important to note; air pollutants released from the plant are associated with health effects such as cardiovascular and respiratory disease, to which older populations are more vulnerable.
Conclusion
PTTGC’s ethane cracker, if built, will drastically alter the air quality of Belmont County, OH, and the adjacent Marshall County, WV. Everyday, the thousands of people in the surrounding region, including the students of over a dozen schools, will breathe in its emissions.
This population is also vulnerable to unpredictable accidents and explosions that are a risk when manufacturing products from ethane, a highly flammable liquid. Many of these concerns were recently voiced by local residents at the air permit hearing.
Despite these concerns and pushback, PTTGC’s website for this ethane cracker, pttgcbelmontcountyoh.com, does not address emergency plans for the area. It also fails to acknowledge the potential for any adverse environmental impacts associated with the plant or the pipelines, fracked wells, and train and truck traffic it will attract to the region.
With this in mind, we call upon PTTGC to acknowledge the risks of its facility to Belmont County and provide the public with emergency preparedness plans, before the permitting process continues.
If you have thoughts or concerns regarding PTTGC’s ethane cracker and its impact on air quality, the Ohio EPA is accepting written comments through December 11, 2018. We encourage you to look through the data on this map or conduct your own investigations and submit comments on air permit #P0124972.
How the frac sand industry is circumventing local control, plus where the industry is migrating
What is nonmetallic mineral mining?
It was more than a year and half ago that anti-frac sand organizer – and movement matriarch – Pat Popple published a white paper by attorney Elizabeth Feil in her Frac Sand Sentinel newsletter. The paper outlined potential impacts of something the Wisconsin Department of Natural Resources (DNR) calls the “Marketable Nonmetallic Mineral Deposit Registration” (MNMDR) program.
The program, passed in 2000, is outlined in Wisconsin’s administrative code under Subchapter VI “Registration of Marketable Nonmetallic Mineral Deposits (NR 135.53-NR 135.64). This program allows landowners to register parcels that sit atop marketable nonmetallic mineral deposits, such as frac sand, according to a licensed professional geologist. The geologist uses “logs or records of drilling, boring, geophysical surveys, records of physical inspections of outcrops or equivalent scientific data” to outline the quality, extent, depth, accessibility, and current market value of the minerals.
If a mine operator is not the landowner, it must first coordinate registration with the landowner to:
… provide protection against present or future land uses, such as the erection of permanent structures, that would impede their development…to promote more orderly future development of identified nonmetallic mineral resources and minimize conflict among land uses.
Photos by Ted Auch, Fractracker Alliance, and aerial support provided by LightHawk
Limitations of the registration program
The only requirement under this program is that the landowner “provide evidence that nonmetallic mining is a permitted or conditional use for the land under zoning in effect on the day in which notice is provided to the zoning authorities.” All registrations must be recorded in the county’s registrar of deeds 120 days before filing the registration. This process results in zoning authorities having a 60-day window to determine if they support or object to registrations in circuit courts.
Once counties are notified, they have no recourse for objection aside from proving that the deposit is not marketable or the parcel is not zoned for mining.
As Ms. Feil wrote, this program “preserves…[parcel] eligibility for nonmetallic mining in the future, even if a local governing body later passes new mining restrictions.” The former will have already been proven by the licensed geologist, and the latter is highly unlikely given lax or non-existent zoning in rural Wisconsin, where many land parcels are outside incorporated townships. Any parcel registered on this program remains in the program for a 10 year period and may be automatically re-registered under the initial geological assessment for another 10 year term “at least 10 days and no more than one year before registration expires.”
After this 20-year period, parcels start from scratch with respect to the registration process.
Initial inquiry and map methodology
As part of her white paper, Ms. Feil noted that in a quick check of her home county’s register of deeds, she found six nonmetallic mineral deposit registrations since 2000 in Trempealeau County and nine in neighboring Chippewa County. As a result of Ms. Feil’s initial inquiry, we decided it would be worth conducting a sweeping search for all nonmetallic parcel registrations in the nine most heavily frac sand-mined Wisconsin counties: Trempealeau, Barron, Crawford, Chippewa, Monroe, Jackson, Clark, Dunn, and Eau Claire.
“Wisconsin Nonmetallic Mineral Deposit Parcel Registrations and Likely Mine Parcels” Map
We were fortunate enough to receive funding from the Save The Hills Alliance (STHA) to conduct this research. We received “boots on the ground” assistance from the likes of Ms. Feil, Ms. Popple, and several other volunteers for acquiring hard copies of registrations as of the summer of 2018.
Our goal was to construct a map that would provide a predictive and dynamic tool for residents, activists, non-profits, researchers, local governments, and journalists to understand the future scale and scope of frac sand mining across West Central Wisconsin. We hope this will inspire a network of citizen scientists and mapping tools that can serve as a model for analogous efforts in Illinois, Minnesota, and Southeastern Michigan.
In addition to identifying parcels falling under Wisconsin DNR’s MNMDR registration program, we also used Wisconsin’s State Cartographer’s Office and Land Information Program “V4 Statewide Parcel Data” to extract all parcels:
Currently owned by active or historically relevant frac sand mine operators and their subsidiaries,
Owned by families or entities that have allowed for mining to occur on their property and/or have registered parcels under the MNMDR program, and,
All cranberry production parcels in Wisconsin frac sand counties – namely Monroe, Jackson, Clark, Wood, and Eau Claire, with Monroe, Jackson, and Wood the state’s top producing counties by acreage.
The latter were included in the map because Wisconsin DNR identified the importance of cranberry bogs in their Silica Sand Mining in Wisconsin January 2012 report. The report defined the “Cranberry Exemption” as follows:
Some of the counties in central Wisconsin that are seeing an increase in frac sand mining are also home to much of the state’s cranberry farming. Mining sand is a routine practice in the process of raising cranberries. Growers use sand in the cranberry beds to provide adequate drainage for the roots of the cranberry plants. The sand prevents root rot and fosters plant growth. Chapter 94.26, Wis. Stats, was established in 1867 and exempts cranberry growers from much of the laws applying to waters of the state under Chapter 30, Wis. Stats. With this exemption in place cranberry growers can, in theory, mine sand wherever and however they desire for use in cranberry production. Some cranberry growers are taking advantage of the high demand for sand and are selling their sand on the frac sand market (emphasis added). However, the Department has recently determined that the exemption in Ch. 94.26, Wis. Stats., from portions of Chapters 30 and 31, Wis. Stats., for cranberry culture is not applicable to non-metallic mining sites where a NR 216, W is. Adm. Code, stormwater permit is required. For those non-metallic mining operations where the material is sold and hauled off site, Chapters 30 and 31, Wis. Stats., jurisdiction will be applied.
Finally, the last data layer we’ve included in this map speaks to the enormous volumes of subsurface water that the industrial sand mining industry has consumed since 2010. This layer includes monthly and annual water volume withdrawals by way of 137 industrial sand mine (i.e., IN 65) high capacity wells (Our thanks to Wisconsin DNR Water Supply Specialist – Bureau of Drinking Water and Groundwater’s Bob Smail for helping us to compile this data.)
We have coupled that data to annual tonnages in order to quantify gallons per ton ratios for several mines across several years.
Results
Below is the completed map of current and potential frac sand mines in West Central Wisconsin, as well as high capacity wells. Click on the features of the map for more details.
We identified 4,049 nonmetallic parcel registration and existing sand mine operator parcels totaling 113,985 acres or 178 square miles spread across 14 counties in West Central Wisconsin (Table 1). The largest parcel sizes were U.S. Silica’s 398-acre parcel in Sparta, Monroe County and Badger Mining’s 330-acre parcel in St. Marie, Green Lake County. The average parcel is a mere 28 acres.
To put these figures in perspective, back in 2013 we quantified the full extent of land-use change associated with frac sand mining in this same region and found that the 75 active mines at the time occupied a total of 5,859 acres and averaged roughly 75 acres in size. This means that if current parcel ownership and nonmetallic parcel registrations run their course, the impact of frac sand mining from a land-use perspective could potentially increase by 1,900%!
Table 1. Nonmetallic or operator-owned frac sand parcels and their total and average acreage in 14 West Central Wisconsin counties
County
Number of Parcels
Total Acreage
Average Parcel Acreage
Barron
267
8,737
33
Buffalo
211
5,902
28
Burnett
4
140
35
Chippewa
580
15,585
27
Clark
74
2,391
32
Dunn
73
2,245
31
Eau Claire
151
4,101
27
Green Lake
74
2,648
36
Jackson
1,128
36,152
32
Monroe
459
11,185
24
Pierce
168
3,415
20
Rusk
2
64
32
Trempealeau
787
19,375
25
Wood
71
2,044
29
As for the “Cranberry Exemption” identified by Wisconsin DNR, we identified an additional 3,090 cranberry operator or family-owned parcels totaling 98,217 acres or 153 square miles – nearly equal to the acreage identified above. Figure 1 shows the extent of cranberry bog parcels and frac sand mines in Monroe, Wood, and Jackson Counties. The two largest parcels in this inquiry were the 275-acre parcel owned by Fairview Cranberry in Monroe County and a 231 acre-parcel owned by Ocean Spray in Wood County. Interestingly, the former is already home to a sizeable (i.e., 266 acres) frac sand mine operated by Smart Sand pictured and mapped in Figure 2.
Figure 1. Cranberry bog parcels and frac sand mines in the Wisconsin counties of Monroe, Jackson, and Wood
Figure 2. Current and potential extent of Smart Sand’s Fairview Cranberry frac sand mine, Tomah, Monroe County, Wisconsin
In total, the potential for mine expansion in West Central Wisconsin could consume an additional 212,202 acres or 331 square miles. Characterized by dairy farms, and also known as The Driftless Area, this region is where Aldo Leopold penned his masterpiece, A Sand County Almanac. To give a sense of scale to these numbers, it is worth noting that this type of acreage would be like clearing an area the size of the Dallas-Fort Worth metropolis.
Project limitations and emerging concerns
After completing this project, Liz Feil, Pat Popple, and I got on the phone to discuss what we perceived to be its limitations, as well as their concerns with the process and the implications of the MNMDR program, which are listed below:
1. Both Liz and Pat found that when they visited certain counties to inquire as to parcel registrations, most of the registrars of deeds had very little, if any, idea as to what they were talking about, which begged the questions:
Why does Wisconsin not have a uniform protocol and archival process for such registrations?
What are the implications of this program with respect to county and township taxable lands, future zoning, and/or master planning?
What does this program mean for surface and mineral rights ownership in Wisconsin, a state where these two are coupled or decoupled on a parcel by parcel basis?
2. Liz and Pat felt they ended up teaching county registrars more about this registration process during this exercise than they ended up learning themselves.
3. Given the potential ramifications of these types of programs, such registrations should be centrally archived rather than archived at disparate sites across the state. Registrations should be explicitly bolted onto efforts like the aforementioned statewide V4 Statewide Parcel Data, given the fact that the MNMDR parcels are registered for 10 years.
The footprint of frac sand mining at any one point is just a glimpse into how vast its influence could be in the future. Mapping parcel ownership like we’ve done gives people a more realistic sense for the scale and scope of mining in the future and is a more realistic way to analyze the costs/benefits of such an industry. This type of mapping exercise would have greatly benefited those that live in the coal fields of Appalachia and the Powder River Basin as they began to debate and regulate mining, rather than the way they were presented with proposals as smaller discrete operations.
This piecemeal process belies the environmental and social impact of any industrial process, which frac sand mining very much is.
Industrial sand mining and high capacity wells
There is a growing concern, based on a thorough analysis of the data, that the High Volume Hydraulic Fracturing (HVHF) industry’s unquenchable thirst for freshwater is growing at an unsustainable rate. Here at FracTracker, we have been quantifying the exponential increase in HVHF water use, namely in Ohio’s Muskingum River Watershed and northern West Virginia, for more than five years now. More recently, Duke University’s Avner Vengosh has conducted a thorough national analysis of this trend.
While the trends in HVHF water use and waste production are disturbing, such analysis leaves out the water industry uses to mine and process frac sand, or “proppant” in places like Wisconsin, Minnesota, and Illinois. Failure to incorporate such values in an analysis of HVHF’s impact on freshwater, both surface and subsurface, grossly underestimates the industry’s impact on watersheds and competing water uses.
Figure 3 shows monthly and cumulative water demand of frac sand mining. The first thing to point out is the marked seasonal disparities in water withdrawals due to the fact that many of Wisconsin’s frac sand mines go dormant during the winter and ramp up as soon as the ground thaws. The most important result of this work is that we finally have a sense for the total volumes of water permanently altered by the frac sand mining industry:
An astounding 30 billion gallons of water were used between January 2010 and December 2017
This figure is equivalent to the annual demand of ~72,500 US residents (based on an assumption of 418,184 gallons per year). This figure is also equivalent to between 2,179 and 3,051 HVHF wells in Ohio/West Virginia.
Figure 3. Cumulative and monthly water demand by Wisconsin’s frac sand mine Hi-Cap wells, January 2010-December 2017
Figure 4 shows water use by operator. The worst actors with respect to water withdrawals over this period were two wells serving Hi-Crush’s active Wyeville mine that in total used 9.6 billion gallons of subsurface water. Covia Holdings, formerly Unimin and Fairmount Santrol, utilized 5.8 billion gallons in processing an undisclosed amount of frac sand at their Tunnel City mine. Covia’s neighboring mine in Oakdale, owned by Wisconsin White Sand and Smart Sand, used more than 2.5 billion gallons during this period spread across six high-capacity wells.
Figure 4. Total water usage by operator, January 2010-December 2017
These tremendous water volumes prompted us to ask whether we could determine the amount of water needed to mine a typical ton of Wisconsin frac sand. There are numerous issues with data quality and quantity at the individual mine level and those issues stretch from the USGS all the way down to individual townships. However, some townships do collect tonnage records and/or “Fees Tied to Production” from mine operators which allow us to quantify productivity. Using this scant data and the above water volume data we were able to determine “gallons to tons of sand mined” ratios for the years of 2013, 2014, 2015, and/or 2017 for four mines and those ratios range between 30-39 to as much as 521 gallons of water per ton of sand (Table 2).
Table 2. Gallons of water per ton of sand mined for four Wisconsin frac sand mines, 2013-2017
Owner
Property
City
County
Gallon Per Ton
2013
2014
2015
2017
Wisconsin Industrial Sand
Maiden Rock Facility
Maiden Rock
Pierce
98
90
66
—
Thompson, Terry
Thompson Hills Mine
Chetek
Barron
—
30
521
—
Lagesse, Samuel
NA
Bloomer
Chippewa
39
—
48
—
CSP
Rice Lake Mine
Rice Lake
Barron
—
—
—
104
Conclusions
For far too long we’ve been monitoring frac sand mining retrospectively or in the present tense. We’ve had very little data available to allow for prospective planning or to model the impact of this industry and its role in the Hydraulic Fracturing Industrial Complex writ large. Given what we are learning about the fracking industry’s insatiable appetite for water and sand, it is imperative that we understand where frac sand mining will occur if this appetite continues to grow (as we expect it may, given the current political environment at the state and federal level).
Three examples of this growing demand can be found in our work across the Great Lakes:
2) In Le Sueur County, MN Covia – which is a recent merger of silica mining giants Unimin and Fairmount Santrol – has plans and/or parcel ownership speaking to the potential for an 11-fold increase in their mining operations, which would increase acreage from 560 to 6,500 acres (if sand demand increases at its current clip) (Figures 5 and 6).
Figure 5. Unimin’s current 560-acre frac sand mine parcel in Kasota, Le Sueur County
Figure 6. The potential 6,500 extent of Unimin mining by way of parcel ownership search
3) As we’ve previously highlighted, the potential outside Detroit, Michigan for US Silica to expand its current frac sand mining operations would displace hundreds of families. The planned expansion would grow their mine from its current 650-acre footprint to nearly 1,400 acres in the town of South Rockwood, Monroe County (Figure 7).
Figure 7. US Silica’s current (642 acres) and potential (1,341 acres) frac sand mine footprint in Monroe County, Michigan.
Given our experience mapping and quantifying the current and future impact of frac sand mining in states with limited mining activity, we felt it was critical that we apply this methodology to the state where industry is mining a preponderance of frac sand. However, this analysis was rendered a bit more complicated by the presence of the MNMDR program and Wisconsin DNR’s “Cranberry Exemption.” Adding to the challenge is the fact that many in Wisconsin’s frac sand communities demanded that we address the tremendous volumes of water being used by the industry and work to incorporate such data into any resulting map.
We hope that this map allows Wisconsin residents to act in a more offensive and prospective way in voicing their concerns, or simply to become better informed on how sand mining has impacted other communities, will influence them, and what the landscape could look like in the future.
It is critical that we see sand mining not as discrete mines with discrete water demands but rather as a continuum, or better yet an ecosystem, that could potentially swallow large up sizeable chunks of Western Wisconsin.
By Ted Auch, Great Lakes Program Coordinator, FracTracker Alliance
P.S. We’ll continue to add MNMDR registered parcels periodically. As parcels change ownership, we will be sure to update both the cranberry bog and industry owned parcel inventory in the comings months and years.
In recent years, Pennsylvanians have had to endure numerous massive pipeline projects in the Commonwealth. Some of these, such as the Mariner East 2, the Revolution, and the Atlantic Sunrise, have been beset with continuous problems. In fact, both the Mariner East 2 and the Revolution projects had their operations suspended in 2018. The operators have struggled to grapple with a variety of issues – ranging from sinkholes near houses, erosion and sediment issues, hundreds ofbentonite spillsinto the waters and upland areas of Pennsylvania, and more.
Part of the reason for the recent spate of incidents is the fact that so many pipelines are being built right now. These lines are traversing through undermined areas and land known to have underground karst formations, which are prone to subsidence and sinkholes. With more than 90,000 miles of pipelines and 84,000 miles of streams in Pennsylvania, substantial erosion and runoff issues are unfortunately quite common.
Map of pipeline routes in southwestern PA, various pipeline incidents, and karst formations:
Click here to learn more about recent pipeline incidents in Pennsylvania, along with how users of the FracTracker App have helped to chronicle problems associated with them.
Residents keeping track
Many residents have been trying to document issues in their region of Pennsylvania for a long time. Any pipeline incident should be reported to the Department of Environmental Protection (DEP), but in some instances, people want other residents to know and see what is going on, and submission to DEP does not allow for that. FracTracker’s Mobile App allow users to submit a detailed report, including photographs, which are shared with the public. App users have submitted more than 50 photographs of pipelines in Pennsylvania, including these images below.
The FracTracker Mobile App uses crowd-sourced data to document and map a notoriously nontransparent industry. App users can also report violations, spills, or whatever they find striking. For example, the first image shows construction of the Mariner East 2 in extreme proximity to high density housing. While regulators did approve this construction, and it is therefore not a violation, the app user wanted others to see the impact to nearby residents. Other photos do show incidents, such as the second photo on the second row, showing the sinkhole that appeared along the Mariner East 1 during the construction of the nearby Mariner East 2 pipeline.
Please note that app submissions are not currently shared with DEP, so if you happen to submit an incident on our app that you think they should know about, please contact their office, as well. The FracTracker Mobile App provides latitude and longitude coordinates to make it easier for regulators to find the issue in question.
Why have there been so many problems with pipelines in recent years?
Drillers in Pennsylvania’s Marcellus Shale and other unconventional formations predicted that they would find a lot of natural gas, and they have been right about that. However, the large resulting supply of natural gas from this industrial-scaled drilling is more than the region can use. As a result, gas prices remain low, making drilling unprofitable in many cases, or keep profit margins very low in others.
The industry’s solution to this has been two-pronged. First, there is a massive effort underway to export the gas to other markets. Although there are already more than 2.5 million miles of natural gas pipelines in the United States, or more than 10 times the distance from the Earth to the Moon, it was apparently an insufficient network to achieve the desired outcome in commodity prices. The long list of recent and proposed pipeline projects, complete with information about their status, can be downloaded from the Energy Information Administration (Excel format).
The industry’s other grand effort is to create demand for natural gas liquids (NGLs, mostly ethane, propane, and butane) that accompanies the methane produced in the southwestern portion of the state. The centerpiece of this plan is the construction of multiple ethane crackers, such as the one currently being built in Beaver County by Royal Dutch Shell, for the creation of a new plastics industry in northern Appalachia. These sites will be massive consumers of NGLs which will have to be piped in through pressurized hazardous liquid routes, and would presumably serve to lock in production of unconventional gas in the region for decades to come.
Are regulators doing enough to help prevent these pipeline development problems?
In 2010, the Pipeline and Hazardous Materials Safety Administration (PHMSA) led the formation of an advisory group called Pipelines and Informed Planning Alliance (PIPA), comprised mostly of industry and various state and local officials. Appendix D of their report includes a long list of activities that should not occur in pipeline rights-of-way, from all-terrain vehicle use to orchards to water wells. These activities could impact the structural integrity of the pipeline or impede the operator’s ability to promptly respond to an incident and excavate the pipe.
However, we find this list to be decidedly one-directional. While the document states that these activities should be restricted in the vicinity of pipelines, it does not infer that pipelines shouldn’t be constructed where the activities already occur:
This table should not be interpreted as guidance for the construction of new pipelines amongst existing land uses as they may require different considerations or limitations. Managing land use activities is a challenge for all stakeholders. Land use activities can contribute to the occurrence of a transmission pipeline incident and expose those working or living near a transmission pipeline to harm should an incident occur.
Pipeline being constructed near a home
While we understand the need to be flexible, and we certainly agree that every measure should be taken by those engaging in the dozens of use types listed in the PIPA report, it equally makes sense for the midstream industry to take its own advice, and refrain from building pipelines where these other land uses are already in place, as well. If a carport is disallowed because, “Access for transmission pipeline maintenance, inspection, and repair activities preclude this use,” then what possible excuse can there be to building pipelines adjacent to homes?
What distance is far enough away to escape catastrophic failure in the event of a pipeline fire or blast?
This chart shows varying hazard distances from natural gas pipelines, based on the pipe’s diameter and pressure. Source: Mark J. Stephens, A Model for Sizing High Consequence Areas Associated with Natural Gas Pipelines
It turns out that it depends pretty dramatically on the diameter and pressure of the pipe, as well as the nature of the hydrocarbon being transported. A 2000 report estimates that it could be as little as a 150-foot radius for low-pressure 6-inch pipes carrying methane, whereas a 42-inch pipe at 1,400 pounds per square inch (psi) could be a threat to structures more than 1,000 feet away on either side of the pipeline. There is no way that the general public, or even local officials, could know the hazard zone for something so variable.
While contacting Pennsylvania One Call before any excavation is required, many people may not consider a large portion of the other use cases outlined in the PIPA document to be a risk, and therefore may not know to contact One Call. To that end, we think that hazard placards would be useful, not just at the placement of the pipeline itself, but along its calculated hazard zone, so that residents are aware of the underlying risks.
Valve spacing
If there is an incident, it is obviously critical for operators to be able to respond as quickly as possible. In most cases, a part of this process will be shutting off the flow at the nearest upstream valve, thereby stopping the flow of the hydrocarbons to the atmosphere in the case of a leak, and cutting the source of fuel in the event of a fire. Speed is only one factor in ameliorating the problem, however, with the spacing between shutoff valves being another important component.
Comprehensive datasets on pipeline valves are difficult to come by, but in FracTracker’s deep dive into the Falcon ethane pipeline project, which is proposed to supply the Shell ethane cracker facility under construction Beaver County, we see that there are 18 shutoff valves planned for the 97.5 mile route, or one per every 5.4 miles of pipe. We also know that the Falcon will operate at a maximum pressure of 1,440 psi, and has pipe diameters ranging from 10 to 16 inches. The amount of ethane that could escape is considerable, even if Shell were able to shut the flow off at the valve instantly. It stands to reason that more shutoff valves would serve to lessen the impact of releases or the severity of fires and explosions, by reducing the flow of fuel to impacted area.
Conclusion
Groups promoting the oil and gas industry like to speak of natural gas development as clean and safe, but unless we are comparing the industry to something else that is dirtier or more dangerous, these words are really just used to provoke an emotional response. Even governmental agencies like PHMSA are using the rhetoric.
PHMSA’s mission is to protect people and the environment by advancing the safe transportation of energy and other hazardous materials that are essential to our daily lives.
If the safe transportation of hazardous materials sounds oxymoronic, it should. Oil and gas, and related processed hydrocarbons, are inherently dangerous and polluting.
Report
Events
Fatalities
Injuries
Explosions
Evacuees
Total Damages
Gas Distribution
29
8
19
12
778
$6,769,061
Gas Transmission / Gathering
30
0
2
2
292
$51,048,027
Hazardous Liquids
49
0
0
1
48
$9,115,036
Grand Total
108
8
21
15
1,118
$66,932,124
Impacts of pipeline incidents in Pennsylvania from January 1, 2010 through July 13, 2018. National totals for the same time include 5,308 incidents resulting 125 fatalities, 550 injuries, 283 explosions, and nearly $4 billion in property damage.
Current investments in large-scale transmission pipelines and those facilitating massive petrochemical facilities like ethane crackers are designed to lock Pennsylvania into decades of exposure to this hazardous industry, which will not only adversely the environment and the people who live here, but keep us stuck on old technology. Innovations in renewable energy such as solar and wind will continue, and Pennsylvania’s impressive research and manufacturing capacity could make us well positioned to be a leader of that energy transformation. But Pennsylvania needs to make that decision, and cease being champions of an industry that is hurting us.
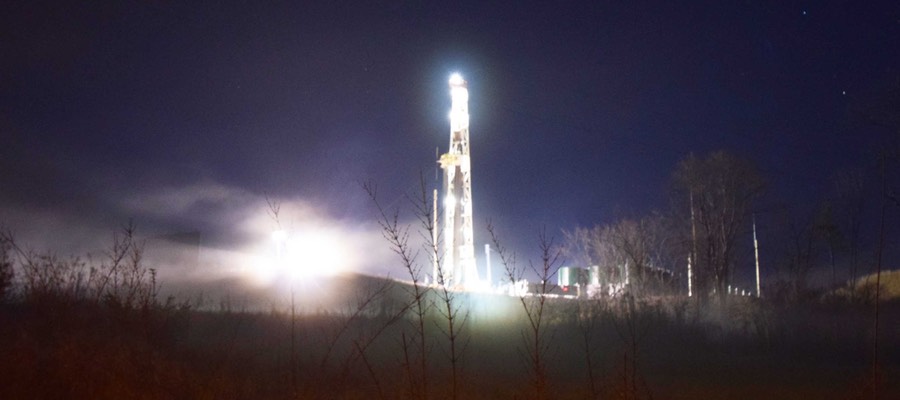
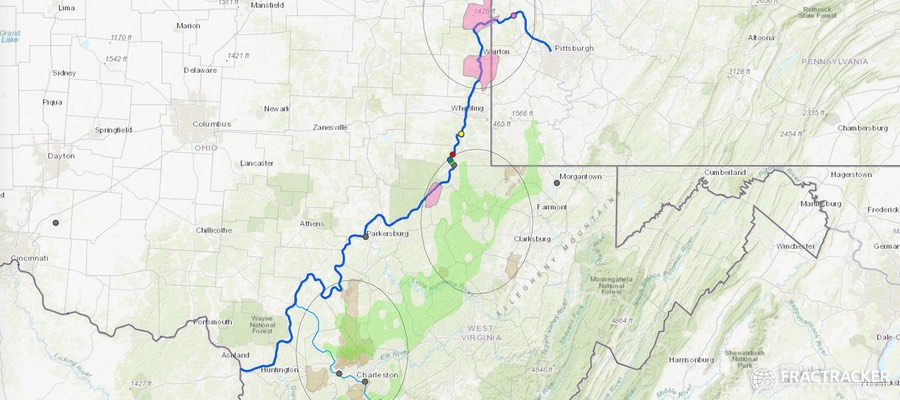
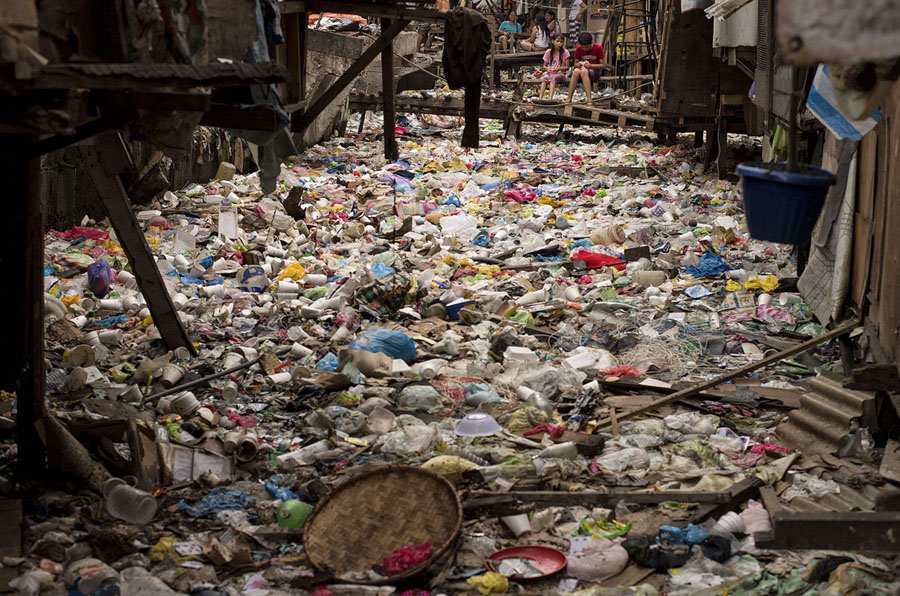
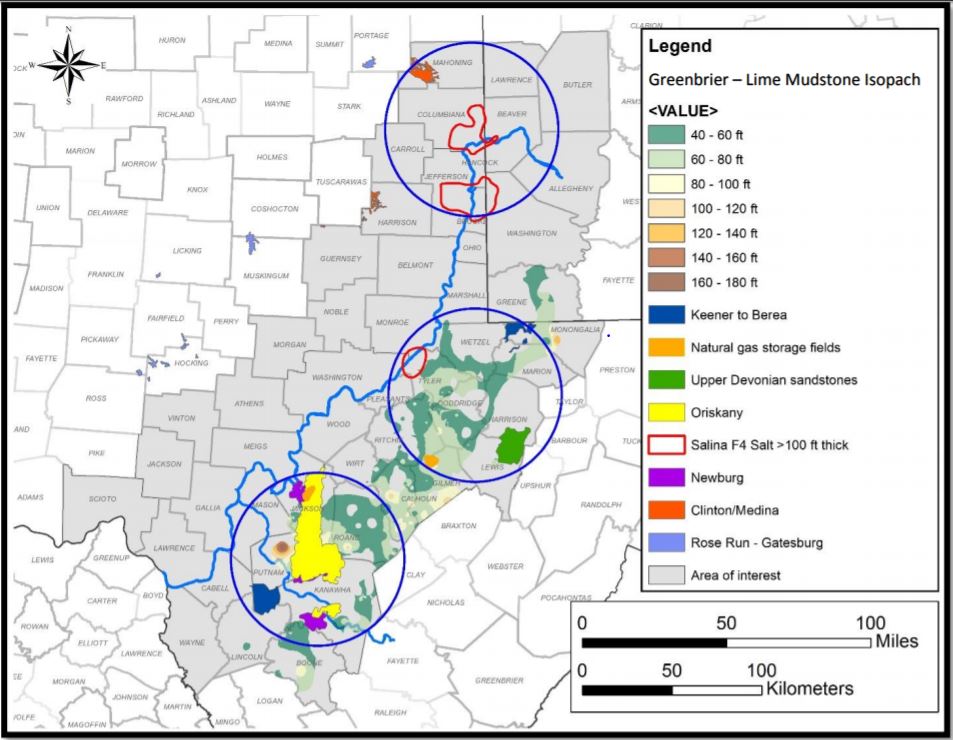
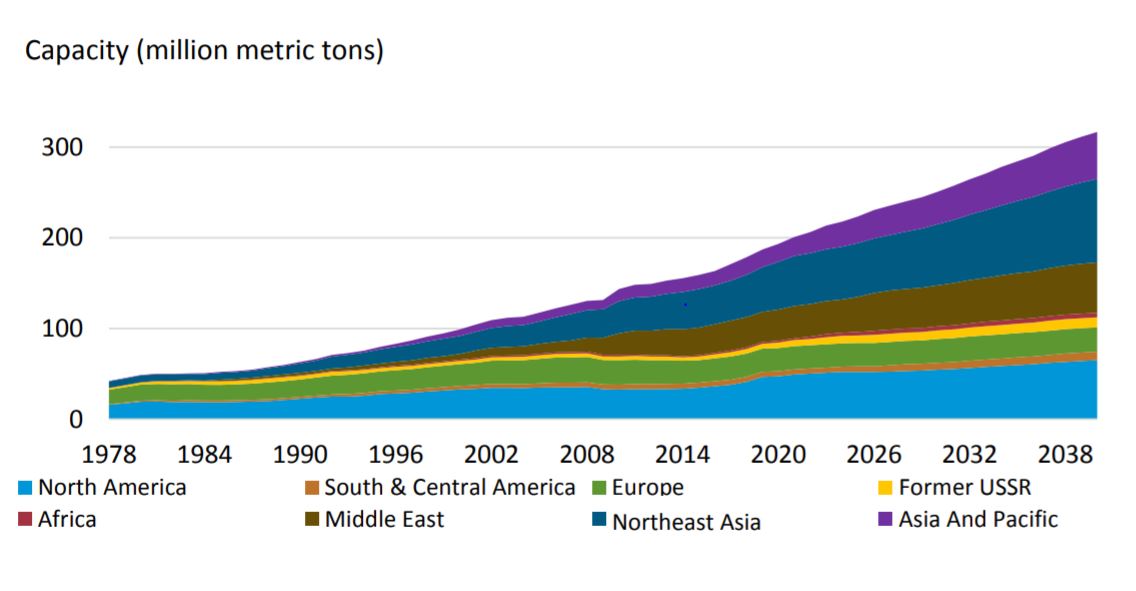
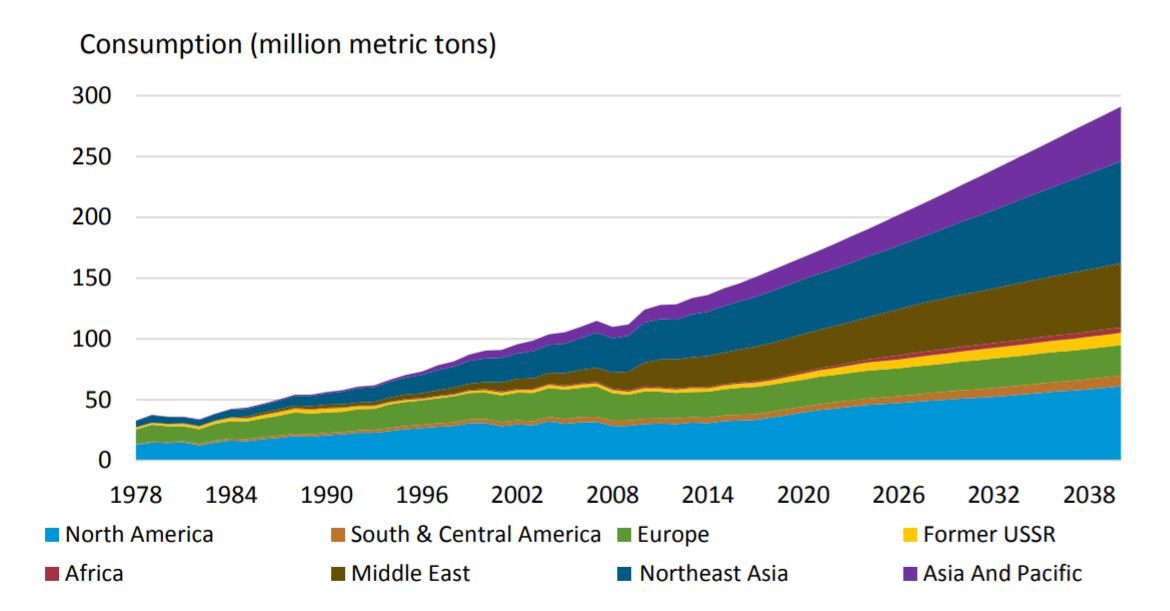

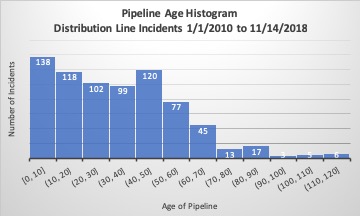
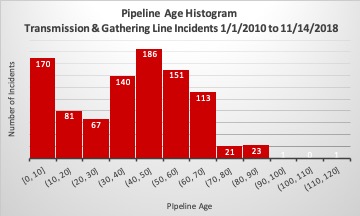
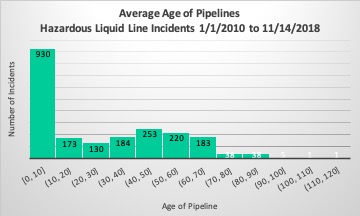

 At age nine, Nalleli Cobo unknowingly engaged in community activism. Her journey began when she noticed she was often ill. Her frequent headaches, stomach pains, nosebleeds, and body spasms worsened to asthma and heart palpitations. Soon after, Nalleli learned others in her community were also having similar problems. Nalleli lived in an apartment complex in South L.A. across from AllenCo’s oil drilling operations. Terrible odors would take over her community every day. After calling regulatory agencies, Nalleli noticed the smells from the oil well only getting worse. Nalleli and her neighbors took action – creating a grassroots campaign called People Not Pozos (Wells). Through grassroots activism, Nalleli strengthened her community’s voice by fighting the oil company poisoning her neighborhood. After a hard fight, AllenCo temporarily closed in November 2013. Her community is fighting to close it permanently.
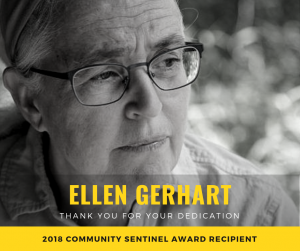
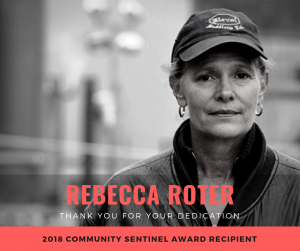 Rebecca Roter grew up in West Philadelphia. Her parents’ involvement in the civil rights and anti-war movements instilled values of standing witness and speaking truth to power. In 1986, when she moved to Susquehanna County, she had no clue the Marcellus Shale under her feet would spur her advocacy for public health. After the first test well was drilled in the county in 2006, she organized an EPA citizen Marcellus listening session, spearheaded a grassroots community billboard campaign, gave guided tours and interviews to national and international media, facilitated the Duke University NEPA ground water studies, and worked with Clean Air Council – winning PA DEP public hearings for compressors. She networked at every turn with federal and state agencies advocating for scientific research, fact-driven discussion, and public health
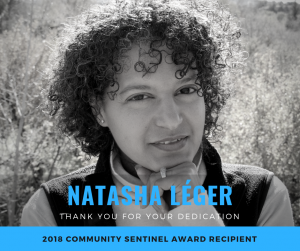 Natasha Léger is the Executive Director (Interim) of Citizens For A Healthy Community (CHC). CHC is a grassroots nonprofit dedicated to protecting air, water and foodsheds in the Delta County region of Southwest Colorado from the impacts of oil and gas development. Before stepping in as Interim ED, Natasha served on the board. She brings to CHC legal, location, ecosystem, and industry analysis experience. Natasha is an international trade attorney, turned independent business consultant, turned editor of a location intelligence magazine, turned author of Travel Healthy: A Road Warrior’s Guide to Eating Healthy. She believes clean air, water, soils, and nouri (a word to describe what we should be eating for optimum health) are a basic human right.

 Carol Zagrocki was dedicated to many environmental projects, and her passion shown in every aspect of her work. Her grants on behalf of the Colcom Foundation supported so many worthy causes – from watershed monitoring and grassroots organizing, to conservation groups and critical research at universities like Carnegie Mellon, Duquesne, and Wheeling Jesuit.
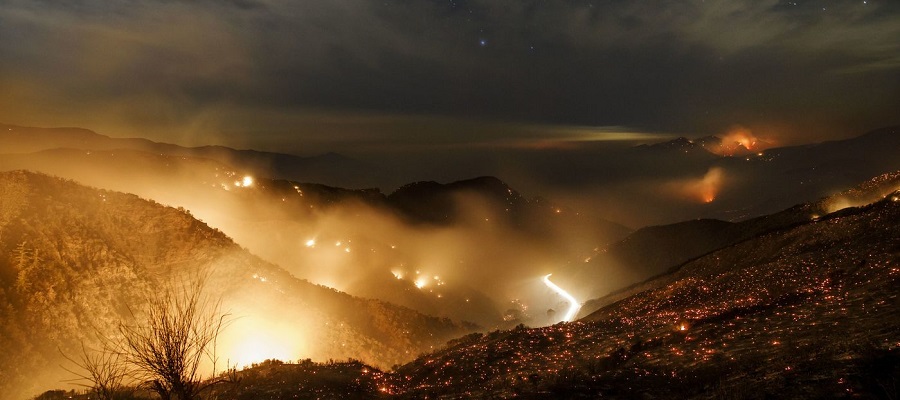
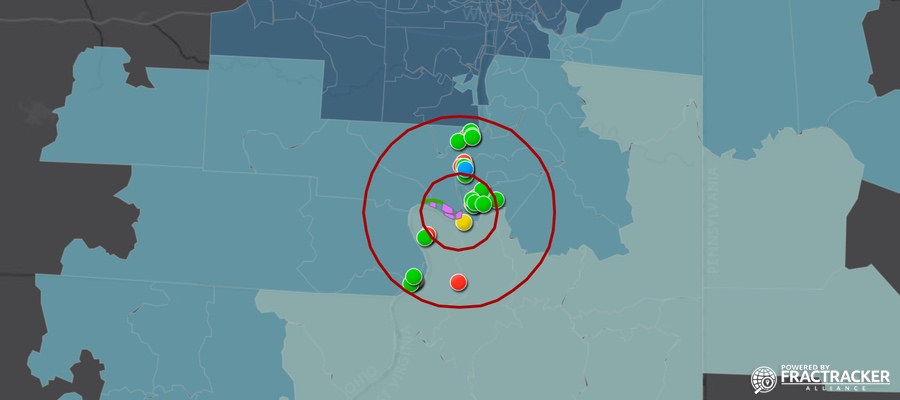
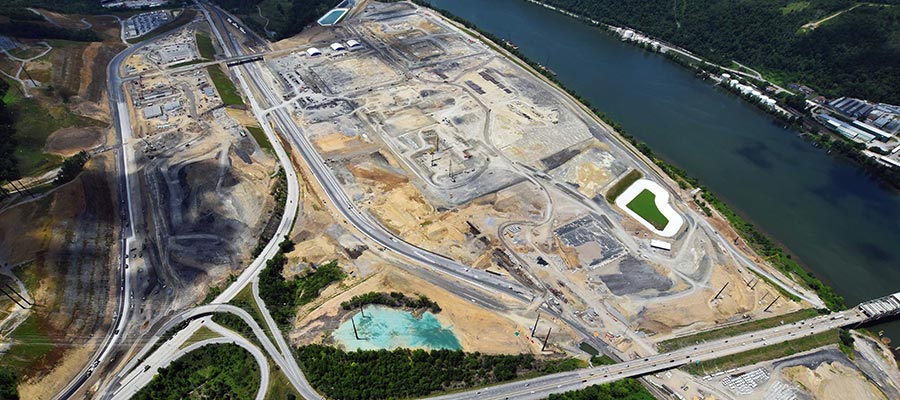


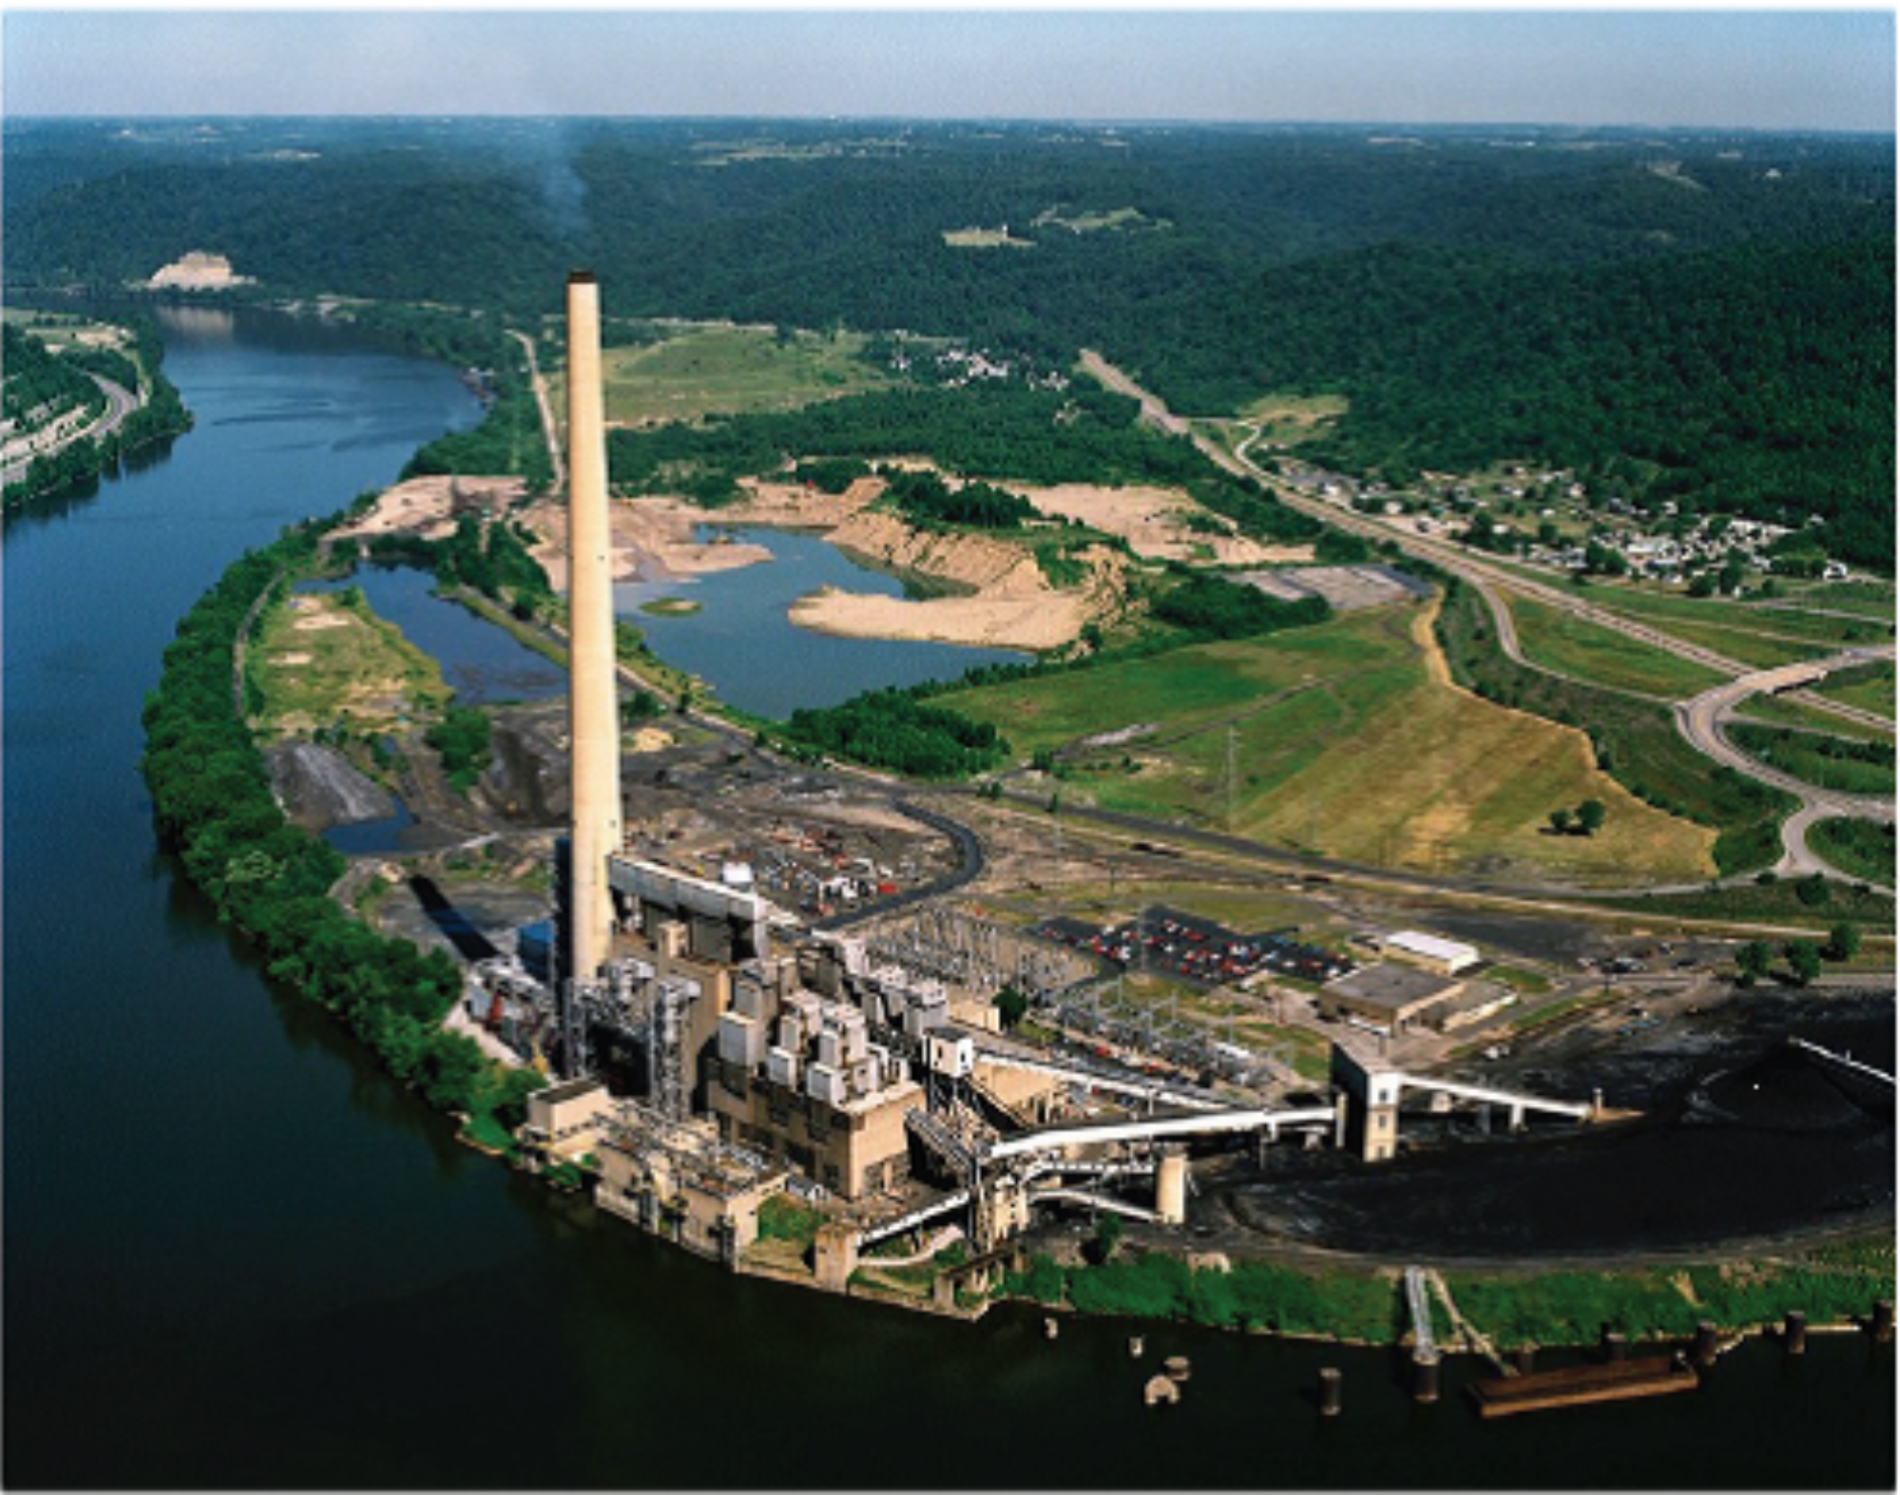
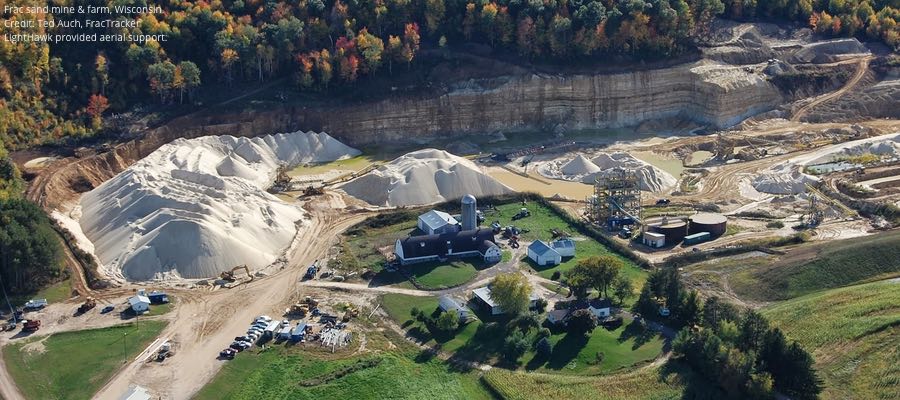
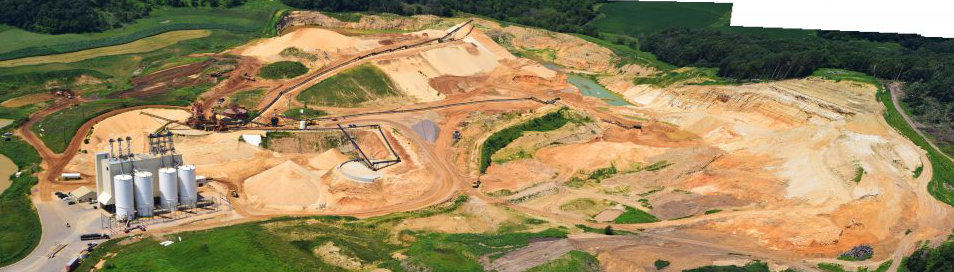
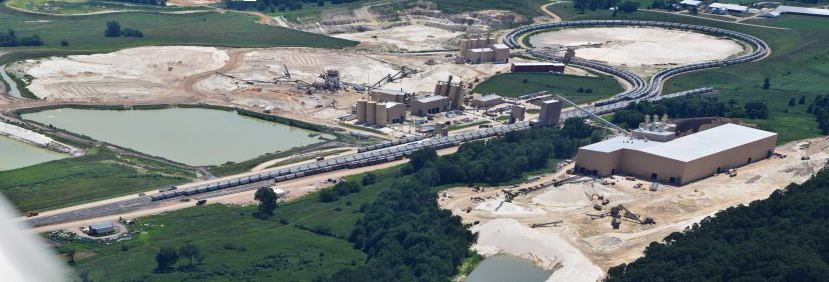
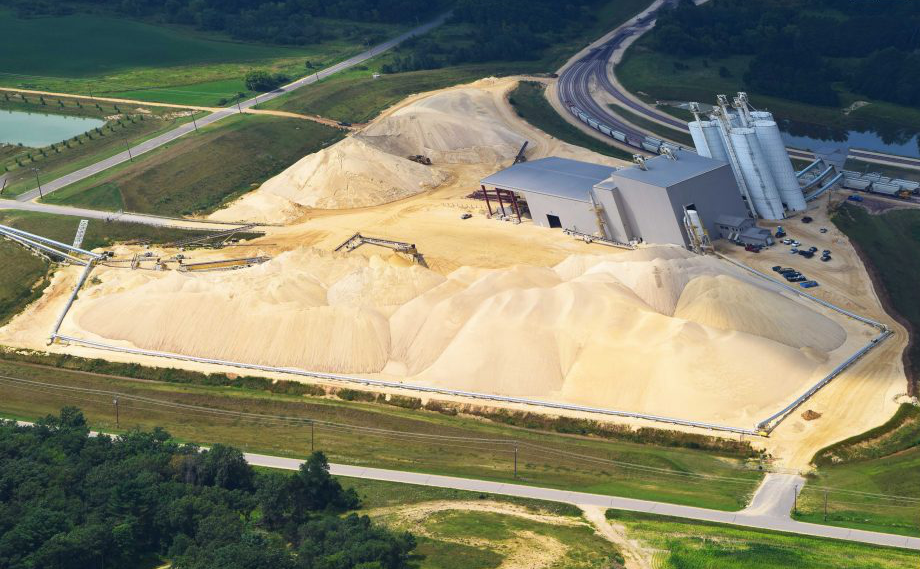
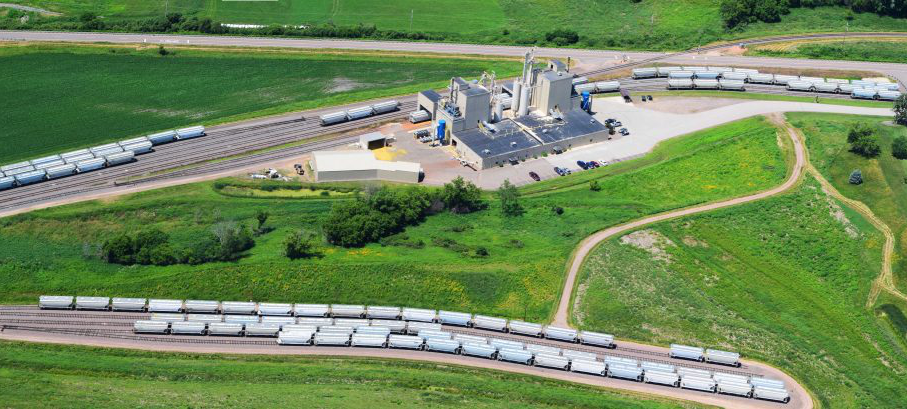

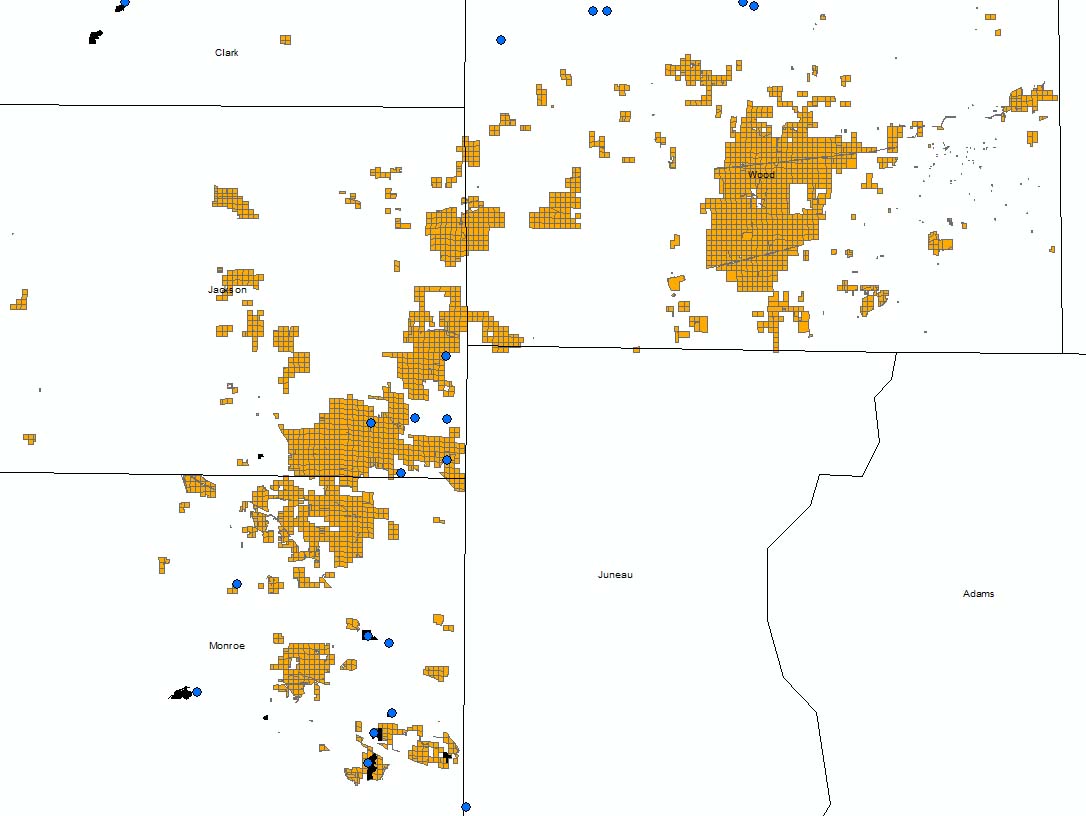
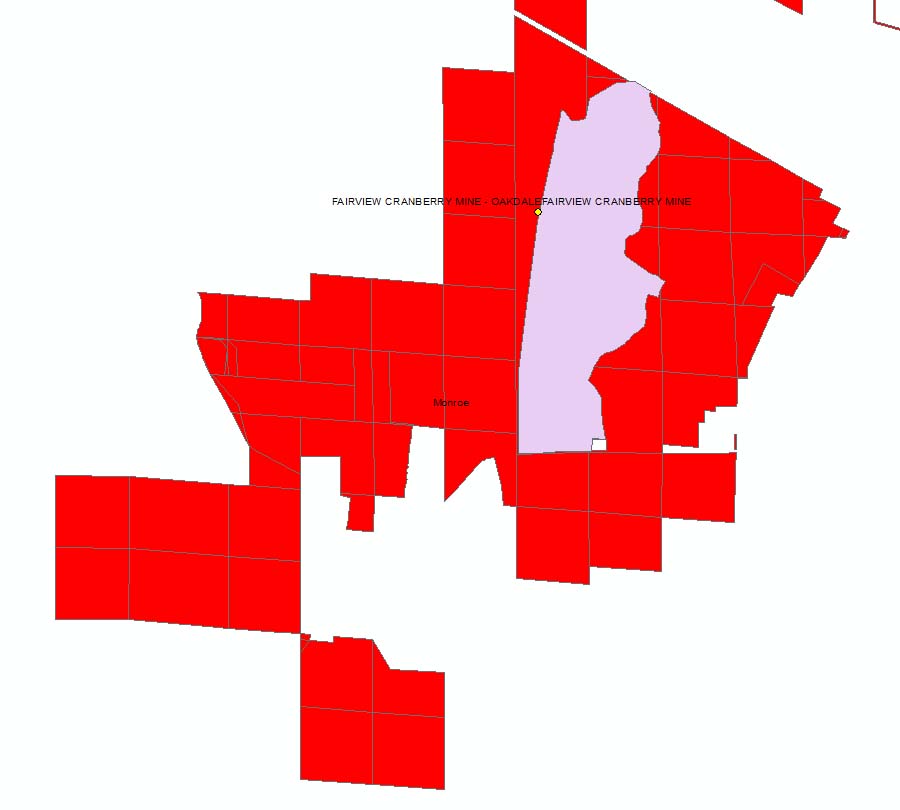
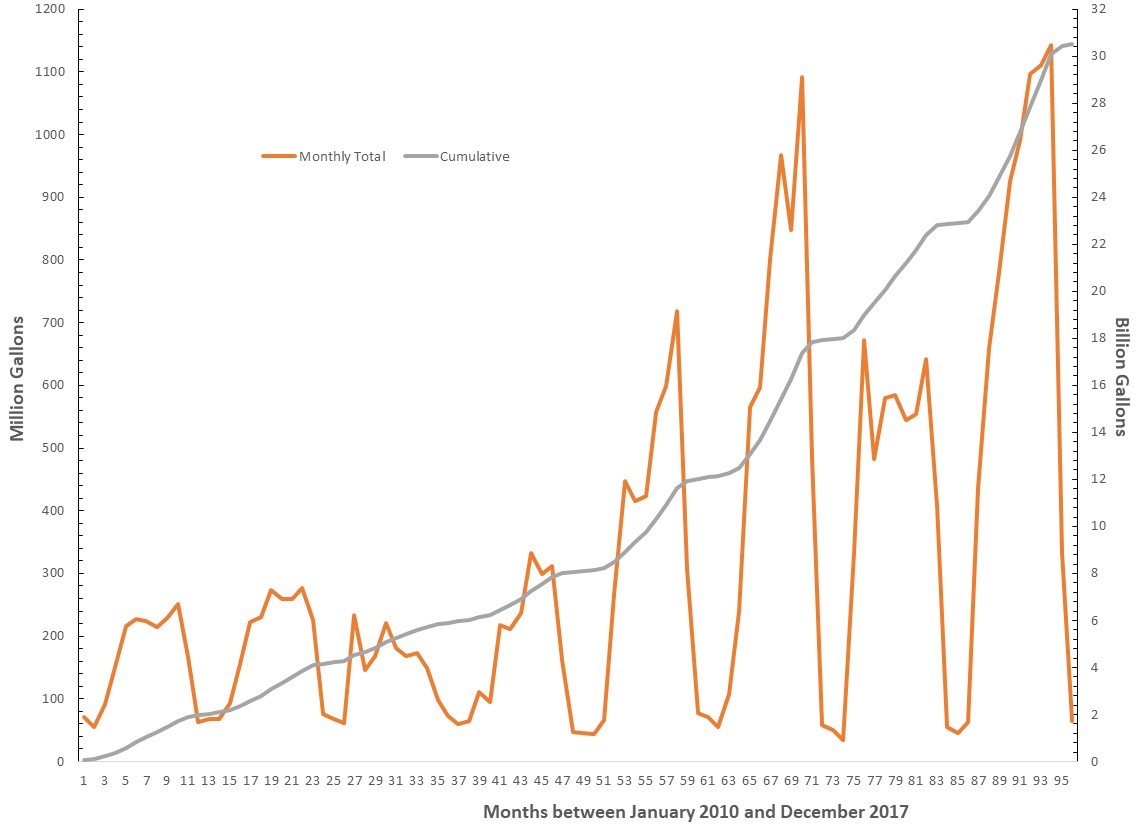
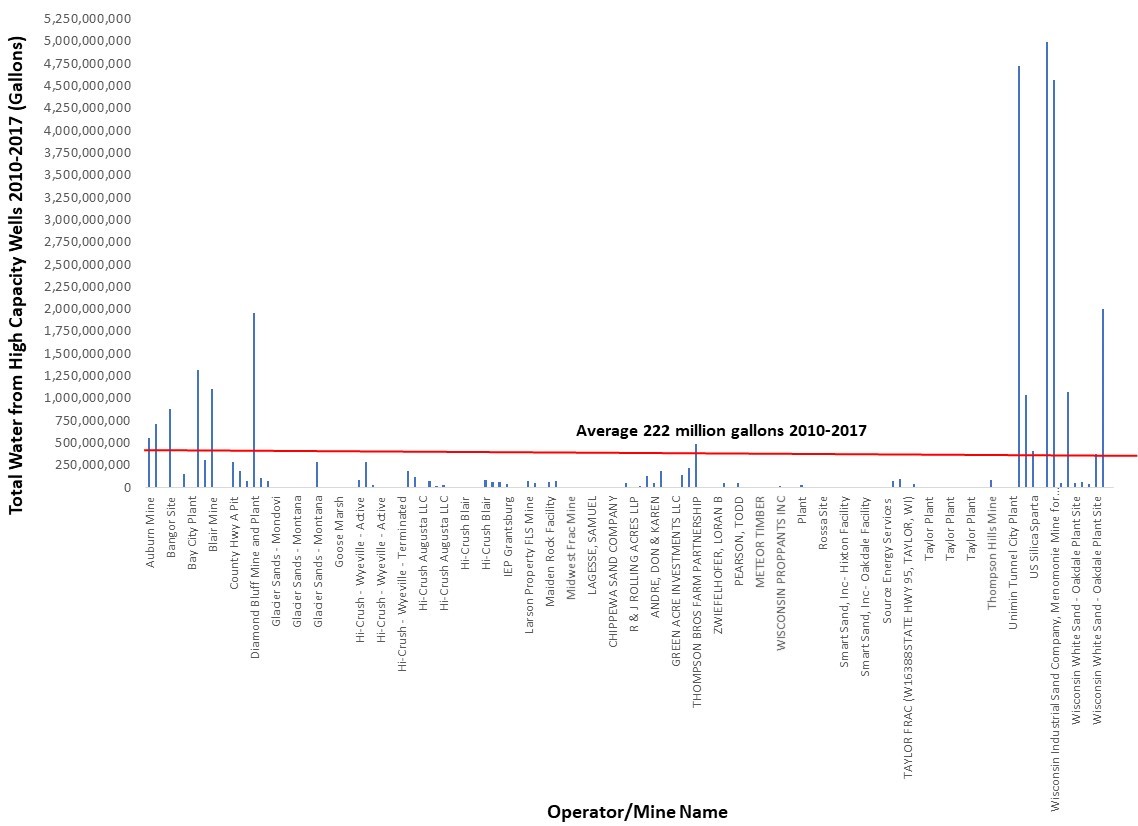
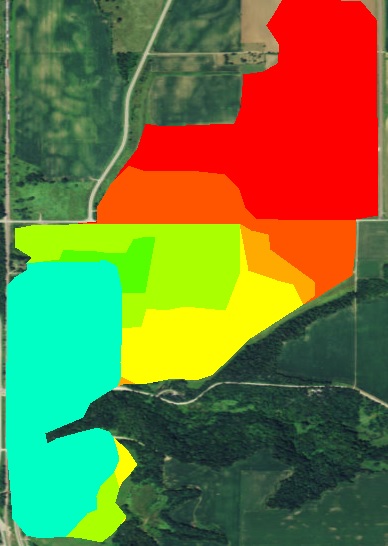
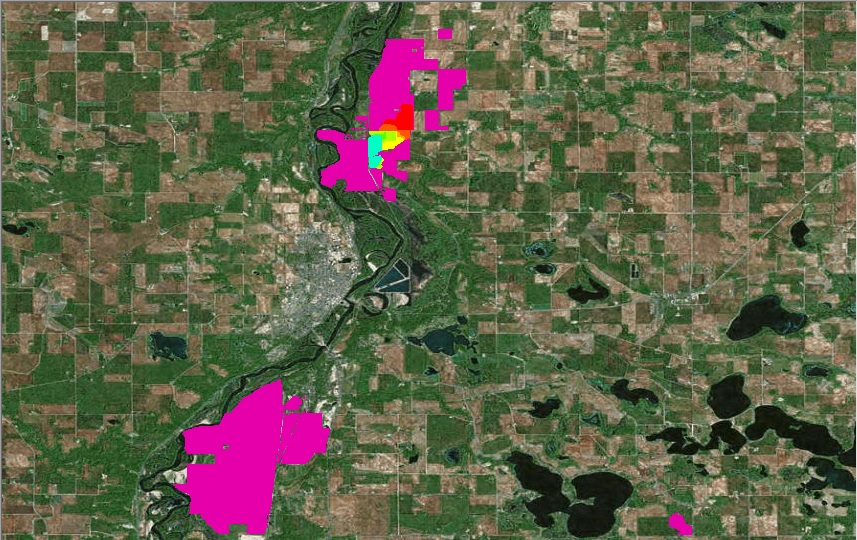
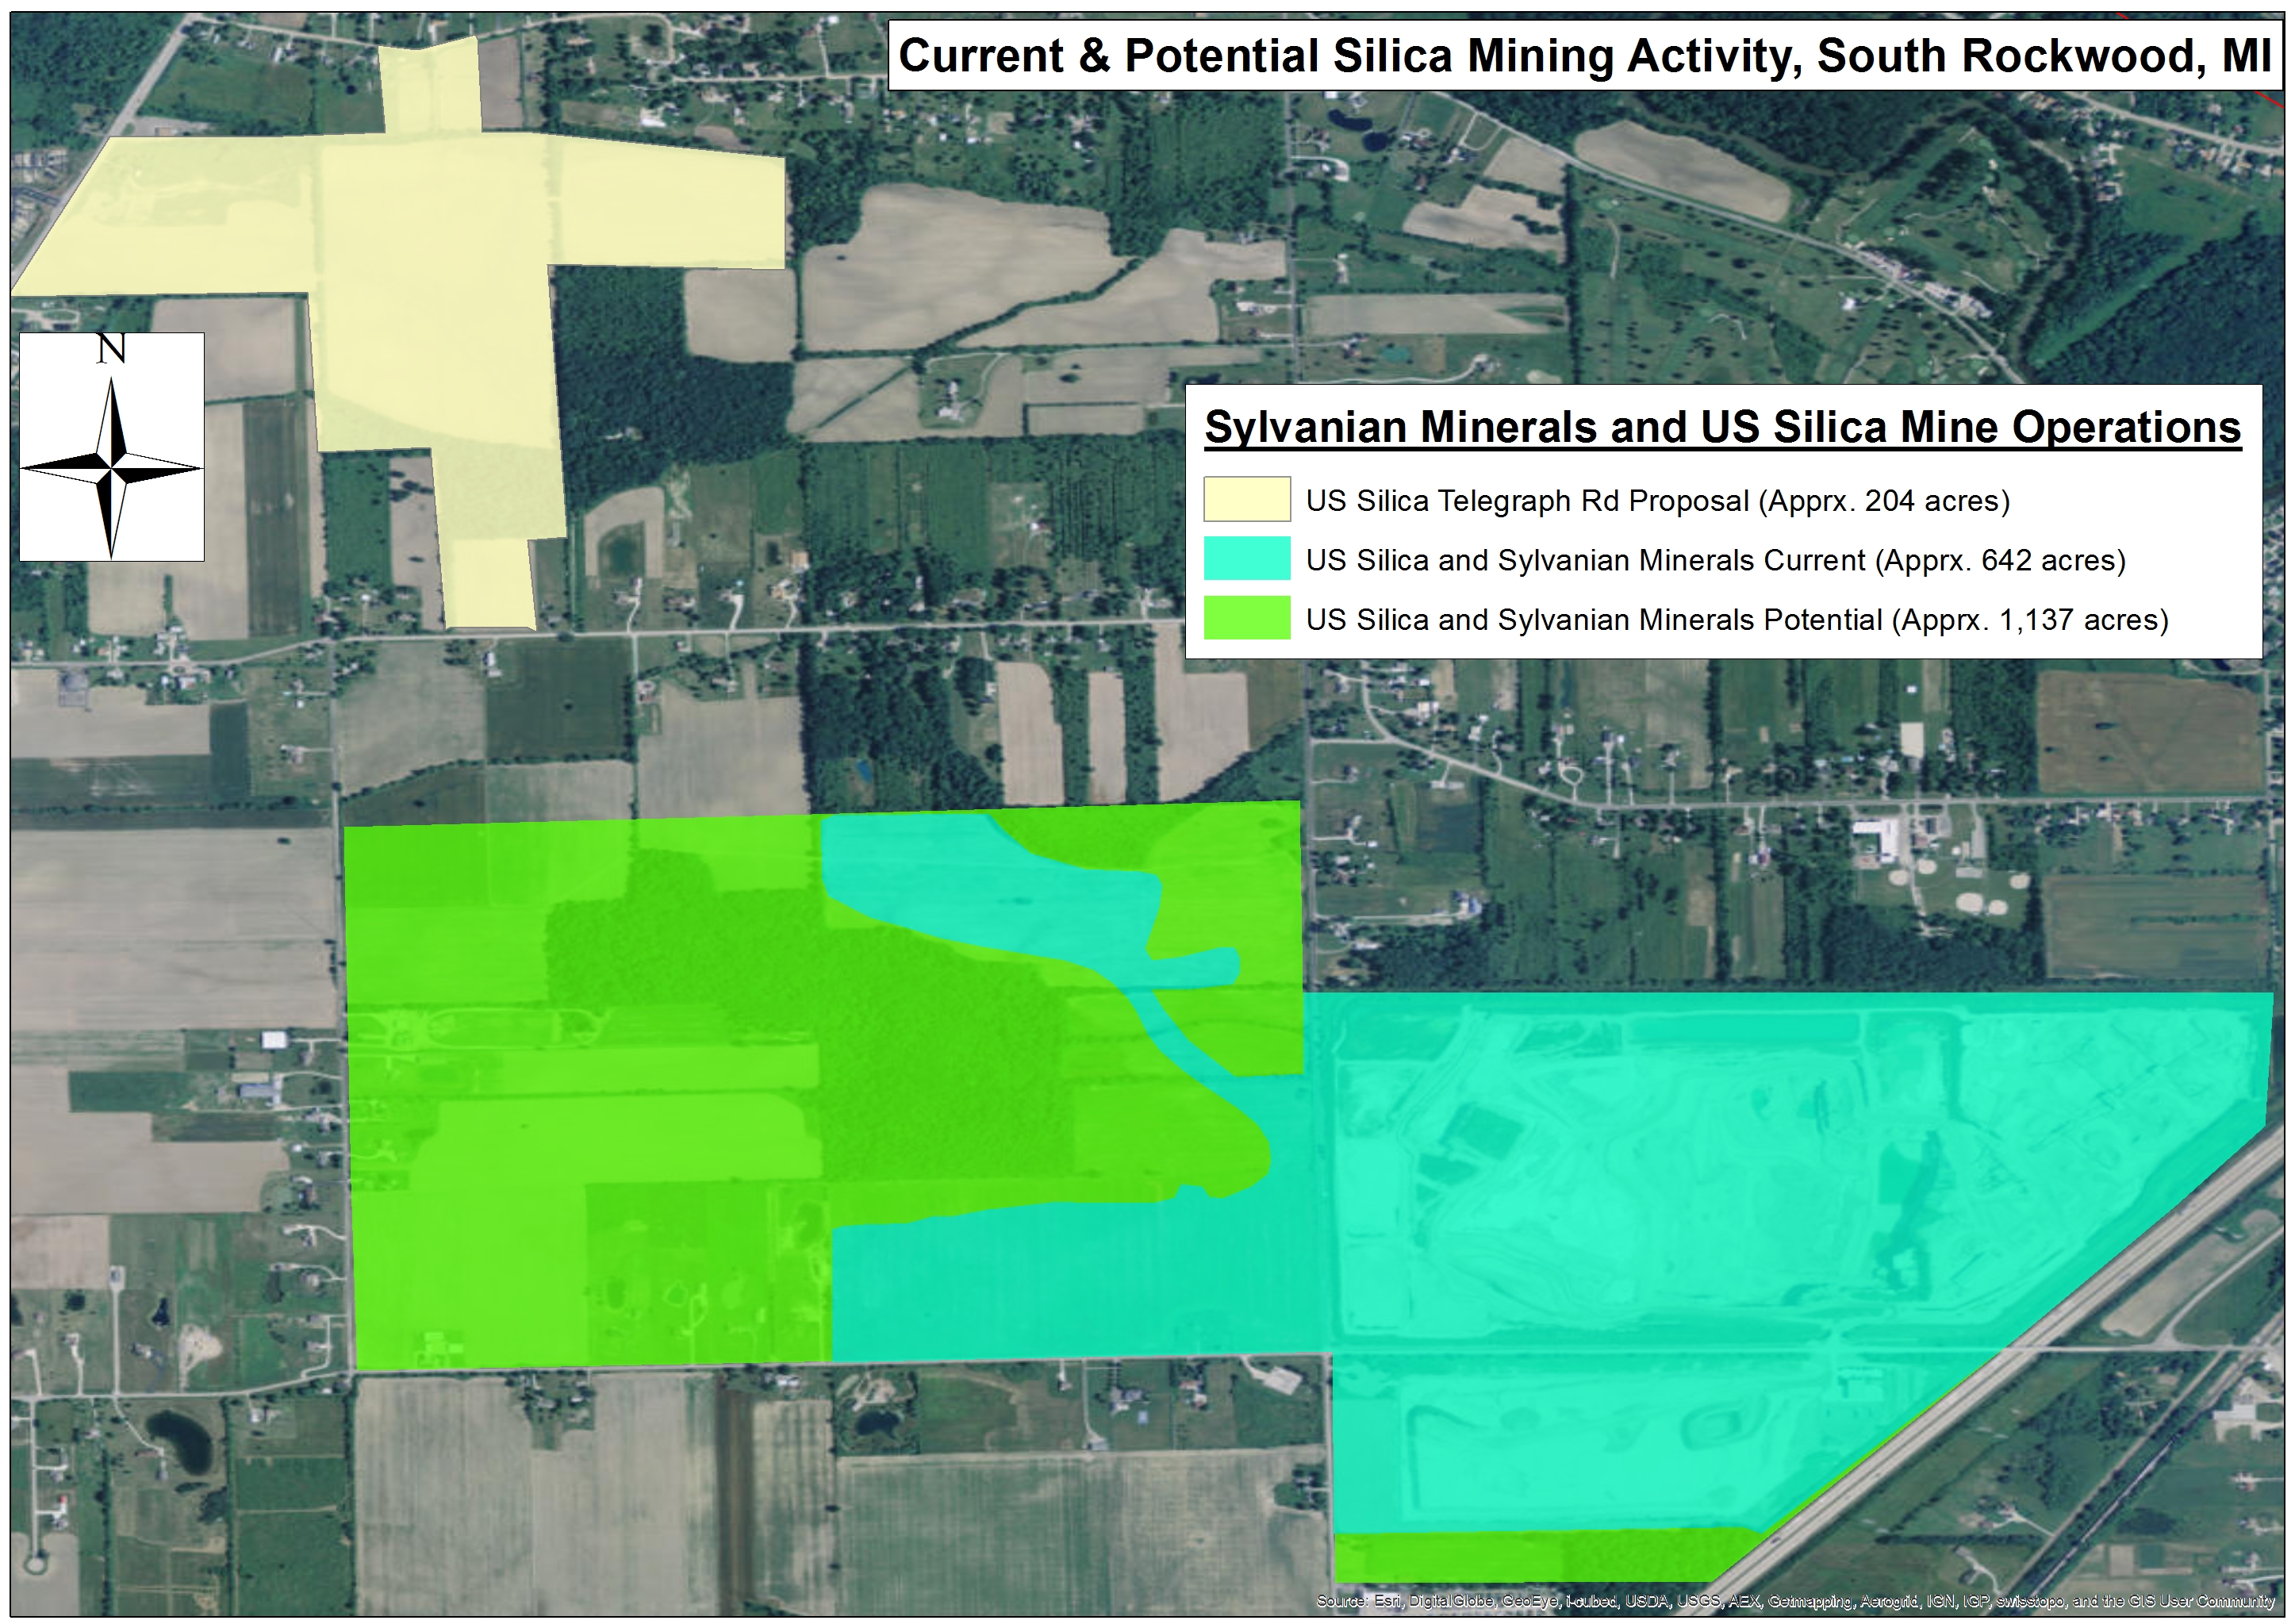
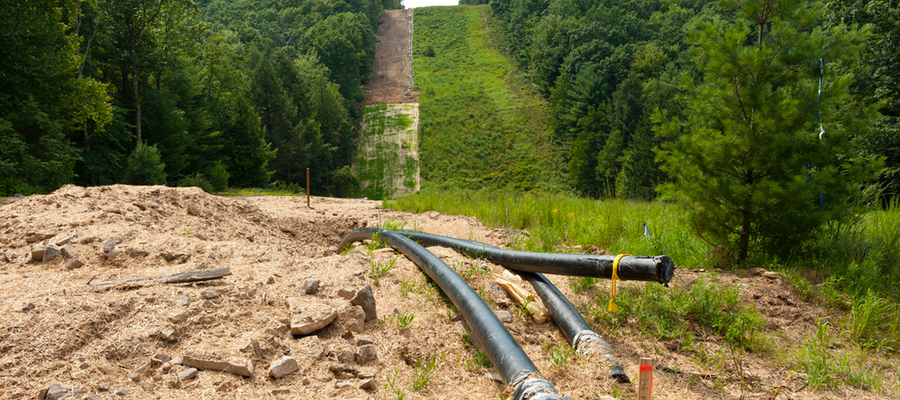
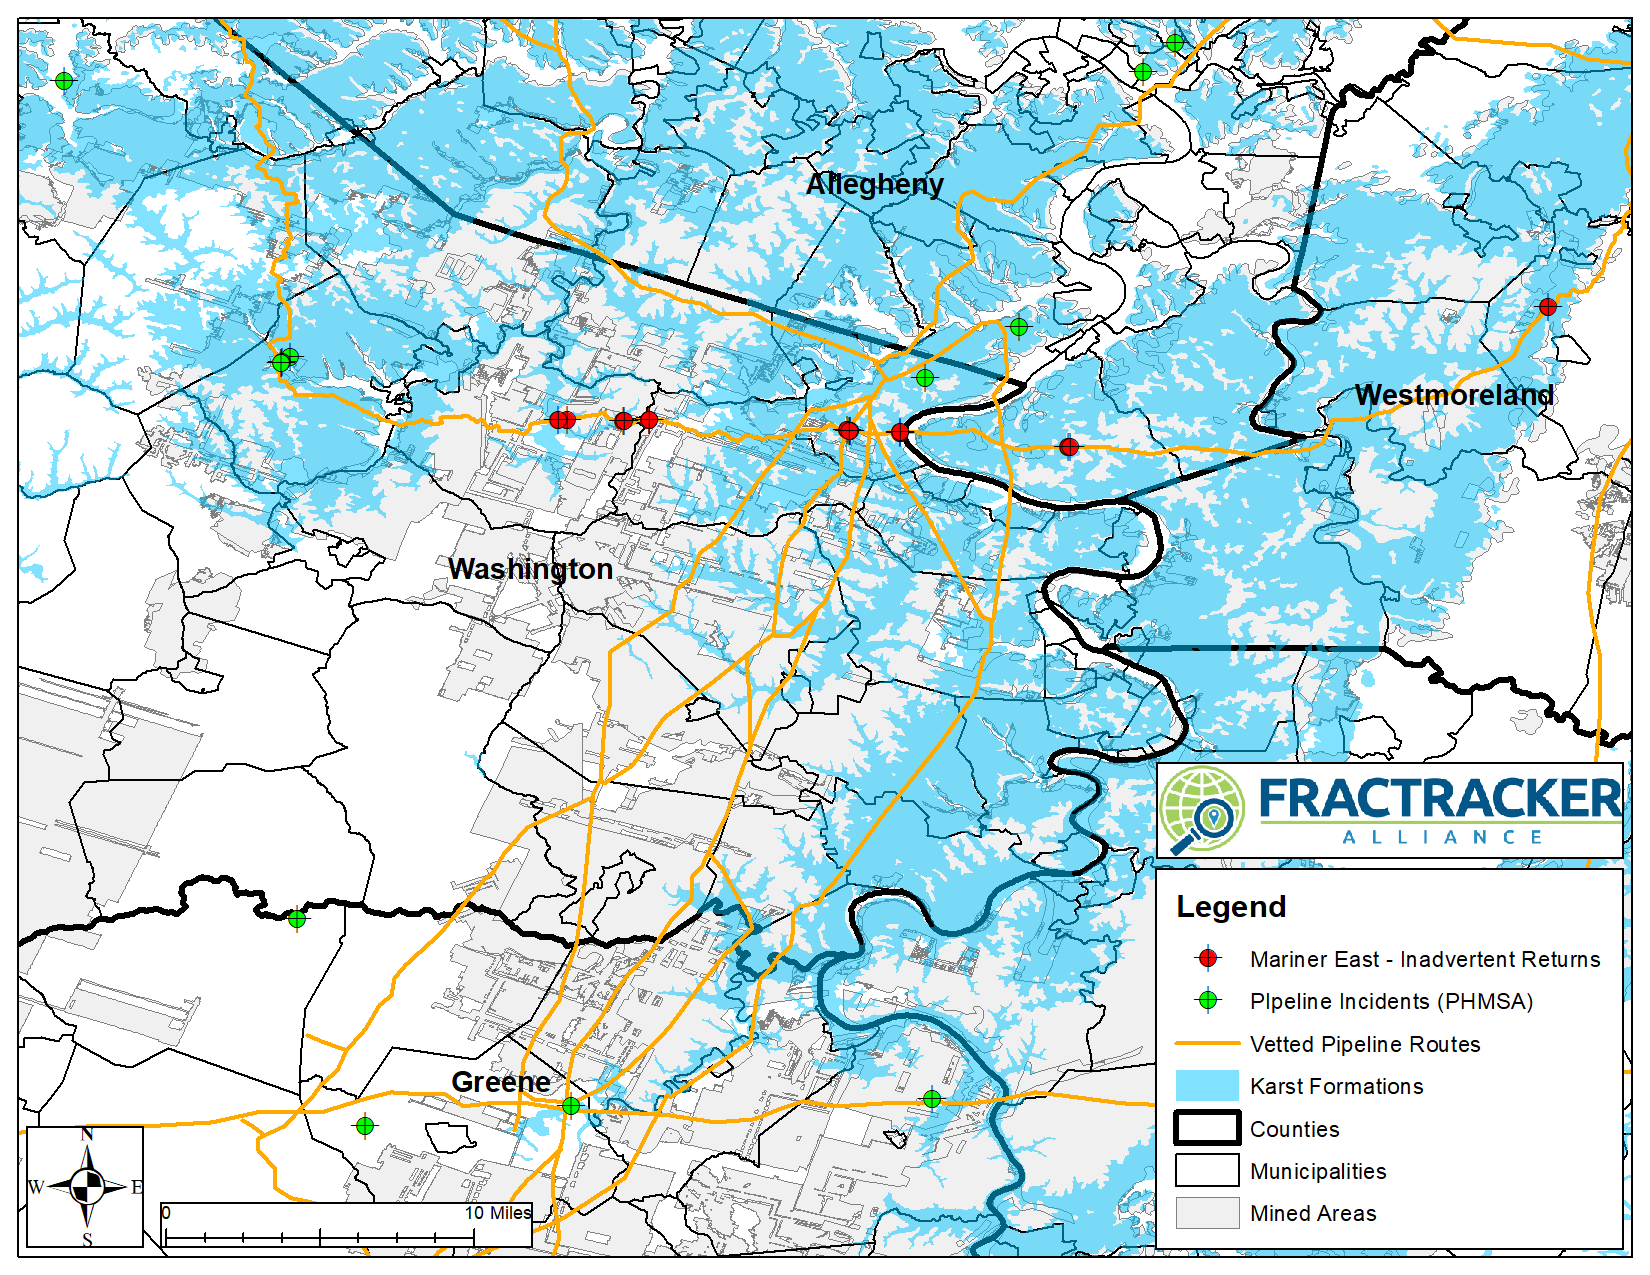


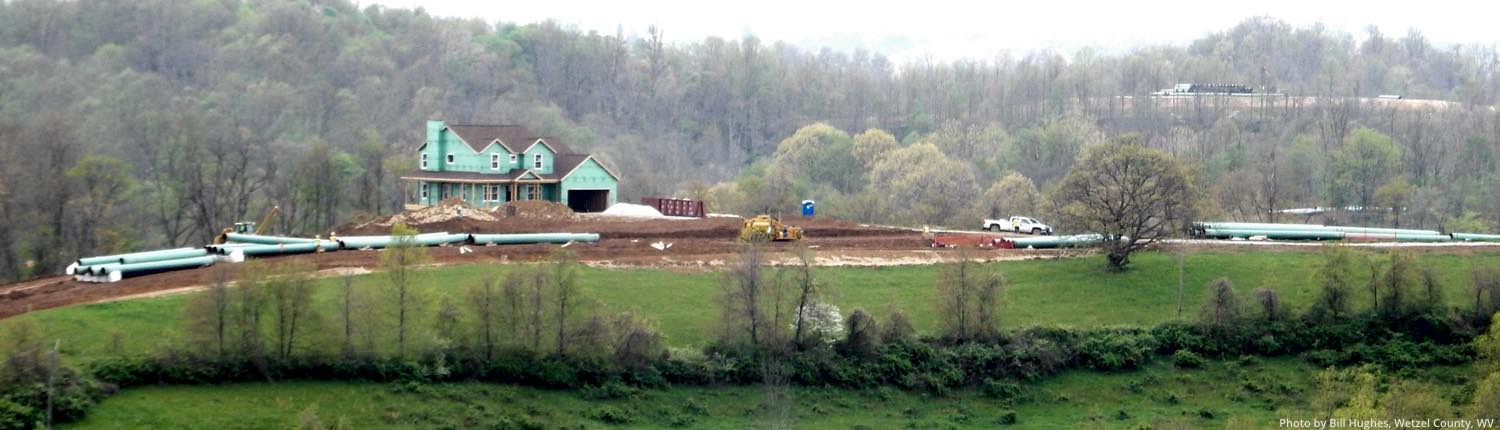
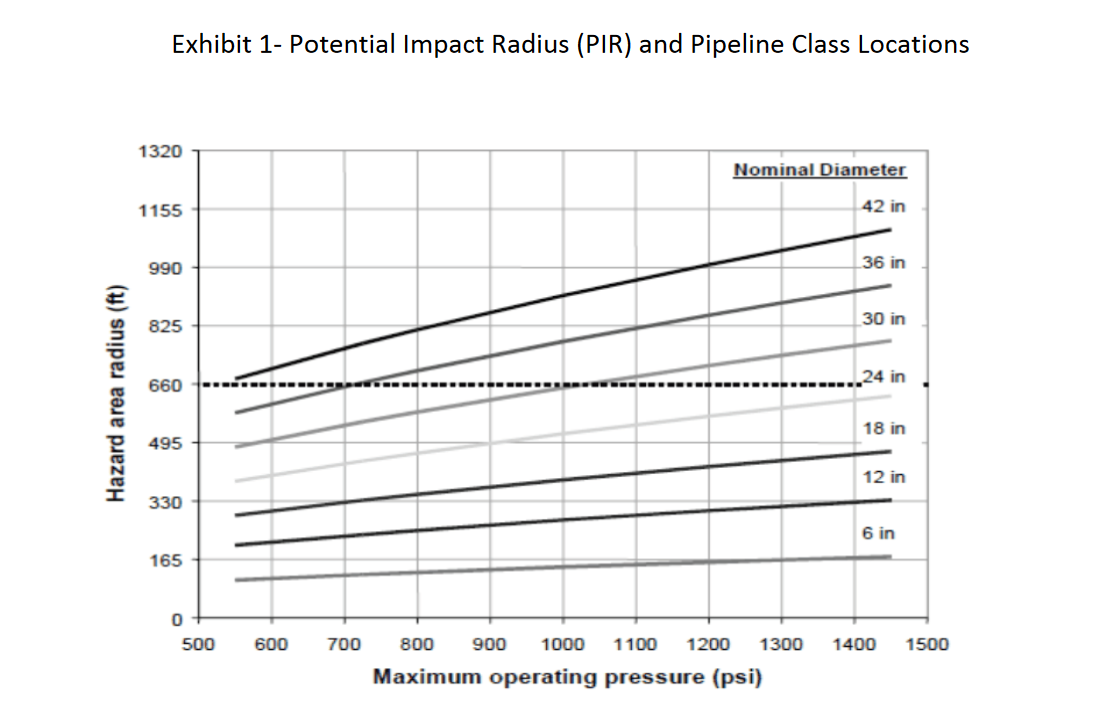
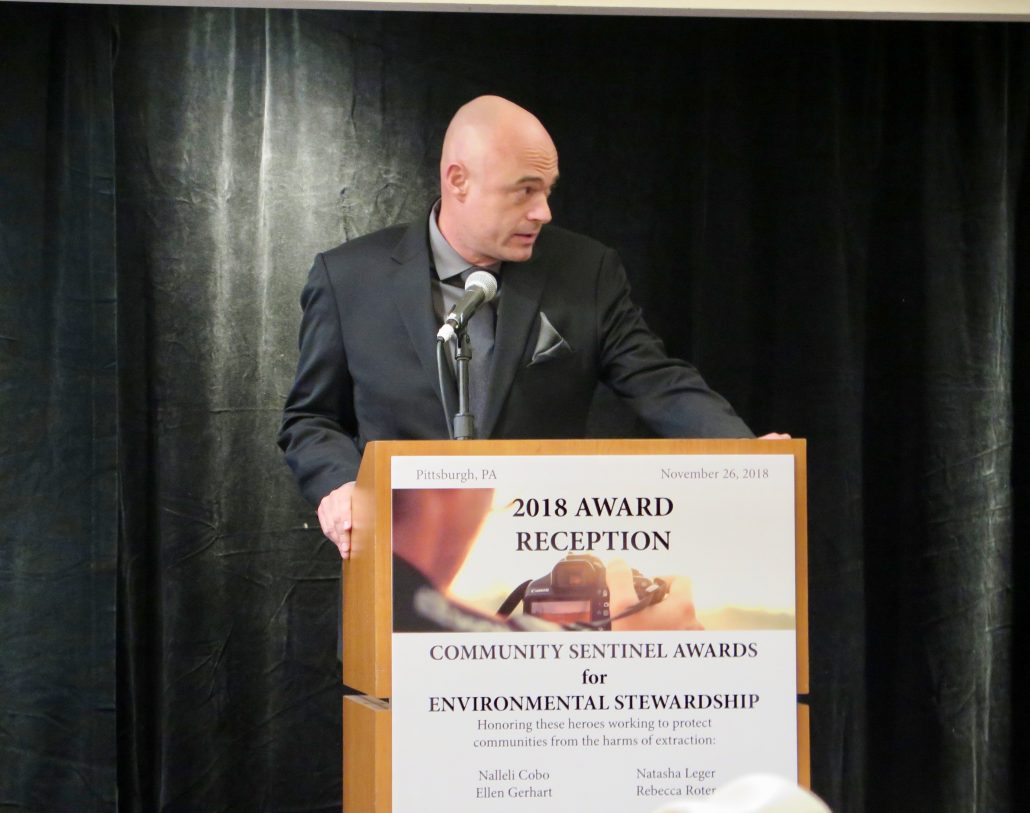
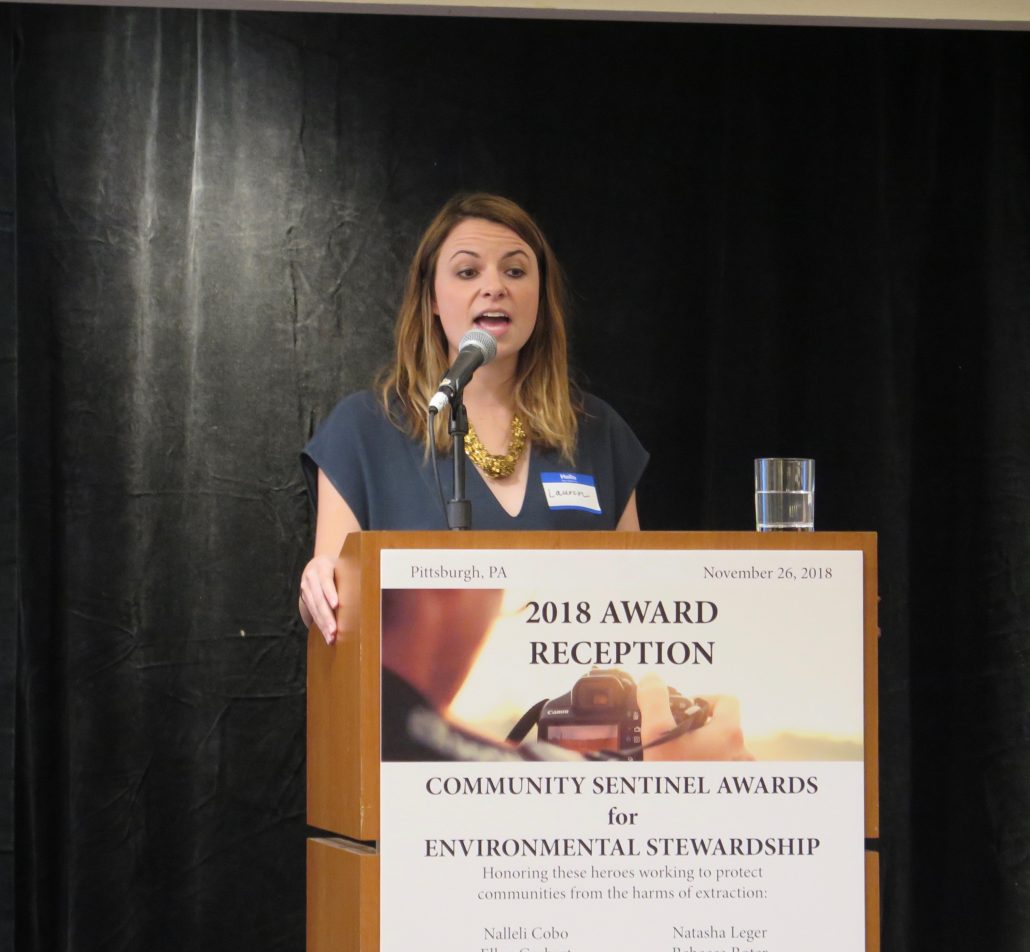
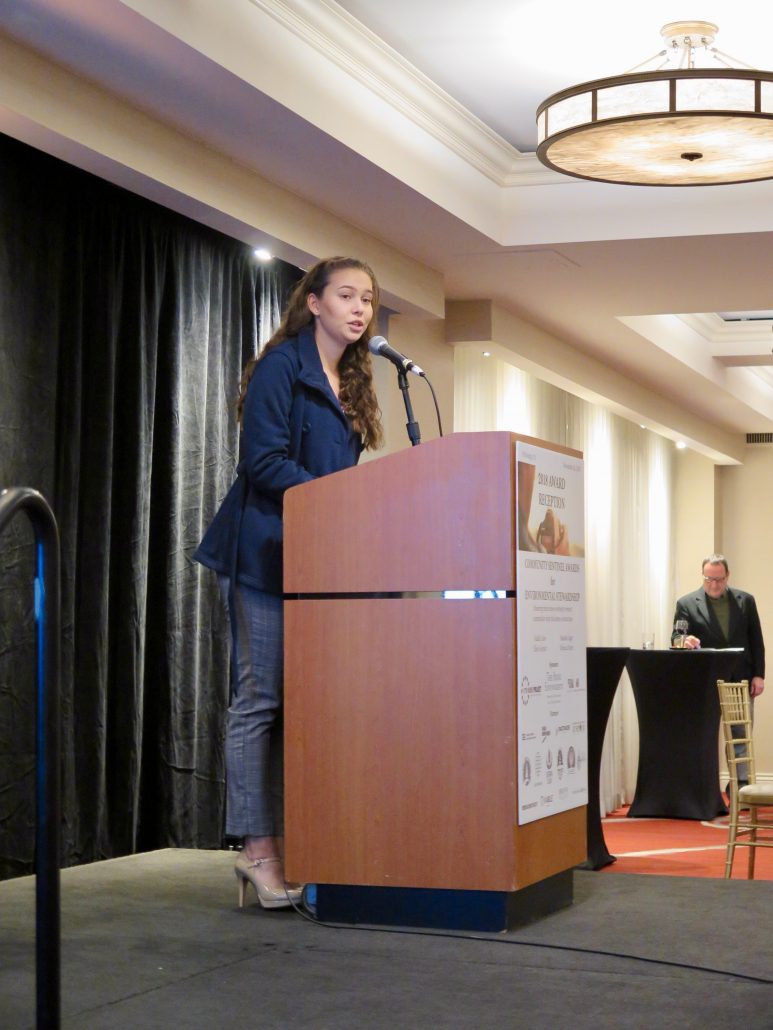
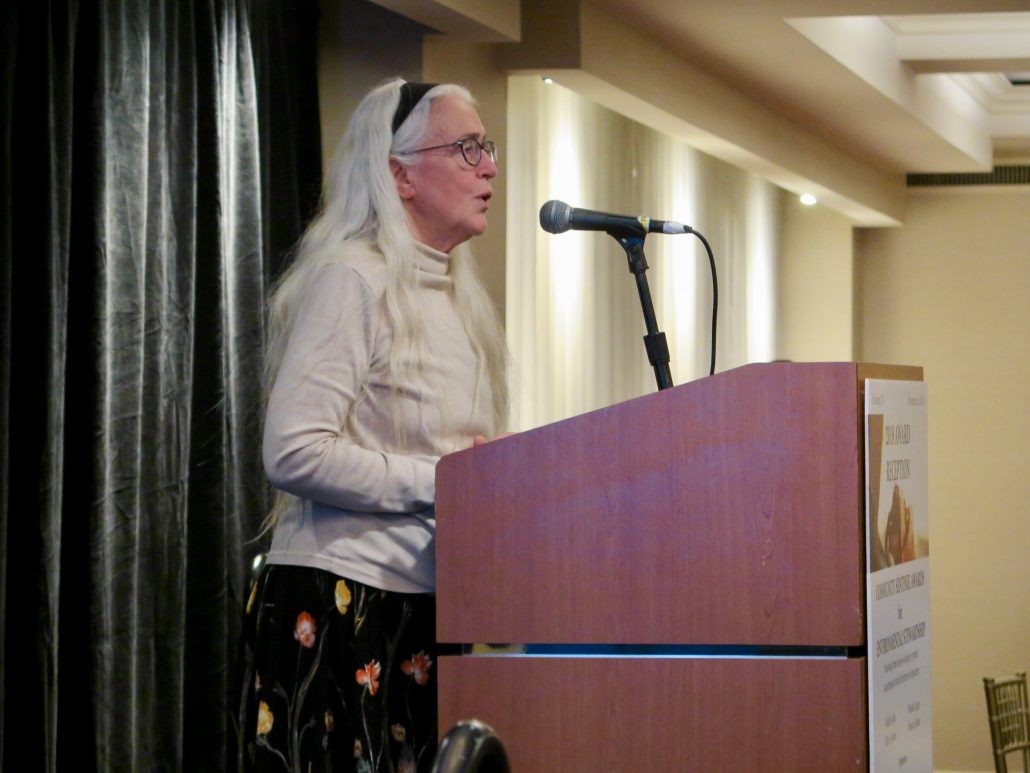
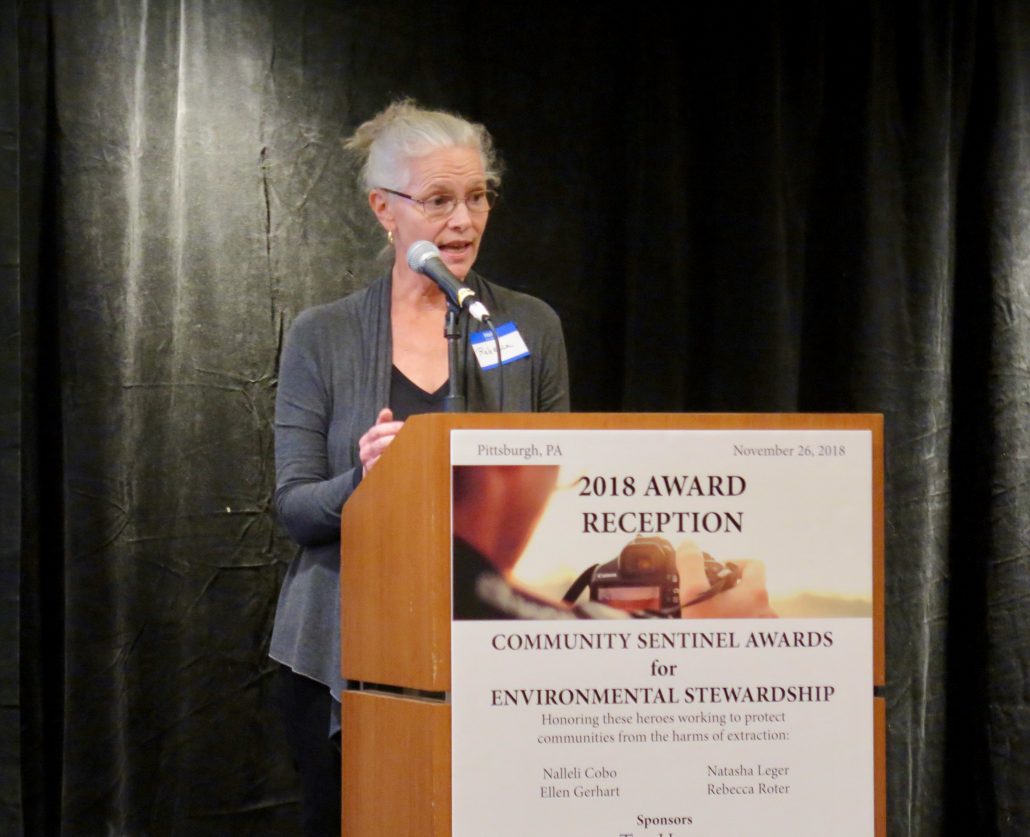
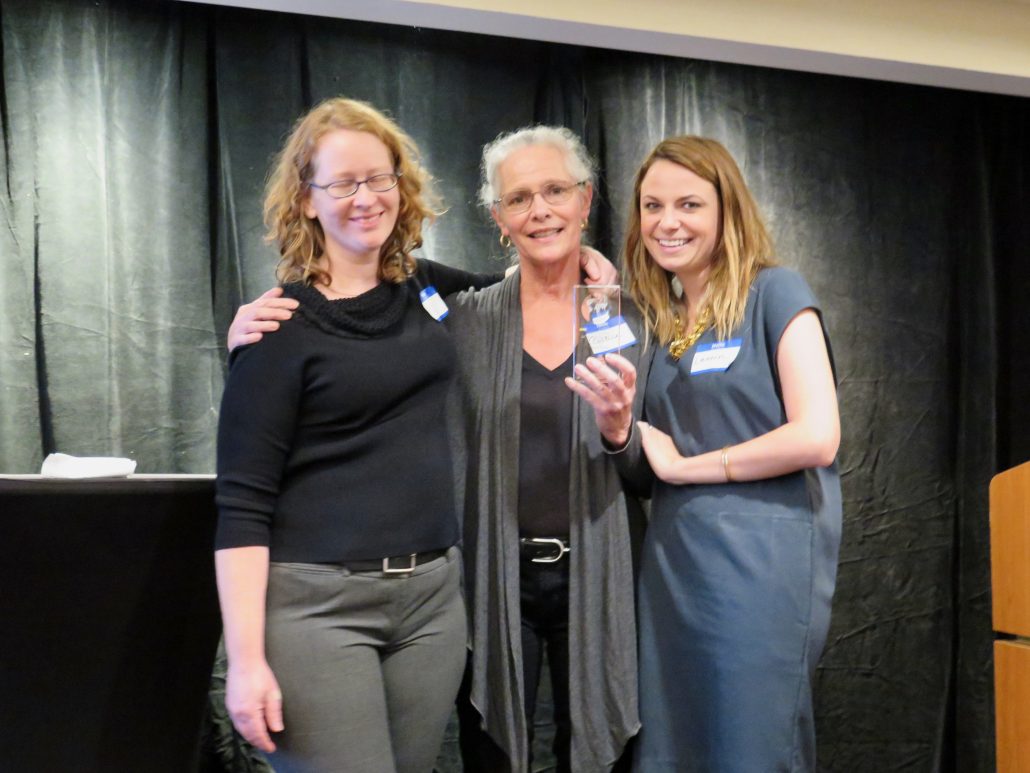