Remaining Questions on Mariner East Technical Deficiencies
In the summer of 2015, Sunoco Logistics submitted applications to the Pennsylvania Department of Environmental Protection (DEP) to build its massive Mariner East 2 pipeline. The ME 2 pipeline would have the capacity to transport 275,000 barrels a day of propane, ethane, butane, and other hydrocarbons from the shale fields of Western Pennsylvania to the Marcus Hook export terminal, located on the Delaware River.
Sunoco’s applications were to satisfy the state’s Chapter 105 (water obstruction and encroachment) and Chapter 102 (erosion/sediment control and earth disturbance) permitting requirements. The DEP responded to Sunoco’s application, issuing 20 deficiency letters totaling more than 550 pages. Sunoco resubmitted their application in the summer of 2016 and the DEP again rejected many of its plans to disturb streams, ponds, and wetlands. In December, Sunoco resubmitted its revised application for a third time, hoping for final approval.
FracTracker Alliance first wrote about ME 2’s risks to watershed in August 2016, following Sunoco’s second application. Readers who want a general overview of the issues may find that article worth reading. In this new article, we dig deeper into the subject. Along with its December application, Sunoco also supplied the DEP with revised GIS files illustrating ME 2’s new route and documents summarizing its impacts to nearby water bodies. We have created a new map utilizing newly available data and provide contextual analysis valuable in determining how Sunoco responds to the DEP’s review of its prior rejected applications.
Detailed Mapping of Water Body Impacts
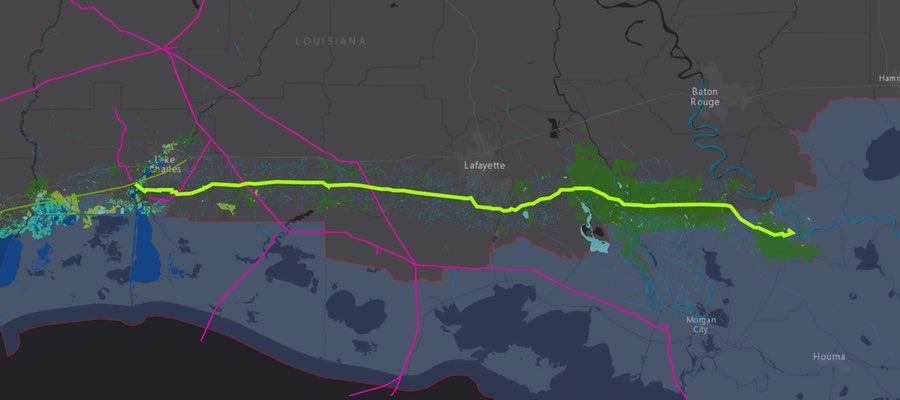
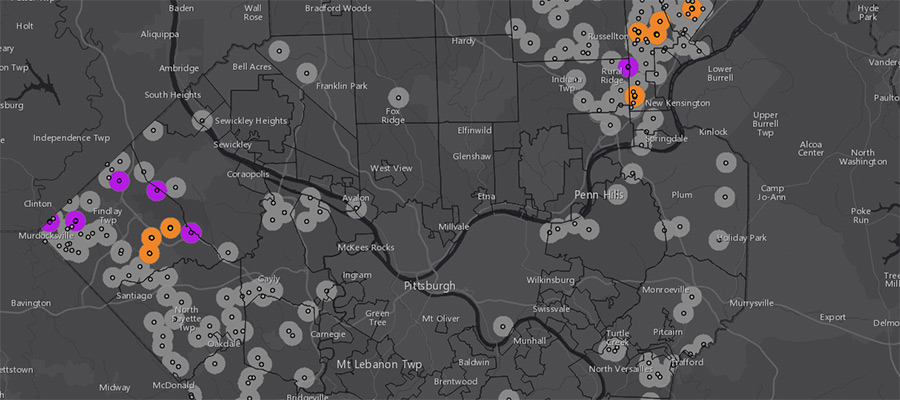
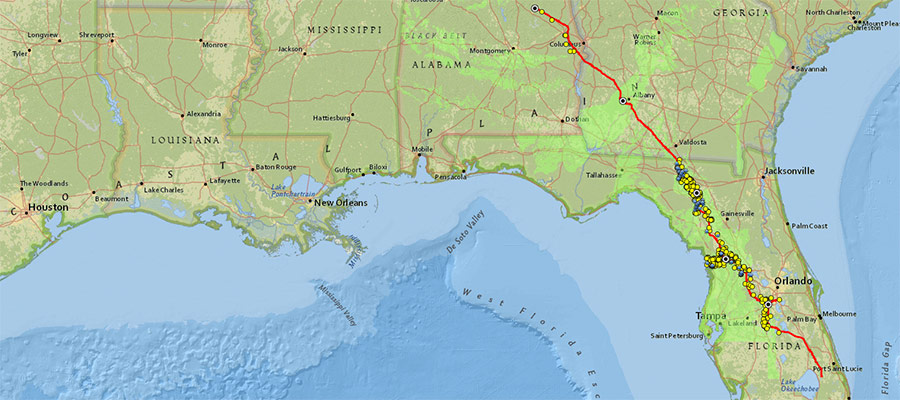
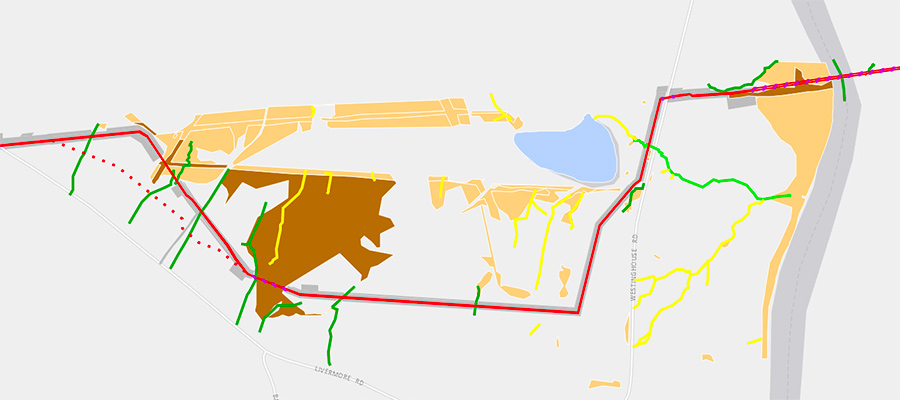
At the end of December, the DEP finally released Sunoco’s GIS files detailing water bodies that will be impacted by ME 2, as well as Sunoco’s data tables outlining alternative methods that might mitigate certain impacts. Our map (below) combines these new datasets to show the locations where ME 2’s route has changed since Sunoco’s initial application, presumably in response to the DEP’s technical deficiency letter.
Also on this map are water bodies: 1) implicated in ME 2’s environmental impact assessment, 2) determined by the DEP as likely impacted by construction, and 3) identified by Sunoco as having viable construction alternatives to mitigate impacts.
Mariner East 2 Technical Deficiencies Map
View map fullscreen | How FracTracker maps work
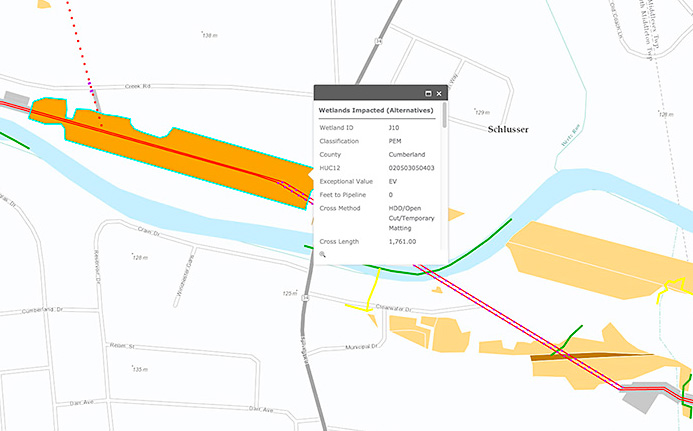
By viewing the map fullscreen and zooming in, one can click on a water feature to reveal its data tables (see below example). These tables contain information on the water body’s flow regime, the extent of permanent and temporary impacts, alternative crossing methods that could be used, and what benefits might come from those alternate methods. Also in the tables are a number of designations such as:
- USGS Fish and Wildlife wetland classification (see guide). Most common are PEM (palustrine emergent wetland), PSS (palustrine scrub-shrub wetland), PFO (palustrine forested wetland), and PuB (palustrine unconsolidated bottom – i.e. ponds).
- PA DEP stream designation (see guide). Most common are WWF (warm water fishes), CWF (cold water fishes), HQ (high quality), and EV (exceptional value).
- PA Fish and Boat Commission classifications (see guide). Most common are ATW (approved trout water), STS (stocked trout stream), Class A (class A water), and WTS (wilderness trout stream).
An example water body data table that can be found on the map:
Our analysis of this new data reveals the number of water crossings in question is significantly higher than what we estimated in August: now totaling 1,222 streams, 34 ponds, and 708 wetlands crossings. This increase is primarily due to Sunoco’s data also containing information on ephemeral and intermittent waters that are not typically accounted for in USGS data (all that was available at the time of our prior analysis).
Defining Impacts
The DEP’s Chapter 105 Joint Permit Application Instructions break down “impacts” into two broad categories: permanent and temporary. These are primarily used to assess environmental impact fees, but are also valuable in determining what parameters Sunoco will be held to during and after ME 2’s construction.
Permanent impacts: are “areas affected by a water obstruction or encroachment that consist of both direct and indirect impacts that result from the placement or construction of a water obstruction or encroachment and include areas necessary for the operation and maintenance of the water obstruction or encroachment located in, along or across, or projecting into a watercourse, floodway or body of water.”
Permanent impacts are calculated using the pipeline’s 50-foot permanent right-of-way. For streams, all bed and banks are to be restored to pre-construction conditions. For ponds and wetlands, permanent impacts are assumed to remain even if the area is considered restored.
Temporary impacts: are “areas affected during the construction of a water obstruction or encroachment that consists of both direct and indirect impacts located in, along or across, or projecting into a watercourse, floodway or body of water that are restored upon completion of construction.” Temporary impacts consist of areas such as temporary workspaces and access roads.
The below table lists the total impacted acres broken down by county. Of interest here is that more than 175 acres would be permanently impacted — equivalent to 134 football fields — with an additional 82 acres temporarily impacted.
Table 1. Impacted Acres by County
| County | Permanent Impacts (acres) | Temporary Impacts (acre) |
| Allegheny | 1.85 | 0.39 |
| Berks | 11.14 | 4.88 |
| Blair | 11.70 | 6.72 |
| Cambria | 20.21 | 8.48 |
| Chester | 10.30 | 3.92 |
| Cumberland | 24.06 | 7.61 |
| Dauphin | 8.12 | 6.55 |
| Delaware | 5.05 | 3.33 |
| Huntingdon | 18.75 | 8.04 |
| Indiana | 11.42 | 4.73 |
| Juniata | 5.25 | 3.02 |
| Lancaster | 4.65 | 1.66 |
| Lebanon | 6.48 | 2.53 |
| Perry | 5.58 | 2.63 |
| Washington | 9.37 | 2.94 |
| Westmoreland | 17.72 | 12.36 |
| York | 3.46 | 2.16 |
| Total | 175.12 | 81.93 |
Viable Options to Reduce Impacts
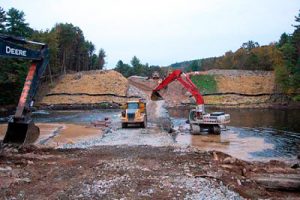
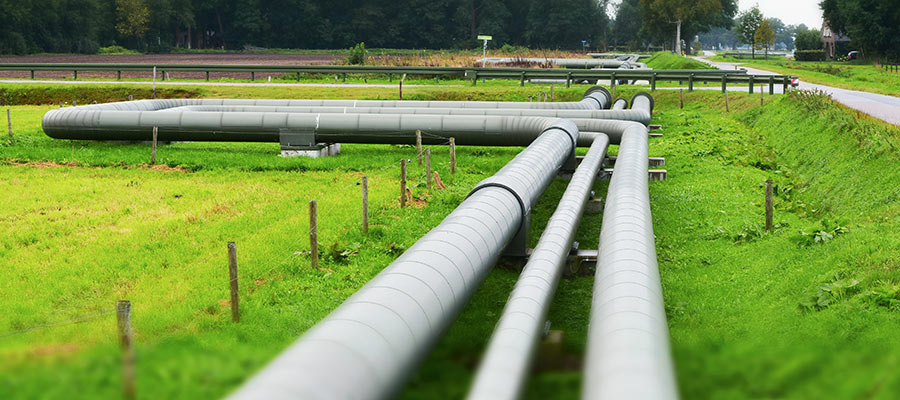
An open cut wet crossing (image source)
Pipeline companies cross water bodies using a variety of methods depending on their classification. The DEP maintains three general categories for water crossings: minor (in streams less than or equal to 10 feet wide at the water’s edge at the time of construction), intermediate (perennial stream crossings greater than 10 feet wide but less than 100 feet wide at the water’s edge at the time of construction), and major (crossings of more than 100 feet at the water’s edge at the time of construction).
Minor and intermediate crossings often employ rudimentary trenching along “open cut” crossings where the water is either temporarily diverted (wet crossing) or allowed to flow during construction (wet crossing). After the cuts, the company attempts to repair damage done in the process of trenching.
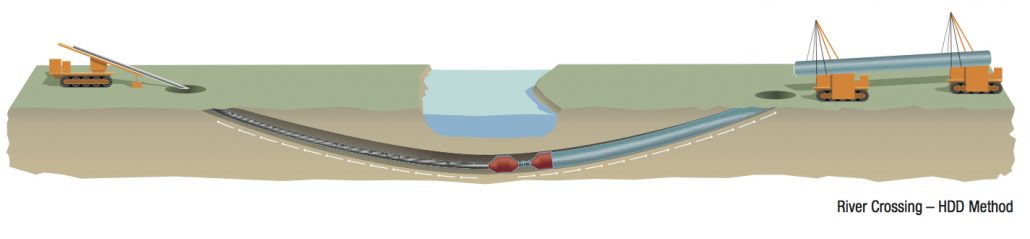
In more sensitive places, such as in exceptional value streams, wetlands, and always in major crossings, a company uses conventional boring to tunnel under a water feature. When boring over long distances, such as under a lake or river, a company turns to Horizontal Directional Drilling (HDD), a more engineered form of boring. An example of HDD boring is seen below (image source):
We were surprised by the number of water crossings identified by Sunoco as having options to minimize impact. As the table below shows, more than 44% (869) of Sunoco’s crossings have an alternate method identified in the resubmitted applications. In most of these instances, the intended crossing method is either trenching through open cuts or dry crossings. The majority of identified alternatives would reduce impacts simply by altering the trenching route. 53 of the 869 were shown to have feasible conditions for conventional or HDD boring, but Sunoco categorized all of these as impracticable options despite their environmental benefits.
Table 2. Number of Crossings With and Without Viable Alternate Methods
| Crossings | Assessed but Unimpacted | Impacted with No Alternative | Impacted with Alternatives | Total |
| Streams | 313 | 925 | 297 | 1,535 |
| Ponds | 66 | 3 | 31 | 100 |
| Wetlands | 963 | 167 | 541 | 1,671 |
| 1,342 | 1,095 | 869 | 3,306 |
Absorbing the Costs of Environmental Impacts
If executed, these alternative methods would decrease the length of crossings, limit right-of-way encroachments, prevent land fragmentation, and significantly reduce risks to larger water bodies. More likely, Sunoco will pay the impact fees associated with the less complicated crossing methods. We’ve summarized these fees (found in Sunoco’s resubmitted application) in the table below. In total, Sunoco would pay roughly $1.8 million in exchange for nearly 2,000 water body crossings – a fraction of the project’s $2.5 billion estimated cost:
Table 3. Impact Fees for Sunoco’s Preferred Crossings
| County | Permanent Impacts area (fees) | Temporary Impact area (fees) | Admin Fees | Total Fees |
| Allegheny | $15,200 | $1,600 | $1,750 | $18,550 |
| Berks | $89,600 | $19,600 | $1,750 | $110,950 |
| Blair | $94,400 | $27,200 | $1,750 | $123,350 |
| Cambria | $162,400 | $34,000 | $1,750 | $198,150 |
| Chester | $83,200 | $16,000 | $1,750 | $100,950 |
| Cumberland | $192,800 | $30,800 | $1,750 | $225,350 |
| Dauphin | $65,600 | $26,400 | $1,750 | $93,750 |
| Delaware | $40,800 | $13,600 | $1,750 | $56,150 |
| Huntingdon | $150,400 | $32,400 | $1,750 | $184,550 |
| Indiana | $92,000 | $19,200 | $1,750 | $112,950 |
| Juniata | $42,400 | $12,400 | $1,750 | $56,550 |
| Lancaster | $37,600 | $6,800 | $1,750 | $46,150 |
| Lebanon | $52,000 | $10,400 | $1,750 | $64,150 |
| Perry | $44,800 | $10,800 | $1,750 | $57,350 |
| Washington | $75,200 | $12,000 | $1,750 | $88,950 |
| Westmoreland | $142,400 | $50,000 | $1,750 | $194,150 |
| York | $28,000 | $8,800 | $1,750 | $38,550 |
| $1,408,800 | $332,000 | $29,750 | $1,770,550 |
Conclusion
This week, acting DEP Secretary Patrick McDonnell met with residents who voiced frustration that the agency failed to provide an additional public comment period following Sunoco’s application resubmission. Nevertheless, the DEP is expected to greenlight Sunoco’s plans any day now, adding another to the list of recent pipeline approvals in the region. Sunoco needs its permits now in order to begin clearing trees prior to endangered species bat nesting season, which begins in April.
Meanwhile, communities along the pipeline’s path are preparing for the sudden wave of disruption that may ensue. Some have threatened lawsuits, arguing that the resubmitted application still contains many deficiencies including missing wetlands and private drinking wells that must be accounted for. Indeed, the map and data presented in this article confirms that there is still a lot that the general public does not know about ME 2 – in particular, the extent of water impacts the DEP seems willing to accept and the range of options at Sunoco’s disposal that might mitigate those impacts if it were forced to do so.
Finally, it is encouraging to see that the DEP is becoming more transparent in sharing datasets, compared to other pipeline projects. However, this data is complex and not easily understood without sufficient technical expertise. We are discouraged to think that it is unlikely the public will learn about additional changes to the construction plan until after permits are issued. In order for data to be useful, it must be made available throughout the process, not at the end stages of planning, and done so in a way that it becomes integrated into the agency’s public participation responsibilities.
by Kirk Jalbert, Manager of Community-Based Research & Engagement