California is once again a fracked state. The moratorium on well stimulations (hydraulic fracturing and acidizing) that lasted since June 26, 2019 has now come to an end. As of April 3rd, 2020, California’s oil and gas regulatory body, California Geological Energy Management Division (CalGEM), approved 24 new permits to frack new wells. The wells were permitted to the operator Aera Energy. Well types to be fracked include 22 oil and gas production wells and 2 water flood wells; 18 of which are in the South Belridge Field and 6 North Belridge Field. Locations of the wells are shown in the map in Figure 1, and are mapped with the rest of 2020’s approved well drilling and rework permits in Consumer Watchdog’s updated release on NewsomWellWatch.com. Please read our press release with Consumer Watchdog here!
Figure 1. Map of New Fracking Permits in California
Fortunately, these 24 approved well stimulation permits are not located in close proximity to communities that would be directly impacted by the negative contributions to air quality and potential groundwater quality degradation that result from drilling and stimulating oil and gas wells. Regardless of where oil and gas wells and stimulations are permitted in relation to Frontline Communities, these wells will still degrade the regional air quality of the San Joaquin Valley. The San Joaquin Valley has the worst air quality in the country. According to the U.S. EPA, oil and gas production is a main contributor of volatile organic compounds (VOC’s) and NOX in the Valley. In addition to VOC’s being carcinogens, these pollutants are precursors to the ozone and smog that cause health impacts such as asthma, chronic obstructive pulmonary disease (COPD), cardiovascular disease, and negative birth outcomes.
Geology and Spills
Additionally, the dolomite formations where these 24 stimulations were permitted have also experienced the same type of oil seeps and spills (known as surface expressions) as the Cymric Field just to the south. Readers may remember the operator Chevron spilling 1.3 million gallons of oil and wastewater in an uncontrollable seep resulting from high pressure injection wells.
Whereas Governor Newsom may have put a halt to unpermitted high-pressure injections, regulators have just approved permits for 24 new fracking operations, a.k.a well stimulations. The irony here is that risks inherent in the fracking process in California include the same risks associated withhigh pressure steam injection operations. Both techniques elevate the downhole pressure of a well to the point that the formation “source” rock is fractured. These techniques increase the likelihood of downhole communication with other surrounding wells, both active and plugged. Downhole communication events between wells, in this case known as “frack hits” are a major cause of well casing failures and blowouts, which in turn are the primary cause of surface expressions. Simply put, high pressure injections in over-developed oil fields result in spills, and in this case, these 24 permitted stimulations are within 1,500’ of over 7,000 existing wells, a distance specifically identified by CalGEM as a high-risk zone for downhole communication between wells.
Regulation
So how did these wells get approved? Here’s the story, as told by CalGEM:
In November, CalGEM requested a third-party scientific review of pending well stimulation permit applications to ensure the state’s technical standards for public health, safety and environmental protection are met prior to approval of each permit. To ensure the proposed permits comply with California law, including the state’s technical standards to protect public health, safety, and environmental protection, the Department of Conservation asked experts at the Lawrence Livermore National Laboratory (LLNL) to assess CalGEM’s permit review process. LLNL also evaluated the completeness of operators’ application materials and CalGEM’s engineering and geologic analyses.
The independent scientific review is one of Governor Newsom’s initiatives to ensure oil and gas regulations protect public health, safety, and environmental protection. This review, which assesses the completeness of each proposed hydraulic fracturing permit, is taking place as an interim measure while a broader audit is completed of CalGEM’s permitting process for well stimulation. That audit is being completed by the Department of Finance Office of Audits and Evaluation (OSAE) and will be completed and shared publicly later this year. LLNL experts are continuing evaluation on a permit-by-permit basis and conducting a rigorous technical review to verify geological claims made by well operators in the application process. Permit by permit review will continue until the Department of Finance Audit is complete later this year.
LLNL’s scientific review of the permit applications and process found that the permitting process met statutory and regulatory requirements. LLNL found, however, that CalGEM could improve its evaluation of the technical models used in the permit approval process. As a result, CalGEM now requires all operators to provide an Axial Dimensional Stimulation Area (ADSA) Narrative Report for each oilfield and fracture interval which must be validated by LLNL and conform to the new CalGEM permitting process. This will improve CalGEM’s ability to independently validate applicants’ fracture modeling.
While this sounds like a methodological approach to the permitting process, it is still flawed in several ways. First and foremost, there is still no process for community input, let alone community decision-making. Community stakeholders are not engaged at in point in this process. Furthermore the contribution of oil and gas extraction operations to the degradation of environmental quality is already well established. In the case of these 24 fracking permits, they will contribute to the further degradation of regional air quality and continue the legacy of groundwater contamination within the sacrifice zone surrounding the Belridge fields.
Fracking in the Age of Pandemics
While we are critical of Governor Newsom’s climate-changing oil extraction policies, FracTracker would like to recognize the leadership Governor Newsom has shown instituting responsible policies to keep Californians as safe as possible and protected from the threat of COVID-19. While there can still be more done to provide relief for the most financially vulnerable, such as instituting a rent moratorium for those that do not own their own homes, California leads as an example for the public health interventions that need to be instituted nation-wide. The Governors inclusion of undocumented citizens in the state’s economic stimulus program is a first step, and FracTracker Alliance fully supports increasing the amount to at least match the $1,200 provided to the rest of Californians.
Conclusion
Regardless, the threat of COVID-19 cannot be addressed in a vacuum. Threats of infection are magnified for Frontline Communities. Living near oil and gas operations exposes communities to a cocktail of volatile organic compounds that suppress the immune system, increasing the risk of contracting viral lung infections. Frontline Communities are therefore particularly vulnerable to the threat of COVID-19. California and Governor Newsom need to consider the public health implications of permitting new fracking and new oil and gas wells, particularly those permits within 2,500’ of hospitals, schools, and other sensitive sites, above all during an existing pandemic.
By Kyle Ferrar, MPH, Western Program Coordinator, FracTracker Alliance
https://www.fractracker.org/a5ej20sjfwe/wp-content/uploads/2020/04/Map-of-New-2020-Fracking-Permits-in-California.jpg7201500Kyle Ferrar, MPHhttps://www.fractracker.org/a5ej20sjfwe/wp-content/uploads/2025/09/2025-Wordmark-Logo.pngKyle Ferrar, MPH2020-05-07 12:48:132021-04-15 14:16:49California, Back in Frack
In the 2018 The Sky’s Limit report by Oil Change International (OCI),4 FracTracker’s analysis showed that 8,493 active or newly permitted oil and gas wells were located within a 2,500’ buffer of sensitive sites including occupied dwellings, schools, hospitals, and playgrounds. At the time, it was estimated that over 850,000 Californians lived within the setback distance of at least one of these oil and gas wells.
An assessment of the number of California citizens living proximal to active oil and gas production wells was also conducted for the CCST State Bill 4 Report on Well Stimulation in 2016.5 The analysis calculated the number of California residents living within 2,500’ of an active (producing) oil and gas well, and based estimates of demographic percentages on 2015 ACS data at the census block level. The report found that:
859,699 individuals in California live within 2,500’ of an active oil and gas well
Of this, a total of 385,067 are “Non-white” (45%)
Of this, a total of 341,231 are “Hispanic” (40%) *[as defined by the U.S. Census Bureau]
Population counts within the setbacks were calculated for smaller census designated areas including counties and census tracts. The results of the calculations are presented in Table 1 and the analysis is shown in the maps in Figure 1 and Figure 2 below.
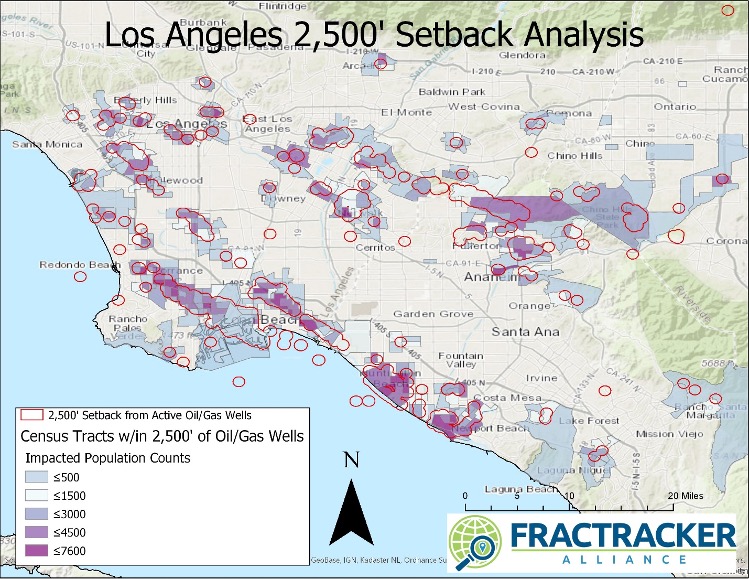
Data for the City of Los Angeles was also aggregated. Results showed:
215,624 individuals in the City of Los Angeles live within 2,500’ of an active oil and gas well
Of this, a total of 114,593 are “Non-white” (53%)
Of this, a total of 119,563 are “Hispanic” (55%) *[as defined by the U.S. Census Bureau]
Table 1. Population Counts by County. The table presents the counts of individuals living within 2,500’ of an active oil and gas well, aggregated by county. The top 12 counties with the highest population counts are shown. “Impacted Population” is the count of individuals estimated to live within 2,500’ of an oil and gas well. The “% Non-white” and “% Hispanic” columns report the estimated percentage of the impacted population of said demographic.
County
Total Pop.
Impacted Pop.
Impacted % Non-white
Impacted % Hispanic
Los Angeles
9,818,605
541,818
0.54
0.46
Orange
3,010,232
202,450
0.25
0.19
Kern
839,631
71,506
0.34
0.43
Santa Barbara
423,895
8,821
0.44
0.71
Ventura
823,318
8,555
0.37
0.59
San Bernardino
2,035,210
6,900
0.42
0.59
Riverside
2,189,641
5,835
0.46
0.33
Fresno
930,450
2,477
0.34
0.50
San Joaquin
685,306
2,451
0.55
0.42
Solano
413,344
2,430
0.15
0.15
Colusa
21,419
1,920
0.39
0.70
Contra Costa
1,049,025
1,174
0.35
0.30
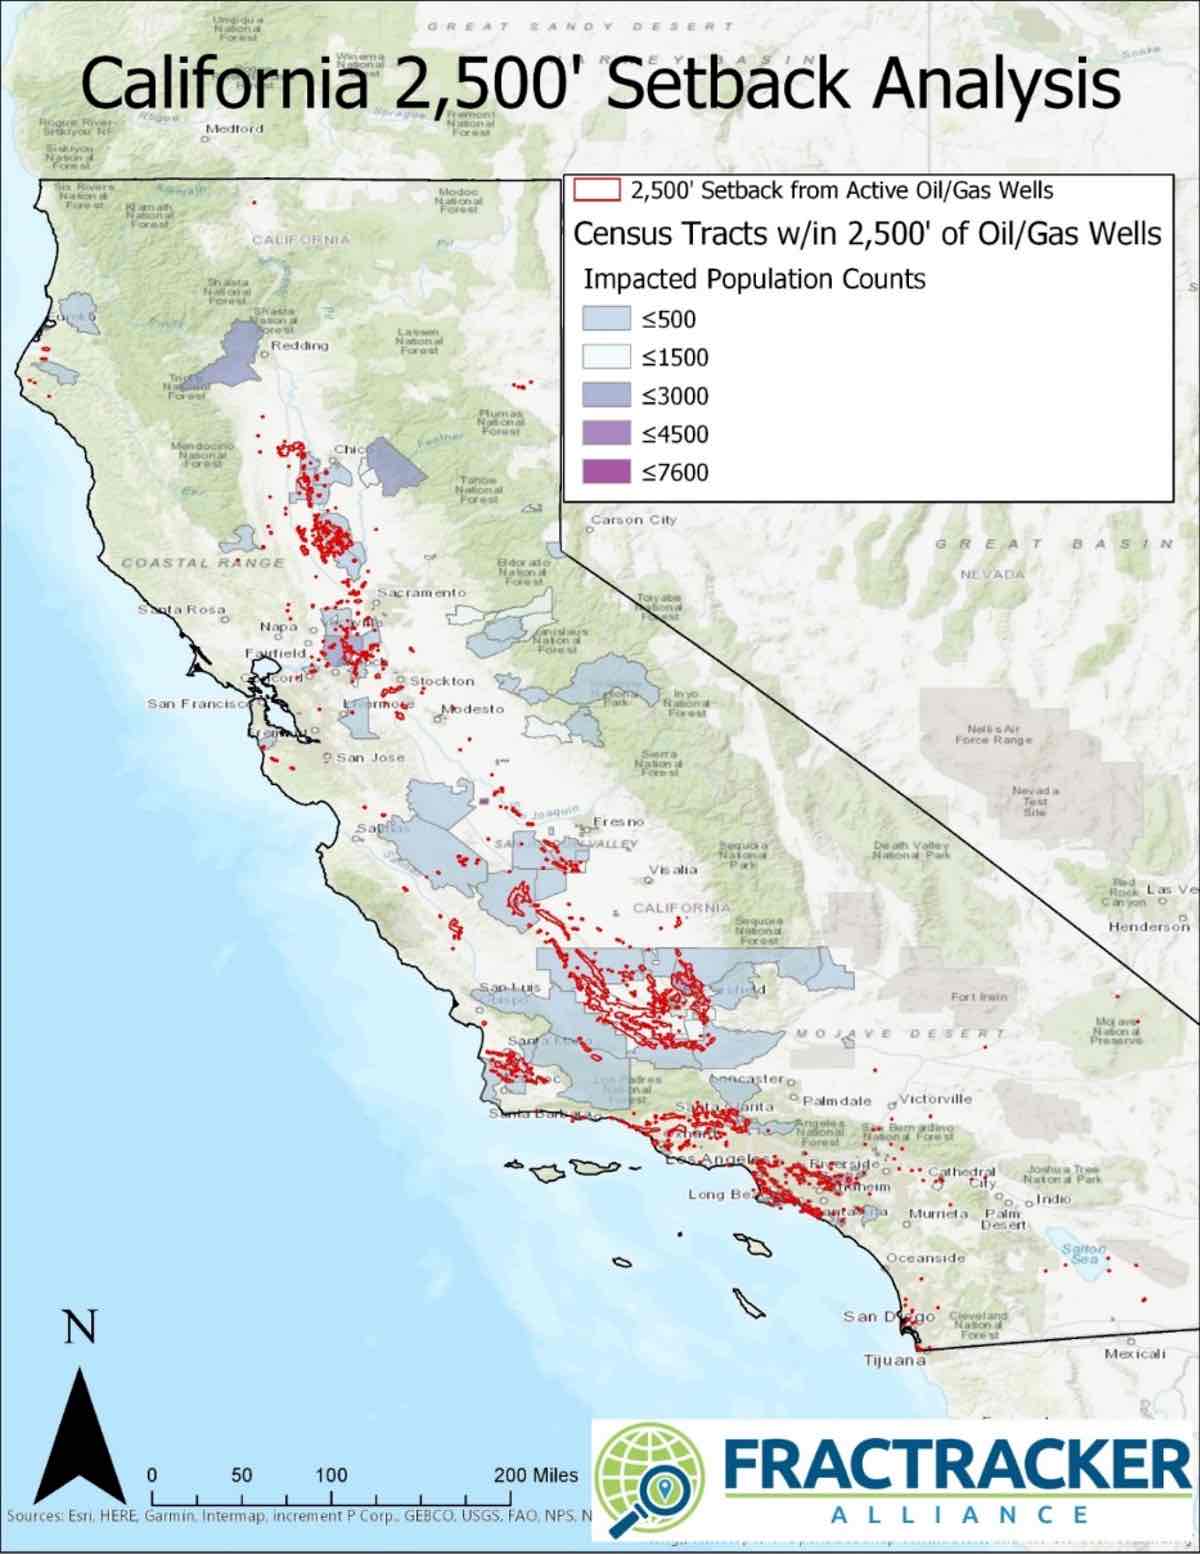
Figure 1. Map of impacted census tracts for a 2,500’ setback in California. The map shows areas of California that would be impacted by a 2,500’ setback from active oil and gas wells in California.
Figure 2. Map of impacted census tracts for a 2,500’ setback in Los Angeles. The map shows areas of California that would be impacted by a 2,500’ setback from active oil and gas wells in Los Angeles.
From the analysis we find that the majority of California citizens living near active production wells are located in Los Angeles County. This amounts to 61% of the total count of individuals within 2,500’ in the full state. Additionally, the well sample population is limited to only wells that are reported with an “active” status. Including wells identified as idle or support wells such as Class II injection or EOR wells would increase both the total numbers and the demographical percentages because of the high population density in Los Angeles.
Well Counts – Updated Data
Using California Geologic Energy Management Division (CALGEM) data published March 1, 2020, we find that there are 105,808 wells reported as Active/Idle/New in California. There are 16,690 are located within 2,500′ of a sensitive receptor (15.77%). Of the 74,775 active wells in the state, 9,835 fall within the 2,500’ setback distance.6
There are 6,558 idle wells that fall within the 2500’ setback distance, of nearly 30,000 idle wells in the state. Putting these idle wells back online would be blocked if they required reworks to ramp up production. For the most part operators do not intend for most idle wells to come back online. Rather they are just avoiding the costs of plugging.
Of the 3,783 permitted wells not yet in production, or “new wells,” 298 are located within the 2,500’ buffer zone (235 in Kern County).
In Los Angeles, Rule 1148.2 requires operators to notify the South Coast Air Quality Management District of activities at well sites, including permit approvals for stimulations and reworks. Of the 1,361 reports made to the air district since the beginning of 2018 through April 1, 2019; 634 (47%) were for wells that would be impacted by the setback distance; 412 reports were for something other than “well maintenance” of which 348 were for gravel packing, 4 for matrix acidizing, and 65 were for well drilling.
We also analyzed data reported to DOGGR under the well stimulation requirements of SB4. From 1/1/2016 to 4/1/19 there were 576 well stimulation treatment permits granted under the SB4 regulations. Only 1 hydraulic fracturing event, permitted in Goleta, would have been impacted by a 2,500’ setback.
Production
Also part of the OCI The Sky’s Limit report,4 we approximated the amount of oil produced from wells within 2,500’ of sensitive receptors. Using the API numbers of wells identified as being within the buffer area, we pulled production data for each well from the Division of Oil, Gas, and Geothermal Resources (DOGGR) database. The results are based on 2016 production data, the latest complete data available at the time of the analysis. The data indicated that 12% of statewide production came from wells within the buffer zone in 2016. Looking at the production data for a full 6 year period (2010 – 2016), production from wells within the buffer zone was 10% on average statewide. Limiting the analysis to only Kern County, the result was actually smaller. About 5% of countywide production in 2016 (6.1 million barrels) was found to come from wells in the buffer zone.
Low Income Communities
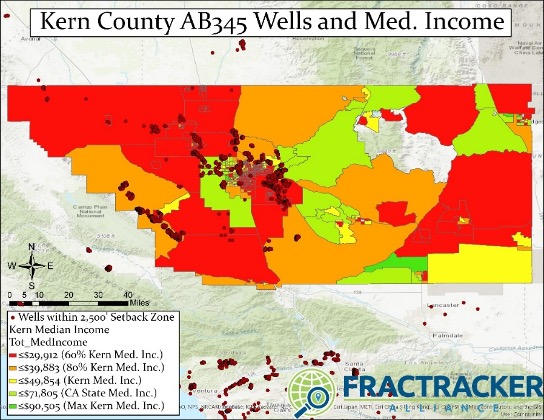
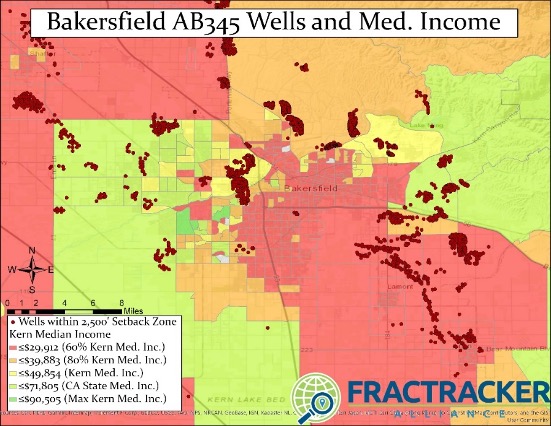
FracTracker conducted an analysis in Kern County for the California Environmental Justice Alliance’s 2018 Environmental Justice Agency Assessment.7 We assessed the proportions of wells near sensitive receptors that are located in low-income communities (at or below 80% of the Kern County Average Median Income). We found that 5,229 active/idle/new oil and gas wells were within 2,500’ from sensitive receptors in low-income communities, including 3,700 active, 1,346 idle, and 183 newly permitted “new” oil and gas wells. The maps in Figures 3 and 4 below show these areas of Kern County and specifically Bakersfield, California.
FracTracker’s analysis of low income communities in Kern County showed the following:
There are 16,690 active oil and gas production wells located in census blocks with median household incomes of less than 80% of Kern’s area median income (AMI).
Therefore about 25% (16,690 out of 67,327 total) of Kern’s oil and gas wells are located within low-income communities.
Of these 16,690 wells, 5,364 of them are located within the 2,500′ setback distance from sensitive receptor sites such as schools and hospitals (32%), versus 13.1% for the rest of the state.
Figure 3. Map of Kern County census tracts with wells impacted by a 2,500’ setback, with median income brackets.
Figure 4. Map of Kern County census tracts with wells impacted by a 2,500’ setback, with median income brackets.
Schools and Environmental Justice
FracTracker conducted an environmental justice analysis to investigate student demographics in schools near oil and gas drilling in California.8 The school enrollment data is from 2013 and the oil and gas wells data is from June 2014. For the analysis we used multiple distances, including 0.5 miles (about 2,500’). Based on the statistical comparisons in the report, we made the following conclusions:
Students attending school near at least one active oil and gas well are 10.5% more likely to be Hispanic.
Students attending school near at least one active oil and gas well are 6.7% more likely to be a minority.
There are 61,612 students who attend school within 1 mile of a stimulated oil or gas well, and 12,362 students who attend school within 0.5 miles of a stimulated oil or gas well.
School districts with greater Hispanic and non-white student enrollment are more likely to house wells that have been hydraulically fractured.
Schools campuses with greater Hispanic and non-white student enrollment are more likely to be closer to more oil and gas wells and wells that have been hydraulically fractured.
Students attending school within 1 mile of oil and gas wells are predominantly non-white (79.6%), and 60.3% are Hispanic.
The top 11 school districts with the highest well counts are located the San Joaquin Valley with 10 districts in Kern County and the other just north of Kern in Fresno County.
The two districts with the highest well counts are in Kern County: Taft Union High School District, host to 33,155 oil and gas wells; and Kern Union High School District, host to 19,800 oil and gas wells.
Of the schools with the most wells within a 1 mile radius, 8/10 are located in Los Angeles County.
There are 485 active/new oil and gas wells within 1 mile of a school and 177 active/new oil and gas wells within 0.5 miles of a school. This does not include idle wells.
There are 352,784 students who attend school within 1 mile of an oil or gas well, and 121,903 student who attend school within 0.5 miles of an oil or gas well. This does not include idle wells
Permits
In collaboration with Consumer Watchdog,9 we counted permit applications that were approved in 2018 during Governor Brown’s administration, as well as in 2019 and 2020 under Governor Newsom. The analysis included permits for drilling new wells, well reworks, deepening wells and well sidetracks. Almost 10% of permits issued during the first two months of 2020 have been issued within 2,500’ of sensitive receptors including homes, hospitals, schools, daycares, and nursing facilities. This is slightly lower than the average for all approved permits in 2019 (12.2%). In 2018, Governor Brown approved 4,369 permits, of which 518 permits (about 12%) were granted within the proposed 2,500’ setback.
Conclusion
FracTracker Alliance’s body of work in California provides a summary of the population demographics of communities most impacted by oil and gas extraction. It is clear that communities of color in Los Angeles and Kern County make up the majority of Frontline Communities. New oil and gas wells are not permitted in equitable locations and setbacks from currently active oil and gas extraction sites are an environmental justice necessity. Putting a ban on new permits and shutting down existing wells located within 2,500’ of sensitive receptors such as schools, hospitals, and homes would have a very small impact on overall production of oil in California. It is clear that the public health and environmental equity benefits of a 2,500’ setback far outweigh any and all drawbacks. We hope that the resources summarized in this article provide a useful source of condensed information for those that feel similarly.
References
Hays J, Shonkoff SBC. 2016. Toward an Understanding of the Environmental and Public Health Impacts of Unconventional Natural Gas Development: A Categorical Assessment of the Peer-Reviewed Scientific Literature, 2009-2015. PLOS ONE 11(4): e0154164. https://doi.org/10.1371/journal.pone.0154164Ferrar, K.
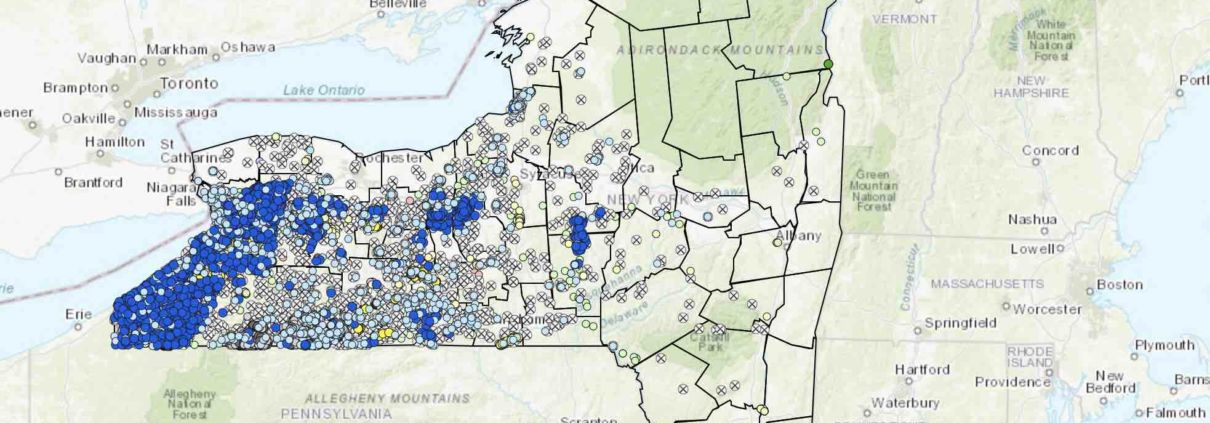
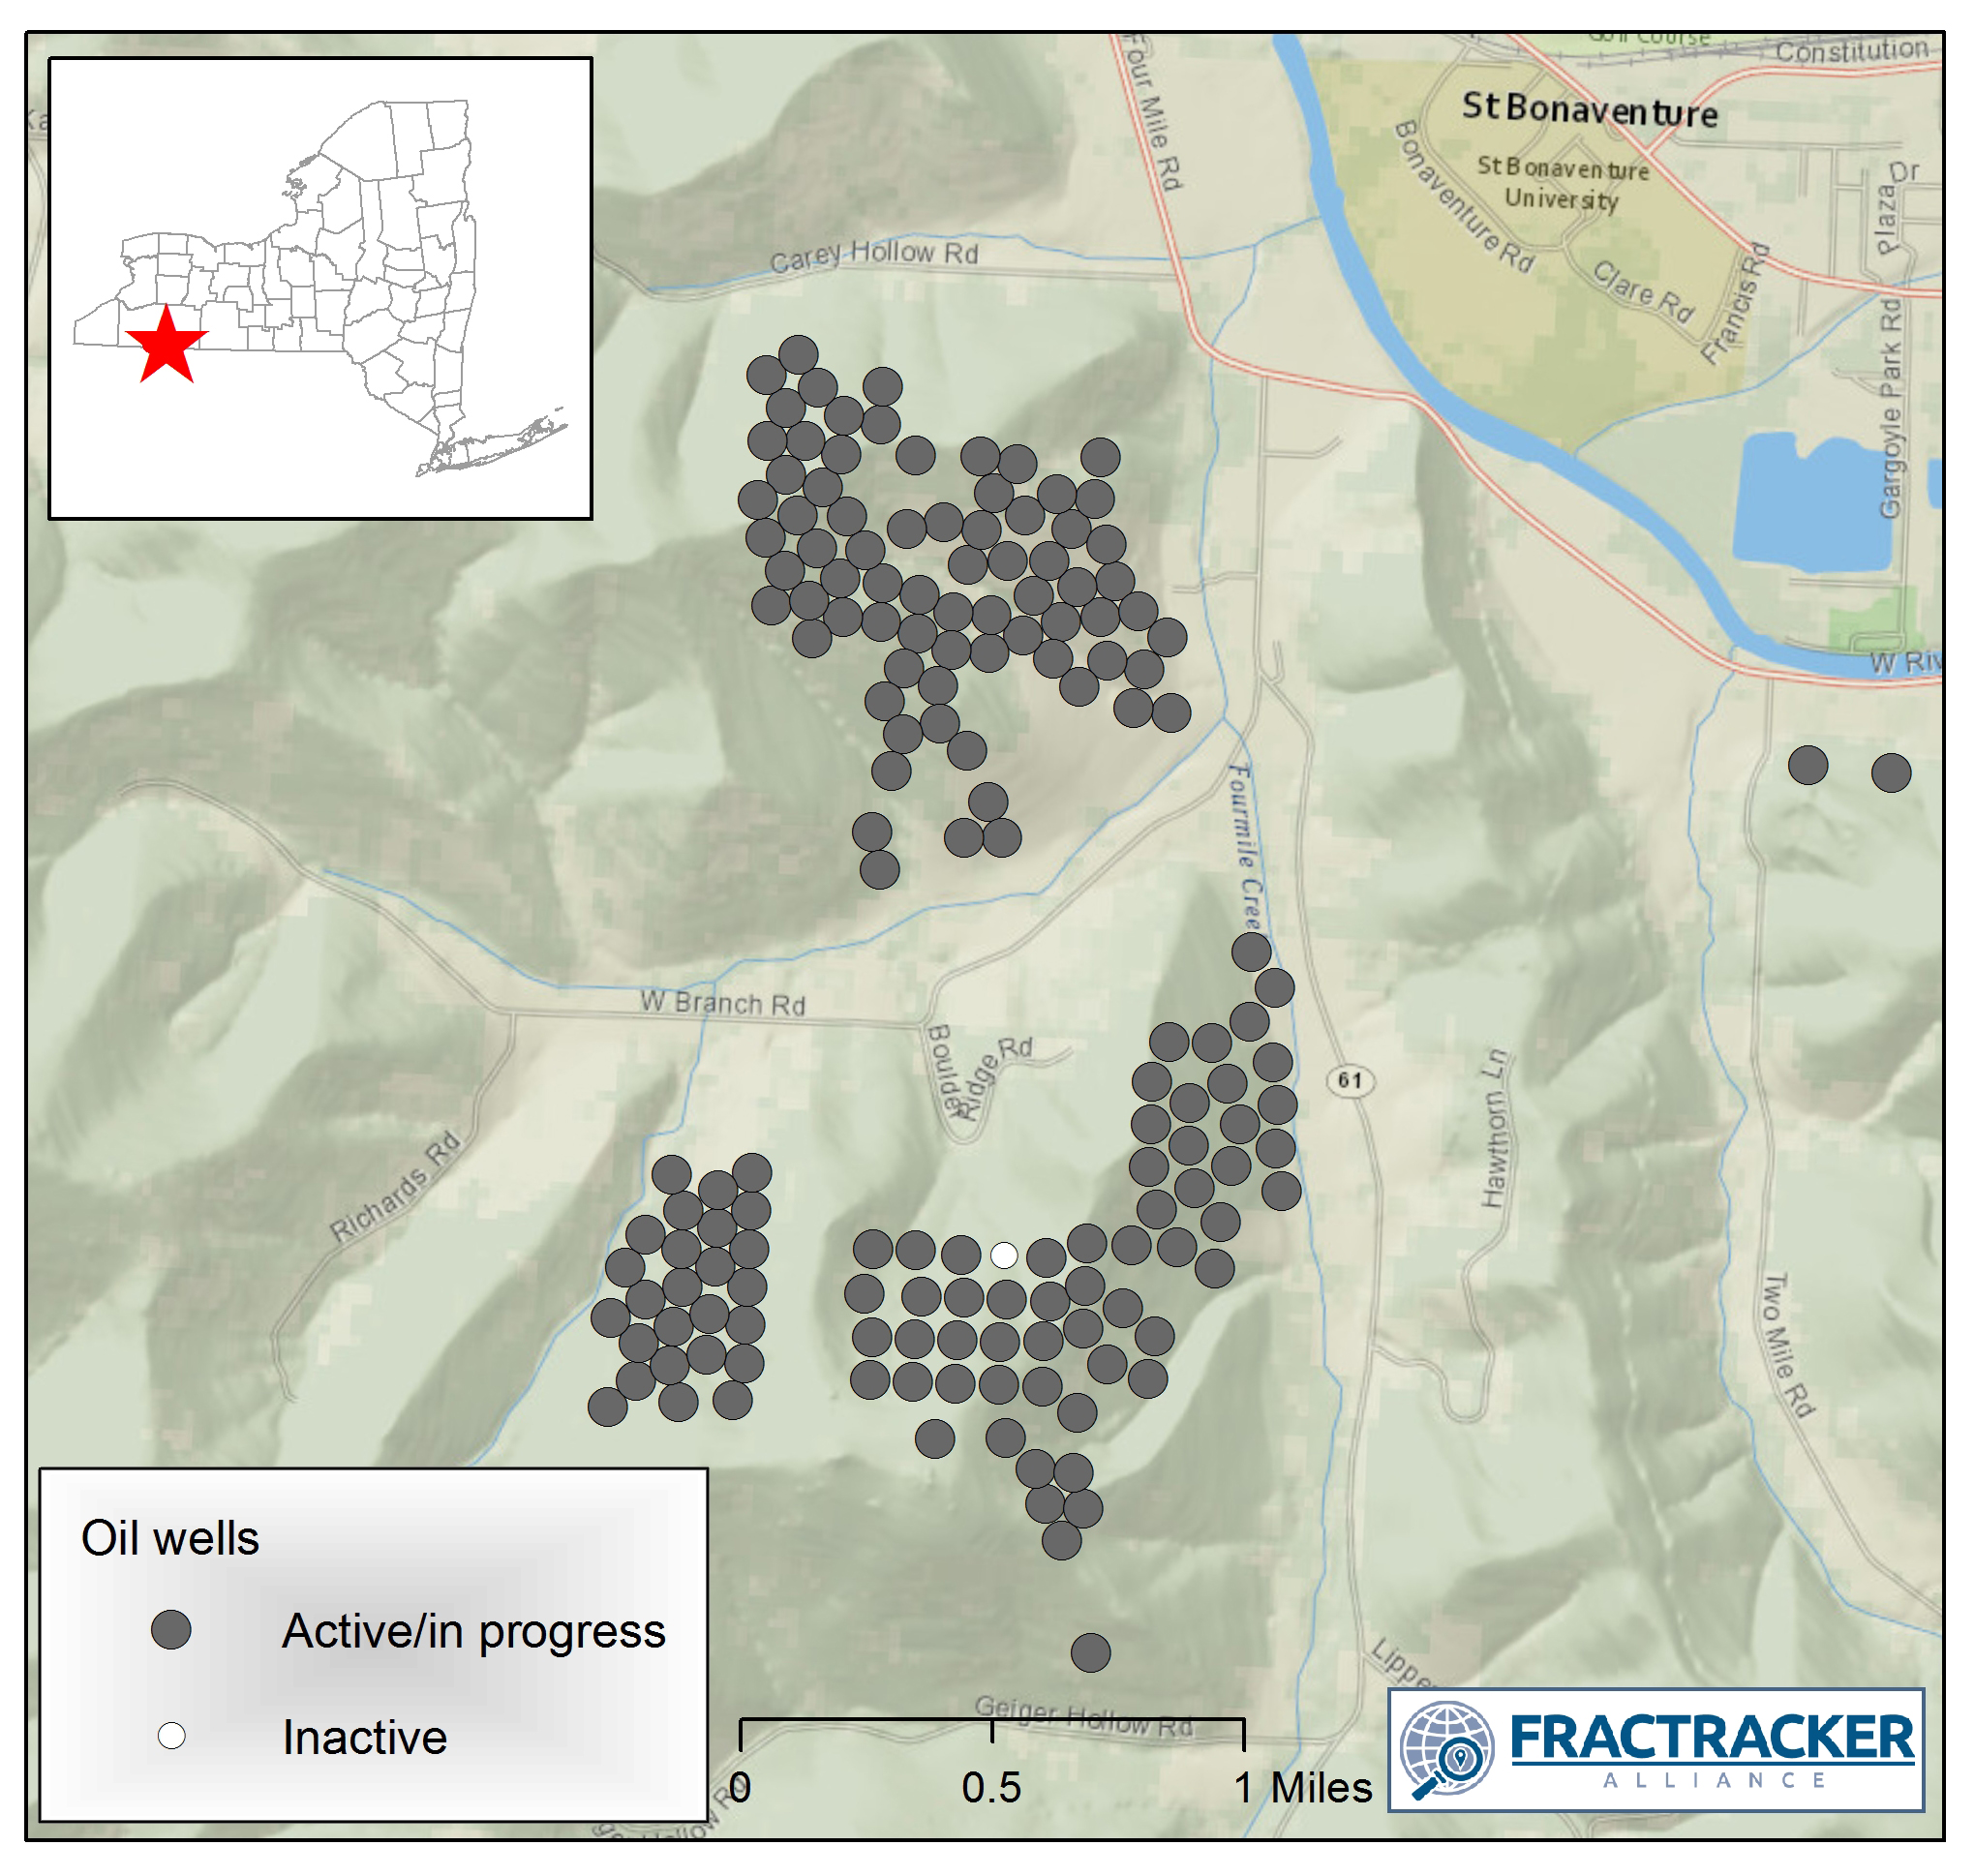
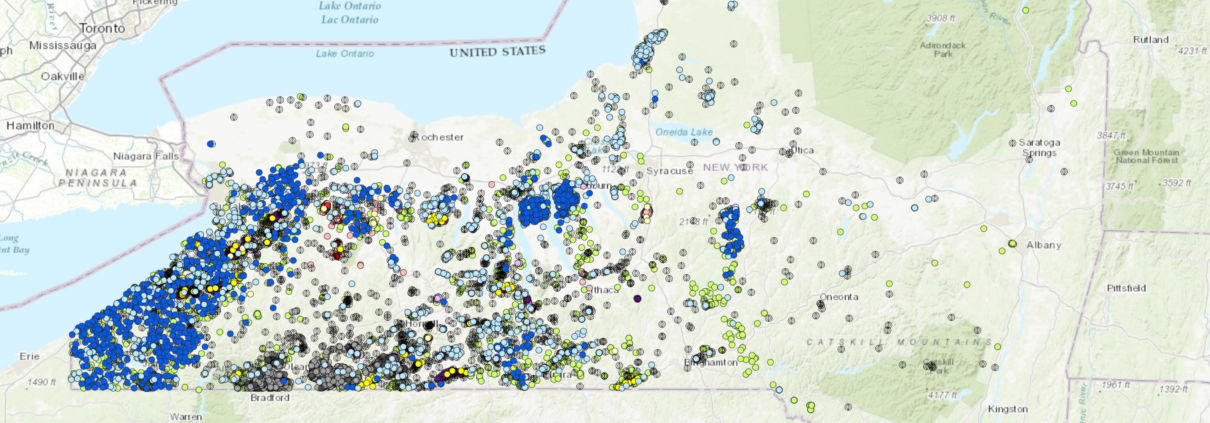
We’ve recently updated the New York State Oil and Gas Well Viewer with data up to 2020. The map and data below show that conventional gas drilling in New York State has decreased significantly since the first decade of 2000, but drilling for oil in western New York has increased in the past few years. In part thanks to the fracking ban in New York State, less than 1% of the wells in New York State have been drilled unconventionally.
These data are compiled by the New York State Department of Environmental Conservation on their Downloadable Well Data site, and mapped by FracTracker. Well data can either be accessed as a zipped file, or viewed on a well-by-well scale through a searchable database.
Summary
Currently, there are more active gas wells in New York State than all other types combined. Fewer than 1% of the wells in the New York State database have been drilled directionally or horizontally. And only a fraction of those were gas wells. Since 2014, high-volume hydraulic fracturing has been banned, due to health and environmental concerns.
Western New York State was once a very active region for oil drilling, but today, only 21% of all oil wells are still active. Additional well types include brine solution mines. Many of these mines, once a large enough cavern has been dissolved, are later converted into storage mines for gas.
Well type, as of 24 January 2020
Status = Active
Status = Other (includes plugged and abandoned, unlisted/unknown, converted, voided/expired permit, etc.)
Gas well
6,721 (58% of all active wells)
4,214 (13% of “other” categories)
Oil well
3,581 (31% of all active wells)
13,217 (40% of “other” categories)
Storage well
840 (7% of all active wells)
146 (<1% of “other” categories)
Monitoring well
165 (1% of all active wells)
311 (1% of “other” categories)
Brine well
138 (1% of all active wells)
593 (2% of “other” categories)
Other (145 geothermal, 7724 category not listed)
85 (1% of all active wells)
7,784 (23% of “other” categories)
Disposal well
36 (<1% of all active wells)
4,186 (13% of “other” categories)
Dry hole
4 (<1% of all active wells)
2,786 (8% of “other” categories)
Total
11,570
33,237
Patterns in Well Drilling
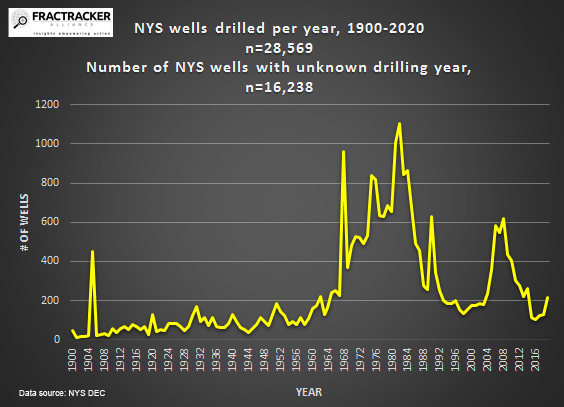
Well drilling in New York State was at a high point between the mid-1960s and the early 1990s. After another peak in activity in the first decade of the 21st century with conventional gas drilling, activity has dropped off sharply.
Figure 1. Oil and gas wells in New York State per year, 1990-2020. Data from NYS DEC.
A Potential Uptick in the Past Few Years
While gas drilling in New York State has tapered off dramatically, drilling for oil in Cattaraugus County in western New York has increased significantly since 2017.
Figure 2. Oil wells drilled in Cattaraugus County, New York, 2018-19. Data from NYS DEC.
Nearly every one of the 169 new wells drilled in New York State during 2019 was an oil well within 5 miles of St. Bonaventure in Cattaraugus County. We’ll be following up shortly with a more in-depth analysis of the issues and risks associated with this oil “boom” in the upper reaches of the Allegheny River of New York State.
https://www.fractracker.org/a5ej20sjfwe/wp-content/uploads/2020/03/New-York-State-Oil-Gas-Well-Viewer-2020.jpg12081966Karen Edelsteinhttps://www.fractracker.org/a5ej20sjfwe/wp-content/uploads/2025/09/2025-Wordmark-Logo.pngKaren Edelstein2020-03-11 12:07:052021-04-15 14:16:54New York State Oil & Gas Wells – 2020 Update
FracTracker Alliance has released a new national map, filled with energy and petrochemical data. Explore the map, continue reading to learn more, and see how your state measures up!
This map has been updated since this blog post was originally published, and therefore statistics and figures below may no longer correspond with the map
The items on the map (followed by facility count in parenthesis) include:
For oil and gas wells, view FracTracker’s state maps.
Transportation & Storage
Natural gas compressor stations (1,367) – Facilities built along a pipeline route that pressurize natural gas to keep it flowing through the pipeline.
Crude oil rail terminals (94) – Rail terminals that load and unload crude oil (liquid hydrocarbons that have yet to be processed into higher-value petroleum products).
Liquefied natural gas import/export terminals (8) – Facilities that can a) liquefy natural gas so it can be exported as LNG (liquefied natural gas) and/or b) re-gasify LNG so it can be used as natural gas. Natural gas is transported in a liquid state because it takes up less space as a liquid than as a gas.
Natural Gas Underground Storage (486) – Locations where natural gas is stored underground in aquifers, depleted gas fields, and salt formations.
Petroleum Product Terminals (1,484) – Terminals with a storage capacity of 50,000 barrels or more and/or the ability to receive volumes from tanker, barge, or pipeline. Petroleum products include products “produced from the processing of crude oil and other liquids at petroleum refineries, from extraction of liquid hydrocarbons at natural gas processing plants, and from production of finished petroleum products at blending facilities.”
Petroleum Ports (242) – A port that can import and/or export 200,000 or more short tons of petroleum products a year.
Natural gas import/export pipeline facility (54) – A facility where natural gas crosses the border of the continental United States.
Pipelines
Crude oil pipelines – major crude oil pipelines, including interstate truck lines and selected intrastate lines, but not including gathering lines.
Natural gas liquid pipelines – Also referred to as hydrocarbon gas liquid pipelines, they carry the heavier components of the natural gas stream which are liquid under intense pressure and extreme cold, but gas in normal conditions.
Natural gas pipelines– Interstate and intrastate natural gas pipelines. Due to the immensity of this pipeline network and lack of available data, this pipeline layer in particular varies in degree of accuracy.
Petroleum Product Pipelines – Major petroleum product pipelines.
Recent Pipeline Projects – Pipeline projects that have been announced since 2017. This includes projects in various stages, including under construction, complete, planned or canceled. Click on the pipeline for the status.
Processing & Downstream
Natural Gas Processing Plants (478) – Plants that separate impurities and components of the natural gas stream.
Chemical plants (36) – Includes two types of chemical plants – petrochemical production and ammonia manufacturing – that report to EPA’s Greenhouse Gas Reporting Program.
Ethylene Crackers (30) – Also referred to as ethane crackers, these petrochemical complexes that converts ethane (a natural gas liquid) into ethylene. Ethylene is used to make products like polyethylene plastic.
Petroleum Refineries (135) – A plant that processes crude oil into products like petroleum naphtha, diesel fuel, and gasoline.
Power Plants (9,414) – Electric generating plants with a capacity of at least one megawatt, sorted by energy source.
Wind Turbines (63,003) – Zoom in on wind power plants to see this legend item appear.
Natural Resources
Shale Plays (45) – Tight oil and gas shale plays, which are formations where oil and gas can be extracted.
Major Rivers
Solar Energy Potential – Potential solar energy generation, in kilowatt-hours per square meter per day – averaged annually.
This map is by no means exhaustive, but is exhausting. It takes a lot of infrastructure to meet the energy demands from industries, transportation, residents, and businesses – and the vast majority of these facilities are powered by fossil fuels. What can we learn about the state of our national energy ecosystem from visualizing this infrastructure? And with increasing urgency to decarbonize within the next one to three decades, how close are we to completely reengineering the way we make energy?
Key Takeaways
Natural gas accounts for 44% of electricity generation in the United States – more than any other source. Despite that, the cost per megawatt hour of electricity for renewable energy power plants is now cheaper than that of natural gas power plants.
The state generating the largest amount of solar energy is California, while wind energy is Texas. The state with the greatest relative solar energy is not technically a state – it’s D.C., where 18% of electricity generation is from solar, closely followed by Nevada at 17%. Iowa leads the country in relative wind energy production, at 45%.
The state generating the most amount of energy from both natural gas and coal is Texas. Relatively, West Virginia has the greatest reliance on coal for electricity (85%), and Rhode Island has the greatest percentage of natural gas (92%).
With 28% of total U.S. energy consumption for transportation, many of the refineries, crude oil and petroleum product pipelines, and terminals on this map are dedicated towards gasoline, diesel, and other fuel production.
Petrochemical production, which is expected to account for over a third of global oil demand growth by 2030, takes the form of chemical plants, ethylene crackers, and natural gas liquid pipelines on this map, largely concentrated in the Gulf Coast.
Electricity generation
The “power plant” legend item on this map contains facilities with an electric generating capacity of at least one megawatt, and includes independent power producers, electric utilities, commercial plants, and industrial plants. What does this data reveal?
In terms of the raw number of power plants – solar plants tops the list, with 2,916 facilities, followed by natural gas at 1,747.
In terms of megawatts of electricity generated, the picture is much different – with natural gas supplying the highest percentage of electricity (44%), much more than the second place source, which is coal at 21%, and far more than solar, which generates only 3% (Figure 1).
Figure 1. Electricity generation by source in the United States, 2019. Data from EIA.
This difference speaks to the decentralized nature of the solar industry, with more facilities producing less energy. At a glance, this may seem less efficient and more costly than the natural gas alternative, which has fewer plants producing more energy. But in reality, each of these natural gas plants depend on thousands of fracked wells – and they’re anything but efficient.
The cost per megawatt hour of electricity for a renewable energy power plants is now cheaper than that of fracked gas power plants. A report by the Rocky Mountain Institute, found “even as clean energy costs continue to fall, utilities and other investors have announced plans for over $70 billion in new gas-fired power plant construction through 2025. RMI research finds that 90% of this proposed capacity is more costly than equivalent [clean energy portfolios, which consist of wind, solar, and energy storage technologies] and, if those plants are built anyway, they would be uneconomic to continue operating in 2035.”
The economics side with renewables – but with solar, wind, geothermal comprising only 12% of the energy pie, and hydropower at 7%, do renewables have the capacity to meet the nation’s energy needs? Yes! Even the Energy Information Administration, a notorious skeptic of renewable energy’s potential, forecasted renewables would beat out natural gas in terms of electricity generation by 2050 in their 2020 Annual Energy Outlook.
This prediction doesn’t take into account any future legislation limiting fossil fuel infrastructure. A ban on fracking or policies under a Green New Deal could push renewables into the lead much sooner than 2050.
In a void of national leadership on the transition to cleaner energy, a few states have bolstered their renewable portfolio.
Figure 2. Electricity generation state-wide by source, 2019. Data from EIA.
One final factor to consider – the pie pieces on these state charts aren’t weighted equally, with some states’ capacity to generate electricity far greater than others. The top five electricity producers are Texas, California, Florida, Pennsylvania, and Illinois.
Transportation
In 2018, approximately 28% of total U.S. energy consumption was for transportation. To understand the scale of infrastructure that serves this sector, it’s helpful to click on the petroleum refineries, crude oil rail terminals, and crude oil pipelines on the map.
Transportation Fuel Infrastructure. Data from EIA.
The majority of gasoline we use in our cars in the US is produced domestically. Crude oil from wells goes to refineries to be processed into products like diesel fuel and gasoline. Gasoline is taken by pipelines, tanker, rail, or barge to storage terminals (add the “petroleum product terminal” and “petroleum product pipelines” legend items), and then by truck to be further processed and delivered to gas stations.
China leads the world in this movement. In 2018, just over half of the world’s electric vehicles sales occurred in China. Analysts predict that the country’s oil demand will peak in the next five years thanks to battery-powered vehicles and high-speed rail.
In the United States, the percentage of electric vehicles on the road is small but growing quickly. Tax credits and incentives will be important for encouraging this transition. Almost half of the country’s electric vehicle sales are in California, where incentives are added to the federal tax credit. California also has a “Zero Emission Vehicle” program, requiring electric vehicles to comprise a certain percentage of sales.
We can’t ignore where electric vehicles are sourcing their power – and for that we must go back up to the electricity generation section. If you’re charging your car in a state powered mainly by fossil fuels (as many are), then the electricity is still tied to fossil fuels.
Petrochemicals
Many of the oil and gas infrastructure on the map doesn’t go towards energy at all, but rather aids in manufacturing petrochemicals – the basis of products like plastic, fertilizer, solvents, detergents, and resins.
Natural gas processing plants separate components of the natural gas stream to extract natural gas liquids like ethane and propane – which are transported through the natural gas liquid pipelines. These natural gas liquids are key building blocks of the petrochemical industry.
Ethane crackers process natural gas liquids into polyethylene – the most common type of plastic.
The chemical plants on this map include petrochemical production plants and ammonia manufacturing. Ammonia, which is used in fertilizer production, is one of the top synthetic chemicals produced in the world, and most of it comes from steam reforming natural gas.
As we discuss ways to decarbonize the country, petrochemicals must be a major focus of our efforts. That’s because petrochemicals are expected to account for over a third of global oil demand growth by 2030 and nearly half of demand growth by 2050 – thanks largely to an increase in plastic production. The International Energy Agency calls petrochemicals a “blind spot” in the global energy debate.
Petrochemical development off the coast of Texas, November 2019. Photo by Ted Auch, aerial support provided by LightHawk.
Investing in plastic manufacturing is the fossil fuel industry’s strategy to remain relevant in a renewable energy world. As such, we can’t break up with fossil fuels without also giving up our reliance on plastic. Legislation like the Break Free From Plastic Pollution Act get to the heart of this issue, by pausing construction of new ethane crackers, ensuring the power of local governments to enact plastic bans, and phasing out certain single-use products.
“The greatest industrial challenge the world has ever faced”
Mapped out, this web of fossil fuel infrastructure seems like a permanent grid locking us into a carbon-intensive future. But even more overwhelming than the ubiquity of fossil fuels in the US is how quickly this infrastructure has all been built. Everything on this map was constructed since Industrial Revolution, and the vast majority in the last century (Figure 3) – an inch on the mile-long timeline of human civilization.
Figure 3. Global Fossil Fuel Consumption. Data from Vaclav Smil (2017)
In fact, over half of the carbon from burning fossil fuels has been released in the last 30 years. As David Wallace Wells writes in The Uninhabitable Earth, “we have done as much damage to the fate of the planet and its ability to sustain human life and civilization since Al Gore published his first book on climate than in all the centuries—all the millennia—that came before.”
What will this map look like in the next 30 years?
A recent report on the global economics of the oil industry states, “To phase out petroleum products (and fossil fuels in general), the entire global industrial ecosystem will need to be reengineered, retooled and fundamentally rebuilt…This will be perhaps the greatest industrial challenge the world has ever faced historically.”
Is it possible to build a decentralized energy grid, generated by a diverse array of renewable, local, natural resources and backed up by battery power? Could all communities have the opportunity to control their energy through member-owned cooperatives instead of profit-thirsty corporations? Could microgrids improve the resiliency of our system in the face of increasingly intense natural disasters and ensure power in remote regions? Could hydrogen provide power for energy-intensive industries like steel and iron production? Could high speed rail, electric vehicles, a robust public transportation network and bike-able cities negate the need for gasoline and diesel? Could traditional methods of farming reduce our dependency on oil and gas-based fertilizers? Could zero waste cities stop our reliance on single-use plastic?
Of course! Technology evolves at lightning speed. Thirty years ago we didn’t know what fracking was and we didn’t have smart phones. The greater challenge lies in breaking the fossil fuel industry’s hold on our political system and convincing our leaders that human health and the environment shouldn’t be externalized costs of economic growth.
https://www.fractracker.org/a5ej20sjfwe/wp-content/uploads/2020/02/National-map-feature-3.png400900Erica Jacksonhttps://www.fractracker.org/a5ej20sjfwe/wp-content/uploads/2025/09/2025-Wordmark-Logo.pngErica Jackson2020-02-28 17:35:142022-05-02 15:21:42National Energy and Petrochemical Map
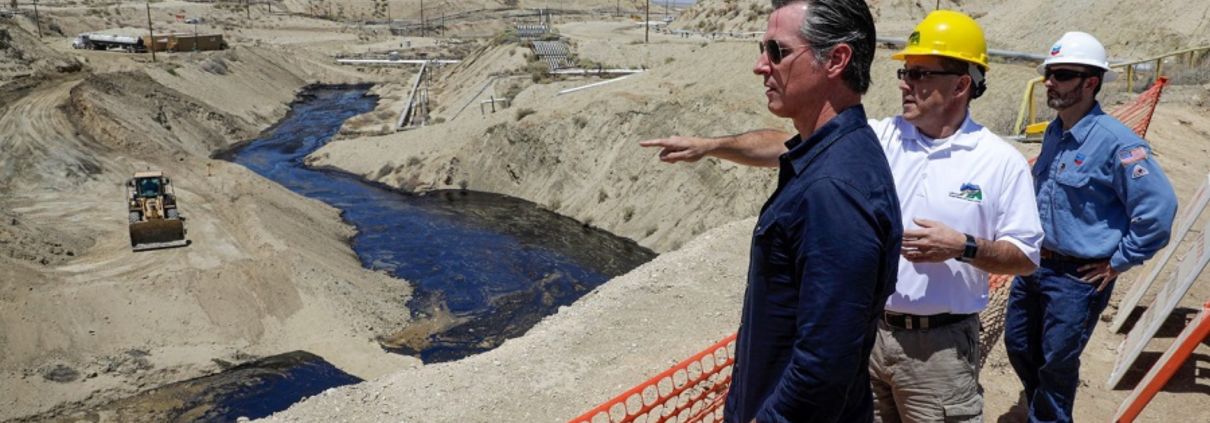
Chevron and other oil and gas companies in western Kern County have drilled so many oil and gas wells that they have essentially turned this area of California into a block of Swiss cheese. As a result, several of the most over-developed oil fields (in the world!) are suffering from gushing oil seeps known as surface expressions. Since May of 2019, one surface expression alone has spilled over 1.3 million gallons of oil and wastewater in the Cymric Field in southwestern California. Thirteen known surface expressions have been reported actively flowing in the Cymric field in 2019, one for over 15 years (GS5).
Regulators and Governor Newsom’s administration have attempted to address the issue but their response is not enough. Chevron was fined $2.7 million and Governor Newsom personally told Chevron to stop this spill, the location of which is shown below on the map in Figure 1. Oil and gas companies have also been ordered to lower their maximum injection pressures on new wells, limiting a technique called high pressure steam injection. Yet the state has continued to permit new cyclic steam and steam injection wells, the main cause of the surface expressions, including many in the same fields as the active surface expressions. Furthermore, data on new permit applications shows that Chevron and other operators intend to continue expanding their already bloated well counts. These new wells will increase the flow of oil to the surface via the over-abundance of existing older wells that serve as man-made pathways for toxic fluids.
Although Governor Newsom has made positive steps by halting new permits for higher pressure injections, the moratorium’s focus on injection pressure does not address all of the root causes of this epidemic of surface expressions, including over-development of these oil fields. Reducing the maximum injection pressures without also addressing the growing number of injection wells does nothing to reduce the pathways oil uses to travel to the surface. The Governor can reduce the active expressions and limit the risk for future expressions by halting permits for all new oil and gas wells, banning the existing use of steam injection, and forcing oil companies to plug and properly abandon older wells before they fail.
Figure 1. Map of 2018-2019 Cymric Oil Field Surface Expressions. The map includes the locations of surface expressions as well as the locations of new injections wells permitted in 2019 and current applications submitted since November 19, 2019.
Background
Steam injection is used more commonly in California than hydraulic fracturing, due to the nature of California’s abundant geological activity. Steam injection wells include wells devoted solely to injection and others, called cyclic steam wells, that alternate between injection of steam and production of oil and gas. It requires an extreme amount of energy to accomplish this, so they are considered energy intensive. These operations are known collectively as enhanced oil recovery (EOR) wells.
Steam injection wells increase the volume of oil produced when compared to conventional methods. They do this by injecting steam and water into the low-quality heavy crude produced in California in order to decrease the viscosity and push it towards the bottom holes of the production wells. The steam also pushes oil in other directions unintentionally, such as to the surface where it can spill out becoming a surface expression.
Some of the most notable negative impacts caused by EOR wells in California include greenhouse gas contributions, air and water contamination, and risks to workers.
Environmental Impacts
In addition to the creation of greenhouse gases from burning the fossil fuels extracted from California oil fields, oil and gas operators cause surface expressions and emit methane and other greenhouse gases as they leak out of the ground. The leaking natural gas is full of toxic and carcinogenic volatile organic compounds that degrade the local and regional air quality and exacerbate climate change. The majority of these expressions have not been documented by regulators and the emissions are not considered. The expressions also push oil and wastewater upwards through groundwater, leaving it contaminated. When the oil gets to the surface, it destroys terrestrial habitat for native plants and endangered species such as the long nosed leopard lizard. The seeps are also a major hazard to migratory birds that confuse the pooling oil for water sources.
A construction supervisor for Chevron named David Taylor was killed by such an event in the Midway-Sunset oil field near Bakersfield, CA. According to the LA Times, Chevron had been trying to control the pressure at the well-site. The company had stopped injections near the well, but neighboring operators continued injections into the pool. As a result, migration pathways along old wells allowed formation fluids to saturate the Earth just under the well-site. Tragically, Taylor fell into a 10-foot diameter crater of 190° fluid and hydrogen sulfide.
High Pressure Steaming
The practice of high pressure steam injection is incredibly similar to hydraulic fracturing, but unfortunately is not regulated under the current rules established by State Bill 4 (SB4). The technique is used to stimulate increased production from “unconventional” target formations such as the Monterey Shale. Steam is injected at high pressures, fracturing shale and other sedimentary rocks. High pressure steam injection both opens new pathways in the source rock and decreases the viscosity of heavy crude, allowing crude to flow more easily to the borehole of the well.
In 2016, the oil and gas industry was able to introduce an exemption in the regulations to allow for the stimulation of wells without an SB4 permit, as long as it was using steam, even when the injection pressure was greater than the fracture gradient of the target formation. For the last three years the practice existed in a legal grey area without any oversight. Then, in July of 2019, Governor Newsom’s administration adopted new underground injection control regulations, which explicitly allowed steam injection at pressures above the fracture gradient of the formation (1724.10.3. Maximum Allowable Surface Injection Pressure). That means operators were essentially “fracking”, but using steam to fracture the targeted shale formation instead of water (hydraulic). With the formal approval of the practice, operators ramped up operations resulting in numerous new surface expressions forming and the flow rates of existing surface expressions increasing.
Governor Newsom’s Response
On November 19, 2019, California Governor Gavin Newsom released a press statement outlining the work his administration is planning to address issues with oil and gas drilling such as surface expressions. Along with two other strategies, the Governor called for an immediate end to high pressure cyclic steaming. This new ban was meant to stop the existing surface expressions in oil fields, and prevent any new ones. Unfortunately, the activities of Chevron and the other operators in these fields are likely to prevent the Governor’s intervention from having the intended impact. These operators are planning to drill many new injection wells in close proximity to the surface expressions, in effect increasing the flow of current surface expressions and increasing the risk of more in the future. From the time of the press release to the end of 2019, oil and gas operators applied for permits authorizing 184 new steam injection wells. The majority of these permits are in the same fields as the surface expressions.
Injection Pressure
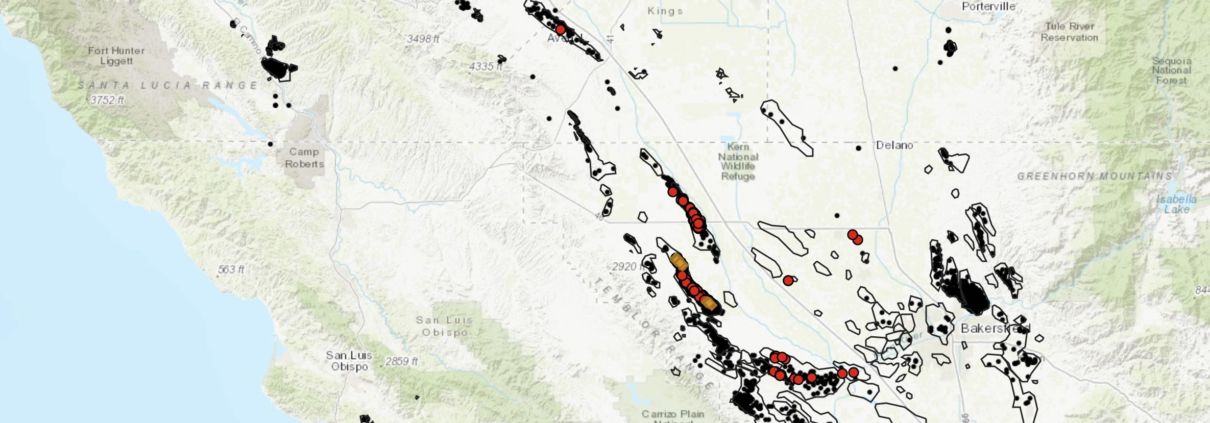
The oil and gas industry has blamed the surface expressions entirely on the geology of the oil fields in the southwestern region of Kern, specifically on the brittle diatomite crust that lies above many of Central California’s oil formations. The thing is, diatomite is common throughout the Monterey Shale. In fact, the entire Monterey formation of the Santa Barbara-Ventura coast generally consists of an upper siliceous member (diatomaceous) (Stanford, 2013; Issacs 1981). The risk is not unique to just the Cymric, McKittrick and Midway-Sunset Fields, yet these three fields, along with the Lost Hills field to the north, have the highest counts of reported surface expressions, as shown in the map below in Figure 2.
Figure 2. Map of California well density and surface expressions. The map visualizes California Department of Conservation (CA DOC) data summing surface expressions by oil field. Locations of new injections permit applications submitted since November 19, 2019 are also shown, summed by section.
These fields also have the highest concentration of wells in the state. Surface expressions in the oil fields of western Kern County provide a warning for the rest of the state. Over-development of an oil field is a major contributor to the potential for surface expressions. In the case of the Cymric field, there are simply too many wells drilled in a limited area. This is the reason Chevron shut down injection wells within 1,000’ of the surface expression, but even then the seep did not stop.
The map in Figure 2 shows that the Cymric field has the highest density of active and abandoned oil and gas wells in the state, providing plenty of man-made pathways to the surface. Our analysis shows that there are at least 319 reported wells drilled within 1,000’ of the 1Y surface expression. Another 154 wells are drilled within 1,000’ of the GS5 expression that has been actively flowing since 2003, including 11 active steam injection wells.
Wells in the Cymric field have been drilled in such numbers and in such close proximity that downhole communication between the wells is unavoidable. “Downhole communication” occurs when wells drilled in close proximity leak oil, natural gas and other formation materials between boreholes. This is a dangerous situation, for public health and worker safety. Downhole communication with unknown and known abandoned wells with brittle casings or active wells with poorly engineered casing that shear could even “blow sky high.”
To understand the spatial distribution of oil and gas wells in California, FracTracker used GIS to conduct a hot spot analysis. The parameters included all oil and gas wells in the state of California using California Department of Conservation (CA DOC) data (updated 1/4/20). Results of the analysis are shown in the map in Figure 2. Areas where the analysis showed statistically significant clusters of wells in high density are shown in purple, from low levels of statistical significance to high. Of note, the region with the highest level of statistically significant well density is located along the western side of Kern County. It is in the very same localized area as the eight surface expressions in the Cymric field, and includes the Cymric, McKittrick, and north end of the Midway-Sunset fields.
Field
New Steam Well Permit Count
Midway-Sunset
427
Cymric
197
Belridge, South
150
Kern River
125
McKittrick
105
Coalinga
88
Poso Creek
71
San Ardo
69
Kern Front
43
Lost Hills
20
Arroyo Grande
15
Cat Canyon
10
Edison
5
Orcutt
4
Placerita
1
Grand Total
1130
Table 1. Count of new steam well permits approved in 2019, by field. Data taken from CA DOC Weekly Summary of Permits Data (ftp://ftp.consrv.ca.gov/pub/oil/).
Operator
New Steam Well Permit Count
Aera Energy LLC
381
Chevron U.S.A Inc.
360
Berry Petroleum Company, LLC
276
Sentinel Peak Resources California LLC
112
E & B Natural Resources Management Corporation
65
Seneca Resources Management Corporation
61
California Resources Production Corporation
46
Vaquero Energy, Inc.
10
Crimson Resource Management Corp.
5
Naftex Operating Company
5
Kern River Holdings, Inc.
4
Santa Maria Energy, LLC
4
Grand Total
1329
Table 2. Count of new steam well permits approved in 2019, by operator. Data taken from CA DOC Weekly Summary of Permits Data (ftp://ftp.consrv.ca.gov/pub/oil/).
State’s Response
On November 19, 2019, California Governor Gavin Newsom released a press statement outlining his administration’s plan to address several issues with oil and gas drilling. Among them, the Governor called for an immediate moratorium on issuing new permits for “high pressure cyclic steaming.” This new moratorium was meant curb the rise of surface expressions. Unfortunately the activities of Chevron and the other operators in these fields are likely to undermine the Governor’s action. These operators are planning to drill many new injection wells in close proximity to the surface expressions, in effect increasing the flow of current surface expressions and increasing the risk of more in the future. From the time of the press release to the end of 2019, oil and gas operators applied for permits authorizing 184 new steam injection wells. The majority of these permits are in the same fields as the surface expressions. While the newly implemented moratorium will prevent future permits, permits issued prior to November 19, 2019 remain valid and will continue injecting at high pressure.
The regulatory agency, formerly DOGGR and now CalGEM, has already approved 1,330 new steam injection wells during Governor Newsom’s first year in office; 874 in the Cymric, McKrittrick, and Midway-Sunset fields alone where there are already over 9,300 operating. For summaries of new steam well permits approved in 2019 by field and operator, see Table 1 and 2 below. Even though Chevron stated that they ceased operations within 1,000 feet of the surface expressions (see map in Figure 1), 17 new steam injection wells have been permitted within 1,000 feet in 2019 alone. After the death of David Taylor in 2015, regulators established an 800’ safety buffer zone from that expression, but that safety measure has been ignored for more recent spills. Today, 27 steam injection wells continue to operate and three new permits are being considered within 800’ of the largest 2019 spill. Regulators are now considering permits for an additional 83 new steam injection wells in the same sections of the Cymric oil field closest to these recent surface expressions.
Conclusions and Recommendations
The state’s current solution for reducing surface expressions – a moratorium on high pressure steam injection – is not enough. Chevron and regulators say that it is unclear what exactly is causing the surface expressions, but the data speaks for itself. Too many wells have been drilled in too close proximity. Lowering the injection pressures of individual injection wells alone will not improve the situation if more injection wells are approved into the same formation. Governor Newsom can begin the remediation by stopping the state from permitting new oil and gas wells, banning existing steam injection, and properly plugging and abandoning the leaking wells in these fields. If this is not a priority, California will undoubtedly experience more of these situations, where the density of wells leads to dangerous conditions and increased emissions in more fields, such as the Ventura, Oxnard, and Kern River. It is clear that in addition to high injection pressures, these impacts are the result of over-development via lackadaisical permit reviews and irresponsible environmental policy.
By Kyle Ferrar, MPH, Western Program Coordinator, FracTracker Alliance
Feature Photo by Irfan Khan/LA Times via AP, Pool.
https://www.fractracker.org/a5ej20sjfwe/wp-content/uploads/2020/01/California-Governor-Gavin-Newsom--scaled.jpg6661500Kyle Ferrar, MPHhttps://www.fractracker.org/a5ej20sjfwe/wp-content/uploads/2025/09/2025-Wordmark-Logo.pngKyle Ferrar, MPH2020-02-24 10:09:182021-04-15 14:55:29Governor Newsom Must Do More to Address the Cause of Oil Spill Surface Expressions
FracTracker Alliance and Consumer Watchdog worked together to produce a map of all oil and gas permits issued in 2019, under Governor Newsom’s watch. Our previous collaborative reports revealed conflicts of interest within the oil and gas regulatory agency, and showed that the rate of permitting new fracking operations and all oil and gas well permits had doubled for the first six months of 2019, as compared to 2018 – Governor Jerry Brown’s last year in office. We have once again updated the data, with supporting maps and visuals to show the state of drilling in the State of California.
“The numbers give fresh urgency on the need to order a 2,500-foot health barrier between oil industry operations and people living as close as just yards away,” Consumer Watchdog and FracTracker Alliance wrote in a letter to Governor Newsom. “Action on this and a start to phasing out oil and gas production in the state simply cannot wait for the results of more time-consuming studies.”
https://www.fractracker.org/a5ej20sjfwe/wp-content/uploads/2020/02/Screen-Shot-2020-02-21-at-2.22.05-PM.png6741500Kyle Ferrar, MPHhttps://www.fractracker.org/a5ej20sjfwe/wp-content/uploads/2025/09/2025-Wordmark-Logo.pngKyle Ferrar, MPH2020-02-22 13:29:222021-04-15 14:55:30Oil & Gas Well Permits Issued By Newsom Administration Rival Those Issued Under Gov. Jerry Brown
Despite the ever-increasing heaps of violations and drilling waste, Pennsylvania’s fracked wells continue to produce an excess supply of gas, driving prices down. To cut their losses, the oil and gas industry is turning towards increased exports and petrochemical production. Continuing to expand fracking in Pennsylvania will only increase risks to the public and to the climate, all for what may amount to another boom and bust cycle that is largely unprofitable to investors.
Let’s take a look at gas production, waste, newly drilled wells, and violations in Pennsylvania in the past year to understand just how precarious the fracking industry is.
Production
Fracked hydrocarbon production continues to rise in Pennsylvania, resulting in an increase in waste production, violations, greenhouse gas emissions, and public health concerns. There are three types of hydrocarbons produced from wells in Pennsylvania: gas, condensate, and oil. Gas is composed mostly of methane, the most basic of the hydrocarbons, but in some parts of Pennsylvania, there can be significant quantities of ethane, propane, and other so-called “natural gas liquids” (NGLs) mixed in. Each of these NGLs are actually gaseous at atmospheric conditions, but operators try to separate these with a combination of pressure and low temperatures, converting them to a liquid phase. Some of these NGLs can be separated on-site, and this is typically referred to as condensate. Fracked wells in Pennsylvania also produce a relatively tiny amount of oil.
For those of you wondering why we are looking at the November, 2018 through October, 2019 time frame, this is simply a reflection of the available data. In this 12-month period, 9,858 fracked Pennsylvania wells, classified as “unconventional,” reported producing 6.68 trillion cubic feet of gas (Tcf), 4.89 million barrels of condensate, and just over 70,000 barrels of oil.
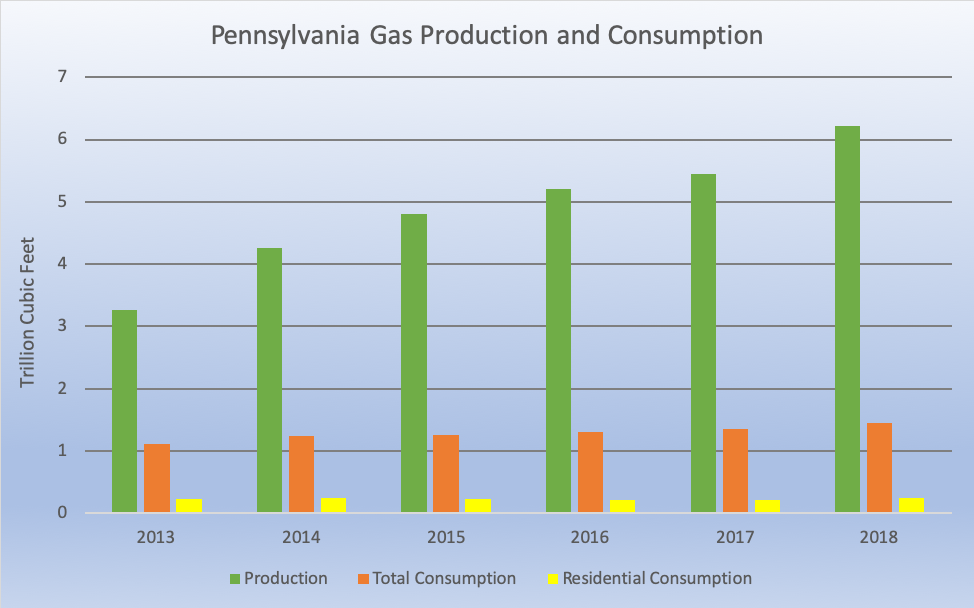
By means of comparison, Pennsylvania consumed about 1.46 Tcf of gas across all sectors in 2018, of which just 253 billion cubic feet (Bcf) was used in the homes of Pennsylvania’s 12.8 million residents. In fact, the amount of gas produced in Pennsylvania exceeds residential consumption in the entire United States by almost 1.7 Tcf. However, less than 17% of all gas consumed in Pennsylvania is for residential use, with nearly 28% being used for industrial purposes (including petrochemical development), and more than 35% used to generate electricity.
Figure 1. Fracked gas production compared to all fracked gas consumption and residential gas consumption in Pennsylvania from 2013 through 2018. Data from ref. Energy Information Administration.
While gas production has expansive hotspots in the northeastern and southwestern portions of the state, the liquid production comes from a much more limited geography. Eighty percent of all condensate production came from Washington County, while 87% of all fracked oil came from wells in Mercer County.
Because the definition of condensate has been somewhat controversial in the past (while the oil export ban was still in effect), I asked the Department of Environmental Protection (DEP) for the definition, and was told that if hydrocarbons come out of the well as a liquid, they should be reported as oil. If they are gaseous but condense to a liquid at standard temperature and pressure (60 degrees Fahrenheit and pressure 14.7 PSIA) on-site, then it is to be reported as condensate. Any NGLs that remain gaseous but are removed from the gas supply further downstream are reported as gas in this report. For this reason, it is not really possible to use the production report to find specific amounts of NGLs produced in the state, but it certainly exceeds condensate production by an appreciable margin.
The volume of gas withdrawn from fracked wells in Pennsylvania in just one year is equal to the volume of 3.2 Mount Everests!
Waste
Hydrocarbons aren’t the only thing that come out of the ground when operators drill and frack wells in Pennsylvania. Drillers also report a staggering amount of waste products, including more than 65 million barrels (2.7 billion gallons) of liquid waste and 1.2 million tons of solid waste in the 12-month period.
Waste facilities have significant issues such as inducing earthquakes, toxic leachate, and radioactive sediments in streambeds.
Waste Type
Liquid Waste (Barrels)
Solid Waste (Tons)
Basic Sediment
63
Brine Co-Product
247
Drill Cuttings
1,094,208
Drilling Fluid Waste
1,439,338
11,378
Filter Socks
143
Other Oil & Gas Wastes
2,236,750
6,387
Produced Fluid
61,376,465
41,165
Servicing Fluid
17,196
3,250
Soil Contaminated by Oil & Gas Related Spills
25,505
Spent Lubricant Waste
1,104
Synthetic Liner Materials
21,051
Unused Fracturing Fluid Waste
7,077
1,593
Waste Water Treatment Sludge
35,151
Grand Total
65,078,240
1,239,831
Figure 2. Oil and gas waste generated by fracked wells as reported by drillers from November 1, 2018 through October 31, 2019. Data from ref: PA DEP.
Some of the waste is probably best described as sludge, and several of the categories allow for reporting in barrels or tons. Almost all of the waste was in the well bore at one time or another, although there are some site-related materials that need to be disposed of, including filter socks which separate liquid and solid waste, soils contaminated by spills, spent lubricant, liners, and unused frack fluid waste.
Where does all of this waste go? We worked with Earthworks earlier this year to take a deep dive into the data, focusing on these facilities that receive waste from Pennsylvania’s oil and gas wells. While the majority of the waste is dealt with in-state, a significant quantity crosses state lines to landfills and injection wells in neighboring states, and sometimes as far away as Idaho.
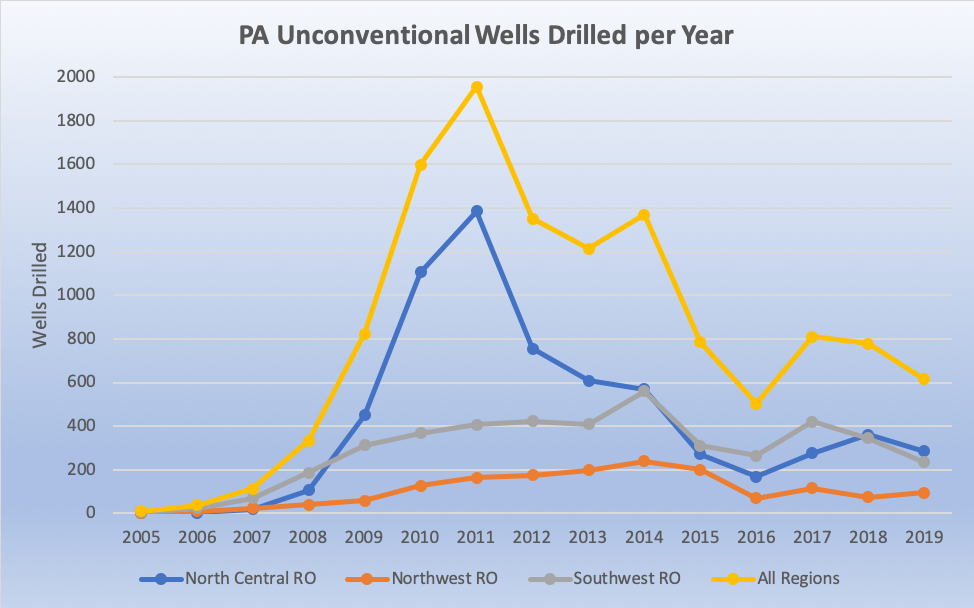
Oil and gas operators have started the drilling process for 616 fracking wells in 2019, which appear on the Pennsylvania DEP spud report. This is less than one third of the 2011 peak of 1,956 fracked wells, and 2019 is the fifth consecutive year with fewer than 1,000 wells drilled. This has the effect of making industry projections relying on 1,500 or more drilled wells per year seem rather dubious.
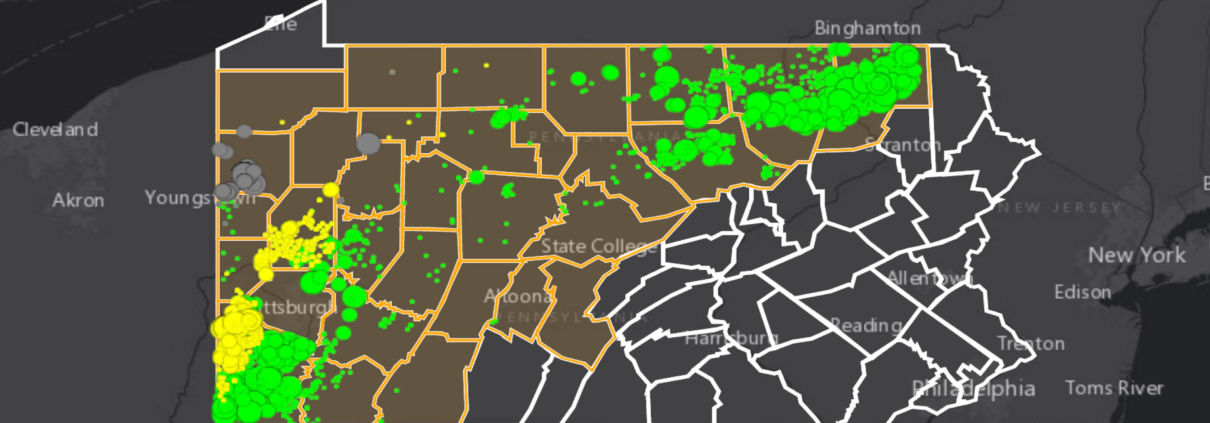
Figure 3. Unconventional (fracked) wells drilled from 2005 through December 23, 2019, showing totals by regional office. Data from ref: PA DEP.
Oil and gas wells in Pennsylvania fall under the jurisdiction of three different regional offices. By looking at Figure 2, it becomes apparent that the North Central Regional Office (blue line) was a huge driver of the 2009 to 2014 drilling boom, before falling back to a similar drilling rate of the Southwest Regional Office.
The slowdown in drilling for gas in recent years is related to the lack of demand for the product. In turn, this drives prices down, a phenomenon that industry refers to as a “price glut.” The situation it is forcing major players in the regions such as Range Resources to reduce their holdings in Appalachia, and some, such as Chevron, are pulling out entirely.
Violations
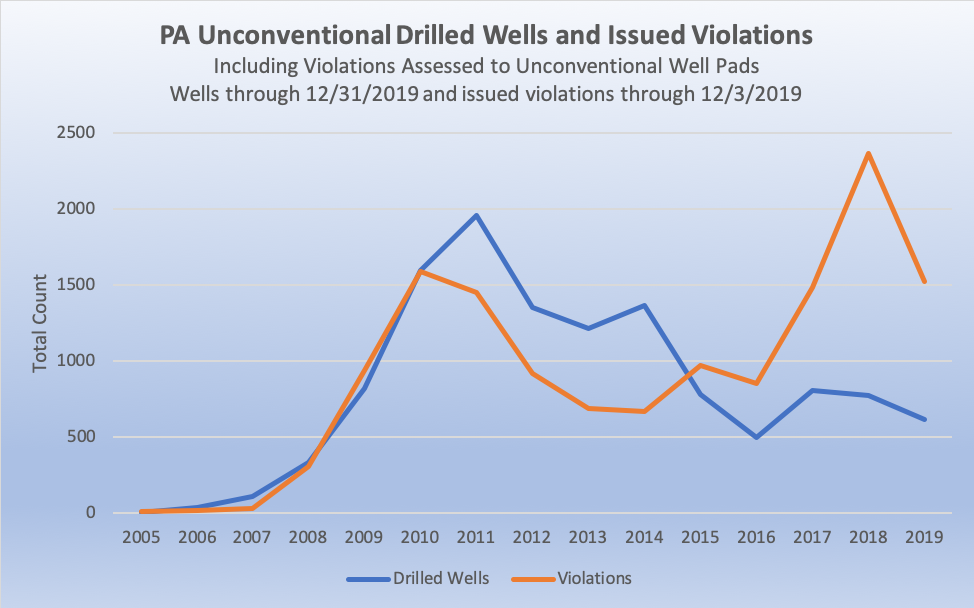
Disturbingly, 2019 was the fifth straight year that the number of violations issued by DEP will exceed the total number of wells drilled.
Figure 4. Unconventional (fracked) drilled wells and issued violations from 2005 through December 2019. Data from ref: DEP.
Violations related to unconventional drilling are a bit unwieldy to summarize. The 13,833 incidents reported in Pennsylvania fall into 359 different categories, representing the specific regulations in which the drilling operator fell short of expectations. The industry likes to dismiss many of these as being administrative matters, and indeed, the DEP does categorize the violations as either “Administrative” or “Environmental, Health & Safety”. However, 9,998 (72%) of the violations through December 3, 2019, are in the latter category, and even some of the ones that are categorized as administrative seem like they ought to be in environmental, health, and safety. For example, let’s look at the 15 most frequent infractions:
Violation Code
Incidents
Category
SWMA301 – Failure to properly store, transport, process or dispose of a residual waste.
767
Environmental Health & Safety
CSL 402(b) – POTENTIAL POLLUTION – Conducting an activity regulated by a permit issued pursuant to Section 402 of The Clean Streams Law to prevent the potential of pollution to waters of the Commonwealth without a permit or contrary to a permit issued under that authority by the Department.
613
Environmental Health & Safety
102.4 – Failure to minimize accelerated erosion, implement E&S plan, maintain E&S controls. Failure to stabilize site until total site restoration under OGA Sec 206(c)(d)
595
Environmental Health & Safety
SWMA 301 – MANAGEMENT OF RESIDUAL WASTE – Person operated a residual waste processing or disposal facility without obtaining a permit for such facility from DEP. Person stored, transported, processed, or disposed of residual waste inconsistent with or unauthorized by the rules and regulations of DEP.
540
Environmental Health & Safety
601.101 – O&G Act 223-General. Used only when a specific O&G Act code cannot be used
469
Administrative
402CSL – Failure to adopt pollution prevention measures required or prescribed by DEP by handling materials that create a danger of pollution.
362
Environmental Health & Safety
78.54* – Failure to properly control or dispose of industrial or residual waste to prevent pollution of the waters of the Commonwealth.
339
Environmental Health & Safety
401 CSL – Discharge of pollutional material to waters of Commonwealth.
299
Environmental Health & Safety
102.4(b)1 – EROSION AND SEDIMENT CONTROL REQUIREMENTS – Person conducting earth disturbance activity failed to implement and maintain E & S BMPs to minimize the potential for accelerated erosion and sedimentation.
285
Environmental Health & Safety
102.5(m)4 – PERMIT REQUIREMENTS – GENERAL PERMITS – Person failed to comply with the terms and conditions of the E & S Control General Permit.
283
Environmental Health & Safety
78.56(1) – Pit and tanks not constructed with sufficient capacity to contain pollutional substances.
256
Administrative
78a53 – EROSION AND SEDIMENT CONTROL AND STORMWATER MANAGEMENT – Person proposing or conducting earth disturbance activities associated with oil and gas operations failed to comply with 25 Pa. Code § 102.
247
Environmental Health & Safety
102.11(a)1 – GENERAL REQUIREMENTS – BMP AND DESIGN STANDARDS – Person failed to design, implement and maintain E & S BMPs to minimize the potential for accelerated erosion and sedimentation to protect, maintain, reclaim and restore water quality and existing and designated uses.
235
Environmental Health & Safety
CSL 401 – PROHIBITION AGAINST OTHER POLLUTIONS – Discharged substance of any kind or character resulting in pollution of Waters of the Commonwealth.
235
Environmental Health & Safety
OGA3216(C) – WELL SITE RESTORATIONS – PITS, DRILLING SUPPLIES AND EQUIPMENT – Failure to fill all pits used to contain produced fluids or industrial wastes and remove unnecessary drilling supplies/equipment not needed for production within 9 months from completion of drilling of well.
206
Environmental Health & Safety
Figure 5. Top 15 most frequently cited violations for unconventional drilling operations in Pennsylvania through December 3, 2019. Data from ref: DEP.
Of the 15 most common categories, only two are considered administrative violations. One of these is a general code, where we don’t know what happened to warrant the infraction without reading the written narrative that accompanies the data, and is therefore impossible to categorize. The only other administrative violation in the top 15 categories reads, “78.56(1) – Pit and tanks not constructed with sufficient capacity to contain pollutional substances,” which certainly sounds like it would have some real-world implications beyond administrative concerns.
To address the excess supply of gas, companies have tried to export the gas and liquids to other markets through pipelines. Those efforts have been fraught with trouble as well. Residents are reluctant to put up with an endless barrage of new pipelines, yielding their land and putting their safety at risk for an industry that can’t seem to move the product safely. The Revolution pipeline explosion hasn’t helped that perception, nor have all of the sinkholes and hundreds of leaky “inadvertent returns” along the path of the Mariner East pipeline system. In a sense, the industry’s best case scenario is to call these failures incompetence, because otherwise they would be forced to admit that the 2.5 million miles of hydrocarbon pipelines in the United States are inherently risky, prone to failure any time and any place.
In addition to increasing the transportation and export of natural gas to new markets, private companies and elected officials are collaborating to attract foreign investors to fund a massive petrochemical expansion in the Ohio River Valley. The planned petrochemical plants intend to capitalize on the cheap feedstock of natural gas.
Pennsylvania’s high content of NGLs is a selling point by the industry, because they have an added value when compared to gas. While all of these hydrocarbons can burn and produce energy in a similar manner, operators are required to remove most of them to get the energy content of the gas into an acceptable range for gas transmission lines. Because of this, enormous facilities have to be built to separate these NGLs, while even larger facilities are constructed to consume it all. Shell’s Pennsylvania Petrochemicals Complex ethane cracker being built in Beaver County, PA is scheduled to make 1.6 million metric tons of polyethylene per year, mostly for plastics.
This comes at a time when communities around the country and the world are enacting new regulations to rein in plastic pollution, which our descendants are going to finding on the beach for thousands of years, even if everyone on the planet were to stop using single-use plastics today. Of course, none of these bans or taxes are currently permitted in Pennsylvania, but adding 1.6 million metric tons per year to our current supply is unnecessary, and indeed, it is only the beginning for the region. A similar facility, known as the PTT Global Chemical cracker appears to be moving forward in Eastern Ohio, and ExxonMobil appears to be thinking about building one in the region as well. Industry analysts think the region produces enough NGLs to support five of these ethane crackers.
Despite all of these problems, the oil and gas industry still plans to fill the Ohio River Valley with new petrochemical plants, gas processing plants, and storage facilities in the hopes that someday, somebody may want what they’ve taken from the ground.
Here’s hoping that 2020 is a safer and healthier year than 2019 was. But there is no need to leave it up to chance. Together, we have the power to change things, if we all demand that our voices are heard. As a start, consider contacting your elected officials to let them know that renewing Pennsylvania’s blocking of municipal bans and taxes on plastic bags is unacceptable.
By Matt Kelso, Manager of Data & Technology, FracTracker Alliance
https://www.fractracker.org/a5ej20sjfwe/wp-content/uploads/2020/01/PA-2019-Fracked-Gas-Production-Feature-scaled.jpg6671500Matt Kelso, BAhttps://www.fractracker.org/a5ej20sjfwe/wp-content/uploads/2025/09/2025-Wordmark-Logo.pngMatt Kelso, BA2020-01-07 18:02:382021-04-15 14:55:32Fracking in Pennsylvania: Not Worth It
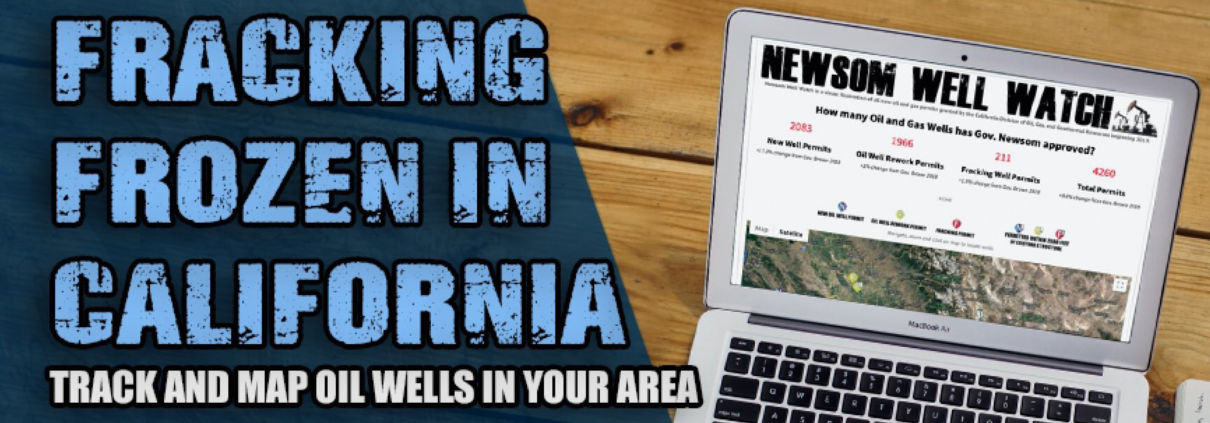
https://www.fractracker.org/a5ej20sjfwe/wp-content/uploads/2019/11/Newsom-Well-Watch-Feature-scaled.jpg6671500Kyle Ferrar, MPHhttps://www.fractracker.org/a5ej20sjfwe/wp-content/uploads/2025/09/2025-Wordmark-Logo.pngKyle Ferrar, MPH2019-11-19 20:06:282021-04-15 14:55:36California is Frack Free, for the Moment
By Isabelle Weber, FracTracker Alliance Spring 2019 Intern
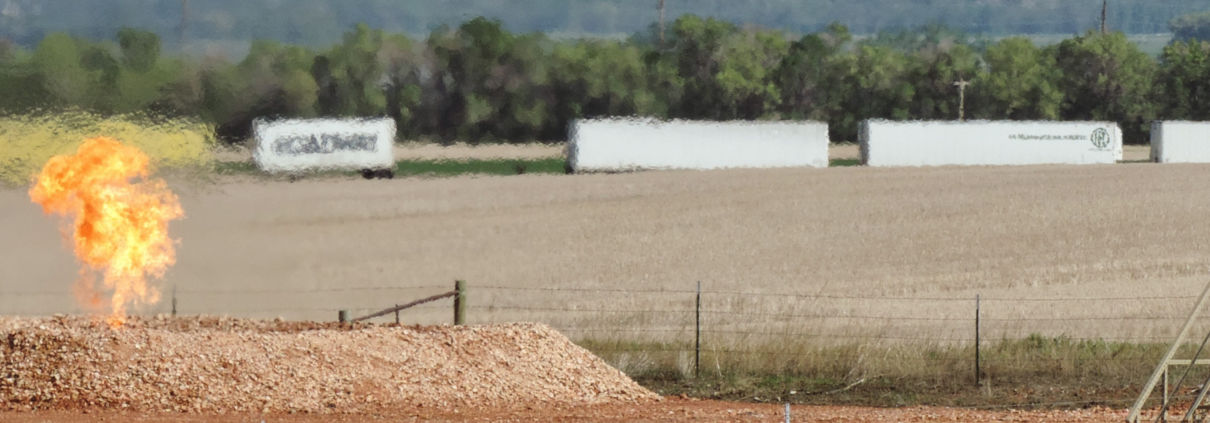
Feature photo of oil and gas drilling in North Dakota, and is by by Nick Lund, NPCA, 2014
Although there are some federal regulations in place to protect the environment indirectly from fracking in the United States, the regulations that try to keep fracking in check are largely implemented at the state governing level. This has led to a patchwork of regulations that differ in strictness from state to state. This leads to the concern that there will be a race to the bottom where states lower the strictness of their regulations in order to draw in more fracking. While it might be tempting to welcome an industry that often creates a temporary economic spike, the costs of mitigating the environmental damage from fracking far out-weighs the profit gained. Germany, Scotland, and France are examples of countries that have taken more appropriate regulatory measures to protect their populations from the risks involved in unconventional oil and gas development.
The Shortfalls of State by State Regulations
For a detailed overview of how fracking regulation differs between states, check out the Resources for the Future report, The State of State Shale Gas Regulation, which analyzes 25 regulatory elements and how they differ between states. Two of their maps that attest to this vast difference in regulation are the “Fracturing Fluid Disclosure Requirements” map as well as the “Venting Regulations” map.
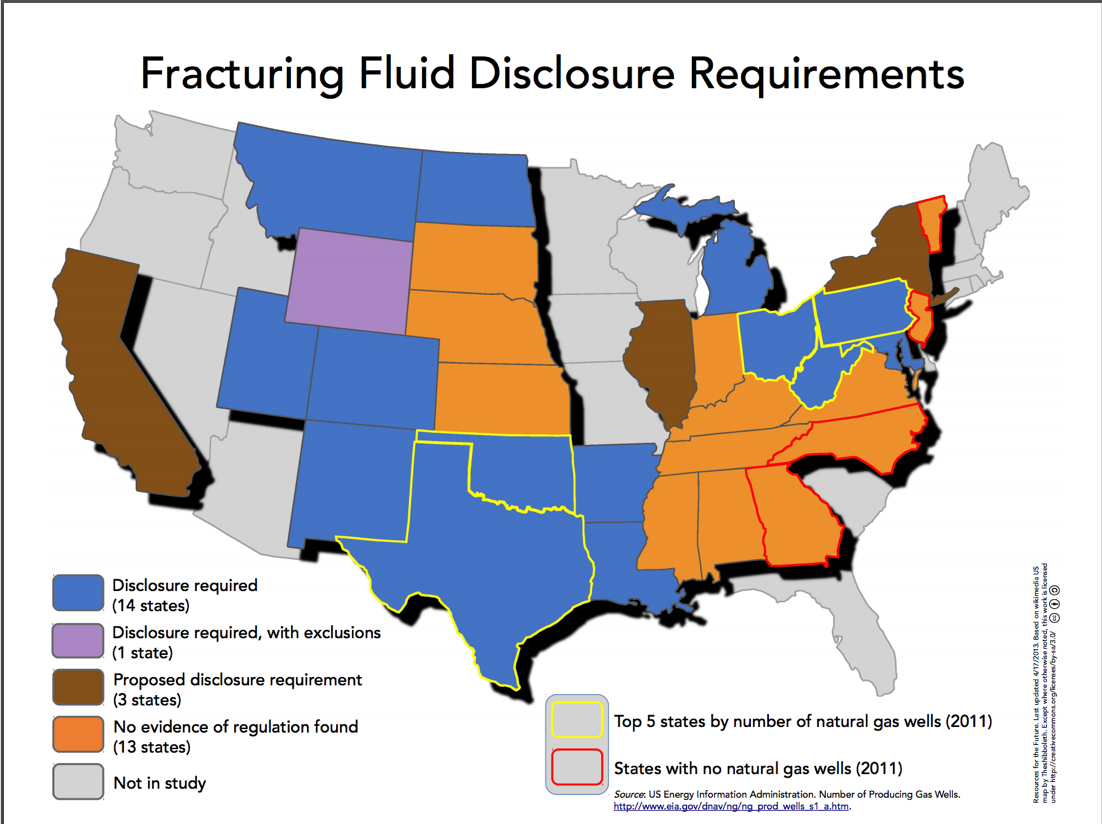
The “Fracturing Fluid Disclosure Requirements” map shows regulatory differences between states regarding whether or not the chemical mixture used to break up rock formations must be made known to the public. “Disclosure” means that the chemical mixture is made known to the public and “No Regulation” means that there is nothing that obligates companies to share this information, which usually implies this information is not available.
Fig 1. Map of fracking fluid disclosure requirements by state, from Resources for the Future’s report, “The State of State Shale Gas Regulation.” Original data from US Energy Information Administration.
Note from the editor: There are several exemptions that allow states to limit the scope of reporting chemicals used in underground fluid injection for fracking. For example, all states that require chemical disclosure are entitled to exemptions for chemicals that are considered trade secrets.
Concealing the identity of chemicals increases the risk of harm from chemical exposure for people and the environment. Emergency first responders are especially at risk, as they may have to act quickly to put out a fracking-induced fire without knowing the safety measures necessary to avoid exposure to dangerous chemicals. The population at large is at risk of exposure though several pathways such as leaks, spills, and air emissions. Partnership for Policy Integrity, along with data analysis by FracTracker, investigated the implications of keeping the identity of certain fracking chemicals secret in two states, Ohio and Pennsylvania. These reports point to evidence that exposure to concealed fracking chemicals could have serious health effects including blood toxicity, developmental toxicity, liver toxicity and neurotoxicity.
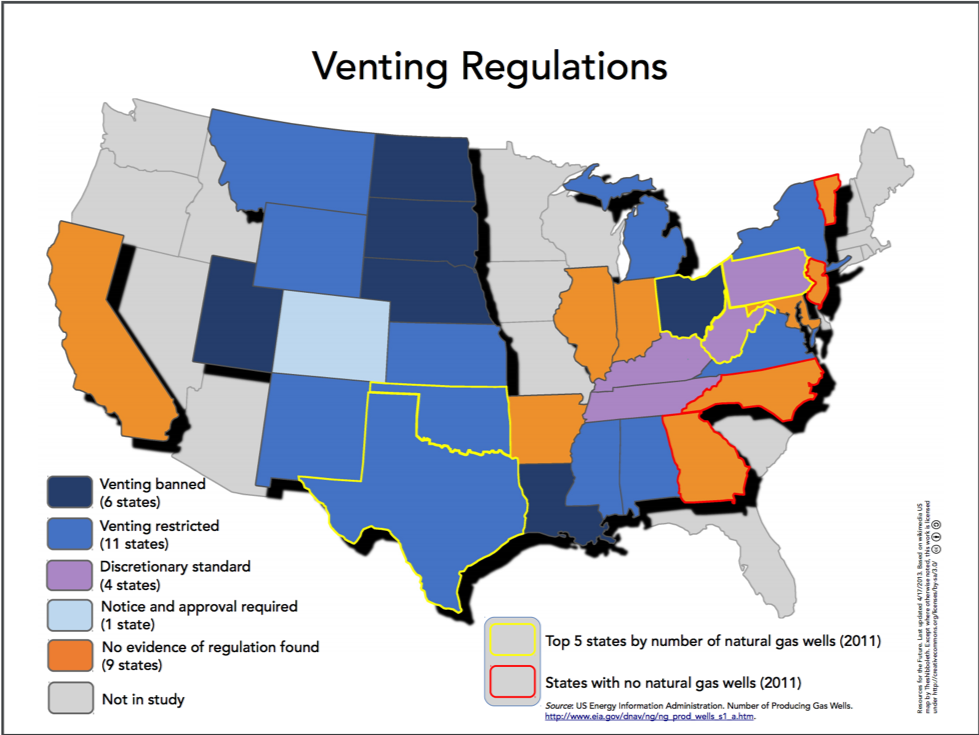
The second map, “Venting Regulations,” shows which states have regulations that limit or ban venting and which do not. Venting is the direct release of methane from the well site into the atmosphere. Methane has 30 times the green-house gas effect as carbon dioxide. Given methane’s severe impact on the environment, no venting whatsoever should be allowed at well sites.
Fig 2. Map of fracking venting regulations by state, from Resources for the Future’s report, “The State of State Shale Gas Regulation.” Original data from US Energy Information Administration.
Having overarching federal regulatory infrastructure to regulate fracking would help to avoid risks such as toxic chemical exposure and accelerated climate change. Although leaving regulation development to states allows for more specialized laws, there are certain aspects of environmental protection that apply to every area in the United States and are necessary as standard protection against the effects of fracking.
How do other countries regulate fracking?
Stronger federal regulation of fracking has worked well in the past and can be seen in several other countries.
Germany
In 2017, Germany passed new legislation that largely banned unconventional hydraulic fracking. The ban on unconventional fracking excludes four experimental wells per state that will be commissioned by the German government to an independent expert commission to identify knowledge gaps and risks with regards to fracking. Conventional fracking also received tighter regulations including a ban on fracking near drinking water sources. In 2021, the ban will be reevaluated, taking into account research results, public perception, long term damage to residents and the environment, and technological advances. This is a perfect example of how a country can use overarching federal regulation to make informed decisions about industry action.
Scotland
In 2015, Scotland placed a moratorium into effect that halted all fracking in the country. Since 2017, the government has held that the moratorium will stand indefinitely as an effective ban on fracking in the country, but the country is still working on the legislature that will officially ban fracking. Meanwhile, the Scottish government conducted one of the most far-reaching investigations into unconventional oil and gas development, which included a four-month public consultation period. This public consultation garnered 65,000 responses, 65% of which were from former coal mining communities targeted by the fracking industry. Of those responses, 99% of responses opposed fracking.
The Scottish people should be applauded for holding their federal government accountable in fulfilling its responsibility to protect its people and its environment against the effects of fracking.
France
In December 2017, France passed a law that bans exploration and production of all oil and natural gas by the year 2040. This applies to mainland France as well as all French territories. Although France has limited natural gas resources, it is hoped that the ban will be contagious and spread to other countries. This is a prime example of a country making a decision to protect their environment through regulation.
Although France’s banning of fracking was largely symbolic and may not result in a considerable reduction of greenhouse gases related to natural gas exploration, the country is sending a message to the world that we need to facilitate the end of the fossil fuel era and a move toward renewables.
Back to the US, the world’s leading producer of natural gas
Federal regulation on fracking should be holding the oil and gas industry in check by requiring states to meet basic measures to protect people and the environment. States could then develop more stringent regulations as they see fit. It is important that we come to a national consensus on the environmental and health hazards of fracking, and consequently, to adopt appropriate federal regulations.
By Isabelle Weber, FracTracker Alliance Spring 2019 Intern
https://www.fractracker.org/a5ej20sjfwe/wp-content/uploads/2019/10/Oil-and-gas-drilling-in-ND.-Photo-by-Nick-Lund-NPCA-2014-feature-scaled.jpg6671500Intern FracTrackerhttps://www.fractracker.org/a5ej20sjfwe/wp-content/uploads/2025/09/2025-Wordmark-Logo.pngIntern FracTracker2019-10-10 11:50:142021-04-28 11:55:45How State Regulations Hold Us back and What Other Countries are doing about Fracking
Guest blog by Natalia N. Romanzo, graduate student, Binghamton University, Binghamton, NY
Innovations in geospatial remote sensing technology developed by a research team at Binghamton University’s Geophysics and Remote Sensing Laboratory allow for improved detection of unplugged oil and gas wells. Implementing this technology would allow responsible agencies to more efficiently locate, and then plug, the 30,000+ undocumented oil and gas wells in New York State. Plugging these wells would help residents to assess risks of any wells on or near their property, improve air quality, and keep New York State on track to reaching its greenhouse gas emissions targets.
Dangers of Unplugged Orphan Oil and Gas Wells
In 2018, the United States Environmental Protection Agency (EPA) estimated that nationwide, there were 3.11 million abandoned oil and gas wells. Sixty-nine percent — or 2.15 million — of these wells are not even plugged. Many were drilled prior to the existence of state regulatory programs, subsequently abandoned by their original owners or operators over a century ago, and then left unplugged or poorly plugged. State and federal regulators are in the process of plugging these wells, but the process is slow; many are still unplugged today.
Anthropogenic methane is the cause of a quarter of today’s global warming, and the oil and gas industry is a leading source of these emissions. Every year, oil and gas companies release an estimated 75 million metric tons of methane globally, an amount of gas sufficient to provide electricity for all of Africa twice over. Unplugged wells are often high emitters contributing to this energy waste. A study of almost 140 wells in Wyoming, Colorado, Utah, and Ohio found that more than 40% of unplugged wells leak methane, compared to less than 1% of plugged wells.
Unplugged, incorrectly plugged, as well as active wells can all leak methane. Methane-leaking wells are especially problematic when their locations are undocumented or unknown. Until they are located, undocumented wells that remain unplugged can continue to emit methane into the atmosphere and into drinking water. For example, in Pennsylvania, methane was detected in water samples at average concentrations six times higher in homes less than one kilometer from oil and gas wells. The potential negative impact of unplugged orphan oil and gas wells makes this a pressing environmental concern.
Of the more than 3 million problematic oil and gas wells nationwide, over 35,000 unplugged oil and gas wells may exist in New York State alone. Unplugged or improperly plugged wells that leak methane can pose direct threats to New York State residents, especially for people living nearby to these wells. Many New York State residents are unaware that they have an unplugged well on their property, and could be at risk of potential exposure to uncontrolled releases of gas or fluids from unplugged orphan wells. In one case in Rushville, New York, two dozen unplugged wells emitted methane at explosive levels. An unplugged well in Rome, New York discharged brine to the land surface for decade at a rate of 5 gallons per minute, killing an acre of wetland vegetation. If these wells had been located and assessed, property owners would be better informed and safer.
In addition to directly harming New York State residents and contributing to climate change, unplugged orphan wells also impact New York State’s ability to reach its 2030 emissions targets. New York State recently set ambitious statewide greenhouse gas emissions targets through the Climate Leadership and Community Protection Act to lower emissions by 85% by 2050. However, New York State has only reduced emissions 8% from 1990-2015 levels. If New York State is to reach its emissions targets, it must continue and improve its efforts to locate, assess, and ultimately plug all its orphan oil and gas wells.
Inaccurate Records and Inefficient Detection Methods
The New York State Department of Environmental Conservation (DEC) is responsible for task of mitigating and preventing damage caused by oil and gas wells. Unfortunately, flaws in record keeping have made it difficult to locate undocumented wells. The DEC began record keeping of oil and gas wells in 1983 and took on regulatory authority over wells drilled in the state after 1983. There are strict rules and regulations for plugging wells drilled after 1983, and wells drilled prior to 1983 must comply with applicable regulations. Nevertheless, many older wells are still unaccounted for. In their external review in 1994, staff estimated that 61,000 wells had been developed prior to 1983. However, the agency only has records on about 30,000 of them. Because accurate records do not exist for old wells, it is difficult to monitor, and even locate, them.
Click here for a full-screen view of FracTracker Alliance’s map of all known wells in New York State (data current as of October 2018, to be updated soon).
Despite inaccurate records, the DEC does try to locate, assess, and plug old wells using maps created by drilling companies in the late 1800s. A section of one such map can be seen in Figure 1. This map shows proposed oil and gas drilling sites in Cattaraugus County, New York in the late 1800s. It has been georeferenced using ArcGIS mapping software to assign present day coordinates to hand drawn features.
Figure 1. Georeferenced Lease Map, Cattaraugus County, New York
Unfortunately, these maps are not entirely reliable. Some wells may be incorrectly documented on a map as drilled when, in fact, they were merely proposed but never drilled; some wells may have been drilled but never marked on a map. Other wells may have been both marked on a map and drilled, but due to inaccurate survey technologies of the past, the location on the ground is incorrect. As a result, DEC staff are left searching on foot for wells that may or may not be there. Working with limited equipment, in dense brush, and over uneven terrain make the task of finding the abandoned wells even more problematic.
These traditional methods of detection, which include referencing lease maps and searching for wells in the field, are not only time consuming, but are also costly. Using traditional methods of well detection, between 1988 and 2009, the United States Bureau of Land Management spent $3.8 million and only successfully reclaimed 295 well sites. It is clear that on both the federal and state levels, traditional well detecting methods are expensive, cumbersome, and inefficient.
Drones Pave the Way for Oil and Gas Well Detection
Recent improvements in geospatial remote sensing technology have opened opportunities for more efficient well detection. Previously, the battery life of drones and the weight of magnetometers prevented the two technologies from being used together to locate oil and gas wells. Furthermore, because drones must be flown high enough to clear vegetative canopies, methane sensors attached to drones are too far away from the source to accurately detect the location of the well. Due to these technological barriers, the DEC and other environmental departments and agencies have had to rely on inefficient, traditional methods of well detection described above.
At Binghamton University’s Geophysics and Remote Sensing Laboratory, a research team headed by Professors Timothy de Smet and Alex Nikulin, along with graduate student Natalia Romanzo, and undergraduate students Samantha Wong, Judy Li, and Ethan Penner, is taking on the task of developing a more efficient method to locate oil and gas wells. The Binghamton University research team deployed drones equipped with magnetometers to demonstrate that a high-resolution, low-altitude magnetic survey can successfully locate unmarked well sites.
Oil and gas wells have a characteristic magnetic signal that is generated by vertical metal piping fixed in the ground, making them identifiable in a magnetic survey.
Figure 2a. Oil and Gas Well Detected at 40m AGL showing LiDAR Total Horizontal Derivative of the site.
The magnetic signal generated by a well is shown in red in Figure 2b. At 40 meters above ground level (AGL), tree canopies are cleared, while the magnetic anomaly of the well is distinguishable. This drone-based magnetometer method has shown promising results.
Figure 2b. Magnetic Anomaly of an Oil and Gas Well Detected at 40m AGL, showing total magnetic intensity of the site.
To further test remote sensing techniques, the Binghamton University research team worked with Charles Dietrich and Nathan Graber from the NYS DEC to compare the efficiency of different survey methods. Currently, researchers are conducting fieldwork to compare the efficiency of traditional methods of well detection, well detection via a magnetic ground survey, and well detection via a drone-based magnetic survey. This research is showing that using drones equipped with magnetometers is a more efficient way to survey a wide area where wells may be present.
Remote sensing techniques can allow the DEC to more efficiently locate, and then plug, the 30,000+ undocumented oil and gas wells in New York State. Using this new method of well detection, the DEC will be able to inform residents who have unplugged wells on their property, assess the risks of the wells, and plug harmful wells. Residents with wells on or near their property will benefit directly. In addition, and more broadly, New Yorkers will enjoy improved air quality while New York State will be more on track to reaching its emissions targets.
FracTracker thanks Natalia Romanzo for her guest blog contribution. We feel that this technology holds promise for communities impacted by drilling across the nation.
For answers to specific questions about the project, you can email Natalia directly at nromanz1@binghamton.edu.
https://www.fractracker.org/a5ej20sjfwe/wp-content/uploads/2019/09/2018-NYS-Oil-and-Gas-Wells-feature-image-2-scaled.jpg6671500Guest Authorhttps://www.fractracker.org/a5ej20sjfwe/wp-content/uploads/2025/09/2025-Wordmark-Logo.pngGuest Author2019-09-17 09:00:492021-04-15 14:56:25New Method for Locating Abandoned Oil and Gas Wells is Tested in New York State