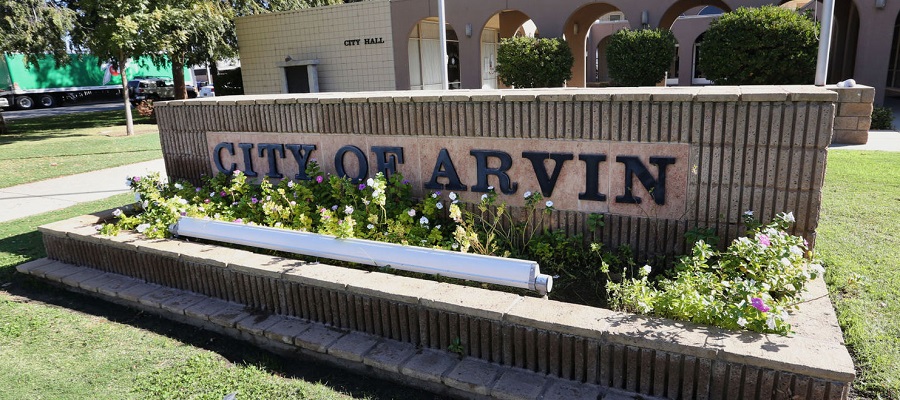
The small city of Arvin, CA has succeeded in taking a brave step forward to protect the public health of its community.
On July 17, 2018 the Arvin City Council voted 3-0 (two members were absent) in support of a setback ordinance. This is the first California oil and gas ordinance that has an actual effect, as it is the first in a region where drilling and fracking are actively occurring. The Arvin, CA setback ordinance prevents wells from being drilled in residential or commercially-zoned spaces. Also, setback distances of 300 feet for new development and 600 feet for new drilling operations have been established for sensitive sites, such as parks, hospitals, and schools.
(To see where other local actions have been taken in California, check out our coverage of local actions and map, which was recently updated.)
More details and maps of the setback ordinance and its development can be found in the initial FracTracker coverage of the proposal, below:
The measure was supported by Arvin Mayor Jose Gurrola. He described the front-lines experience of Arvin citizens:
The road to the update has been difficult for this community. Eight Arvin families were evacuated after a toxic gas leak from an underground oilfield production pipeline located near their homes in 2014. Some have now been re-occupied by concerned residents with no other options; other homes still stand empty. Meanwhile, a short distance away an older pump jack labors day and night next to homes pumping oil mixed with water to a nearby tank. Despite multiple complaints to state agencies of odors and noise by the residents, they are told by the agencies that there is nothing that can be done under the current regulations. The pump jack continues to creak along as children walk nearby on their way to school, covering their faces as the smell occasionally drifts their direction. – Jose Gurrola, Mayor of the City of Arvin
Fugitive Emissions Monitoring
In anticipation of the city council’s vote, FracTracker collaborated with Earthworks and the grassroots organization Central California Environmental Justice Network to visit the urban well sites within the city limits. Using Infrared FLIR technology, the sites were assessed for fugitive emissions and leaks. Visualizing emissions of volatile organic compounds (VOCs) at these sites provides a glimpse to what the community living near these wells are continually exposed. The infrared cameras used in these videos are calibrated to the wavelengths of the infrared spectrum where VOC hydrocarbons of interest are visible.
The map below shows the locations that were visited, as indicated by the three stars. Videos of each site are shown below the map.
In this FLIR video of Sun Mountain Simpson-1, fugitive emissions are obvious. The emissions are coming from the PV vent at the top of the produced water tank. These emissions are a mixture of a variety of volatile organic compounds, such as BTEX compounds and methane. This well site is located between homes, a small apartment complex, and a playground. While on the ground operating the FLIR camera I felt light headed, dizzy, and developed a headache. The emissions were reported to the San Joaquin Valley Air District (SJVAD), who sampled and found VOC concentrations at dangerous levels. The well operator was notified but refused to respond. Unfortunately, because this particular well produces under 50 barrels of oil/day, the site is exempt from any health related emissions regulations.
Sun Mountain Jewett 1-23 Lease
This well site is located near a number of single family homes and next two a park. The well site is also on the future location of the Arvin Community College. The FLIR video below is particularly interesting because it shows fugitive emissions from four different locations. The leaks include one at the well head that is potentially underground, one on separator equipment, and leaks from each of the tank PV hatches. When regulators were notified, they visited the site and fixed two of the leaks immediately. Fugitive emissions from the PV hatches were not addressed because this site is also exempt from regulations.
ABA Energy Corporation Richards Facility Tank Farm
The Richards Facility Tank Farm is a well site located outside the city limits on farmland. The facility is regulated as a point source of air pollution, therefore enforcement action can require the operator to fix leaks even from PV hatches on tanks. This FLIR video shows leaks from PV hatches, and a major leak from a broken regulator valve. A complaint was submitted to the SJVAD, and the operator was required to replace the broken regulator valve.
We are always learning new things at FracTracker. While we have been analyzing and mapping oil and gas (O&G) violations issued by the Department of Environmental Protection (DEP) in Pennsylvania since 2010, we have apparently been under-representing the total amount of issues associated with unconventional drilling in the state.
The reason for the missing violations is that there are inconsistencies with how well pads are classified in the compliance report. Many of these well pads – full of unconventional permits and drilled wells – are indeed categorized as “unconventional” in the DEP compliance data. Others, equally full of unconventional permits and wells, simply leave that field blank.
Therefore, any analysis for unconventional violations is likely to miss some of the incidents that are attributed to the well pad itself, as opposed to any of the wells that are found upon that well pad.
Midas Well Pad unearths issue
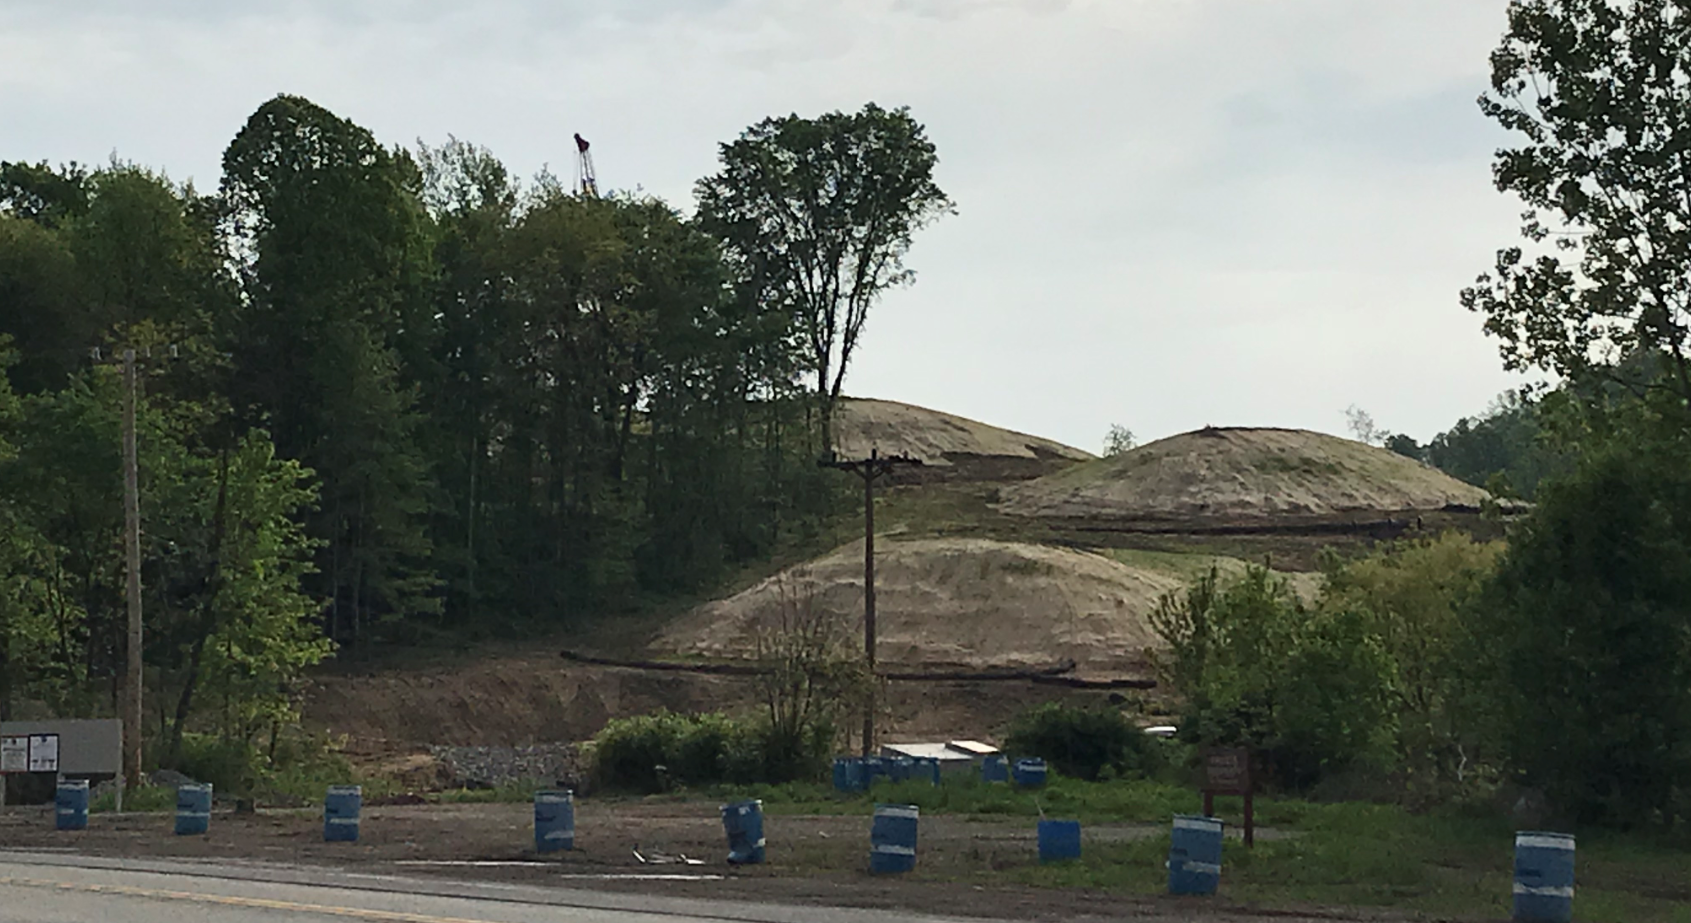
While we have heard about missing violation data in the past, I discovered the nature of the issue while researching the Midas Well Pad in Plum Borough, Allegheny County on the DEP resource site eFACTS, noting the presence of multiple violations at the nascent well site. However, when attempting to download the relevant data on the compliance report, the results were missing. I had entered search parameters that made sense to me, limiting results to violations in the proper county and municipality, and including an inspection date range that was broader than what was showing up on eFACTS. I had also limited results to unconventional wells, because while this is Plum’s first unconventional well pad, the back roads are dotted with dozens – if not hundreds – of conventional O&G sites.
The Midas Well Pad, as seem from Coxcomb Hill Rd. in Plum, PA
After that attempt failed, I downloaded the entire state’s worth of data, whether conventional or not, and I was able to find the 31 violations associated with the well pad.
I contacted DEP about this, wondering whether there was some data irregularity that prevented my search in Plum from finding all of the incidents that occurred there. The reply was somewhat helpful, noting that there was no county, municipality, or unconventional value associated with that well pad in the compliance report, explaining why the search result came up negative.
It is worth noting that the separate well pad report does indeed have values for all of these fields for the Midas Well Pad, so there is a lack of consistency on this issue. Even more importantly, it is worth remembering that any compliance report search that limits results using county, municipality, or unconventional variables are likely to result in incomplete results.
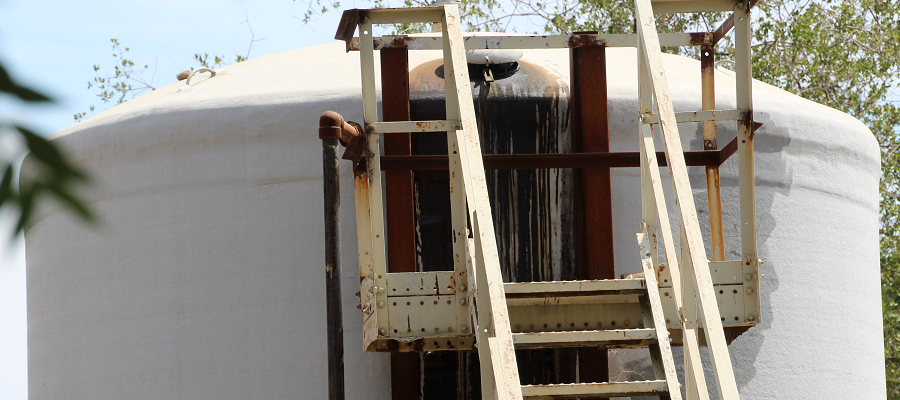
The violations at the Midas Well Pad are focused around erosion and sedimentation issues, wetland impacts, failure to follow approved methodology, and failure to fix some of the problems on subsequent site inspections. The compliance report includes a narrative inspection comment, giving the public a glimpse through the inspector’s eyes. Here is one of several such comments at the site:
Follow up inspection related to wetland impact reported on 2/23/18 and 2/24/18. At the time of inspection, the Operator was actively conducting earth disturbance activity associated with the construction of well pad channel 6. The Department gave verbal permission on 2/27/2018 to deviate from the construction sequence and continue with the construction of PCSM wet pond 1. At the time of inspection wet pond 1 was partially constructed. The outlet structure and emergency spillway associated with wet pond 1. At the time of inspection wet pond 1 was holding water, however the slopes were not temporary stabilized. The Operator indicated that additional work was planned for the wet pond and would be temporary stabilized. The Operator indicated a previously unidentified seep located upgradient and outside of the LOD is contributing additional water to wet pond 1. The Department recommended the Operator identify wet weather springs upgradient from wet pond 1. Additionally, the Department recommends the Operator monitor all additional flow and submit a permit modification outlines changes made to the construction sequence and identifies the location of all toe drains to be constructed on site. The Department and Operator agreed to reschedule an onsite meeting to discuss the remediation of the wetland. Th Department recommends the Operator monitor the vegetative growth in the wetland. The Department recommends that the Operator add additional temporary mulch to the disturbed area and continue to perform routine maintenance to the temporary BMPs.
How pervasive is this problem?
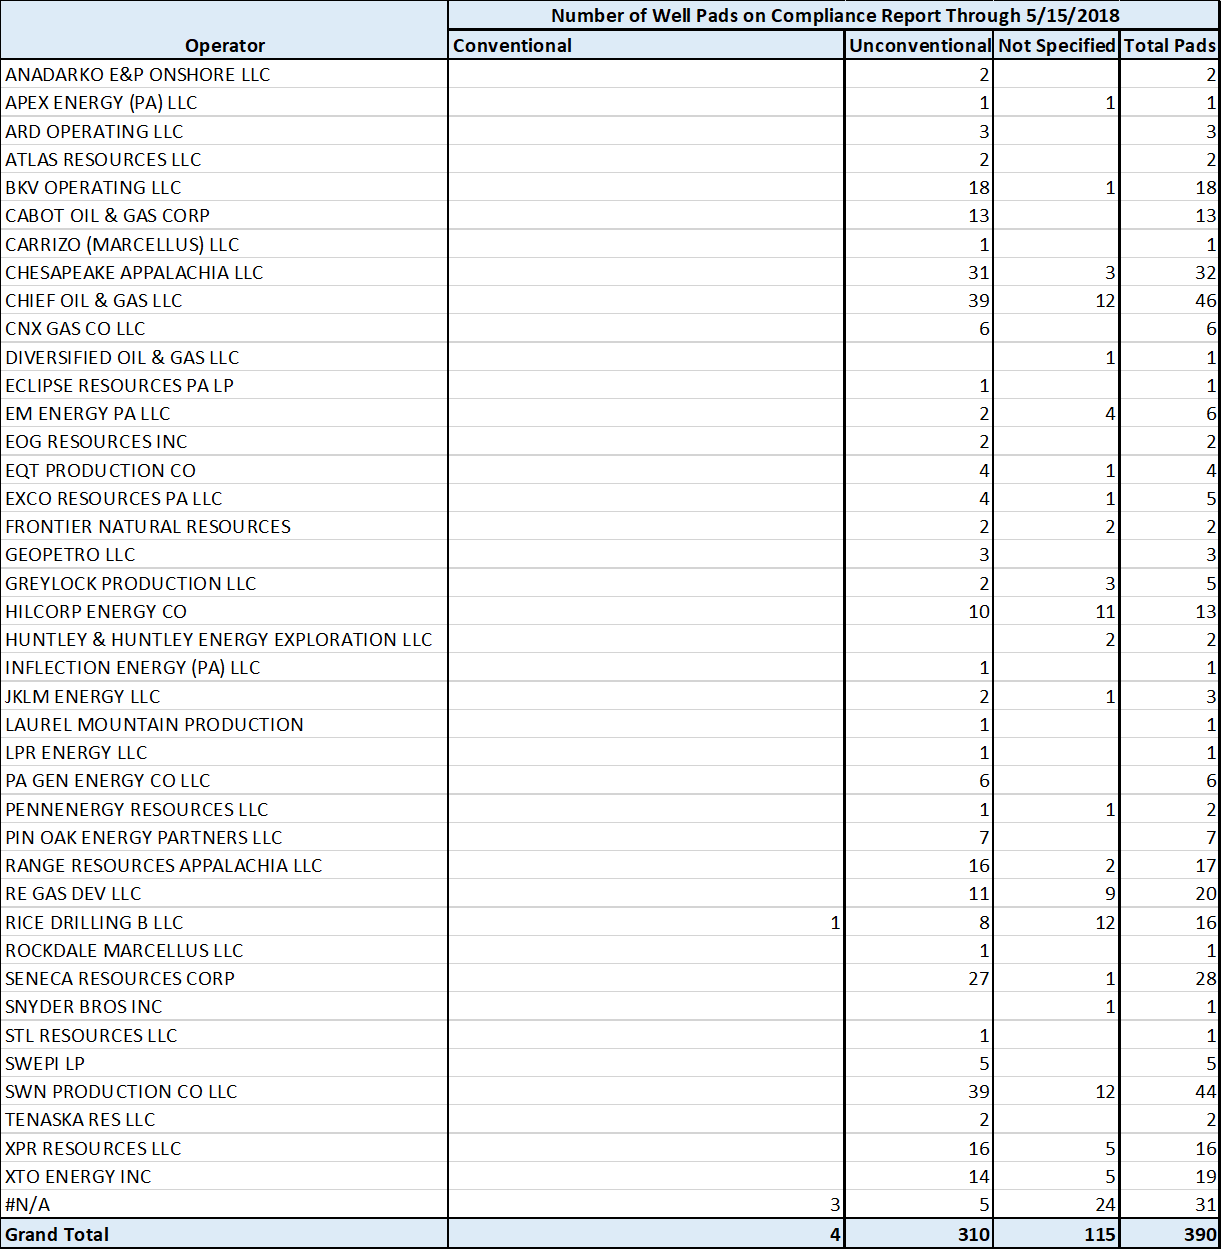
The DEP well pad report contains data on 12,600 wells, situated on 3,715 wells pads. On the compliance side, there are 2,689 violations at 390 different sites that contain the words “Well Pad.” 739 of these violations do not have associated Well API Numbers, and are therefore not shown in our Pennsylvania Shale Viewer map. The number of sites with violations per operator is shown below in Figure 1 (click to expand).
Figure 1: Number of well pads appearing on compliance report by operator, through 5/15/2018. Click on the image to see the full-sized version.
There are four things to note about about Figure 1.
First, this table is not the number of violations on well pads, but merely the count of well pads with violations appearing on the compliance report.
Second, this does not contain any data on wells on those pads that were issued violations – only instances where the well pads themselves were cited are shown.
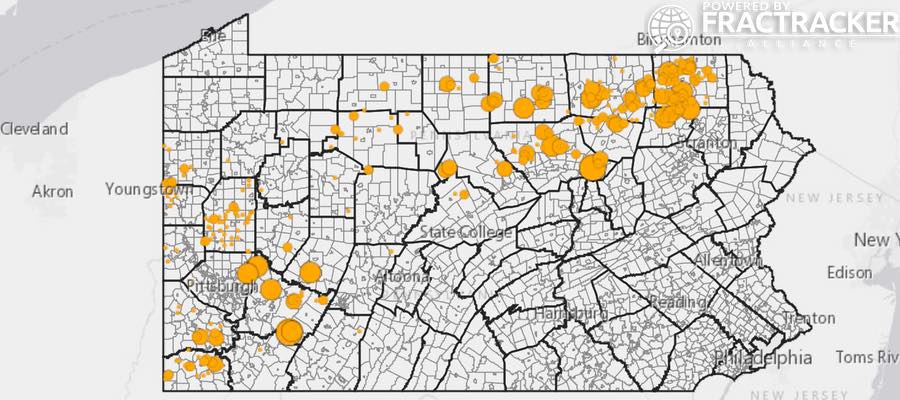
This map shows oil and gas (O&G) violations in Pennsylvania that are assessed to well pads, as opposed to individual wells. To access the map’s legend and other details, click the double-arrow icon at the top-left corner of the map.
The third thing to note about Figure 1 is that there are instances where the same pad falls into more than one category. Hilcorp Energy, for example, has 10 wells in the unconventional category, 11 wells that are not defined, but only 13 total wells, indicating significant overlap between the categories.
And fourth, there are 31 instances where the phrase “well pad” occurs in the compliance report where the unique Site ID# does not appear on the well pad report. In some cases, the name of the facility indicates that it might be for another facility that is related to the well pad, such as “Southwest System – Well Pad 36 to Bluestone Pipeline.” For other entries, such as “Yarasavage Well Pad”, it remains unclear why the Site ID# does not yield a matching entry from the well pad report.
By Matt Kelso, Manager of Data and Technology, FracTracker Alliance
https://www.fractracker.org/a5ej20sjfwe/wp-content/uploads/2018/05/PA-Well-Pad-Violations-Feature.jpg400900Matt Kelso, BAhttps://www.fractracker.org/a5ej20sjfwe/wp-content/uploads/2025/09/2025-Wordmark-Logo.pngMatt Kelso, BA2018-05-23 09:39:172021-04-15 15:01:18Well Pad Violations in Pennsylvania
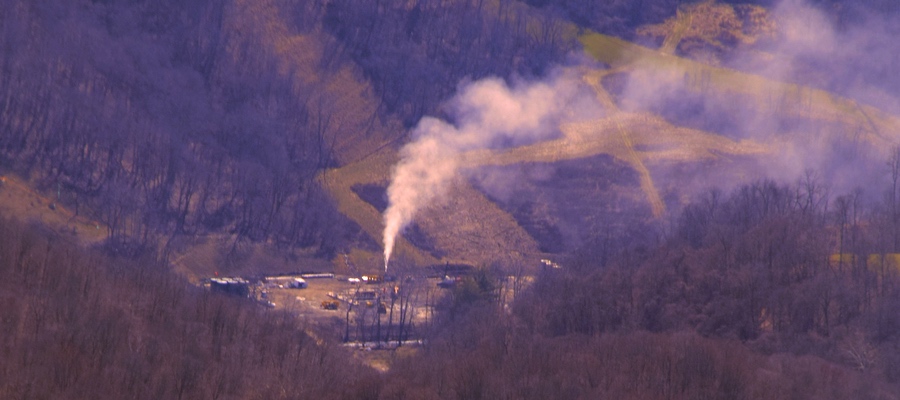
On February 15, 2018, officials evacuated residents after XTO Energy’s Schnegg gas well near Captina Creek exploded in the Powhatan Point area of Belmont County, Ohio. More than two weeks later, the well’s subsequent blowout has yet to be capped, and people want to know why. Here is what we know based on various reports, our Ohio oil and gas map, and our own fly-by on March 5th.
March 19th Update: This is footage of the Powhatan Point XTO Well Pad Explosion Footage from Ohio State Highway Patrol’s helicopter camera the day after the incident:
Powhatan Point XTO well pad explosion footage from Ohio State Highway Patrol
Cause of the Explosion
The well pad hosts three wells, one large Utica formation well, and two smaller ones. XTO’s representative stated that the large Utica well was being brought into production when the explosion occurred. The shut-off valves for the other two wells were immediately triggered, but the explosion caused a crane to fall on one of those wells. The representative claims that no gas escaped that well or the unaffected well.
Observers reported hearing a natural gas hiss and rumbling, as well as seeing smoke. The Powhatan Point Fire Chief reported that originally there was no fire, but that one later developed on the well pad. To make matters worse, reports later indicated that responders are/were dealing with emergency flooding on site, as well.
As of today, the Utica well that initially exploded is still releasing raw gas.
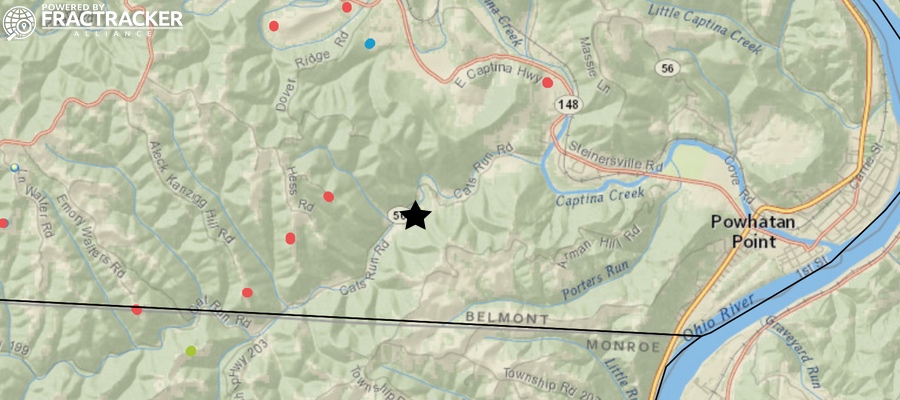
Map of drilling operations in southeast Ohio, with the Feb 15, 2018 explosion on XTO Energy’s Schnegg gas well pad marked with a star. View dynamic map
Public Health and Safety
No injuries were reported after the incident. First responders from all over the country are said to have been called in, though the mitigation team is not allowed to work at night for safety reasons.
The evacuation zone is for any non-responders within a 1-mile radius of the site, which is located on Cat’s Run Road near State Route 148. Thirty (30) homes were originally evacuated within the 1-mile zone according to news reports, but recently residents within the outer half-mile of the zone were cleared to return – though some have elected to stay away until the issue is resolved completely. As of March 1, four homes within ½ mile of the well pad remain off limits.
The EPA conducted a number of site assessments right after the incident, including air and water monitoring. See here and here for their initial reports from February 17th and 20th, respectively. (Many thanks to the Ohio Environmental Council for sharing those documents.)
Much of the site’s damaged equipment has been removed. Access roads to the pad have been reinforced. A bridge was recently delivered to be installed over Cats Run Creek, so as to create an additional entrance and exit from the site, speaking to the challenges faced in drilling in rural areas. A portion of the crane that fell on the adjacent wellhead has been removed, and workers are continuing their efforts in removing the rest of the crane.
The above video by Earthworks is optical gas imaging that makes visible what is normally invisible pollution from XTO’s Powhatan Point well disaster. The video was taken on March 3, 2018, almost 3 weeks after the accident that started the uncontrolled release. Learn more about Earthworks’ video and what FLIR videos show.
An early estimate for the rate of raw gas being released from this well is 100 million cubic feet/day – more than the daily rate of the infamous Aliso Canyon natural gas leak in 2015/16. Unfortunately, little public information has been provided about why the well has yet to be capped or how much gas has been released to date.
Bird’s Eye View
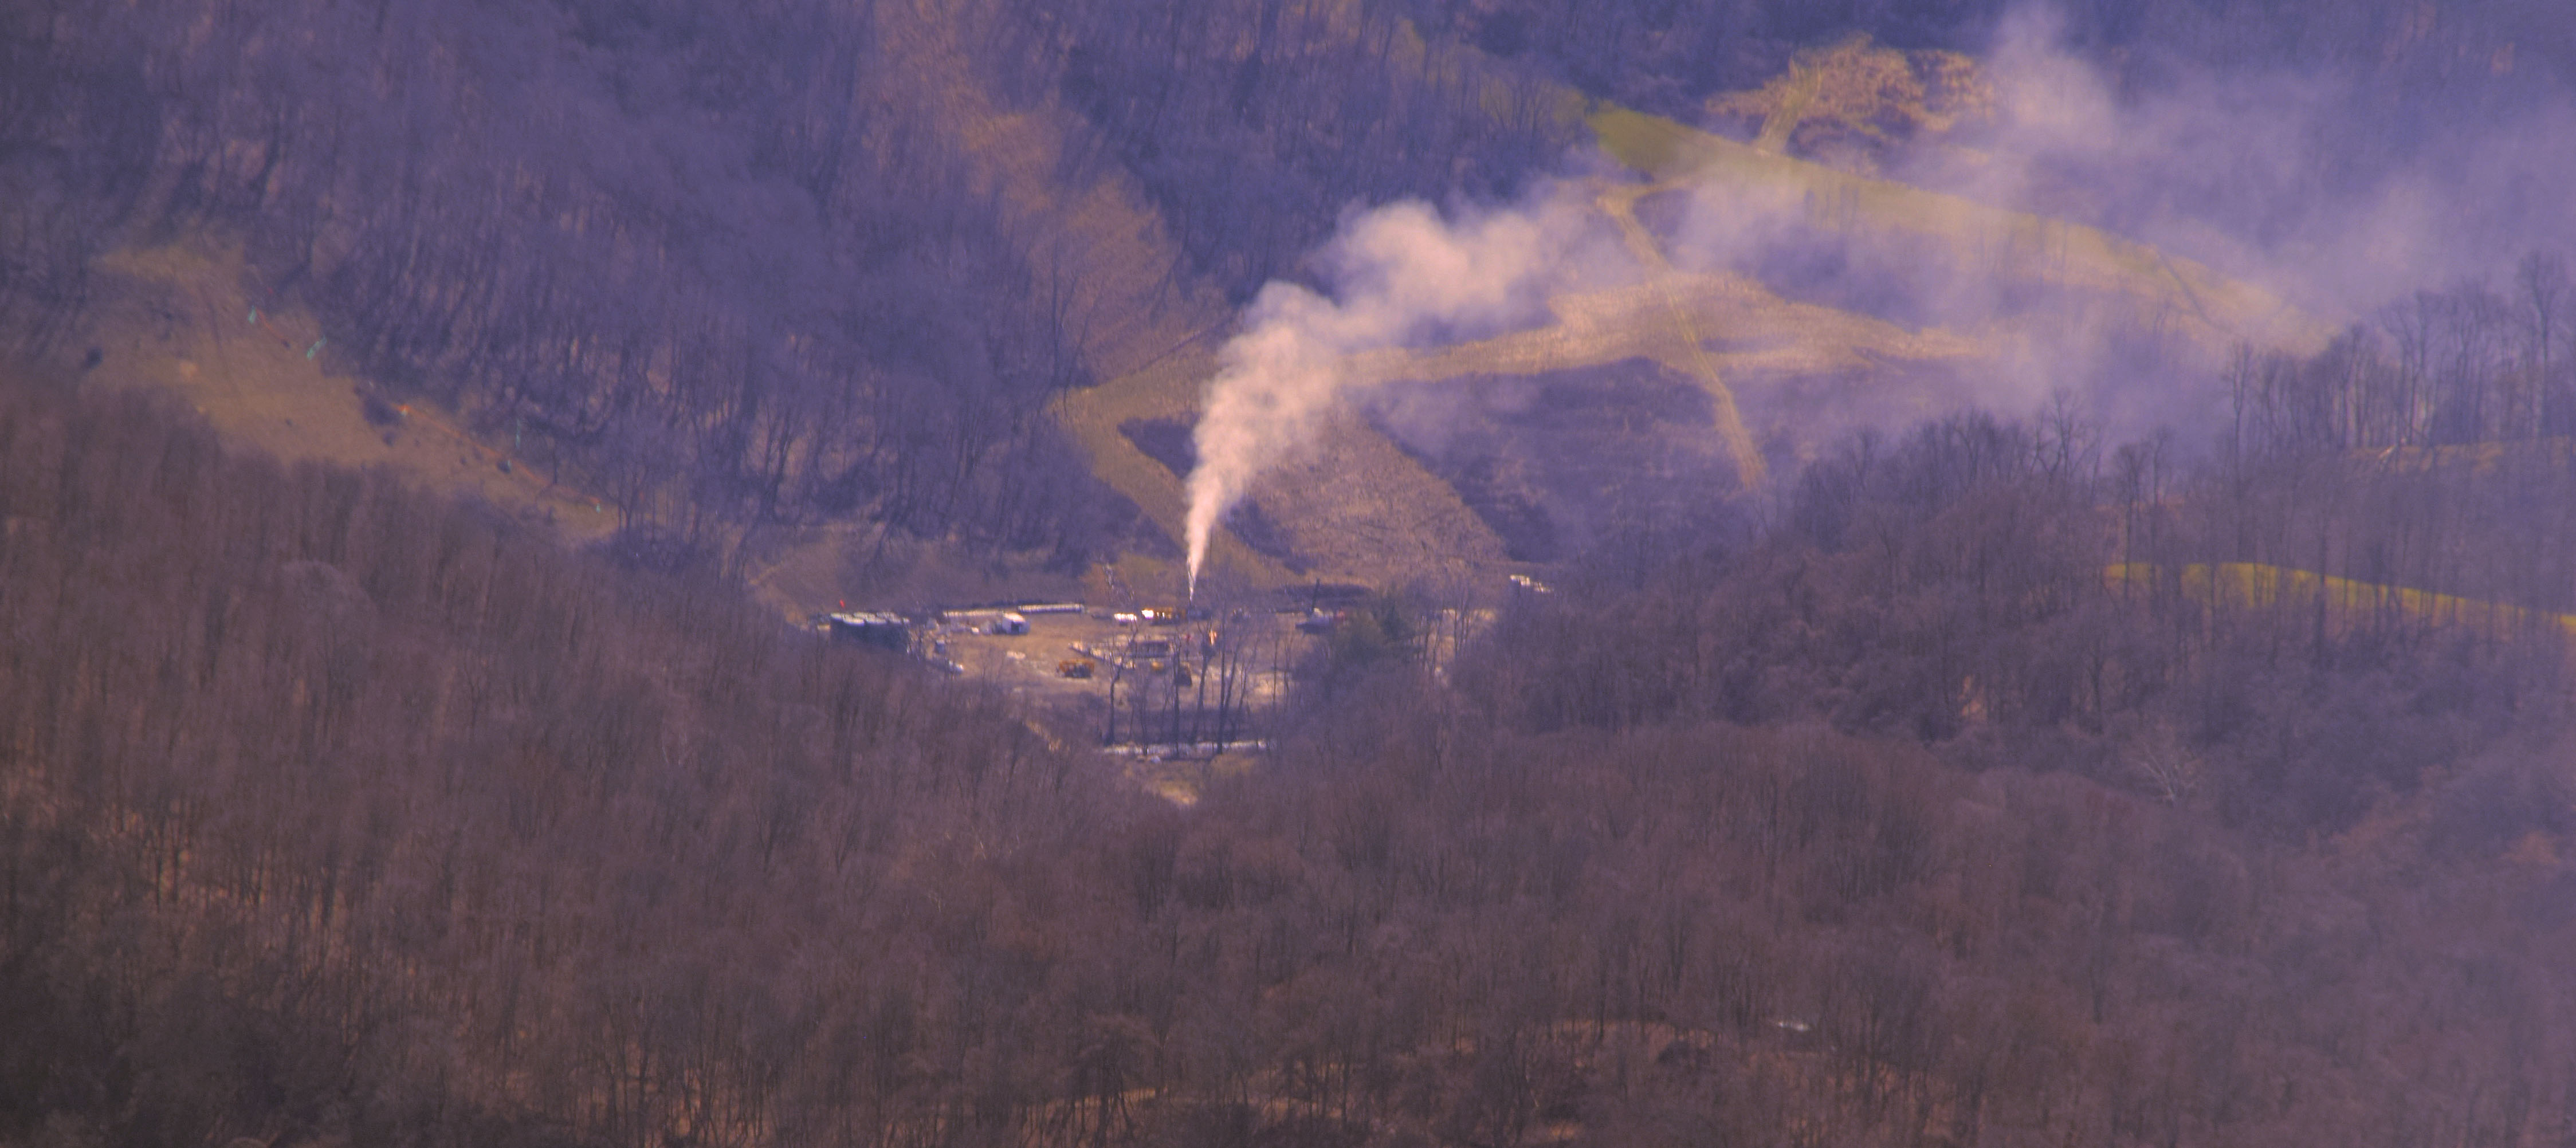
On February 26, a two-mile Temporary Flight Restriction (TFR) was enacted around the incident’s location. The TFR was supposed to lapse during the afternoon of March 5, however, due to complications at the site the TFR was extended to the evening of March 8. On March 5, we did a flyover outside of the temporary flight restriction zone, where we managed to capture a photo of the ongoing release through a valley cut. Many thanks to LightHawk and pilot Dave Warner for the lift.
XTO Energy well site and ongoing emissions after the explosion over two weeks ago. Many are still waiting on answers as to why the well has yet to be capped. Photo by Ted Auch, FracTracker Alliance, March 5, 2018. Aerial support provided by LightHawk
Additional resources
Per the Wheeling Intelligencer – Any local residents who may have been impacted by this incident are encouraged to call XTO’s claims phone number at 855-351-6573 or visit XTO’s community response command center at the Powhatan Point Volunteer Fire Department, located at 104 Mellott St. or call the fire department at 740-312-5058.
https://www.fractracker.org/a5ej20sjfwe/wp-content/uploads/2018/03/XTO-Incident-Feature.jpg400900FracTracker Alliancehttps://www.fractracker.org/a5ej20sjfwe/wp-content/uploads/2025/09/2025-Wordmark-Logo.pngFracTracker Alliance2018-03-06 15:53:362021-04-15 15:01:25Waiting on Answers Weeks after a Well Explosion in Belmont County Ohio
FracTracker Alliance has been mapping the impacts of unconventional oil and gas (O&G) drilling activity in Pennsylvania since 2010, and the Pennsylvania Shale Viewer is our most complete map to show the impacts of the industry.
While it can rightly be said that the development of the Marcellus Shale and other unconventional formations have affected half the state since 2005, this analysis takes a look at high impact areas, as well as a closer look at areas that have been avoided so far.
By Matt Kelso, Manager of Data and Technology, FracTracker Alliance
https://www.fractracker.org/a5ej20sjfwe/wp-content/uploads/2018/01/HighImpactAreas-PA-Feature.jpg400900Matt Kelso, BAhttps://www.fractracker.org/a5ej20sjfwe/wp-content/uploads/2025/09/2025-Wordmark-Logo.pngMatt Kelso, BA2018-02-05 11:47:352021-04-15 15:01:28High Impact Areas and Donut Holes – A Look at Unconventional O&G Activity in PA
The City of Arvin, with a population of about 20,000, is located in Kern County, California just 15 miles southeast of Bakersfield. Nicknamed ‘The Garden in the Sun,’ Arvin is moving forward with establishing new regulations that would limit oil and gas development within the city limits.
Setback Map
The new ordinance proposes setback distances for sensitive sites including hospitals and schools, as well as residentially and commercially zoned parcels. The proposal establishes a 300-foot buffer for new development and 600’ for new operations.
In the map below, FracTracker Alliance has mapped out the zoning districts in Arvin and mapped the reach of the buffers around those districts. The areas where oil and gas well permits will be blocked by the ordinance are shown in green, labeled “Buffered Protected Zones.” The “Unprotected Zones” will still allow oil and gas permits for new development.
There are currently 13 producing oil and gas wells within the city limits of Arvin, 11 of them are located in the protected zones. Those within the protected zones are operated by Sun Mountain Oil and Gas and Petro Capital Resources. They were all drilled prior to 1980, and are shown in the map below.
Information on the public hearings and proposals can be found in the Arvin city website, where the city posts public notices. As of January 24, 2018, these are the current documents related to the proposed ordinance that you will find on the webpage:
In December of 2016, Committee for a Better Arvin, Committee for a Better Shafter, and Greenfield Walking Group, represented by Center for Race, Poverty and the Environment, sued Kern County. The lawsuit was filed in coordination with EarthJustice, Sierra Club, Natural Resources Defense Council, and the Center for Biological Diversity.
The Importance of Local Rule
Self-determination by local rule is fundamental of United States democracy, but is often derailed by corporate industry interests by the way of state pre-emption. There is a general understanding that local governments are able to institute policies that protect the interests of their constituents, as long as they do not conflict with the laws of the state or federal government. Typically, local municipalities are able to pass laws that are more constrictive than regional, state, and the federal government.
Unfortunately, when it comes to environmental health regulations, states commonly institute policies that preserve the rights of extractive industries to access mineral resources. In such cases, the state law “pre-empts” the ability of local municipalities to regulate. Local laws can be considered the mandate of the people, rather than the influence of outside interest on representatives. Therefore, when it comes to land use and issues of environmental health, local self-determination must be preserved so that communities are empowered in their decision making to best protect the health of their citizens.
https://www.fractracker.org/a5ej20sjfwe/wp-content/uploads/2018/01/Arvin_bakersfield_re.jpg400900Kyle Ferrar, MPHhttps://www.fractracker.org/a5ej20sjfwe/wp-content/uploads/2025/09/2025-Wordmark-Logo.pngKyle Ferrar, MPH2018-01-30 11:59:072021-04-15 15:01:28Arvin, CA – a City in the Most Drilled County in the Country – files for a Setback Ordinance
How long will unconventional oil and gas production from PA’s Marcellus Shale continue? The number of active wells may give us a clue.
We have recently updated the PA Shale Viewer, our map of unconventional wells in Pennsylvania. As I updated the statistics to reflect the updated data, I noticed that the number of wells with an active status ticked downward, just as it had for the previous update.
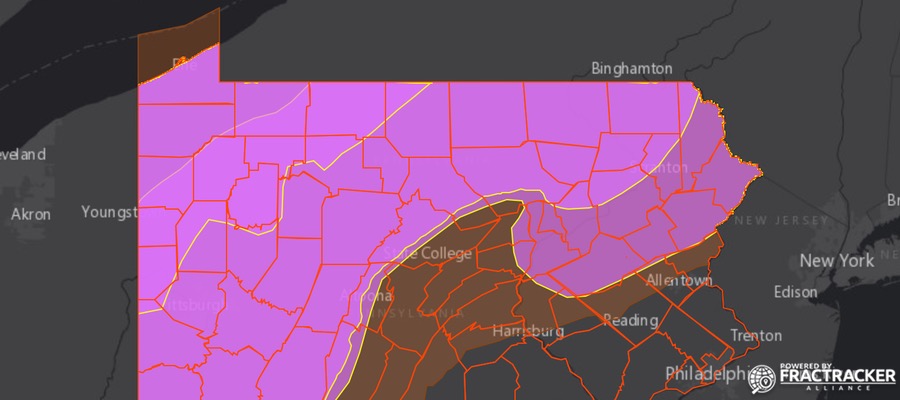
Wells on this map are shown in purple when zoomed out, but are organized by status as you continue to zoom in. The various statuses are shown below, as defined by the Pennsylvania Department of Environmental Protection (DEP).
Active – permit has been issued and well may or may not have been drilled or producing, but has not been plugged.
Proposed but Never Materialized – permit was issued, but expired prior to the commencement of drilling.
Plugged OG Well – permit issued and well has been plugged by well operator.
Operator Reported Not Drilled – permit issued, but operator reported to DEP that they never drilled the well.
DEP Abandoned List – an abandoned well that has been inspected by DEP.
DEP Orphan List – A well abandoned prior to April 18, 1985, that has not been affected or operated by the present owner or operator and from which the present owner, operator or lessee has received no economic benefit other than as a land.
DEP Plugged – a DEP Abandoned or DEP Orphan well that has been plugged by DEP,
Regulatory Inactive Status – a well status that is requested by well operator and has been granted by DEP. Well is capable of producing, but is temporarily shut in. Granted for initial 5 years and must be renewed yearly after first 5 years.
Abandoned – a well that has not been used to produce, extract or inject any gas, petroleum or other liquid within the preceding 12 months; for which equipment necessary for production, extraction or injection has been removed; or considered dry and not equipped for production.
Life Expectancy Stats
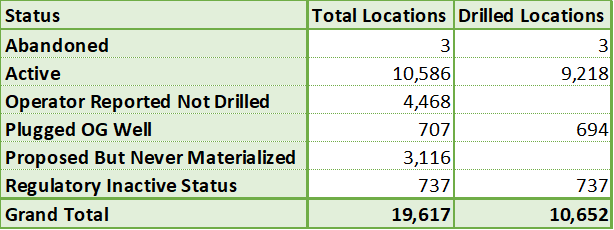
Table 1: Unconventional well locations in Pennsylvania by status. The determination of drilled locations was made by the presence of a spud date in the DEP dataset.
Currently, there are 10,586 well locations with an active status, 9,218 of which have been drilled. There 19,617 unconventional well locations in Pennsylvania when considering all status types, 10,652 of which have been drilled. The drill status was determined by whether or not there was an associated spud date in the dataset. The 13 plugged wells that lack spud dates likely represent some minor data entry errors of one sort or another, as a well would logically need to be drilled prior to being plugged.
Using the available data, we can see that 6.5% of drilled unconventional wells have been plugged, and an additional 6.9% have a regulatory inactive status, more commonly known as “shut-in” wells, leaving 86.5% of the drilled wells with an active status. Three wells are classified as abandoned, including two in Washington County attributed to Atlas Resources, LLC, and one operated by EQT Production Co. in Jefferson County. EQT submitted a request to convert the status of this latter well to inactive status in February 2016, but DEP has not made a decision on the application as of yet.
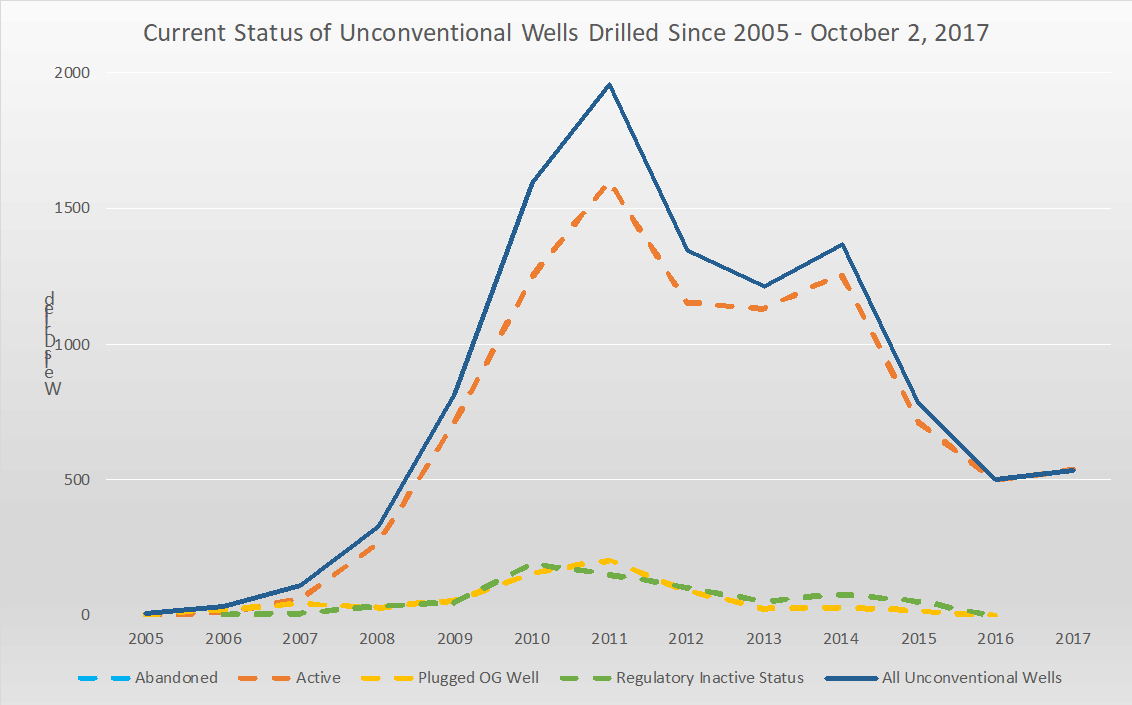
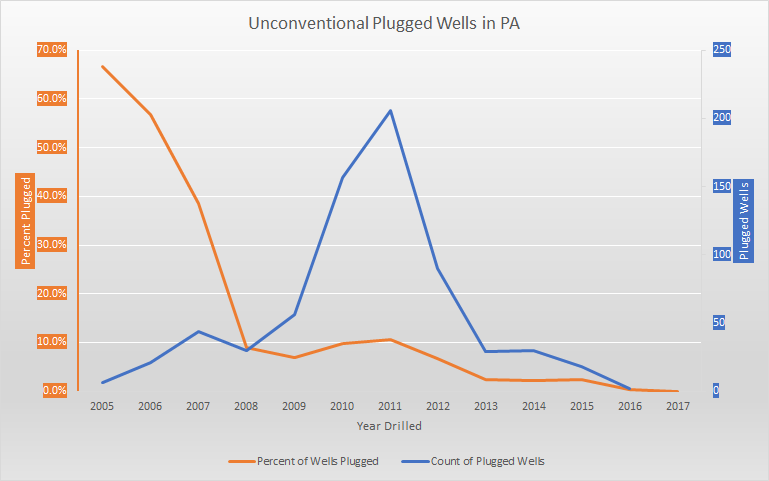
Chart 1: This chart shows the current status of unconventional wells in Pennsylvania, arranged by the year the well was drilled. Note that there are two abandoned wells in 2009 and one more in 2014, although those totals are not visible at this scale.
The top, solid blue line in Chart 1 shows the total number of unconventional wells drilled in Pennsylvania, which is based on the available spud date in the dataset. Focusing on this line for a moment, we can see a huge spike in the number of wells drilled in the early part of this decade. In fact, over 46% of the unconventional wells in the state were drilled between 2010 and 2012, and over 70% were drilled between 2010 and 2014. The 504 unconventional wells drilled in 2016 represents just over one quarter the total from 2011, when 1,959 wells were drilled. The 2017 totals are already slightly higher than 2016, with two months left to go in the year, but will not approach the totals from 2010 to 2014.
This drop-off in drilling since the 2011 peak is usually attributed to the glut of natural gas that these wells produced, and the Marcellus remains a highly productive formation, despite the considerable decline in new wells. Eventually, however, the entire formation will go into decline, which is already happening to the Barnett Shale in Texas and Haynesville Shale, among others, where peak production was several years ago in each case.
While all of three of these formations still produce significant quantities of gas, it is worth remembering that production is only half of the equation. In the Marcellus region, average costs were $6.6 million in 2014, which was projected to decrease to $6.1 million per well in 2015 according to a 2016 EIA document.
With the supply in the northeast outpacing demand, the gas prices stay low, and therefore production per well needs to be considerable to make a given well worthwhile.
Plugging Trends
Chart 2: Average days between spud date and plug date for unconventional wells in PA. Regulatory Inactive wells also include a plug date, and are included here.
Chart 2 shows the average number of days between the spud date and the plug date for wells that currently have either a plugged (n=694) or regulatory inactive (n=737) status. The regulatory inactive wells are relatively consistent in the days between when the well is drilled and temporarily plugged, which makes sense, as the operators of these wells typically intend for these wells to be shut-in upon completion.
However, it is interesting to note that wells are being plugged much more rapidly than they had been in the early part of the Marcellus boom.
Plugged unconventional wells that were drilled in 2005 (n=6) had an average of 3,081 days between these dates, while those drilled in 2016 (n=2) had and average span of 213 days.
The left (orange) axis represents the percentage of wells drilled in each year that are currently drilled. The right (blue) axis marks the total number of wells drilled in each year that are currently drilled.
Obviously there would be no way for a well drilled in 2016 to have been online for 3,081 days before being plugged. However, each of the six plugged wells drilled in 2005 were active for at least 1,899 days before being sealed, which is over five years of activity. In contrast, 99 of the 4,966 unconventional wells drilled in the previous 1,899 days have already been plugged, representing 5.2% of the total wells drilled during that time. This means that we are seeing more “misses” at this point in the formation’s history, where the amount of gas being produced doesn’t justify keeping the well open and offsetting the $6 million or more that it cost to drill the well.
We can also see that the rate of plugged wells increases dramatically after about ten years in operation. Forty-four out of 114 (39%) of unconventional wells that were drilled in 2007 are now plugged. That ratio grows two thirds of the nine wells drilled in 2005. In the industry’s boom period of 2010 to 2010, the raw number of plugged wells are elevated, peaking at 206 in 2011, but the percentage of plugged wells during those years remains proportional to the rest of the trend. The overall trend shows that an unconventional well in Pennsylvania that lasts 11 or more years is unusual.
The data show that older Marcellus wells in Pennsylvania are certainly in a state of decline, and are rapidly being plugged. While the overall production of the field remains high, it remains to be seen what will happen as the boom cycle wells drilled from 2010 to 2012 start to go offline in considerable numbers. Given that more and more wells are being drilled with very short production lives, will it continue to make sense for the industry to drill expensive wells in a formation where a return on investment is increasingly questionable? This course is difficult to predict, but economic models that take plentiful natural gas supplies for granted should consider taking a second look.
PA Shale Viewer Data Sources
Unconventional Violations
Source: PADEP
Date Range: 1-1-2000 through 10-2-2017
Notes: For the original data, follow link above to “Oil and Gas Compliance Report”. Latitude and longitude data obtained by matching with permits data (see below). There are 7,655 rows of violations data, including 6,576 distinct Violation IDs issued to 2,253 distinct unconventional wells. Due to the large number of records, this layer isn’t visible until users zoom in to 1:500,000, or about the size of a small county.
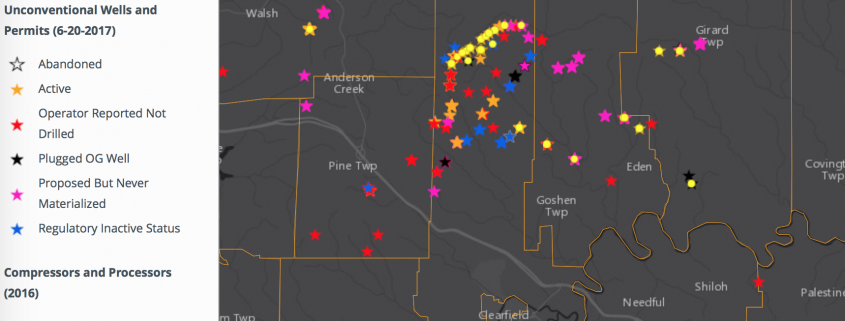
Unconventional Wells and Permits
Source: PADEP Open Data Portal
Date Range: 1-1-2000 through 10-2-2017
Notes: This data layer contains unconventional well data in Pennsylvania. However, not all of these wells have been drilled yet. This layer is categorized by well status, which includes Abandoned, Active, Operator Reported Not Drilled, Plugged OG Well, Proposed but Never Materialized, and Regulatory Inactive Status. To determine whether the well has been permitted, drilled, or plugged, look for the presence of an entry in the Permit Date, Spud Date, and Plug Date field, respectively. Altogether, there are 19,617 wells in this inventory, of which 10,586 currently have an active status. Due to the large number of records, this layer isn’t visible until users zoom in to 1:500,000, or about the size of a small county.
SkyTruth Pits (2013)
Source: SkyTruth
Date Range: 2013
Notes: Prior to December 2014, this map contained a layer of pits that were contained in Oil and Gas Locations file available on PASDA. However, that layer was far from complete – for example, it included only one pit in Washington County at a time which news reports mentioned that seven pits in the county were scheduled to be closed. Therefore, we have opted to include this crowdsourced layer developed by SkyTruth, where volunteers analyzed state aerial imagery data from 2013. SkyTruth’s methodology for developing the dataset is detailed in the link above. 529 pits have been identified through this effort.
Compressors and Processors (2016)
Source: EDF, CATF, Earthworks, FracTracker Alliance, EPA, PADEP, EIA
Date: 2016
Notes: This layer is based off of publicly available data, but is not published by any agency as a dataset. It is the result of a collaborative effort, and the data first appeared in map format on the Oil and Gas Threat Map (oilandgasthreatmap.com). Original sources include PADEP, US EPA, and US EIA. Compiling, processing, and geocoding by Environmental Defense Fund, Clean Air Task Force, Earthworks, and FracTracker Alliance. Contact Matt Kelso for more information: kelso [at] fractracker.org.
Environmental Justice Areas
Source: PADEP, via PASDA
Date: 2015
Notes: Environmental Justice (EJ) areas are Census Tracts where over 20 percent of the population is in poverty, or over 30 percent of the population is non-white. The program is designed to monitor whether there is a fair distribution of environmental benefits and burdens. In Pennsylvania, EJ areas tend to be clustered in urbanized areas, particularly near Philadelphia and Pittsburgh.
Counties
Source: US Census Bureau, FracTracker Alliance
Date Range: 2011
Notes: This file was created by dissolving the Municipalities layer (below) to the county level. This method allows for greater detail than selecting the Pennsylvania counties from a national file.
Municipalities
Source: US Census Bureau
Date Published: 2011
Notes: Viewer must be zoomed into scales of 1:1,500,000 (several counties) or larger to access.
Watersheds – Large
Source: USDA/USGS
Date Published: 2008
Notes: Clipped to outline of Pennsylvania.
Watersheds – Small
Source: USDA/USGS
Date Published: 2008
Notes: Clipped to outline of Pennsylvania. Viewer must be zoomed into scales of 1:1,500,000 (several counties) or larger to access.
By Matt Kelso, Manager of Data and Technology, FracTracker Alliance
https://www.fractracker.org/a5ej20sjfwe/wp-content/uploads/2017/10/Marcellus-PA-Feature.jpg400900Matt Kelso, BAhttps://www.fractracker.org/a5ej20sjfwe/wp-content/uploads/2025/09/2025-Wordmark-Logo.pngMatt Kelso, BA2017-10-11 09:56:342021-04-15 15:02:31What is the Life Expectancy of the Marcellus Shale?
By Kirk Jalbert, Manager of Community-Based Research and Engagement and Matt Kelso, Manager of Data and Technology
FracTracker recently updated its Pennsylvania Shale Viewer to reflect the latest data on unconventional oil and gas permits and active wells in the state. Within this data, we noticed an increase in permitting over the past year for Allegheny County, PA. We have worked on a number of recent initiatives aimed at expanding conversations about unconventional oil and gas drilling by mapping mineral rights leasing and zoning ordinances in Allegheny County. In this article, we bring these various analyses together.
The analysis below can assist residents and public officials in preparing for what appears to be a pending wave of new development.
Untapped Reserves
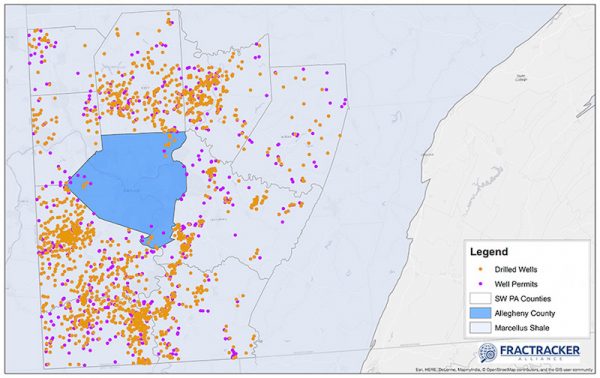
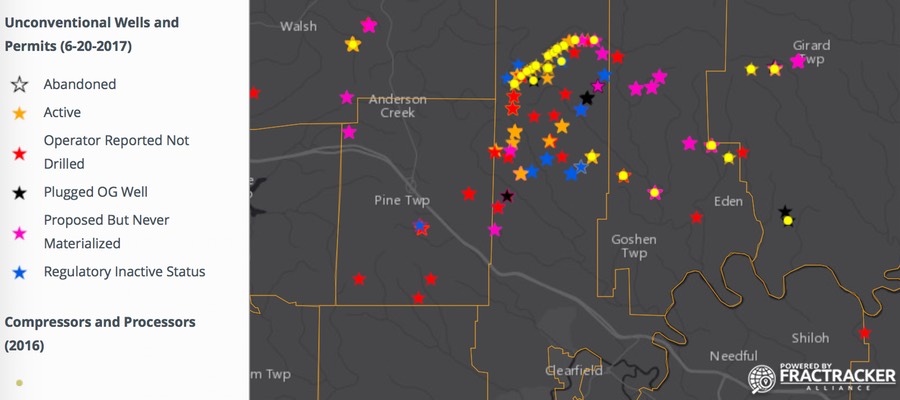
Over the past decade, unconventional oil and gas development has predominantly occurred in areas where shale formations are densest and most productive. For instance, the map below illustrates wells and permits in Southwestern Pennsylvania that track along the Marcellus Shale. An outlier on the map is Allegheny County when compared to its neighbors such as Washington and Greene Counties just to the south—two of the most drilled in the Commonwealth.
Unconventional wells and permits in Southwest Pennsylvania
A few factors may explain these spatial anomalies. First, oil and gas companies are generally reluctant to operate in heavily populated areas. This is partly due to the complications of acquiring leases and easements in tightly packed communities.
Infrastructure is second consideration. In the absence of compressor stations and midstream pipelines, companies can’t get their product to market.
A third factor is the stronger political opposition often found in urban centers. For example, Pittsburgh’s 2010 fracking ban pushed back against drillers and had a chilling effect in bordering municipalities. Many of Allegheny County’s municipalities have, thus, had the luxury of putting oil and gas-related land use decisions on the back burner. Nevertheless, operators have maintained interest in extracting untapped shale reserves that lie beneath their borders.
Recent Permitting & Drilling Trends
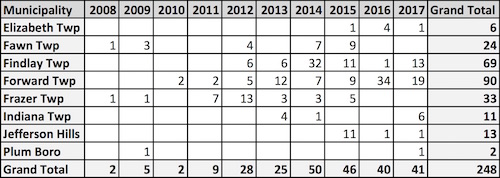
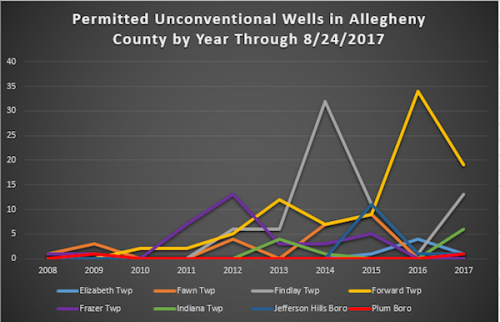
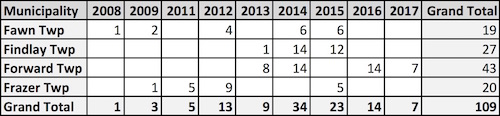
Within Allegheny County, PA, there are now 24 well pads containing a combined 248 permitted wells, of which 109 currently have an active status. On average, these numbers show a 20% increase in well permits annually (40-50 per year) since 2014. This figure compares to less than 10 per year prior to 2012. Furthermore, while only partway through 2017, we’ve already reached this 20% increase in new permits (41 since 8/24), with the overwhelming number of these being issues for Findlay and Forward Townships. A table and graph of permitting activity since 2008 is seen below.
Table and graph of permitted wells in Allegheny County
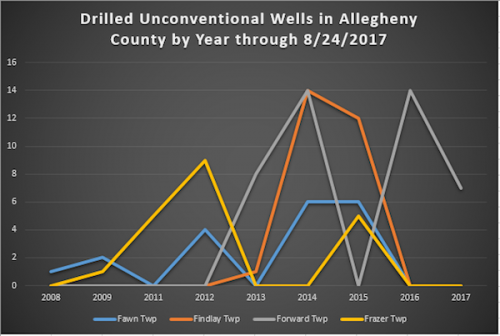
Interestingly, the number of active wells over the past few years does not track with increasing number of permits. In fact, active wells peaked in 2014-2015 and have steadily declined since, as is seen in the table and graph below. We credit these opposing trends to operators placing their wells into inactive status during a period of lower gas prices. Meanwhile, operators are increasing their applications for new wells in preparation for a predicted rebound as well as new pipelines and processing facilities coming online for delivering to new markets.
Table and graph of active wells in Allegheny County
Predicting Development: Mineral Rights Leasing
The locations of permits and active wells are not always good indicators of long-term future development. A better picture can be painted with data on properties leased for eventual drilling. In 2016, FracTracker built the Allegheny County Lease Mapping Project, which revealed the extent of oil and gas leasing agreements across the region. From that work came some interesting findings.
There are 467,200 acres in Allegheny County. We found 63,014 acres (18% of the county) are under some kind of oil and gas agreement – this includes mineral rights leases, as well as other agreement such as pipeline rights of ways. It is important to note that as many as 15% of the records we obtained in executing the project could not be mapped due to missing metadata (many block/lot numbers were no longer provided with online records after 2010), so these are conservative estimates.
The list below shows the top five municipalities found to have the most leases. Of note is how West Deer, North Fayette, and Elizabeth townships all have a significant number of leases, but do not yet register in permitting activity.
Most Leased Municipalities in Allegheny County, PA
West Deer Township (5,325 leases)
North Fayette Township (5,070 leases)
Elizabeth Township (4,070 leases)
Fawn Township (3,872 leases)
Forward Township (3,801)
We also discovered that more than 70% of leased properties were zoned residential or agricultural, despite the fact that unconventional oil and gas development is a highly disruptive and industrialized activity. The list below shows a breakdown of zoning designations.
Leased Properties Zoning
Residential (37%)
Agricultural (34%)
Commercial (23%)
Industrial (3%)
Other (3%)
Status of Protective Zoning
In 2013, the Pennsylvania Supreme Court upended state laws governing local oil and gas zoning rights with its landmark Robinson Township v. Commonwealth of Pennsylvania decision. The court struck down parts of Act 13 that imposed statewide zoning standards for oil and gas development. Zoning ordinances with stronger ordinances are now being adopted by some townships. However, many others have zoning codes that reflect pre-Robinson language, which allows mineral extraction everywhere, regardless of whether it is a compatible land use.
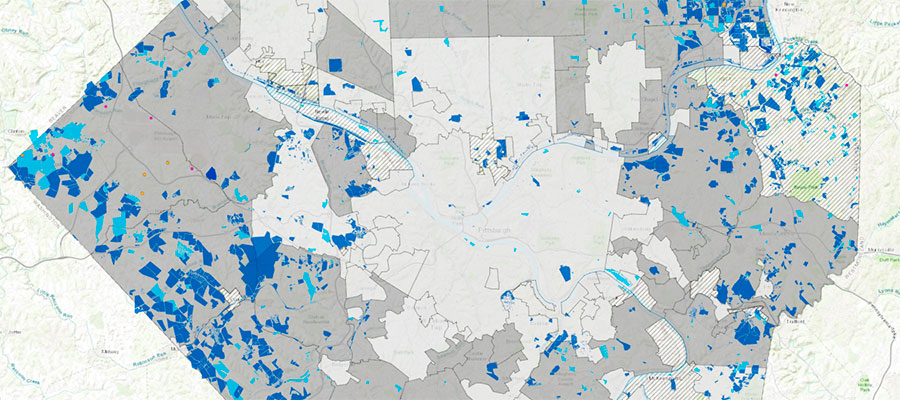
Drawing the connections between drilling trends, leasing activity, and protective zoning is, therefore, significant. Over the past six months, FracTracker has worked with Food & Water Watch to put our lease mapping data and state drilling data in context with assessments of Allegheny County’s municipal oil and gas zoning ordinances. The map below illustrates these overlaps.
Map of Allegheny County Drilling, Leasing, and Zoning
Allegheny County contains 130 municipalities. Food & Water Watch was able to obtain and review zoning codes for 104 of these 130. At least 56 municipalities have no zoning ordinances specific to oil and gas development. Of greatest concern, when placed in context with leasing and permitting data, FracTracker found that leases already existed in 43 of these 56 municipalities without oil and gas ordinances, although 8 of these 43 were found to have other less restrictive language regulating specific oil and gas activities, such as seismic testing. Fawn Township, one of the most permitted and most leased municipalities in the county, was found to have no oil and gas zoning ordinance.
Conclusions
It’s important to recognize that there is a significant difference between conventional oil and gas development and today’s heavily industrialized unconventional extraction industry. In many of Allegheny County’s municipalities there seems to be a presumption that there is no need to prepare zoning codes for drilling, despite data that suggest increased oil and gas development may be just around the corner.
With the deeper understanding of Allegheny County’s permitting trends, leasing activities, and the state of protective zoning presented in this article, municipalities would be wise to assess where they stand. Reviewing and updating their respective zoning codes to determine if they sufficiently address concerns related to unconventional drilling could be the most effective way to protect the interests of their residents.
https://www.fractracker.org/a5ej20sjfwe/wp-content/uploads/2017/08/AC_Zoning_header.jpg400900FracTracker Alliancehttps://www.fractracker.org/a5ej20sjfwe/wp-content/uploads/2025/09/2025-Wordmark-Logo.pngFracTracker Alliance2017-08-28 15:34:482021-04-15 15:02:35Allegheny County, PA – Drilling, Leasing, and Zoning Trends
Recently, the Pennsylvania Department of Environmental Protection (DEP) started to offer additional data resources with the introduction of the Open Data Portal. This development, along with the continued evolution of the ArcGIS Online mapping platform that we utilize has enabled some recent enhancements in our mapping of Pennsylvania oil and gas infrastructure. We’ve made changes to the existing Pennsylvania Shale Viewer for unconventional wells, and created a Conventional and Historical Wells in Pennsylvania map.
Unconventional Wells
Rather than defining the newer, industrial-scaled oil and gas wells by specific geological formations, configuration of the well, or the amount of fluid injected into the ground during the hydraulic fracturing process, Pennsylvania’s primary classification is based on whether or not they are considered to be unconventional.
Unconventional Wells – An unconventional gas well is a bore hole drilled or being drilled for the purpose of or to be used for the production of natural gas from an unconventional formation. An unconventional formation is defined as a geologic shale formation below the base of the Elk Sandstone or its geologic equivalent where natural gas generally cannot be produced except by horizontal or vertical well bores stimulated by hydraulic fracturing.
The previous structure of the PA Shale Viewer had separate layers for permits, drilled wells, and violations. This version replaces the first two layers with a single layer of unconventional locations, which we have called “Unconventional Wells and Permits” for the sake of clarity. The violations layer appears in the same format as before. When users are zoomed out, they will see generalized layers showing the overall location of O&G infrastructure and violations in the state, which were formed by creating a one mile buffer around these features. As users zoom in, the generalized layers are then replaced with point data showing the specific wells and violations. At this point, users can click on individual points and learn more about the features they see on the map.
Figure 1. PA Shale Viewer zoomed in to see individual wells by status
O&G locations are displayed by their well status, as of the time that FracTracker processed the data, including: Abandoned, Active, Operator Reported Not Drilled, Plugged OG Well, Proposed but Never Materialized, and Regulatory Inactive Status. Note that just because a well is classified as Active does not mean that it has been drilled, or even necessarily permitted. These milestones, along with whether or not it has been plugged, can be determined by looking for entries in the permit issue date, spud date, and plug date entries in the well’s popup box.
Conventional and Historical Wells
The map below shows known conventional wells in Pennsylvania along with additional well locations that were digitized from historical mining maps.
Although there are over 19,000 unconventional oil and gas locations in Pennsylvania, this figure amounts to just 11% of the total number of wells in the state that the DEP has location data for, the rest being classified as conventional wells. Furthermore, in a state that has been drilling for oil and gas since before the Civil War, there could be up to 750,000 abandoned wells statewide.
The DEP has been able to find the location of over 30,000 of these historical wells by digitizing records from old paper mining maps. This layer has records for 16 different counties, but well over half of these wells are in just three counties – Allegheny, Butler, and Washington. It looks like it would take a lot more work to digitize these historical wells throughout the rest of the state, but even when that happens, we will probably still not know where the majority of the old oil and gas wells in the state are located.
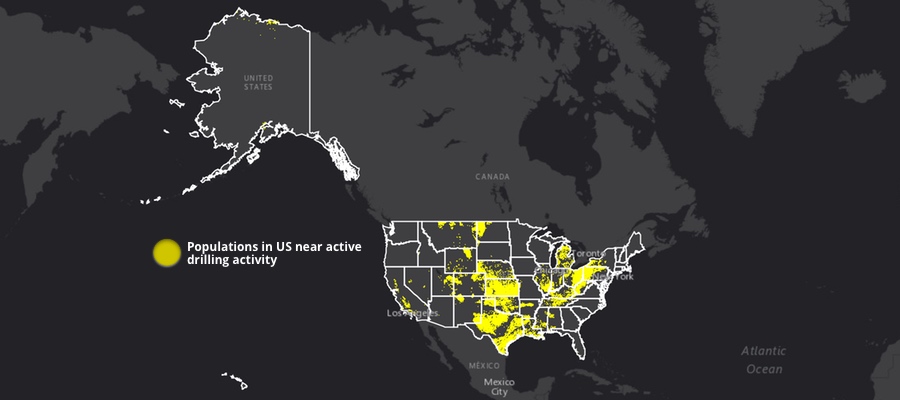
Each year, FracTracker Alliance compiles a national well file to try to assess how many wells have been drilled in the U.S. We do this by extracting data from the various state regulatory agencies that oversee drilling in oil and gas producing states. We’re a little late posting the results of our 2016 analysis, but here it is.
Based on data from 2014-2015, 34 states * saw drilling activity, amounting to approximately 1.2 million facilities across the U.S. – from active production wells, to natural gas compressor stations, to processing plants.
The process we used to count these wells and related facilities for the 2016 analysis changed a bit this time around, which obviously impacts the total number of wells in the dataset. 2016’s compilation was created in consultation with Earthworks, for the purpose of informing the Oil and Gas Threat Map project. The scope was more restrictive than previous editions (see our 2014 and 2015 analyses), focusing only on wells that we were reasonably confident were actively producing oil and gas wells, thus excluding wells with inactive or uncertain statuses, as well salt water disposal (SWD) and other Class II injection (INJ) well types.
There are facilities included in this dataset that we don’t normally tally, as well (See Table 1 below). Earthworks was able to determine the latitude and longitude coordinates of a number of compressors and other processing plants, which are included in the dataset below and final map.
In all, the facility counts are reduced from about 1.7 million in 2015 to about 1.2 million in 2016, but this is more a reflection of the definition than substantial changes in the active well inventory in the U.S. You can explore this information by state, and additional results of this project, using Earthworks’ Threats Maps. Additionally, the national well file is available to download below.
You’ll notice that we don’t refer to the wells in this analysis as “fracked” wells. The primary reason for not using such terminology is because no one common definition exists across those states for what constitutes a hydraulically fractured well. In PA, for example, such wells are considered “unconventional” because drilling occurs in an unconventional formation and usually involves some sort of well stimulation. Contrastingly, in CA, often drillers use “acidizing” not fracking – a similar process that breaks up the ground using acidic injected fluids instead of the high pressure seen in traditional fracking. As such, we included all active oil and gas production instead of trying to limit the analysis to just wells that have been stimulated. We will likely continue to use this process until a federal or national definition of what constitutes a “fracked” well is determined.
Table 1. Facilities by State and Type
State
Count of Facilities by Type
Grand Total
Compressor
Processor
Well
AK
7
3,356
3,363
AL
17
7,016
7,033
AR
231
8
13,789
14,028
AZ
40
40
CA
7
21
92,737
92,765
CO
426
49
50,881
51,356
FL
2
102
104
ID
6
6
IL
5
48,748
48,753
IN
7,374
7,374
KS
9
90,526
90,535
KY
5
11,769
11,774
LA
6,486
94
2,555
9,135
MI
19
16,525
16,544
MO
2
687
689
MS
6
4,556
4,562
MT
5
9,768
9,773
ND
19
13,024
13,043
NE
1
16,202
16,203
NM
902
37
57,839
58,778
NV
176
176
NY
12,244
12,244
OH
29
10
90,288
90,327
OK
856
96
29,042
29,994
OR
56
56
PA
452
11
103,680
104,143
SD
408
408
TN
15,956
15,956
TX
758
315
397,776
398,849
UT
18
20,608
20,626
VA
9,888
9,888
WI
1
1
WV
20
16,118
16,138
WY
325
48
38,538
38,911
Grand Total
10,472
825
1,182,278
1,193,575
* NC facilities are not included because the state did not respond to multiple requests for the data. This exclusion likely does not significantly affect the total number of wells in the table, as historically NC only had 2 oil and gas wells.
https://www.fractracker.org/a5ej20sjfwe/wp-content/uploads/2017/03/34-states-feature.jpg400900FracTracker Alliancehttps://www.fractracker.org/a5ej20sjfwe/wp-content/uploads/2025/09/2025-Wordmark-Logo.pngFracTracker Alliance2017-03-23 09:48:412021-04-15 15:03:3734 states have active oil & gas activity in U.S. based on 2016 analysis
A review of WV and OH drilling activity and its proximity to schools and medical facilities
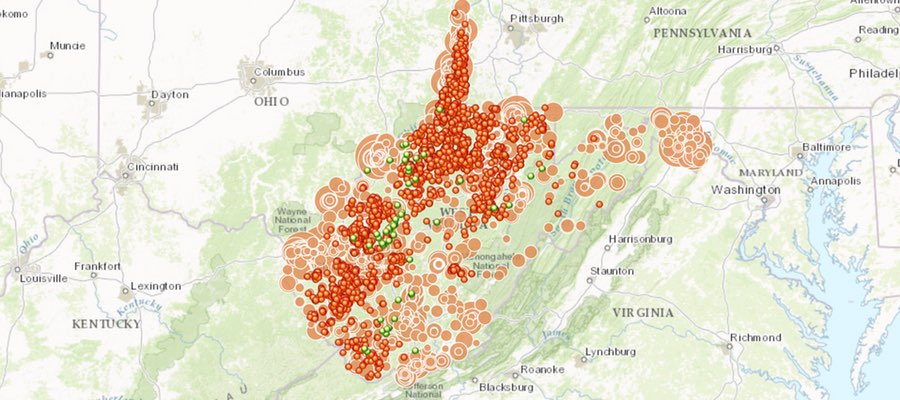
Schools and hospitals represent places where vulnerable populations may be put at risk if they are located close to oil and gas activity. Piggybacking on some elegant work from PennEnvironment (2013) and Physicians, Scientists, and Engineers (PSE) Healthy Energy (PDF) in Pennsylvania, below is an in-depth look at the proximity of unconventional oil and gas (O&G) activity to schools and hospitals in Ohio and West Virginia.
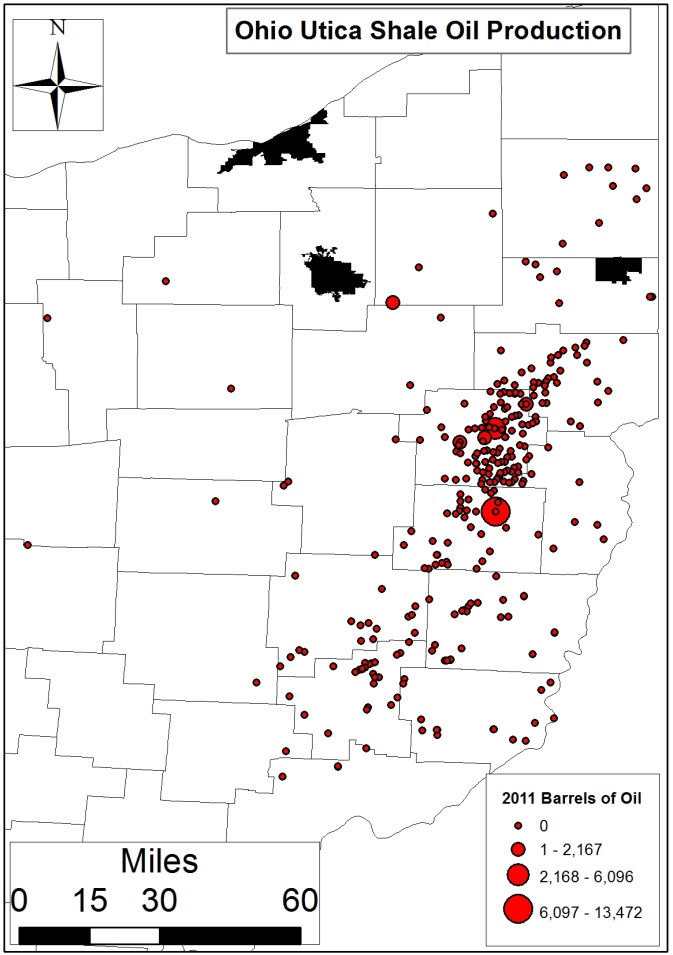
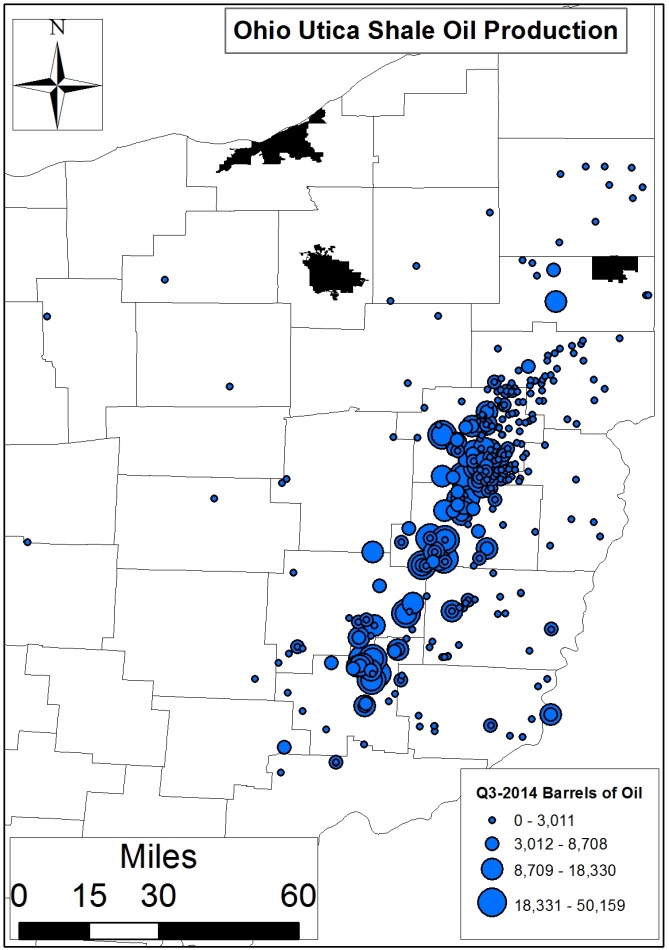
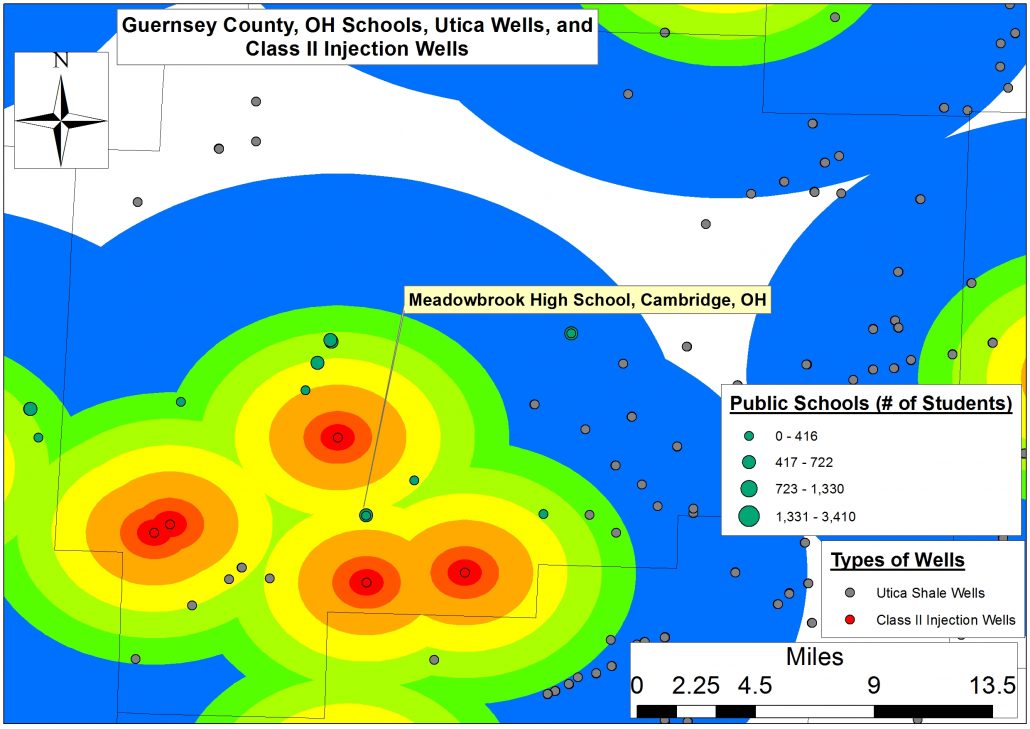
Ohio Schools and Medical Facilities
In Ohio, presently there are 13 schools or medical facilities within a half-mile of a Utica and/or Class II injection well and an additional 344 within 2 miles (Table 1 and map below). This number increases to 1,221 schools or medical facilities when you consider those within four miles of O&G related activity.
Map of OH Drilling and Disposal Activity Near Schools, Medical Facilities
Table 1. Number of OH schools and hospitals within certain distances from Utica wells
Utica
Class II Injection
Well Distance (Miles)
Schools
Medical Facilities
Schools
Medical Facilities
0.5
3
1
9
0
0.5-1
19 (22)
9 (10)
16 (25)
13 (13)
1-2
79 (101)
41 (51)
88 (113)
79 (92)
2-3
84 (185)
49 (100)
165 (278)
122 (214)
3-4
85 (270)
79 (179)
168 (446)
112 (326)
4-5
92 (362)
63 (242)
196 (642)
166 (492)
5-10
388 (750)
338 (580)
796 (1,438)
584 (1,076)
Ohio’s rate of Utica lateral permitting has jumped from an average of 39 per month all-time to 66 per month in the last year. OH’s drilling activity has also begun to spread to outlying counties[1]. As such, we thought a proactive analysis should include a broader geographic area, which is why we quantified the number of schools and medical facilities within 5 and 10 miles of Utica and Class II activity (Figures 1 and 2). To this end we found that ≥50% of Ohio’s schools, both public and private, are within 10 miles of this industry. Similarly 50% of the state’s medical facilities are within 10 miles of Utica permits or Class II wells.
Footnote 1: Eleven counties in Ohio are currently home to >10 Utica permits, while 23 are home to at least 1 Utica permit.
Figures 1, 2a, 2b (above). Click to expand.
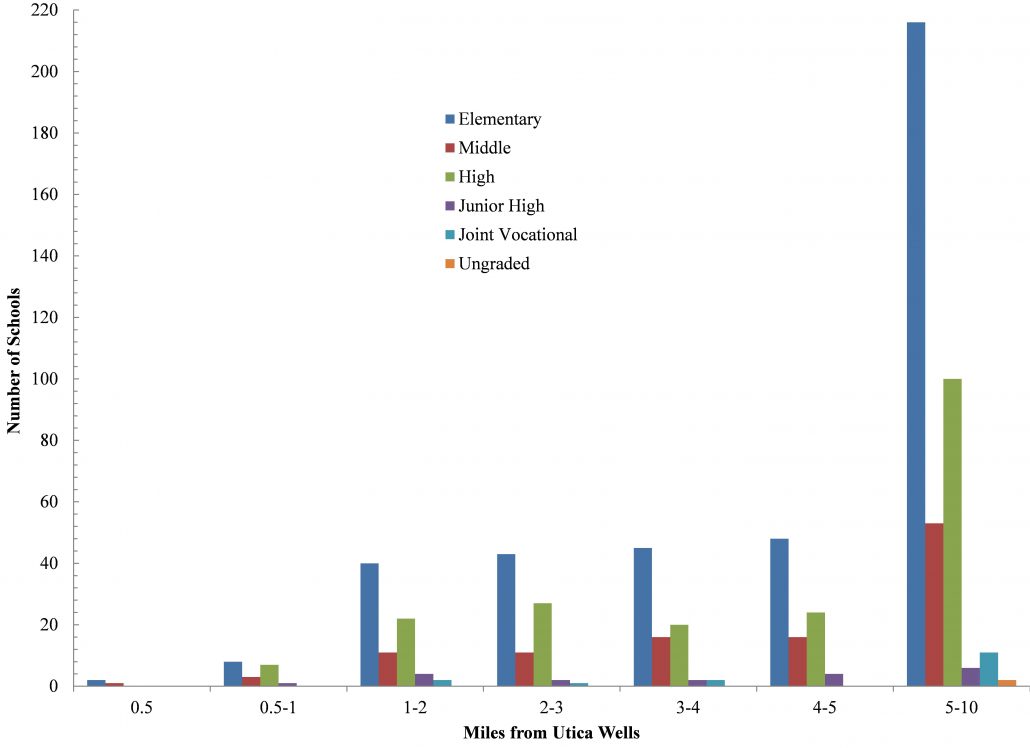
Grade Level Comparisons
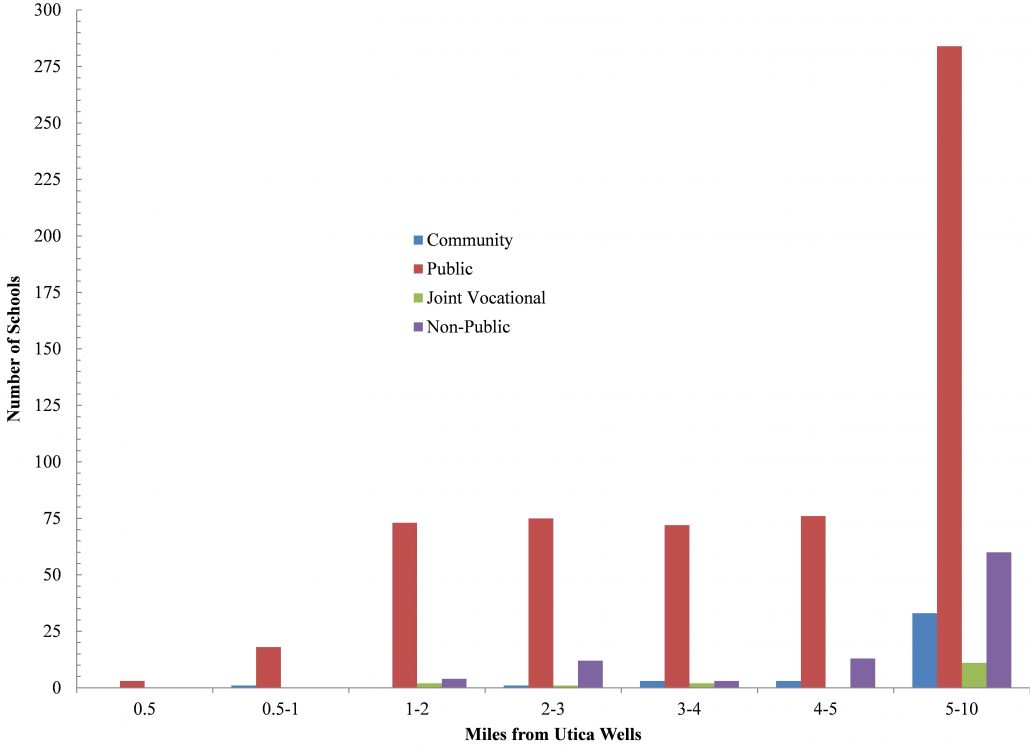
With respect to grade level, the majority of the schools in question are elementary schools, with 40-50 elementary schools within 2-5 miles of Ohio Utica wells. This number spikes to 216 elementary schools within ten miles of Utica permits along with an additional 153 middle or high Schools (Figure 3). Naturally, public schools constitute most of the aforementioned schools; there are approximately 75 within five miles of Utica permits and 284 within ten miles of Utica activity (Figure 4).
Figures 3 and 4 (above). Click to expand.
Public Schools in Ohio
We also found that ~4% of Ohio’s public school students attend a school within 2 miles of the state’s Utica and/or Class II Injection wells (i.e., 76,955 students) (Table 2). An additional 315,362 students or 16% of the total public school student population, live within five miles of O&G activity.
Table 2. Number of students in OH’s public schools within certain distances from Utica and Class II Injection wells
Utica
Class II Injection
Well Distance (Miles)
# Schools
# Students
Avg
# Schools
# Students
Avg
0.5
3
1,360
453
7
3,312
473
<1
21
7,910
377
19
7,984
420
<2
96
35,390
376
90
41,565
462
<3
169
67,713
401
215
104,752
487
<4
241
97,448
404
350
176,067
503
<5
317
137,911
435
505
254,406
504
<10
600
280,330
467
1,126
569,343
506
(Note: Ohio’s population currently stands at 11.59 million people; 2,007,667 total students).
The broadest extent of our study indicates that 42% of Ohio students attend school within ten miles of a Utica or Class II Injection well (Figure 5). As the Ohio Utica region expands from the original 11 county core to include upwards of 23-25 counties, we expect these 5-10 mile zones to be more indicative of the type of student-Utica Shale interaction we can expect to see in the near future.
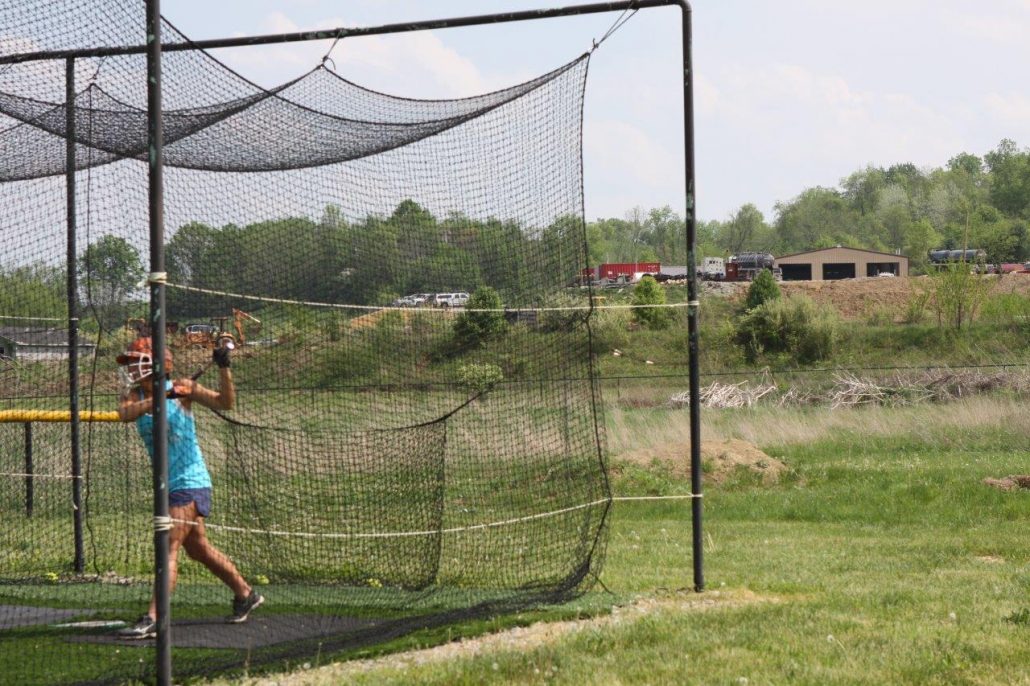
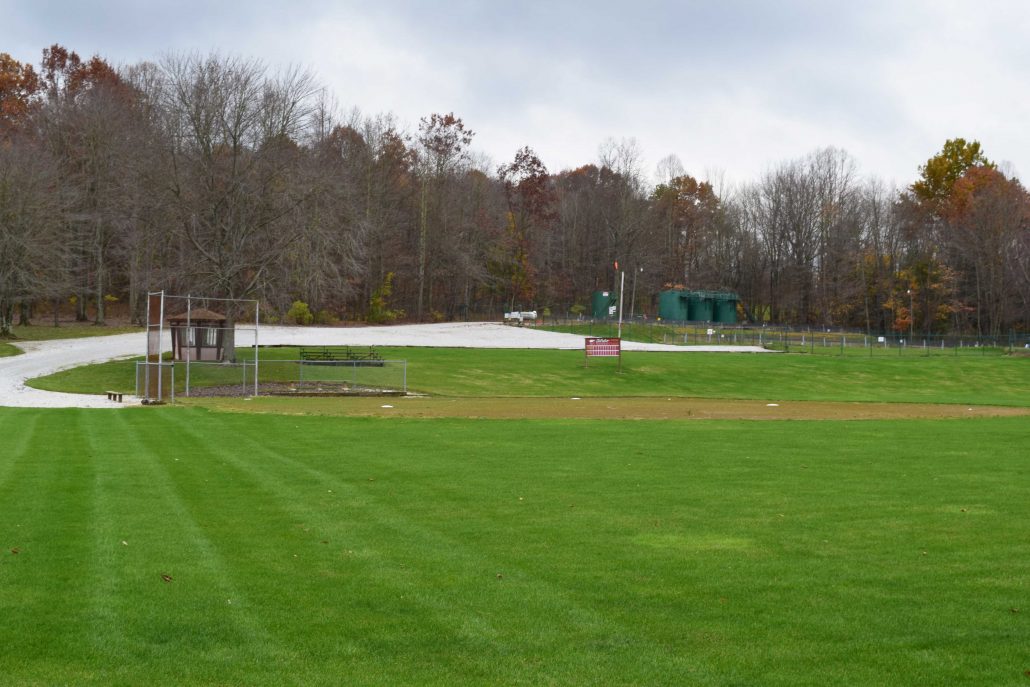
Photos of drilling activity near schools, and Figure 5 (above). Click to expand.
Private Schools in Ohio
At the present time, less than one percent of Ohio’s private school students attend a school within 2 miles of Utica and/or Class II Injection wells (specifically, 208 students). An additional 11,873 students or 11% of the total student population live within five miles. When you broaden the extent, 26% of Ohio’s private primary and secondary school students attend school daily within ten miles of a Utica or Class II Injection well. Additionally, the average size of schools in the immediate vicinity of Utica production and waste activity ranges between 11 and 21 students, while those within 2-10 miles is 112-159 students. Explore Table 3 for more details.
Table 3. Number of students in Ohio’s private schools within certain distances from Utica and Class II Injection.
Utica
Class II Injection
Distance from Well (Miles)
# Schools
# Students
Avg
# Schools
# Students
Avg
0.5
.
.
.
1
.
.
<1
.
.
.
2
25
13
<2
2
22
11
9
186
21
<3
7
874
125
30
4,460
149
<4
12
1,912
159
45
6,303
140
<5
21
2,471
118
61
9,610
158
<10
60
6,727
112
135
20,836
154
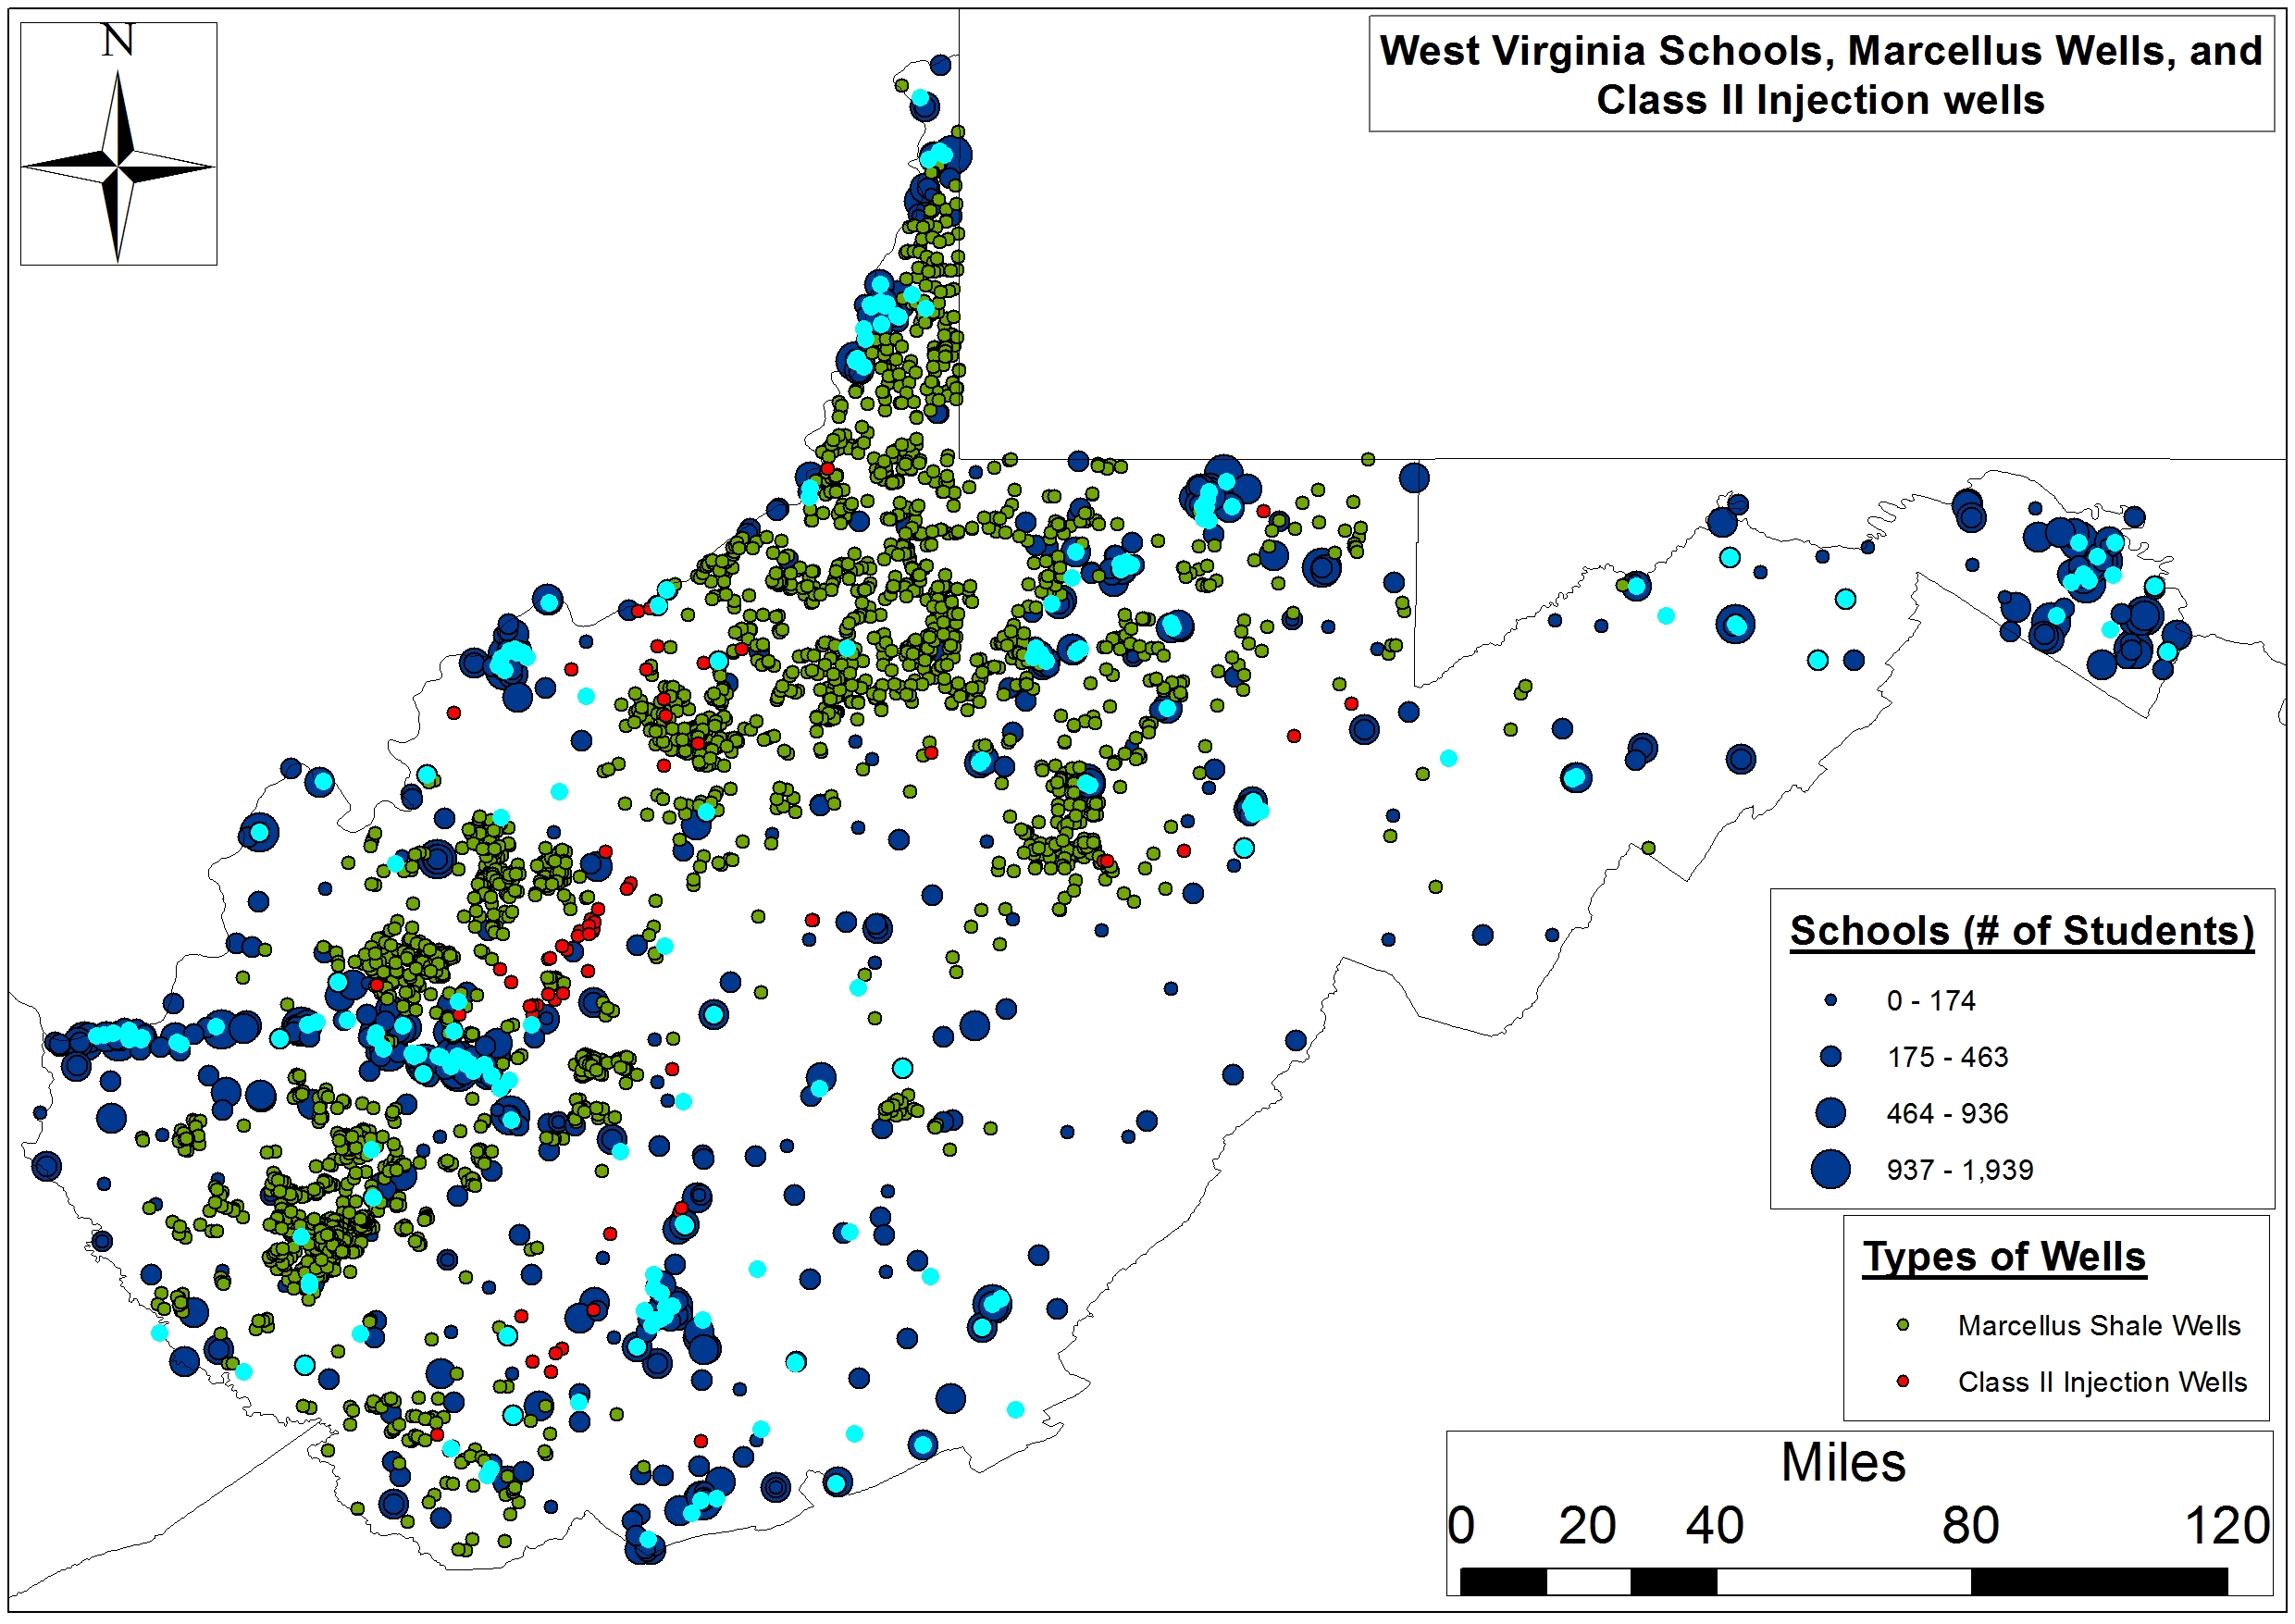
West Virginia Schools and Students
Twenty-eight percent (81,979) of West Virginia’s primary and secondary school students travel to a school every day that is within two miles of the state’s Marcellus and/or Class II Injection wells.
Compared with Ohio, 5,024 more WV students live near this industry (Table 4). An additional 97,114 students, or 34% of the West Virginia student population, live within 5 miles of O&G related wells. The broadest extent of our study indicates that more than 90% of West Virginia students attend school daily within 10 miles of a Marcellus and/or Class II Injection well.
Figure 6. West Virginia primary and secondary schools, Marcellus Shale wells, and Class II Injection wells (Note: Schools that have not reported enrollment figures to the WV Department of Education are highlighted in blue). Click image to expand.
It is worth noting that 248 private schools of 959 total schools do not report attendance to the West Virginia Department of Education, which means there are potentially an additional 69-77,000 students in private/parochial or vocational technology institutions unaccounted for in this analysis (Figure 6). Finally, we were not able to perform an analysis of West Virginia’s medical facility inventory relative to Marcellus activity because the West Virginia Department of Health and Human Resources admittedly did not have an analogous, or remotely complete, list of their facilities. The WV DHHR was only able to provide a list of Medicaid providers and the only list we were able to find was not verifiable and was limited to hospitals only.
Table 4. Number of students in WV schools within certain distances from Shale and Class II Injection wells
Marcellus
Class II Injection
Distance from Well (Miles)
#
Sum
Avg
#
Sum
Avg
0.5
19
5,674
299
1
.
.
<1
52 (71)
16,992 (22,666)
319
5 (6)
1,544
257
<2
169 (240)
52,737 (75,403)
314
16 (22)
5,032 (6,576)
299
<3
133 (373)
36,112 (111,515)
299
18 (40)
6,132 (12,708)
318
<4
88 (461)
25,037 (136,552)
296
21 (61)
5,235 (17,943)
294
<5
56 (517)
15,685 (152,237)
295
26 (87)
8,913 (26,856)
309
<10
118 (635)
37,131 (189,368)
298
228 (315)
69,339 (96,195)
305
Note: West Virginia population currently stands at 1.85 million people; 289,700 total students with 248 private schools of 959 total schools not reporting attendance, which means there are likely an additional 69-77,000 students in Private/Parochial or Vocational Technology institutions unaccounted for in this analysis.
Conclusion
A Trump White House will likely mean an expansion of unconventional oil and gas activity and concomitant changes in fracking waste production, transport, and disposal. As such, it seems likely that more complex and broad issues related to watershed security and/or resilience, as well as related environmental concerns, will be disproportionately forced on Central Appalachian communities throughout Ohio and West Virginia.
Will young and vulnerable populations be monitored, protected, and educated or will a Pruitt-lead EPA pursue more laissez-faire tactics with respect to environmental monitoring? Stay Tuned!
Analysis Methods
The radii we used to conduct this assessment ranged between ≤ 0.5 and 5-10 miles from a Utica or Marcellus lateral. This range is larger than the aforementioned studies. The point of using larger radii was to attempt to determine how many schools and students, as well as medical facilities, may find themselves in a more concentrated shale activity zone due to increased permitting. Another important, related issue is the fact that shale O&G exploration is proving to be more diffuse, with the industry exploring the fringes of the Utica and Marcellus shale plays. An additional difference between our analysis and that of PennEnvironment and PSE Healthy Energy is that we looked at identical radii around each state’s Class II Injection well inventory. We included these wells given the safety concerns regarding:
their role in induced seismicity,
potential water and air quality issues, and
concomitant increases in truck volumes and speeds.
By Ted Auch, Great Lakes Program Coordinator, FracTracker Alliance
https://www.fractracker.org/a5ej20sjfwe/wp-content/uploads/2017/03/WV-Schools-Feature.jpg400900Ted Auch, PhDhttps://www.fractracker.org/a5ej20sjfwe/wp-content/uploads/2025/09/2025-Wordmark-Logo.pngTed Auch, PhD2017-03-13 11:27:562021-04-15 15:03:37How close are schools and hospitals to drilling activity in West Virginia and Ohio?