The majority of FracTracker’s posts are generally considered articles. These may include analysis around data, embedded maps, summaries of partner collaborations, highlights of a publication or project, guest posts, etc.
In this segment of the Falcon Public EIA Project we begin to explore the different ways that pipelines are assessed for potential risk to populated areas. We outline a methods dictated by the Pipeline and Hazardous Materials Safety Administration (PHMSA) called Class Locations. This methods identifies occupied structures in proximity to a pipeline.
Quick Falcon Facts
67% of the Falcon route will qualify as Class 1, 27% as Class 2, and 3% as Class 3.
More than 557 single family residences and 20 businesses within 660ft of the pipeline.
Three recreational parks and a planned luxury housing development also at risk.
Map of Falcon Class Locations
The following map will serve as our guide in breaking down the Falcon’s Class Locations. Expand the map full-screen to explore its contents in greater depth. Some layers only become visible as you zoom in. A number of additional layers are not shown by default, but can be turned on in the “layers” tab. Click the “details” tab in full-screen mode to read how the different layers were created.
Pipeline “Class locations” determine certain aspects of how a pipeline is constructed. Essentially, a pipeline’s route is segmented into lengths that are each given different classifications as outlined in PHMSA guidelines. In general terms, a segment’s Class is established by first calculating a buffer that extends 220 yards (660ft) on either side of the pipeline’s center in 1-mile continuous lengths. This buffer area is then analyzed for how many building structures are present. Classes are then assigned to each 1-mile segment using the follow criteria:
Class 1: a segment with 10 or fewer buildings intended for human occupancy
Class 2: a segment with more than 10, but less than 46 buildings intended for human occupancy
Class 3: a segment with 46 or more buildings intended for human occupancy, or where the pipeline lies within 100 yards of any building, or small well-defined outside area occupied by 20 or more people on at least 5 days a week for 10 weeks in any 12-month period (i.e. schools, businesses, recreation areas, churches)
Class 4: a segment where buildings with four or more stories aboveground are prevalent
The finer details of these calculations and their adjustments are complex, however. For instance, Class locations can be shortened to less than 1-mile lengths if building densities change dramatically in an certain area. The example image below shows one of the ways available to operators for doing this, called the “continuous sliding” method:
Calculating Class Locations
(source: PHMSA)
Class location designations may also be adjusted over time as densities change. For instance, if new homes were built in proximity to a previously constructed pipeline, the operator may be required to reduce their operating pressure, strengthen the pipeline, or conduct pressure tests to ensure the segment would technically meet the requirements of a higher Class. Alternatively, operators can apply for a special permit to avoid such changes.
What Class Locations Dictate
Pipeline segments with higher Classes must meet more rigorous safety standards, which are enforced either by PHMSA or by their state equivalent, such as the Pennsylvania Utility Commission. These include:
Soil depth: Class 1 locations must be installed with a minimum soil depth of 30 inches (18 inches in consolidated rock). Class 2, 3, and 4 locations require a minimum soil depth of 36 inches (24 inches in consolidated rock)
Shut-off valves: Class locations determine the maximum distance from shut-off valves to populated areas, as follows: Class 1 (10 miles), Class 2 (7.5 miles), Class 3 (4 miles), and Class 4 (2.5 miles).
Operating pressure: Classes also regulate the maximum allowable operating pressure (MAOP) of pipeline segments
Structural integrity: Classes determine where thicker walled materials must be used to withstand higher pressures, as well as different structural testing methods used in safety inspections
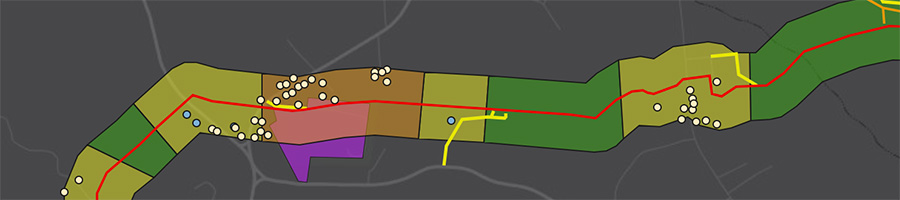
By replicating the 600 foot buffer from the Falcon’s centerline (used as the standard distance for determining Class Locations) we found that 67% of the Falcon route will qualify as Class 1, 27% as Class 2, and 3% as Class 3. These are represented on our interactive maps as green, yellow, and orange segments, respectively. An additional segment is marked as having an “unknown” Class on our maps (shaded in gray). This is the stretch crossing the Ohio River, where Shell’s Class location analysis has not been updated to reflect the route change that occurred in the summer of 2017.
Residential Structures
In total, there are 557 single family residences, 20 businesses, and a church within the 660ft buffer. Shell’s data also identify non-occupied structures along the route, such as sheds, garages, and other outbuildings. There are 535 such structures, but we did not have the time to replicate the locations of these sites. It is also important to note that the points on our interactive map represent only those identified by Shell, which we believe is an incomplete assessment of occupied structures based on our quick review of satellite maps.
Three residential structures lie directly within the 50-foot right-of-way. One of these homes, located in a Class 2 segment in Independence Township, is shown below. The Falcon will come as close as 20 feet to the edge of the structure and surround the home on three sides.
An occupied residence in the right-of-way
Neighborhoods in the following five communities account for the entirety of Falcon’s Class 3 locations. These would be considered the most “at risk” areas along the route in terms of proximity to the number of occupied structures. For instance, below is a satellite view of the Class 3 section of Raccoon Township.
Rumley Township, Harrison OH
Knox Township, Jefferson County OH
Raccoon Township, Beaver County PA
Independence Township, Beaver County PA
Mount Pleasant Township, Washington County PA
Raccoon Township residences & Municipal Park in a Class 3
Recreational Areas
In the above image we also see the location of Raccoon Township Municipal Park (in purple), home to a number of ballfields. Two similar recreation areas are located in the 660ft Class Location buffer: Mill Creek Ballpark, in Beaver County PA, and Clinton Community Park, in Allegheny County PA.
However, the Raccoon Township park is notable in that the Falcon cuts directly through its property boundary. Shell intends to bore under the park using HDD techniques, as stated in their permit applications, “to avoid disturbance to Beaver County baseball field/recreational park,” also stating that, “this HDD may be removed if the recreational group will allow laying the pipeline along the entrance roadway.”
New Housing Developments
One discovery worth attention is that the Falcon runs straight through an under-construction luxury housing development. Located in Allegheny County, PA, its developer, Maronda Homes, bills this growing community as having “picturesque landscapes, waterfront views and a peaceful collection of homes.” Shell mentions this development in their permit applications, stating:
Maronda Homes is in the planning and design stage of a very large housing development and SPLC [Shell Pipeline LC] worked closely with the developer and the Project was rerouted to avoid most of the housing sites.
It stands to reason that this neighborhood will eventually rank as one of the densest Class 3 areas along the Falcon route. Whether or not the pipeline is updated with higher safety standards as a result remains to be seen. The image below illustrates where the Falcon will go relative to lots marked for new homes. This property lots diagram was obtained from Shell’s GIS data layer and can be viewed on the FracTracker interactive map as well.
The Falcon intersects a luxury home development
1/31/18 Note: the Pittsburg Post-Gazette obtained newer lot line records for a portion of the Maronda Farms during their investigation into this story. These new records appear to have some alterations to the development, as seen below.
Maronda Farms, updated lot lines
Issues with Setbacks
There are no setback restrictions for building new homes in proximity to a pipeline. Parcels will eventually be sectioned off and sold to home buyers, begging the question of whether or not people in this community will realize a hazardous liquid pipeline runs past their driveways and backyards. This is a dilemma that residents in a similar development in Firestone, Colorado, are now grappling with following a recent pipeline explosion that killed two people, seen below, due to inadequate building setbacks.
A pipeline explodes in a Colorado home development
(source: InsideEnergy, CO)
Interestingly, we researched these same Maronda Farms parcels in FracTracker’s Allegheny County Lease Mapping Project only to discover that Maronda Homes also auctioned off their mineral rights for future oil and gas drilling. New homeowners would become victims of split-estate, where drilling companies can explore for oil and gas without having to seek permission from property owners, amplifying their level of risk.
In this segment of the Falcon Public EIA Project we continue to explore the different ways that pipelines are assessed for potential risk – in this case, relative to population centers, drinking water systems, and sensitive habitats. We outline methods dictated by the Pipeline and Hazardous Materials Safety Administration (PHMSA) called “high consequence areas” (HCAs) and how they determine potential impact zones for highly volatile liquid (HVL) pipelines. These methods are then applied to the Falcon to understand its possible dangers.
Quick Falcon Facts
An estimated 940-foot potential impact radius (PIR)
60 of 97 pipeline miles qualifying as High Consequence Areas (HCA)
More than 8,700 people living in the “vapor zone”
5 schools, 6 daycare centers, and 16 emergency response centers in “vapor zone”
In proximity to 8 source-water (drinking water) protection areas
Affecting habitats populated by 11 endangered, protected, or threatened species
Map of Falcon High Consequence Areas
The following map will serve as our guide in breaking down the Falcon’s High Consequence Areas. Expand the map full-screen to explore its contents in greater depth. Some layers only become visible as you zoom in. A number of additional layers are not shown by default, but can be turned on in the “layers” tab. Click the “details” tab in full-screen mode to read how the different layers were created.
Two considerations are used when determining pipeline proximity to population centers:
High Population Areas – an urbanized area delineated by the Census Bureau as having 50,000 or more people and a population density of at least 1,000 people per square mile; and
Other Populated Areas – a Census Bureau designated “place” that contains a concentrated population, such as an incorporated or unincorporated city, town, village, or other designated residential or commercial area – including work camps.
USAs: Drinking Water
PHMSA’s definition of drinking water sources include things such as:
Community Water Systems (CWS) – serving at least 15 service connections and at least 25 year-round residents
Non-transient Non-community Water Systems (NTNCWS) – schools, businesses, and hospitals with their own water supplies
Source Water Protection Areas (SWPA) for a CWS or a NTNCWS
Wellhead Protection Areas (WHPA)
Sole-source karst aquifer recharge areas
These locations are typically supplied by regulatory agencies in individual states.
With the exception of sole-source aquifers, drinking water sources are only considered if they lack an alternative water source. However, PHMSA is strict on what alternative source means, stating that they must be immediately usable, of minimal financial impact, with equal water quality, and capable of supporting communities for at least one month for a surface water sources of water and at least six months for a groundwater sources.
One very important note in all of these “drinking water” USA designations is that they do not include privately owned groundwater wells used by residences or businesses.
USAs: Ecological Resource
Ecological resource areas are established based on any number of qualities with different variations. In general terms, they contain imperiled, threatened, or endangered aquatic or terrestrial species; are known to have a concentration of migratory waterbirds; or are a “multi-species assemblage” area (where three or more of the above species can be found).
Calculating HCAs
Like Class locations, HCAs are calculated based on proximity. The first step in this process is to determine the pipeline’s Potential Impact Radius (PIR) — the distance beyond which a person standing outdoors in the vicinity of a pipeline rupture and fire would have a 99% chance of survival; or in which death, injury, or significant property damage could occur. PIR is calculated based on the pipeline’s maximum allowable operating pressure (MAOP), diameter, and the type of gas. An example of this calculation is demonstrated in FracTracker’s recent article on the Mariner East 2 pipeline’s PIR.
Once the PIR is known, operators then determine HCAs in one of two ways, illustrated in the image below:
Method 1: A Class 3 or Class 4 location, or a Class 1 or Class 2 location where “the potential impact radius is greater than 660 feet (200 meters), and the area within a potential impact circle contains 20 or more buildings intended for human occupancy”; or a Class 1 or Class 2 location where “the potential impact circle contains an “identified site.”
Method 2: An area within PIR containing an “identified site” or 20 or more buildings intended for human occupancy.
Calculating HCAs
(source: PHMSA)
In these definitions, “identified sites” include such things as playgrounds, recreational facilities, stadiums, churches, office buildings, community centers, hospitals, prisons, schools, and assisted-living facilities. However, there is a notable difference in how HCAs are calculated for natural gas pipelines vs. hazardous liquid pipelines.
Beyond just looking at what lies within the PIR, pipelines that contain gasses such as ethane potentially impact a much broader area as vapors flow over land or within a river, stream, lake, or other means. A truly accurate HCA analysis for an ethane pipeline leak requires extensive atmospheric modeling for likely vapor dispersions, such as seen in the example image below (part of a recent ESRI GIS conference presentation).
HCAs determine if a pipeline segment is included in an operator’s integrity management program (IMP) overseen by PHMSA or its state equivalent. IMPs must include risk assessments that identify the most likely impact scenarios in each HCA, enhanced management and repair schedules, as well as mitigation procedures in the event of an accident. Some IMPs also include the addition of automatic shut-off valves and leak detection systems, as well as coordination plans with local first responders.
The Falcon Risk Zones
Shell’s permit applications to the PA DEP state the pipeline:
…is not located in or within 100 feet of a national, state, or local park, forest, or recreation area. It is not located in or within 100 feet of a national natural landmark, national wildlife refuge, or federal, state, local or private wildlife or plant sanctuaries, state game lands. It is also not located in or within 100 feet of a national wild or scenic river, the Commonwealth’s Scenic Rivers System, or any areas designated as a Federal Wilderness Area. Additionally, there are no public water supplies located within the Project vicinity.
This is a partial truth, as “site” and “vicinity” are vague terms here. A number of these notable areas are within the PIR and HCA zones. Let’s take a closer look.
The PIR (or “Blast Zone”)
Shell’s permit applications state a number of different pipeline dimensions will be used throughout the project. Most of the Falcon will be built with 12-inch steel pipe, with two exceptions: 1) The segment running from the Cadiz, OH, separator facility to its junction with line running from Scio, OH, will be a 10-inch diameter pipe; 2) 16-inch diameter pipe will be used from the junction of the Falcon’s two main legs located four miles south of Monaca, PA, to its end destination at the ethane cracker. We also know from comments made by Shell in public presentations that the Falcon’s maximum allowable operating pressure (MOAP) will be 1,440 psi. These numbers allow us to calculate the Falcon’s PIR which, for a 16″ ethane pipeline at 1,440psi, is about 940 feet. We’ve termed this the “blast zone” on our maps.
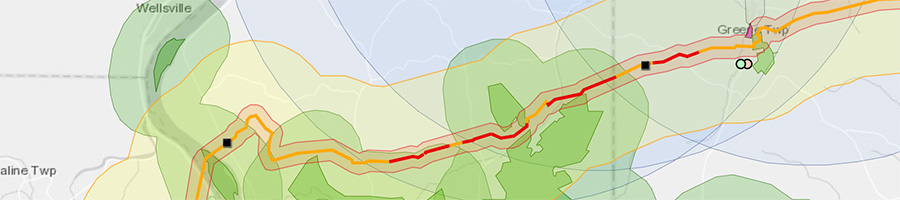
The HCA (or “Vapor Zone”)
Shell’s analysis uses an HCA impact radius of 1.25 miles. This much larger buffer reflects the fact that vapors from hazardous liquid pipelines can travel unpredictably at high concentrations for long distances before ignition. This expanded buffer might be called the “vapor zone,” a term we used on our map. Within the HCA “vapor zone” we find that 60 of the Falcon’s 97 miles qualify as high consequence areas, with 35 miles triggered due to their proximity to drinking water sources, 25 miles trigger for proximity to populated areas, and 3 miles for proximity to ecological areas.
Populated Areas
Shell’s HCA buffer intersects 14 US Census-designated populated areas, shown in the table below. Falcon’s right-of-way directly intersects two of these areas: Cadiz Village in Harrison County, Ohio, and Southview CDP (Census Designated Place) in Washington County, PA. These areas are listed below. Additionally, we included on the FracTracker map the locations of public facilities that were found inside the HCA buffer. These include 5 public schools, 6 daycare centers, 10 fire stations, and 6 EMS stations.
Area
Population
State
HCA
Pittsburgh Urbanized Area
High
PA
Indirect
Weirton-Steubenville Urbanized Area
High
WV/OH/PA
Indirect
Scio Village
Other
OH
Indirect
Cadiz Village*
Other
OH
Direct
Amsterdam Village
Other
OH
Indirect
Shippingport Borough
Other
PA
Indirect
Industry Borough
Other
PA
Indirect
Hookstown Borough
Other
PA
Indirect
Midway Borough
Other
PA
Indirect
Clinton CDP
Other
PA
Indirect
Imperial CDP
Other
PA
Indirect
Southview CDP*
Other
PA
Direct
Hickory CDP
Other
PA
Indirect
Westland CDP
Other
PA
Indirect
* Indicates an area the Falcon’s right-of-way will directly intersect
While it is difficult to determine the actual number of people living in the PIR and HCA vapor zone, there are ways one can estimate populations. In order to calculate the number of people who may live within the HCA and PIR zones, we first identified U.S. Census blocks that intersect each respective buffer. Second, we calculated the percentage of that census block’s area that lies within each buffer. Finally, we used the ratio of the two to determine the percentage of the block’s population that lies within the buffer.
Based on 2010 Census data, we estimate that 2,499 people live within a reasonable projection of the Falcon’s PIR blast zone. When expanded to the HCA vapor zone, this total increases to 8,738 people. These numbers are relatively small compared to some pipelines due to the fact that a significant portion of the Falcon runs through fairly rural areas in most places.
PIR est. pop.
HCA est. pop.
OHIO
Carroll County
11
47
Harrison County
274
915
Jefferson County
334
1,210
Total
619
2,172
WEST VIRGINIA
Hancock County
242
1,155
Total
242
1,155
PENNSYLVANIA
Allegheny County
186
969
Beaver County
990
3,023
Washington County
461
1,419
Total
1,637
5,410
Grand Total
2,499
8,738
Drinking Water Sources
Shell’s data identified a number of drinking water features considered in their HCA analysis. Metadata for this information show these sites were obtained from the Ohio Division of Drinking and Ground Waters, the West Virginia Source Water Assessment and Wellhead Protection Program, and the Pennsylvania DEP Wellhead Protection Program. The exact locations of public drinking water wells and intake points are generally protected by states for safety reasons. However, we duplicated the 5-mile buffer zones used on Shell’s map around these points, presumably denoting the boundaries of source water protection areas, wellhead protection areas, or intake points.
Drinking water buffers in Shell’s HCA analysis
As shown on FracTracker’s interactive map, five of these areas serve communities in the northern portions of Beaver County, shown in the image above, as well as the Cadiz and Weirton-Steubenville designated populated areas. Recall that HCA drinking water analysis only requires consideration of groundwater wells and not surface waters. This is an important distinction, as the Ambridge Reservoir is within the HCA zone but not part of Shell’s analysis — despite considerable risks outlined in our Falcon article on water body crossings.
Ecological Areas
Shell’s permits state that they consulted with the U.S. Fish and Wildlife Service (USFWS), Pennsylvania Game Commission (PGC), Pennsylvania Fish & Boat Commission (PFBC), and the Pennsylvania Department of Conservation and Natural Resources (DCNR) on their intended route in order to determine potential risks to protected species and ecologically sensitive areas.
DCNR responded that the pipeline had the potential to impact six sensitive plant species: Vase-vine Leather-Flower, Harbinger-of-spring, White Trout-Lily, Purple Rocket, Declined Trillium, and Snow Trillium. PFBC responded that the project may impact the Southern Redbelly Dace, a threatened temperate freshwater fish, within the Service Creek watershed. PGC responded that the pipeline had potential impact to habitats used by the Short-Eared Owl, Northern Harrier, and Silver-Haired Bat. Finally, the USFWS noted the presence of freshwater mussels in a number of water features crossed by the Falcon.
https://www.fractracker.org/a5ej20sjfwe/wp-content/uploads/2017/01/Falcon_header_HCA.jpg200900FracTracker Alliancehttps://www.fractracker.org/a5ej20sjfwe/wp-content/uploads/2025/09/2025-Wordmark-Logo.pngFracTracker Alliance2018-01-24 10:39:082021-04-15 15:02:00The Falcon: High Consequence Areas & Potential Impact Zones
Major pipeline projects are scrutinized by state and federal agencies for their potential impacts to threatened, endangered, and protected species. As part of the planning process, operators are required to consult with agencies to identify habitats known to support these species and are often asked to conduct detailed field surveys of specific areas. In this segment of the Falcon Pipeline EIA Project, we investigate how Shell corresponded with different agencies in complying with federal and state protected species guidelines.
Quick Falcon Facts
More than half (54%) of construction areas are currently forested or farmland
Botanical species Purple Rocket and Climbing Fern located in proximity to workspaces
67 Northern Harrier observations documented during site studies
One active Bald Eagle nest and two inactive nests in proximity to workspaces
Northern Long-eared Bat roost trees discovered as close as 318 feet from workspaces
Clusters of protected freshwater mussels, coldwater fish, and hellbenders in the path of the Falcon
Map of Protected Habitats & Species of Concern
The following map will serve as our guide to exploring the Falcon’s proximity to protected habitats and species of concern. Expand the map full-screen to explore its contents in greater depth. Some layers only become visible at closer zoom levels. A number of additional layers are not shown by default, but can be turned on in the “layers” tab. Click the “details” tab in full-screen mode to read how the different layers were created.
Shell’s permit applications detail extensive correspondences over a number of years — as early as August 2015 — with the U.S. Fish and Wildlife Service (USFWS), Pennsylvania Game Commission (PGC), Pennsylvania Fish & Boat Commission (PFBC), Pennsylvania Department of Conservation and Natural Resources (DCNR), Ohio Department of Natural Resources (ODNR), and the West Virginia Division of Natural Resources (WVDNR), among other agencies. These interactions tell a story of locating and cataloging threatened flowers, birds of prey, aquatic species, and bats.
Land Cover Assessment
A number of terrestrial habitat types are present along the Falcon pipeline’s route that will be disrupted during its construction. These are easily determined using data maintained by the USGS that tracks land cover and land use trends often used for understanding geospatial biodiversity. Shell used this data in their ecological impacts analysis and we have used it as well for comparison.
Habitat documentations from Shell’s permit applications
More than half (54%) of land in the Falcon’s construction area is currently forested land (deciduous and evergreen). Shell’s permits describe these areas as “contained cool, forested stream valleys and seeps and rich slopes” similar to the image above, which was submitted as part of Shell’s permit applications. An additional 35% is currently farmland (pasture/hay/crops). The remaining land cover is generally made up of water and wetlands, as well as residential and commercial development.
These numbers reflect the fact that the Falcon will travel through predominantly rural areas. Note that this analysis does not account for disruptions that will result from the pipeline’s 111 temporary and 21 permanent access roads. Land Cover for areas along the pipeline can be seen on the FracTracker map by activating the data in the “layers” tab.
Botanical Studies
In their correspondences with state agencies, Shell was notified that a number of important species would likely be found in these habitats. For instance, Pennsylvania Department of Conservation and Natural Resources (DCNR) noted the following botanical species on their watch list would be present:
Vase-vine Leather-flower (endangered): documented in floodplain and slopes of Raccoon Creek
Harbinger-of-spring (rare): documented in forested floodplain of Raccoon Creek
White Trout-lily (rare): documented in forested floodplain of Raccoon Creek
Purple Rocket (endangered): documented in forested floodplain of Raccoon Creek
Declined Trillium (threatened): documented along wooded tributaries and slopes of Raccoon Creek
Snow Trillium (rare): documented in tributary ravines along Raccoon Creek
DCNR requested a survey the Falcon’s route through all of Beaver County and the portion of Allegheny County north of the western fork of Raredon Run. AECOM, Shell’s contractor for this work, surveyed a 300-foot wide buffer along the pipeline route to allow for “minor alignment shifts” as construction plans are refined.
A final survey report was submitted to DCNR in March 2017. In it, AECOM noted having found multiple populations of Harbinger-of-spring (seen below), Purple Rocket, as well as Climbing Fern (Lygodium palmatum), also the PA Watch List. FracTracker’s map locates the general location of botanical discoveries nearest to the pipeline route.
Documented Harbinger-of-spring
DCNR’s response to the survey stated that route changes and plans to bore under Raccoon Creek using HDDs eliminated risks to Harbinger-of-spring and Purple Rocket. Meanwhile, Climbing Fern was determined to be in close proximity, but not directly in the pipeline’s construction area. Although, documents note that a number of ferns were transplanted “to further the species’ success within the Commonwealth.” As a result of these determinations, DCNR granted clearance for construction in August 2017.
Short-eared Owls & Northern Harriers
Shell was also notified by the Pennsylvania Game Commission (PGC) that portions of the Falcon’s workspace would be located near six areas with known occurrences of Short-eared Owls (PA endangered species) and Northern Harriers (PA threatened species).
PGC requested a study of these areas to identify breeding and nesting locations, which AECOM executed from April-July 2016 within a 1,000-foot buffer of the pipeline’s workspace (limited to land cover areas consisting of meadows and pasture). One Short-eared Owl observation and 67 Northern Harrier observations were recorded during the study, but that some of these harriers appeared to be nesting just outside the study area. The study area is visible on the FracTracker map, as shown below.
AECOM’s Owl & Harrier study areas
In February 2017, Shell notified PGC that a number of reroutes had occurred that would shift the Falcon pipeline away from a subset of the observed Northern Harrier habitat. Although, there is no mention in the permit applications about identifying potential nest locations in the neighboring areas where AECOM’s biologists observed additional harriers. Nevertheless, PGC’s final determination in August 2017, approved the project, stipulating that, “based on the unusually high number of observations at these locations” work should not be done in these areas during harrier breeding season, April 15 through August 31.
Bald Eagles
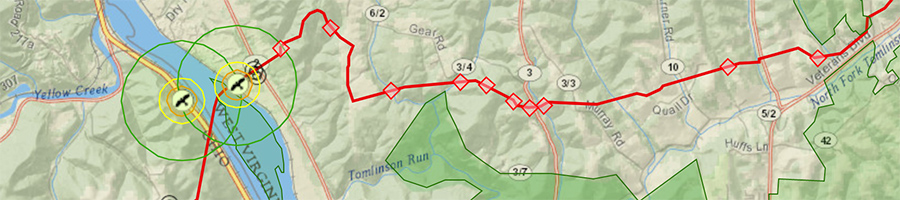
The U.S. Fish & Wildlife Service (USFWS) notified Shell that a known Bald Eagle nest was located in Beaver County. Meanwhile, the Ohio Department of Natural Resources (ODNR) and West Virginia Division of Natural Resources (WVDNR) noted that two potential “alternate nests” were located where the Falcon crosses the Ohio River. National Bald Eagle Management Guidelines bar habitat disturbances that may interfere with the ability of eagles to breed, nest, roost, and forage.
AECOM surveyed these areas in March 2016 and March 2017. The first stage included an analysis of land cover data to determine other areas along the Falcon’s route that may be desirable eagle habitat. In addition to the sites noted above, AECOM determined that Fort Cherry Golf Course (discussed in gerater detail here) and Beaver Conservation District owned land (discussed in greater detail here) would serve as eagle habitat, although in later field surveys no additional nests were found.
The one active nest in close proximity to the Falcon, called the Montgomery Dam Nest, is located just west of the pipeline’s terminus at Shell’s ethane cracker facility. AECOM’s study determined that the foraging areas for a pair of eagles using the nest span the Ohio River and Raccoon Creek.
An additional nesting site was found near Tomlinson Run, along the Ohio River. During initial field observations it was noted that the nest was not in-use and is in an unmaintained condition. Nevertheless, its use by Bald Eagles as recently as 2015 means it is still considered an “alternate nest” and thus accorded protection from habitat modifications. A second alternate nest was found the west bank of the Ohio River. No previous history of the nest had been recorded by state agencies.
Bald Eagle Study Gaps?
Below are maps from Shell’s permit applications identifying the locations of the three nests. These can also be found on the FracTracker map.[/av_icon_box]
USFWS requested that Shell only implement setback buffers for the one active nest at Montgomery Dam. These include no tree clearing within 330 feet, no visible disturbances with 660 feet, and no excessive noise with 1,000 feet of an active nest. Furthermore, Shell must avoid all activities within 660ft of the nest from January 1st to July 31st that may disturb the eagles, including but not limited to “construction, excavation, use of heavy equipment, use of loud equipment or machinery, vegetation clearing, earth disturbance, planting, and landscaping.”
According to Shell’s permit applications, the reroute that occurred at the Ohio River crossing took the Falcon pipeline away from the two alternate nest sites of concern, and the crossing at the river will be done with HDD boring, thus no impacts will occur. Apparently USFWS agreed with this position. However, as we see in the above maps, the HDD staging area on the WV side of the river (where a great deal of noise will likely occur) is just barely outside the 1,000 foot buffer.
Important Bird Areas
USFWS determined that the Falcon pipeline was also in close proximity to many migratory bird species protected under the Migratory Bird Treaty Act and that “direct or indirect, unintentional take of migratory birds may result even if all reasonable measures to avoid avian mortality are utilized.” In particular, the USFWS brought attention to the Raccoon Creek Valley and State Park Important Bird Area (IBA), which is located just south and west of the Falcon pipeline’s two major branches, as seen below.
USFWS recommended a number of strategies, such as co-locating the Falcon pipeline along rights-of-way used by existing pipelines. We see this indeed became the case, as 11 of the Falcon’s 23 pipeline miles in Beaver County are found adjacent to or parallel to existing ROWs.
Additional restrictions were placed on the project in Ohio, where ODNR determined that the Falcon is within range of the Upland Sandpiper, a state endangered bird that nests in grasslands and pastures. Shell was instructed to avoid construction in these habitat types from April 15-July 31 if such areas were to be disturbed. As we can see on the FracTracker map’s analysis of land cover data, there are significant areas of grassland and pasture in Ohio along the pipeline route.
No Peregrine Falcon?
One absence we noted in AECOM’s birds of prey studies was any mention of Peregrine Falcons, listed as endangered and protected under the PA Game and Wildlife Code. Peregrine Falcons nest in cliffs and bridges along rivers in Allegheny and Beaver counties and are particularly prized by the PA DEP, as evidenced by a prominently displayed booth at their Harrisburg headquarters.
PA DEP Falcon Exhibit
One known nest is located under the East Rochester-Monaca Bridge just north of the Falcon pipeline’s terminus at Shell’s ethane cracker facility. While it is unlikely that activities such as tree clearing would affect falcon habitat, other aspects of the pipeline’s construction, such accidental drilling mud spills at HDD sites or ethane releases along Raccoon Creek, may indeed impact Falcon populations.
Federally Protected Bats
The USFWS notified Shell that the Falcon is located within the range of federally protected Indiana Bats and Northern Long-eared Bats in Pennsylvania and West Virginia and requested Shell conduct a bat “mist net” survey to identify breeding areas. Mist netting involves setting up nylon mesh nets at predetermined locations to capture and document bat populations.
AECOM’s bat survey was conducted from April-July 2016. While bats are known to live in caves and abandoned mines in winter, the study focused on summer habitats — mainly forests that support roost trees — given that tree clearing from building the pipeline would be the most likely impact. These forested areas constituted about 27 of the Falcon pipeline’s 97 miles in the two states. Mist net locations (MNLs) were established at 46 sites along the route, roughly 1/2 mile apart, as shown on the FracTracker map. A later reroute of the pipeline led to setting up 4 additional MNLs in June 2017.
A total of 274 bats from 6 different species were captured in the study, included 190 Big Brown Bats, 2 Silver-haired Bats, 62 Eastern Red Bats, 2 Hoary Bats, and 1 Little Brown Bat. 17 Northern Long-eared Bats were found at 13 of the MNL sites, but no Indiana Bats were captured. Radio transmitters were then attached to the Northern Long-eared Bats in order to follow them to roost trees. A total of 9 roost trees were located, with the nearest roost tree located 318 feet from the pipeline’s workspace.
A captured Northern Long-eared Bat
In January 2018, USFWS stated that, because the Falcon’s construction area is not within 150 feet of a known roost tree during breeding season or within a 1/4 mile of a known year-round hibernation site, that “incidental take that might result from tree removal is not prohibited.” However, USFWS also stated that “Due to the presence of several Northern Long-eared Bat roost trees within the vicinity of the project footprint (although outside of the 150-foot buffer), we recommend the following voluntary conservation measure: No tree removal between June 1 and July 31.”
Furthermore, the PGC noted in early correspondences that Silver-haired Bats may be in the region (a PA species of special concern). This was confirmed in AECOM’s mist net study. PGC did not require a further study for the species, but did request a more restrictive conservation of no tree clearing between April 1 and October 31.
Bat Study Gaps?
There are a number of possible gaps in AECOM’s study that need attention. First, the study notes the nearest roost tree is 318 feet from the Falcon’s workspace, but this does not fully represent the likely impact to bat populations. As is seen in the map below, taken from Shell’s permits, this tree is just one in a cluster of five trees all within 750 feet of the pipeline’s workspace.
A dense cluster of bat roosting trees
Furthermore, tree clearing in this area will be extensive considering its proximity to the Falcon’s juncture in Beaver County that also must accommodate a metering pad and access roads. This area is shown in the permit application map below and can be explored on the FracTracker map as well.
A second questionable aspect of the study is that, while the USFWS letter states the Falcon is not “within a 1/4 mile of a known year-round hibernation site,” this was not proven in the study as it did not identify nearby winter habitats. These omissions are noteworthy given the already significant stressors to bat populations in the region, as well as increasing pressure from oil and gas companies to relax standards for protecting endangered bat species.
A Note on Noise Control
As part of their ability to build the Falcon pipeline, USFWS mandated that Shell employ an “independent noise consultant” to measure ambient pre-construction noise levels at each HDD site and at designated Noise Sensitive Areas (NSA), which are generally determined by the presence of protected bird and bat species. Less is known about the details of this part of AECOM’s study plan for Shell. However, we have located noise monitoring sites on the FracTracker map for reference.
Freshwater Mussels
The USFWS and PGC identified very early in the Shell’s construction plans that the project would likely impact four endangered mussel species: the Northern Riffelshell, the Clubshell, the Rayed Bean, and the Snuffbox. AECOM conducted a survey in May 2016, at the request of Pennsylvania and Ohio agencies at 16 perennial streams along the route in those two states. These are shown on the FracTracker map. In PA, mussels were found to be present at both of the Falcon’s intersections with Raccoon Creek, as seen in a photo from Shell’s permit application below.
Documented freshwater mussels in Raccoon Creek
The results of the Ohio study are unknown at this time. However, we found it interesting that ODNR’s letter to Shell stated that unavoidable impacts could be resolved by allowing specialists to collect and relocate mussels to suitable and similar upstream habitats. Meanwhile, it appears that the USFWS and PFBC have also green lighted construction around the two known Raccoon Creek mussel habitats, as Shell’s applications argue these waters would not be impacted due to the fact that they would be crossing using HDD boring.
Coldwater Fish
The PA Fish & Boat Commission notified Shell that the Falcon may impact the Southern Redbelly Dace. This threatened species is especially vulnerable to physical and chemical (turbidity, temperature) changes to their environment. PAFB explicitly notes in their correspondences that “we are concerned about potential impacts to the fish, eggs and the hatching fry from any in-stream work.” Of note is that these sites of concern are located in HQ/CWF streams of the Service Creek watershed (discussed in greater detail here), as shown on the map below.
Headwater streams in the Service Creek watershed
Early correspondences with PFBC show the agency requesting that directional boring be used for these stream crossings or, if work necessitated direct impacts (such as open-cut crossings), that these activity be avoided during the spawning season. Shell responded to the request in stating that, with the exception of the Service Creek itself which will be crossed by HDD, the terrain surrounding its headwater streams was not suitable for boring, and would thus require open-cuts.
PFBC’s final determination on these matters is that they generally agreed, with the exception of the HDD site and one headwater stream (S-PA-151104-MRK-001), all other crossings must adhere to seasonal restrictions with no in-stream activity being conducted between May 1-July 31.
In Ohio, we see similar circumstances related to the River Darter, the Paddlefish, and the Channel Darter, all threatened species in the state. The ODNR recommended no in-stream work in the Ohio River from March 15-June 30 and no in-stream work in any of the state’s perennial streams from April 15-June 30.
Eastern Hellbenders
The Falcon is also within range of Eastern Hellbender habitat in Ohio, a state endangered species and a federal species of concern. In particular, ODNR noted that Yellow Creek, in Jefferson County, is known to host the species. Because of this, ODNR requested that if any in-stream work was to occur in Yellow Creek, a habitat suitability survey must be conducted to determine if Hellbenders were present. Yellow Creek’s tributaries are indeed crossed by the Falcon. Whether or not a study was conducted as a result of this is unknown due to our not having reviewed Shell’s Ohio permit applications. The below image, captured from our page on water crossings, shows these locations.
Falcon crossing Yellow Creek tributaries
Allowable Work Dates
To summarize, there are numerous implications for how Shell’s construction of the Falcon pipeline must accommodate endangered, threatened, and rare species in different states. In particular, Shell must avoid land and aquatic disturbances during different breeding and spawning seasons. Below is a breakdown of these black-out periods. Note that these only apply to locations where sensitive species were found in AECOM’s studies.
Land Disturbances
Northern Harriers, Short-eared Owls (PGC): No clearing between April 15 and August 31
Bald Eagles (USFWS): No work between January 1 and July 31
Upland Sandpiper (ODNR): No clearing between April 15 and July 31
Bats (USFWS): No clearing between April 1 and October 31
Aquatic Disturbances
Southern Redbelly Dace (PFBC): No in-stream work between May 1 and July 31
River Darter, Paddlefish, Channel Darter (ODNR): No Ohio River work between March 15 and June 30; no perennial stream work between April 15 and June 30
In this final section of the Falcon Public EIA Project, we explore the Falcon pipeline’s entanglements with a region already impacted by a long history of energy development. Featured in this article are where the Falcon pipeline intersects underground mining facilities, strip mines, other hazardous pipelines, active oil and gas wells, as well as a very large compressor station. We utilize this information to locate spaces where cumulative development also has the potential for compounded risk.
Quick Falcon Facts
20 miles of the Falcon run through under-mined areas; 5.6 miles through active mines
18 miles of the Falcon run through surface-mined areas; also coal slurry waste site
Shares a right-of-way with Mariner West pipeline for 4 miles in Beaver County
11 well pads, as well as a compressor station, are within the potential impact radius
Map of Falcon relative to mined areas and other energy-related development
The following map will serve as our guide in breaking down where the Falcon intersects areas that have experienced other forms of energy development. Expand the map full-screen to explore its contents in greater depth. Some layers only become visible as you zoom in. A number of additional features of the map are not shown by default, but can be turned on in the “layers” tab. These include information on geological features, water tables, soil erosion characteristics, as well as drinking reservoir boundaries. Click the “details” tab in full-screen mode to read how the different layers were created.
The Falcon pipeline intersects a surprising number of active and inactive/abandoned mine lands. While the location of active mines is fairly easy to obtain from mine operators, finding data on abandoned mines is notoriously difficult. State agencies, such as the Pennsylvania Department of Environmental Protection (DEP), have digitized many legacy maps, but these resources are known to be incomplete and inaccurate in many locations.
AECOM’s engineers used data layers on active and abandoned mine lands maintained by state agencies in OH, WV, and PA. FracTracker obtained this data, as well, as shown on the interactive map. Shell states in their permits that AECOM’s engineers also went through a process of obtaining and digitizing paper maps in areas with questionable mine maps.
Shell states that their analysis shows that 16.8 miles of the Falcon pipeline travel through under-mined areas. Our analysis using the same dataset suggests the figure is closer to 20 miles. Of these 20 miles of pipeline:
5.6 miles run through active coal mines and are located in Cadiz Township, OH (Harrison Mining Co. Nelms Mine); Ross Township, OH (Rosebud Mining Co. Deep Mine 10); and in Greene Township, PA (Rosebud Mining Co. Beaver Valley Mine).
More than 18 miles run through areas that have been historically surface-mined (some overlapping under-mined areas).
Of those 18 miles, 1.5 miles run through an active surface mine located in Cadiz Township, OH, managed by Oxford Mining Company.
Beaver Valley Mine
The Beaver Valley Mine in Greene Township, PA, appeared to be of particular importance in Shell’s analysis. Of the three active mines, Shell maintained an active data layer with the mine’s underground cell map for reference in selecting routes, seen in the image below. Note how the current route changed since the map was originally digitized, indicating that a shift was made to accommodate areas around the mine. The FracTracker interactive map shows the mine based on PA DEP data, which is not as precise as the mine map AECOM obtained from Rosebud Mining.
Digitized map of Beaver Valley Mine
Rosebud Mining idled its Beaver Valley Mine in 2016 due to declining demand for coal. However, Rosebud appears to be expanding its workforce at other mines in the area due to changing economic and political circumstances. We don’t know exactly why this particular mine was highlighted in Shell’s analysis, or why the route shifted, as it is not directly addressed in Shell’s permit applications. Possibilities include needing to plan around areas that are known to be unfit for the pipeline, but also perhaps areas that may be mined in the future if the Beaver Valley Mine were to restart operations.
Coal Slurry Site, Imperial PA
As discussed in other segments of the Falcon Public EIA Project, Shell intends to execute 19 horizontal directional drilling (HDD) operations at different sites along the pipeline. A cluster of these are located in Allegheny and Washington counties, PA, with extensive historical surface mining operations. A 2003 DEP report commented on this region, stating:
All of the coal has been underground mined. Most of the coal ribs and stumps (remnants from the abandoned underground mine) have been surface mined… The extensive deep mining, which took place from the 1920’s through the 1950’s, has had a severe effect on groundwater and surface water in this watershed.
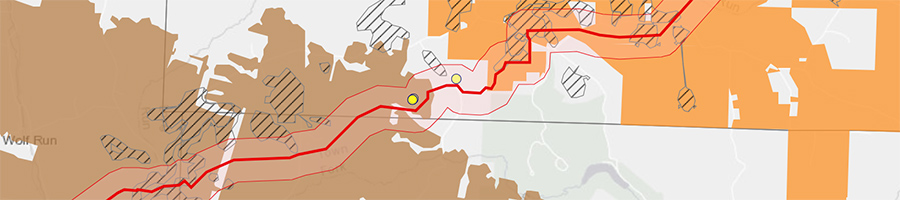
Shell’s applications note that AECOM did geotechnical survey work in this and other surface-mined areas co-located with proposed HDD operations, concluding that the ”majority of rock encountered was shale, sandstone, limestone, and claystone.” However, at one proposed HDD (called “HOU-06”) the Falcon will cross a coal waste site identified in the permits as “Imperial Land Coal Slurry” along with a large Palustrine Emergent (PEM) wetland along Potato Garden Run, seen below.
A Falcon HDD crossing under a wetland and coal slurry site
Foreign Pipelines
In addition to its entanglements with legacy coal mining, the Falcon will be built in a region heavily traveled by oil and gas pipelines. More than 260 “foreign pipelines” carrying oil, natural gas, and natural gas liquids, were identified by AECOM engineers when selecting the Falcon’s right-of-way (note that not all of these are directly crossed by the Falcon).
Owners of these pipelines run the gamut, including companies such as Williams, MarkWest, Columbia, Kinder Morgan, Energy Transfer Partners, Momentum, Peoples Gas, Chesapeake, and Range Resources. Their purposes are also varied. Some are gathering lines that move oil and gas from well pads, others are midstream lines connecting things like compressor stations to processing plants, others still are distribution lines that eventually bring gas to homes and businesses. FracTracker took note of these numbers and their significance, but did not have the capacity to document all of them for our interactive map.
Shared Rights-of-Way
However, we did include one pipeline, the Mariner West, because of its importance in the Falcon’s construction plans. Mariner West was built in 2011-2013 as part of an expanding network of pipelines initially owned by Sunoco Pipeline but now operated by Energy Transfer Partners. The 10-inch pipeline transports 50,000 barrels of ethane per day from the Separator plant in Houston, PA, to processing facilities in Canada. Another spur in this network is the controversial Mariner East 2.
Mariner West is pertinent to the Falcon because the two pipelines will share the same right-of-way through a 4-mile stretch of Beaver County, PA, as shown below.
The Falcon and Mariner West sharing a right-of-way
Reuse of existing rights-of-way is generally considered advantageous by pipeline operators and regulatory agencies. The logistics of sharing pipelines can be complicated, however. As noted in Shell’s permit applications:
Construction coordination will be essential on the project due to the numerous parties involved and the close proximity to other utilities. Accurate line location was completed; however, verification will also be key, along with obtaining proper crossing design techniques from the foreign utilities. A meeting with all of pipeline companies will be held to make sure that all of the restrictions are understood prior to starting construction, and that they are documented on the construction alignment sheets/bid documents for the contractor(s). This will save a potential delay in the project. It will also make working around the existing pipelines safe.
Shell’s attention to coordinating with other utility companies is no doubt important, as is their recognition of working near existing pipelines as a safety issue. There are elevated risks with co-located pipelines when they come into operation. This was seen in a major pipeline accident in Salem Township, PA, in 2016. One natural gas line exploded, destroying nearby homes, and damaged three adjacent pipelines that took more than a year to come back online. These findings raise the question of whether or not Class Location and High Consequence Area assessments for the Falcon should factor for the exponential risks of sharing a right-of-way with Mariner West.
Oil & Gas Extraction
The remaining features included on our map relate to oil and gas extraction activities. The Falcon will carry ethane from the three cryogenic separator plants at the pipeline’s source points. But the wet, fracked gas that supplies those plants also comes from someplace, and these are the many thousands of unconventional gas wells spread across the Marcellus and Utica shale.
We found 11 unconventional oil and gas pads, hosting a combined 48 well heads, within the Falcon’s 940-foot PIR. We also found a large compressor station operated by Range Resources, located in Robinson Township, PA. This is shown below, along with a nearby gas pad.
A well pad and compressor station in Falcon’s PIR
We noted these well pads and the compressor station because Class Location and HCA risk analysis may account for proximity to occupied businesses and homes, but does not always consider a pipeline’s proximity to other high-risk industrial sites. Nevertheless, serious incidents have occurred at well pads and processing facilities that could implicate nearby hazardous liquid pipelines. By the same measure, an accident with the Falcon could implicate one of these facilities, given they are all within the Falcon’s blast zone.
FracTracker began monitoring Falcon’s construction plans in December 2016, when we discovered a significant cache of publicly visible GIS data related to the pipeline. At that time, FracTracker was looking at ways to get involved in the public discussion about Shell’s ethane cracker and felt we could contribute our expertise with mapping pipelines. Below we describe the methods we used to access and worked with this project’s data.
Finding the Data
Finding GIS data for pipeline projects is notoriously difficult but, as most research goes these days, we started with a simple Google search to see what was out there, using basic keywords, such as “Falcon” (the name of the pipeline), “ethane” (the substance being transported), “pipeline” (the topic under discussion), and “ArcGIS” (a commonly used mapping software).
In addition to news stories on the pipeline’s development, Google returned search results that included links to GIS data that included “Shell” and “Falcon” in their names. The data was located in folders labeled “HOUGEO,” presumably the project code name, as seen in the screenshot below. All of these links were accessed via Google and did not require a password or any other authentication to view their contents.
Shell’s data on the Falcon remained publicly available at this link up to the time of the Falcon Public EIA Project‘s release. However, this data is now password protected by AECOM.
Google search results related to Falcon pipeline data
Viewing the Data
The HOUGEO folder is part of a larger database maintained by AECOM, an engineering firm presumably contracted to prepare the Falcon pipeline construction plan. Data on a few other projects were also visible, such as maps of the Honolulu highway system and a sewer works in Greenville, NC. While these projects were not of interest to us, our assessment is that this publicly accessible server is used to share GIS projects with entities outside the company.
Within the HOUGEO folder is a set of 28 ArcGIS map folders, under which are hundreds of different GIS data layers pertaining to the Falcon pipeline. These maps could all be opened simply by clicking on the “ArcGIS Online map viewer” link at the top of each page. Alternatively, one can click on the “View in: Google Earth” link to view the data in Google Earth or click on the “View in: ArcMap” link to view the data in the desktop version of the ArcGIS software application. No passwords or credentials are required to access any of these folders or files.
As seen in the screenshot below, the maps were organized topically, roughly corresponding to the various components that would need to be addressed in an EIA. The “Pipeline” folder showed the route of the Falcon, its pumping stations, and work areas. “Environmental” contained data on things like water crossings and species of concern. “ClassLocations” maps the locations of building structures in proximity to the Falcon.
The HOUGEO GIS folders organized by topic
Archiving the Data
After viewing the Falcon GIS files and assessing them for relevancy, FracTracker went about archiving the data we felt was most useful for our assessing the project. The HOUGEO maps are hosted on a web server meant for viewing GIS maps and their data, either on ArcOnline, Google Earth, or ArcMap. The GIS data could not be edited in these formats. However, viewing the data allowed us to manually recreate most of the data.
For lines (e.g. the pipeline route and access roads), points (e.g. shutoff valves and shut-off valves), and certain polygons (e.g. areas of landslide risk and construction workspaces), we archived the data by manually recreating new maps. Using ArcGIS Desktop software, we created a new blank layer and manually inputted the relevant data points from the Falcon maps. This new layer was then saved locally so we could do more analysis and make our own independent maps incorporating the Falcon data. In some cases, we also archived layers by manually extracting data from data tables underlying the map features. These tables are made visible on the HOUGEO maps simply by clicking the “data table” link provided with each map layer.
Other layers were archived using screen captures of the data tables visible in the HOEGEO ArcOnline maps. For instance, the table below shows which parcels along the route had executed easements. We filtered the table in ArcGIS Online to only show the parcel ID, survey status, and easement status. Screen captures of these tables were saved as PDFs on our desktop, then converted to text using optical character recognition (OCR), and the data brought into Microsoft Excel. We then recreated the map layer by matching the parcel IDs in our newly archived spreadsheet to parcel IDs obtained from property GIS shapefiles that FracTracker purchased from county deeds offices.
Transparency & Caveats
FracTracker strives to maintain transparency in all of its work so the public understands how we obtain, analyze, and map data. A good deal of the data found in the HOUGEO folders are available through other sources, such as the U.S. Geological Survey, the Department of Transportation, and the U.S. Census, as well as numerous state and county level agencies. When possible, we opted to go to these original sources in order to minimize our reliance on the HOUGEO data. We also felt it was important to ensure that the data we used was as accurate and up-to-date as possible.
For instance, instead of manually retracing all the boundaries for properties with executed easements for the Falcon’s right-of-way, we simply purchased parcel shapefiles from county deeds and records offices and manually identified properties of interest. To read more on how each data layer was made, open any of our Falcon maps in full-screen mode and click the “Details” tab in the top left corner of the page.
Finally, some caveats. While we attempted to be as accurate as possible in our methods, there are aspects of our maps where a line, point, or polygon may deviate slightly in shape or location from the HOUGEO maps. This is the inherent downside of having to manually recreate GIS data. In other cases, we spent many hours correcting errors found in the HOUGEO datasets (such as incorrect parcel IDs) in order to get different datasets to properly match up.
FracTracker also obtained copies of Shell’s permit applications in January by conducting a file review at the PA DEP offices. While these applications — consisting of thousands of pages — only pertain to the areas in Pennsylvania where the Falcon will be built, we were surprised by the accuracy of our analysis when compared with these documents. However, it is important to note that the maps and analysis presented in the Falcon Public EIA Project should be viewed with potential errors in mind.
Report Calculates Impacts from PA’s Planned Natural Gas Infrastructure
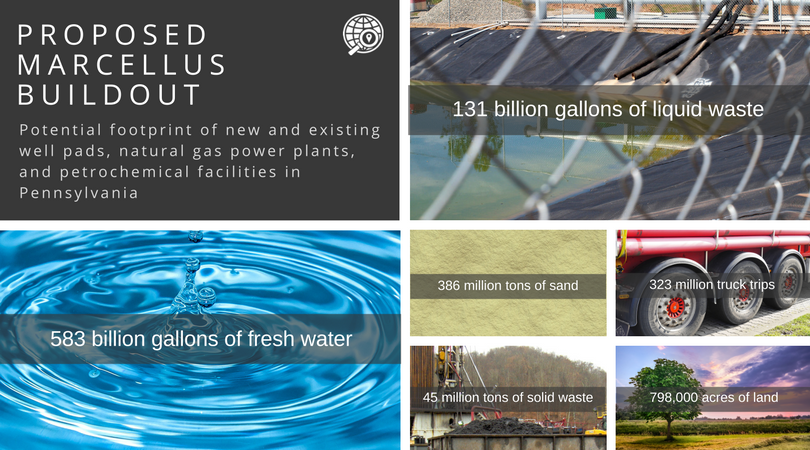
FracTracker Alliance released the report: A Hazy Future: Pennsylvania’s Energy Landscape in 2045 today, which details the potential future impacts of a massive buildout of Marcellus Shale wells and associated natural gas infrastructure.
Industry analysts forecast 47,600 new unconventional oil and gas wells may be drilled in Pennsylvania by 2045, fueling new natural gas power plants and petrochemical facilities in PA and beyond. Based on industry projections and current rates of consumption, FracTracker – a national data-driven non-profit – estimates the buildout would require 583 billion gallons of fresh water, 386 million tons of sand, 798,000 acres of land, 131 billion gallons of liquid waste, 45 million tons of solid waste, and more than 323 million truck trips to drilling sites.
“Only 1,801 of the 10,851 unconventional wells already drilled count as a part of this projection, meaning we could see an additional 45,799 such wells in the coming decades,” commented Matt Kelso, Manager of Data and Technology for FracTracker and lead author on the report.
Why the push for so much more drilling? Out of state – and out of country – transport is the outlet for surplus production.
“The oil and gas industry overstates the need for more hydrocarbons,” asserted FracTracker Alliance’s Executive Director, Brook Lenker. “While other countries and states are focusing more on renewables, PA seems resolute to increase its fossil fuel portfolio.”
The report determined that the projected cleared land for well pads and pipelines into the year 2045 could support solar power generation for 285 million homes, more than double the number that exist in the U.S.
“A Hazy Future shows that a fossil fuel-based future for Pennsylvania would come at the expense of its communities’ health, clean air, water and land. It makes clear that a dirty energy future is unnecessary,” said Earthworks’ Pennsylvania Field Advocate, Leann Leiter. Earthworks endorsed FracTracker’s report. She continued, “I hope Governor Wolf reads this and makes the right choices for all Pennsylvanians present and future.”
A Hazy Future reviews the current state of energy demand and use in Pennsylvania, calculates the footprint of industry projections of the proposed buildout, and assesses what that would look like for residents of the Commonwealth.
Started in 2010 as a southwestern Pennsylvania area website, FracTracker Alliance is a national organization with regional offices across the United States in Pennsylvania, the District of Columbia, New York, Ohio, and California. The organization’s mission is to study, map, and communicate the risks of oil and gas development to protect our planet and support the renewable energy transformation. Its goal is to support advocacy groups at the local, regional, and national level, informing their actions to positively shape our nation’s energy future.
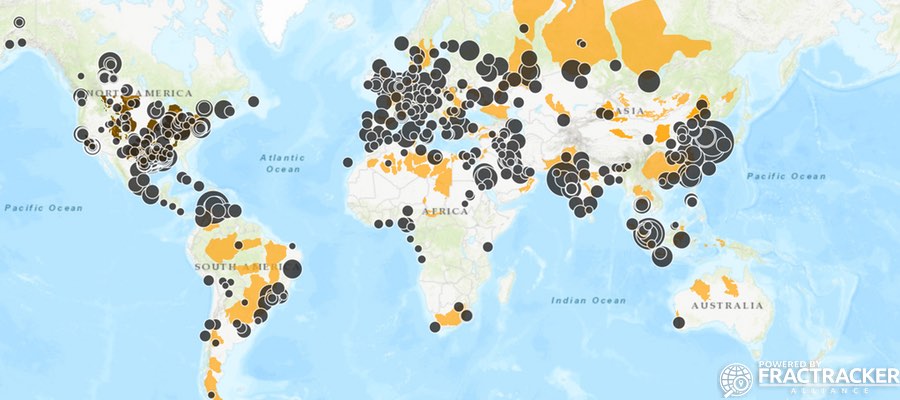
Potential Conflict Hotspots and Global Productivity Choke Points
Today, FracTracker is releasing a complete inventory of all 536 global oil refineries, along with estimates of daily capacity, CO2 emissions per year, and various products. These data have also been visualized in the map below.
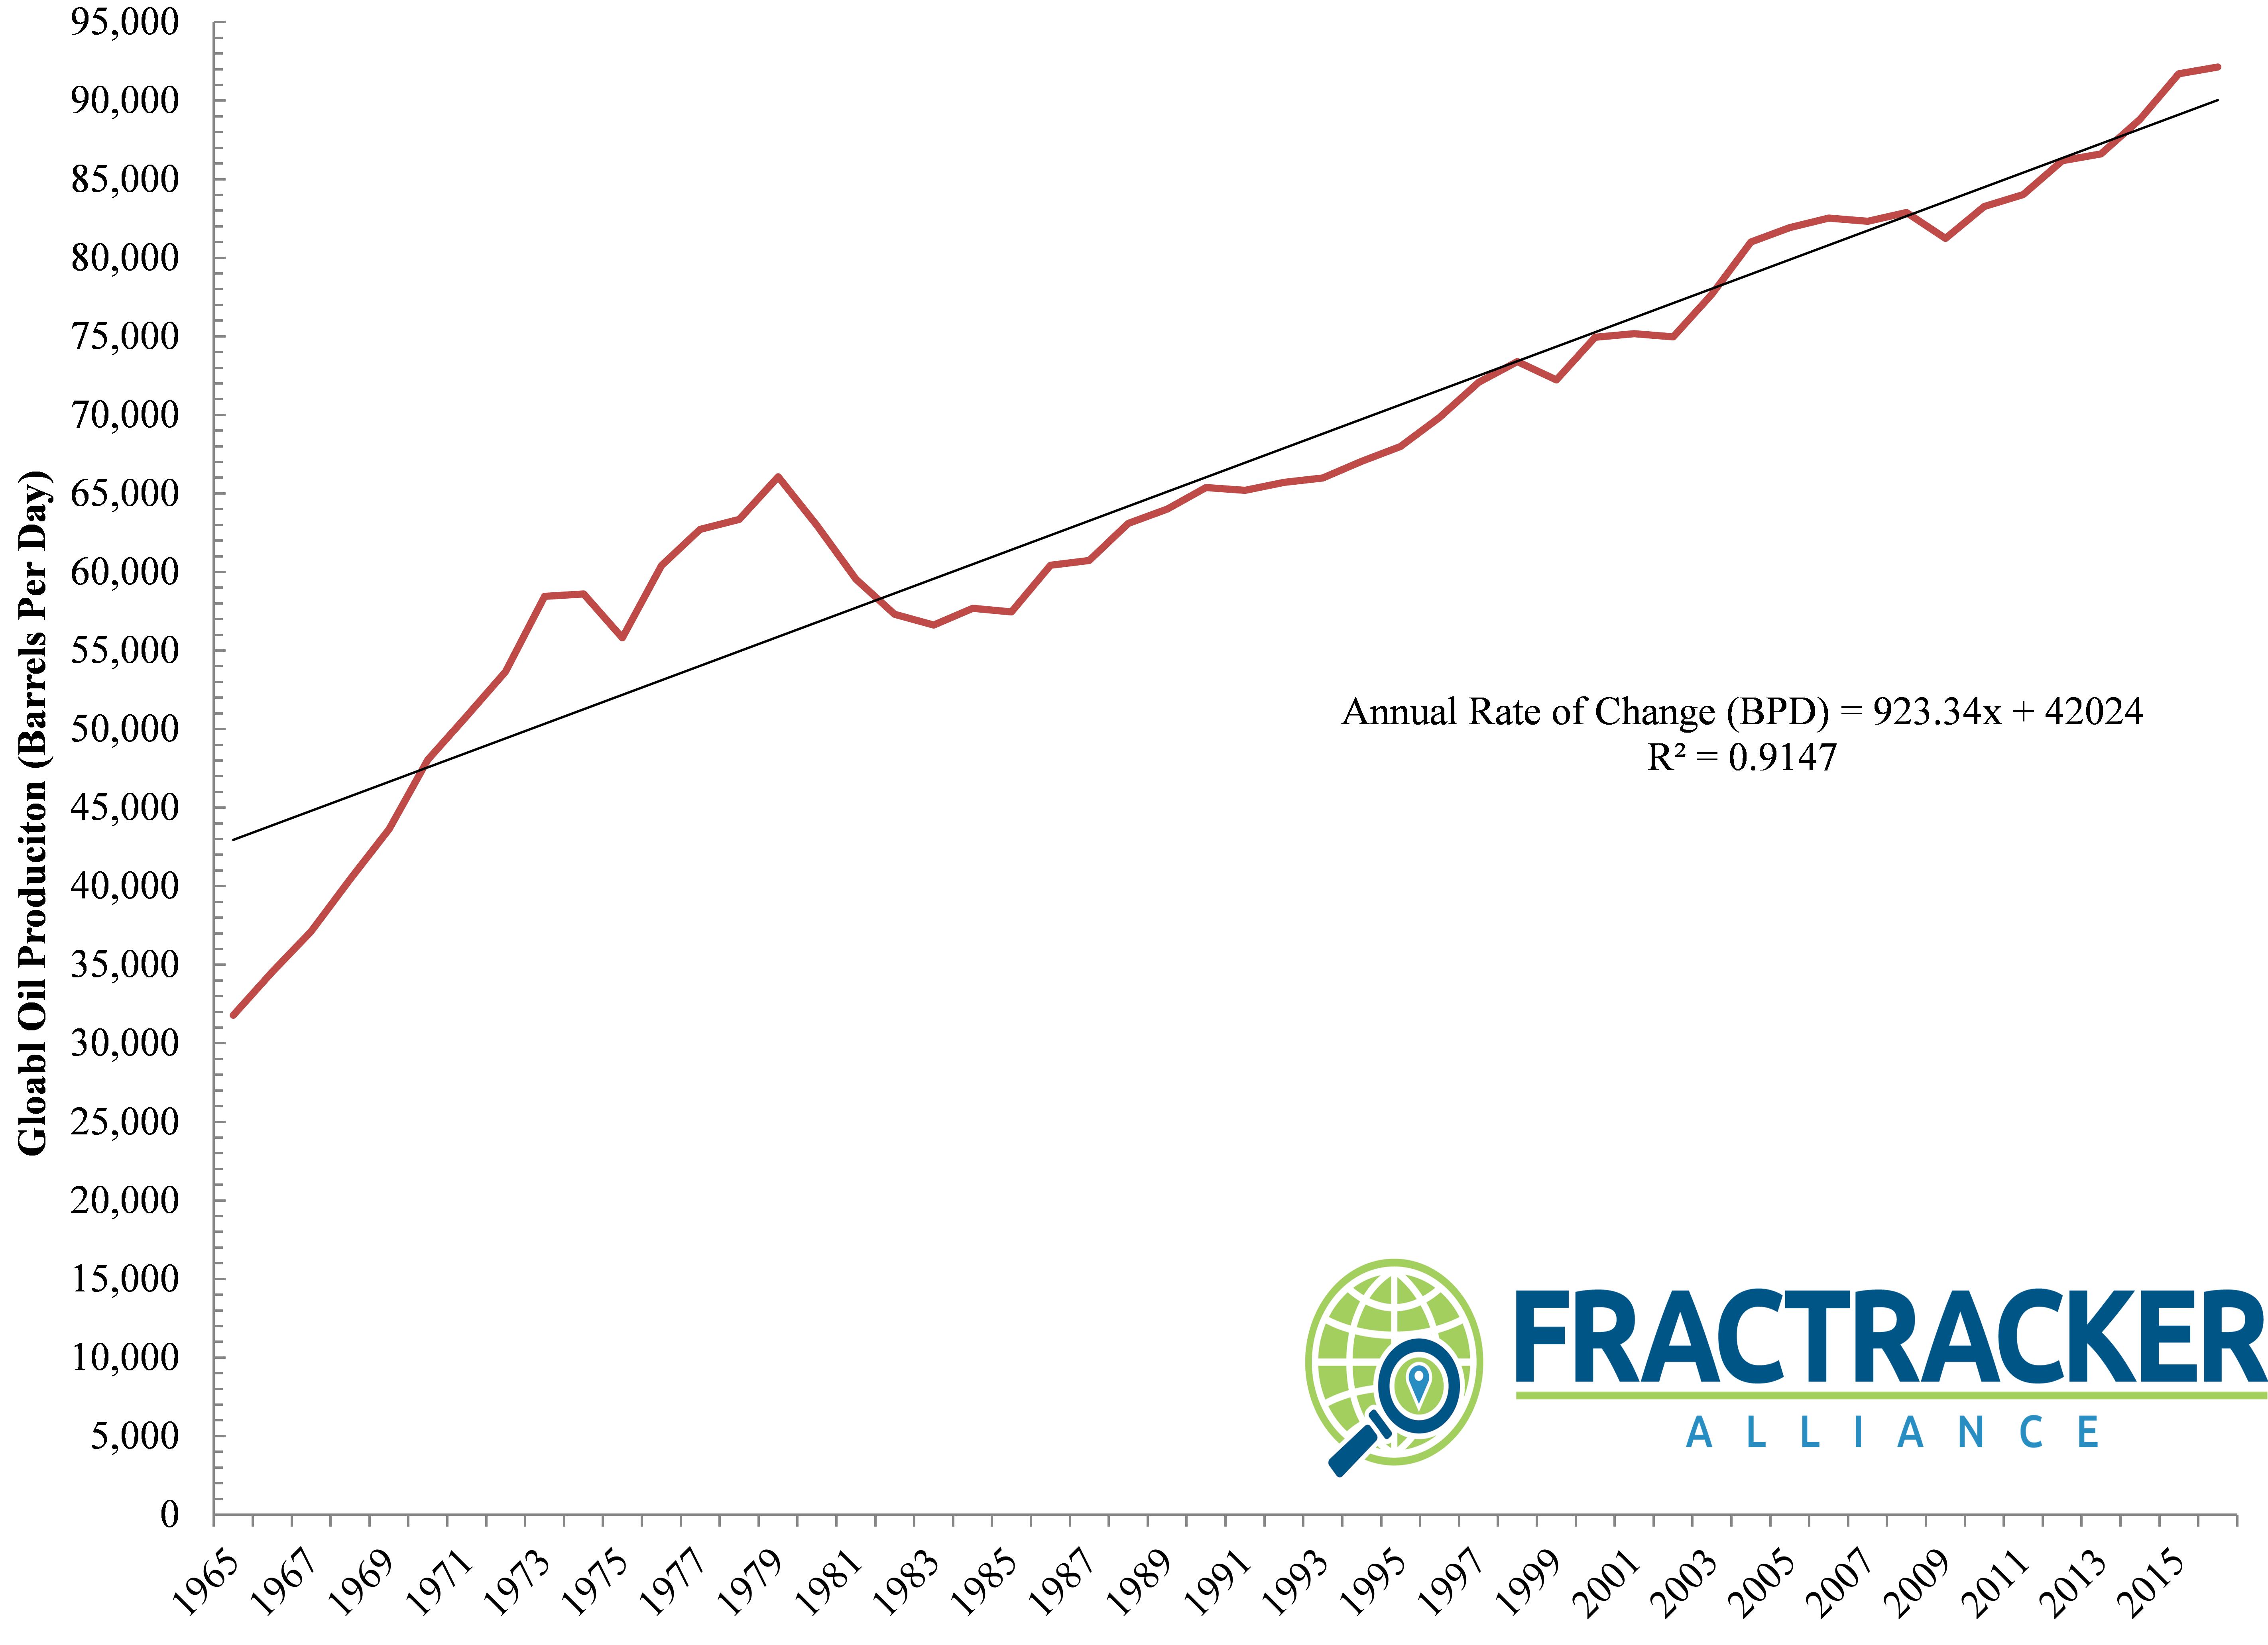
Total productivity from these refineries amounts to 79,372,612 barrels per day (BPD) of oil worldwide, according to the data we were able to compile. However, based on the International Energy Agency, global production is currently around 96 million BPD, which means that our capacity estimates are more indicative of conditions between 2002 and 2003 according to BP’s World Oil Production estimates. We estimate this disparity is a result of countries’ reluctance to share individual refinery values or rates of change due to national security concerns or related strategic reasons.
Assuming the planet’s 7.6 billion people emit 4.9-5.0 metric tons per capita of CO2 per year, emissions from these 536 refineries amounts to the CO2 emissions of 52-57 million people. If you include the facilities’ methane and N2O emissions, this figure rises to 61-66 million people equivalents every year, essentially the populations of the United Kingdom or France.
Across the globe, countries and companies are beginning to make bold predictions about their ability to refine oil.
Nigeria, for example, recently claimed they would be increasing oil refining capacity by 13% from 2.4 to 2.7 million BPD. Currently, however, our data indicate Nigeria is only producing a fraction of this headline number (i.e., 445,000 BPD). The country’s estimates seem to be more indicative of conditions in Nigeria in the late 1960s when oil was first discovered in the Niger Delta. Learn more.
Is investing in – and doubling down on – oil refining capacity a smart idea for Nigeria’s people and economy, however? At this point, the country’s population is 3.5 times greater than it was in the 60’s and is growing at a remarkable rate of 2.7% per year. Yet, Nigeria’s status as one of the preeminent “Petro States” has done very little for the majority of its population – The oil industry and the Niger Delta have become synonymous with increased infant mortality and rampant oil spills.
Sadly, the probability that the situation will improve in a warming – and more politically volatile – world is not very likely.
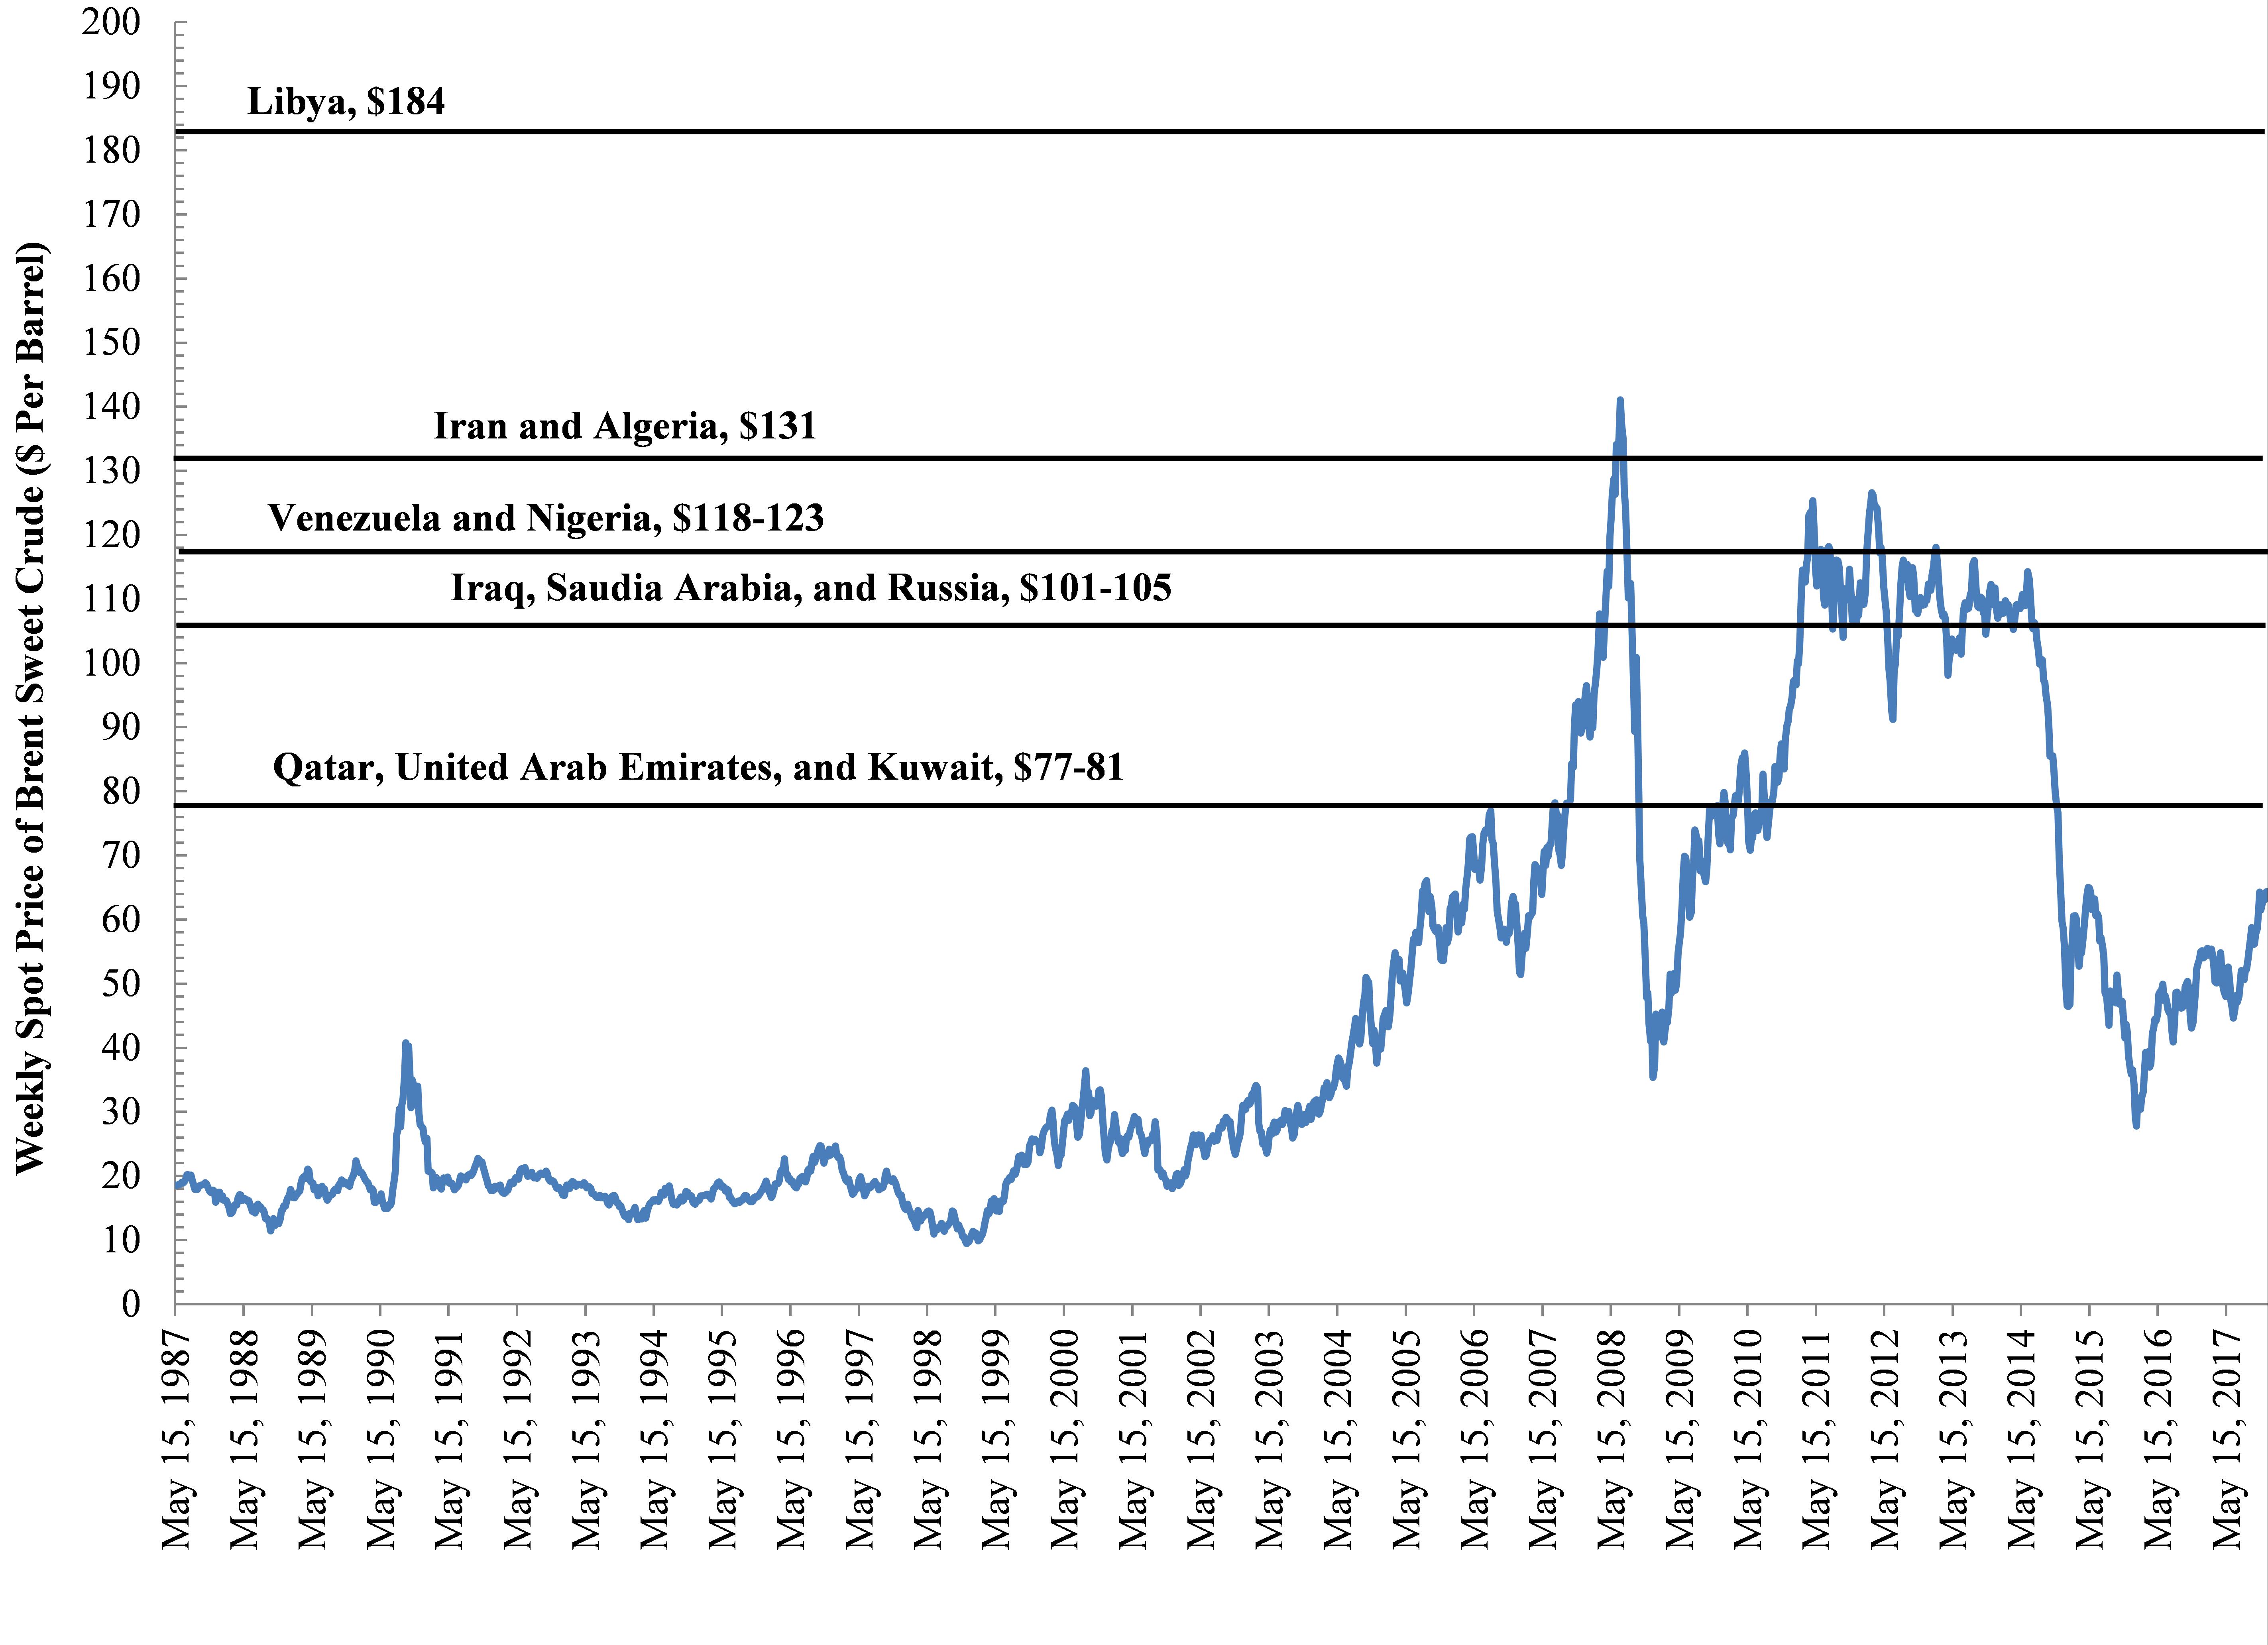
Such a dependency on oil price has been coupled to political instability in Nigeria, prompting some to question whether the discovery of oil was a cure or a curse given that the country depends on oil prices – and associated volatility – to balance its budget: Of all the Organization of Petroleum Exporting Countries (OPEC) countries, Nigeria is near the top of the list when it comes to the price of oil the country needs to balance its budget – Deutsche Bank and IMF estimate $123 per barrel as their breaking point. This is a valuation that oil has only exceeded or approached 4.4% of the time since 1987 (See Figure 2).
Former Central Bank of Nigeria Governor, Charles Soludo, once put this reliance in context:
… For too long, we have lived with borrowed robes, and I think for the next generation, for the 400 million Nigerians expected in this country by the year 2050, oil cannot be the way forward for the future.
Other regions are also at risk from the oil market’s power and volatility. In Libya, for example, the Ras Lanuf oil refinery (with a capacity of 220,000 BPD) and the country’s primary oil export terminal in Brega were the focal point of the Libyan civil war in 2011. Not coincidentally, Libya also happens to be the Petro State that needs the highest per-barrel price for oil to balance its budget (See Figure 2). Muammar Gaddafi and the opposition, National Transitional Council, jostled for control of this pivotal choke point in the Africa-to-Europe hydrocarbon supply chain.
The fact that refineries like these – and others in similarly volatile regions of the Middle East – produce an impressive 10% (7,166,900 BPD) of global demand speaks to the fragility of these Hydrocarbon Industrial Complex focal points, as well as the planet’s fragile dependence on fossil fuels going forward.
Figure 2. Weekly Spot Price of Brent Sweet Crude ($ Per Barrel) and estimates of the prices OPEC/Petro States need to balance their budgets.
Dividing Neighbors
These components of the fossil fuel industry, and their associated feedstocks and pipelines, will continue to divide neighbors and countries as political disenfranchisement and inequality grow, the climate continues to change, and resource limitations put increasing stress on food security and watershed resiliency worldwide.
Not surprisingly, every one of these factors places more strain on countries and weakens their ability to govern responsibly.
Thus, many observers speculate that these factors are converging to create a kind of perfect storm that forces OPEC governments and their corporate partners to lean even more heavily on their respective militaries and for-profit private military contractors (PMCs) to prevent social unrest while insuring supply chain stability and shareholder return.[2,3] The increased reliance on PMCs to provide domestic security for energy infrastructure is growing and evolving to the point where in some countries it may be hard to determine where a state’s sovereignty ends and a PMC’s dominance begins – Erik Prince’s activities in the Middle East and Africa on China’s behalf and his recent aspirations for Afghanistan are a case in point.
To paraphrase Mark Twain, whiskey is for drinking and hydrocarbons are for fighting over.
The international and regional unaccountability of PMCs has added a layer of complexity to this conversation about energy security and independence. Countries such as Saudi Arabia and Venezuela provide examples of how fragile political stability is, and more importantly how dependent this stability is on oil refinery production and what OPEC is calling ‘New Optimism.’ To be sure, PMCs are playing an increasing role in political (in)stability and energy production and transport. Since knowledge and transparency are essential for peaceful resolutions, we will continue to map and chronicle the intersections of geopolitics, energy production and transport, social justice, and climate change.
By Ted Auch, Great Lakes Program Coordinator, FracTracker Alliance; and Bryan Stinchfield, Associate Professor of Organization Studies, Department Chair of Business, Organizations & Society, Franklin & Marshall College
Assuming a tons of CO2 to barrels of oil per day ratio of 8.99 to 9.78 tons of CO2 per barrel of oil based on an analysis we’ve conducted of 146 refineries in the United States.
B. Stinchfield. 2017. “The Creeping Privatization of America’s Armed Forces”. Newsweek, May 28th, 2017, New York, NY.
R. Gray. “Erik Prince’s Plan to Privatize the War in Afghanistan”. The Atlantic, August 18th, 2017, New York, NY.
https://www.fractracker.org/a5ej20sjfwe/wp-content/uploads/2017/12/OilRefineries-Global-Feature.jpg400900Ted Auch, PhDhttps://www.fractracker.org/a5ej20sjfwe/wp-content/uploads/2025/09/2025-Wordmark-Logo.pngTed Auch, PhD2017-12-29 14:18:292021-04-15 15:02:03Tracking Global Oil Refineries and their Emissions
Decisions to drill or mine on public lands, however, are often extremely complicated.
By Allison M. Rohrs, Saint Francis University, Institute for Energy
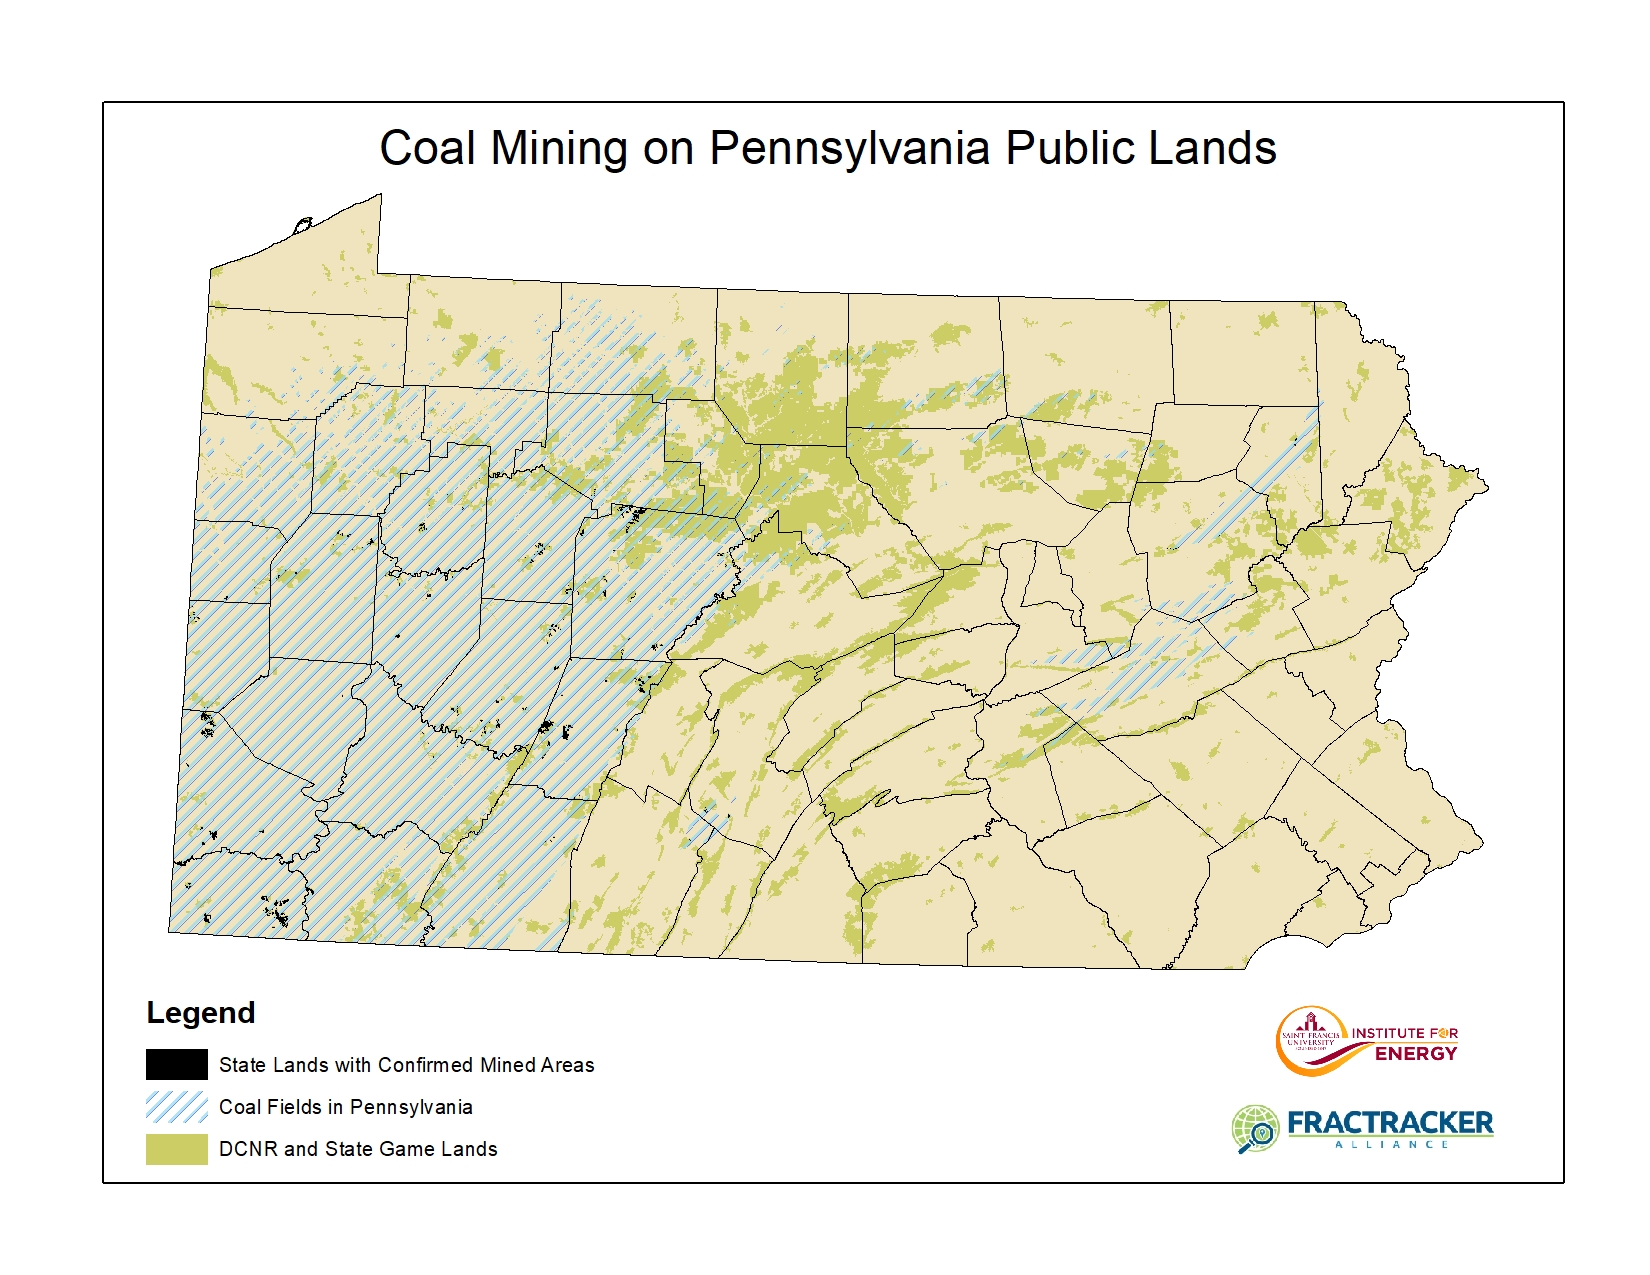
The Commonwealth of Pennsylvania has historically been, and continues to be, home to an abundant array of energy resources like oil, gas, coal, timber, and windy ridgetops. Expectedly, these natural resources are found both on publicly and privately held land.
In Pennsylvania, the bulk of public lands are managed by two separate state agencies: The Department of Conservation and Natural Resources (DCNR), which manages the state’s forest and park system, and the Pennsylvania Game Commission (PGC), which manages the state’s game lands. Both of these state agencies manage oil, gas, and coal extraction as well as timbering on state property. Interestingly, neither of the agencies have utility-scale renewable energy generation on their land.
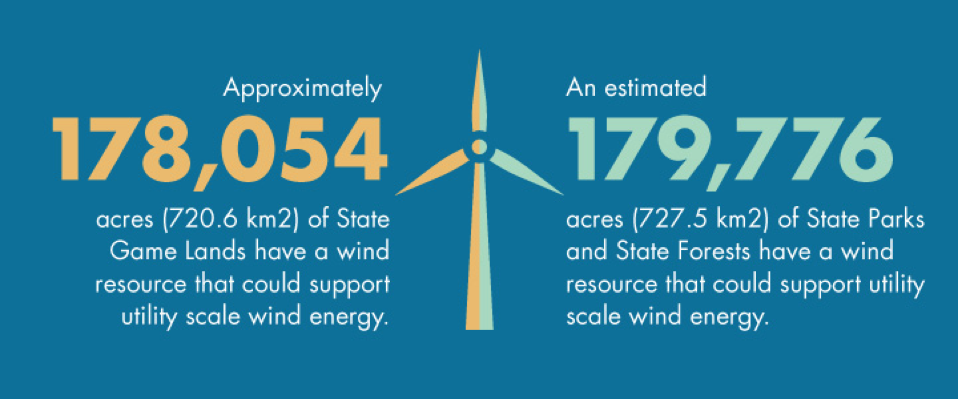
Some of Pennsylvania’s best wind resources can be found on the mountain ridges in the Commonwealth’s state forests and game lands, however, all proposals to build utility-scale wind farms have been denied by state agencies.
(Note: there are other state and federal agencies managing lands in PA, however, we focused our research on these two agencies specifically.)
Surprised to see that state lands have been greatly developed for different fossil industries but denied for wind energy, The Institute for Energy set out on a yearlong endeavor to collect as much information as we could about energy development on PA public lands. Using formal PA Right to Know requests, we worked with both DCNR and PGC to examine development procedures and management practices. We reviewed hundreds of available state agency reports, scientific documents, and Pennsylvania energy laws and regulations. We also worked with FracTracker Alliance to develop interactive maps that depict where energy development has occurred on state lands.
After a comprehensive review, we realized, like so much in life, the details are much more complicated than a simple yes or no decision to develop an energy project on state lands. Below is a brief summary of our findings, organized by energy extraction method:
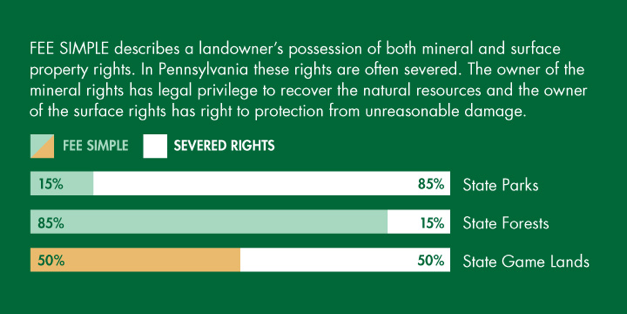
Land/Mineral Ownership in Pennsylvania
One of the most significant issues to understand when discussing energy resources on state lands is the complexity of land ownership in Pennsylvania. In many instances, the development of an energy resource on publicly owned land is not a decision, but instead an obligation. In Pennsylvania, property rights are often severed between surface and subsurface ownership. In many cases, surface owners do not own the mineral rights beneath them, and, by PA law, are obligated to allow reasonable extraction of such resource, whether it be coal, oil, or gas. In Pennsylvania, approximately 85% of state park mineral rights are owned by someone other than the Commonwealth (severed rights).
Legal Authority to Lease
It is critical to note that DCNR and PGC are two entirely separate agencies with different missions, legal structures, and funding sources. This plays a significant role in decisions to allow oil, gas, and coal development on their properties. Both agencies have explicit legal authority under their individual statutes that allow them to lease the lands for mineral extraction. This becomes more of an issue when we discuss wind development, where legal authority is less clear, particularly for DCNR.
Oil and Gas Extraction
Oil and gas wells have been spudded on state parks, state forests, and state game lands. The decision to do so is multifaceted and ultimately decided by three major factors:
Mineral ownership of the land,
Legal authority to lease the land, and
Potential impacts to the individual agency.
There is currently a moratorium on new surface leases of DCNR Lands. Moratoriums of such nature have been enacted and removed by different governors since 2010. Although there are no new lease agreements, extraction and production is still occurring on DCNR land from previously executed lease agreements and where the state does not own the mineral rights.
The Game Commission is still actively signing surface and non-surface use agreements for oil and gas extraction when they determine the action is beneficial to achieving their overall mission.
Revenues from the oil and gas industry play a significant role in the decision to drill or not. Both agencies have experienced increasing costs and decreasing revenues, overall, and have used oil and gas development as a way to bridge the gap.
Funds raised from DCNR’s oil and gas activities go back to the agency’s conservation efforts, although from 2009 to 2017, the State Legislature had directed much of this income to the state’s general fund to offset major budget deficits. Just this year, the PA Supreme Court ruled against this process and has restored the funds back to DCNR for conservations purposes.
All revenues generated from oil and gas development on state game lands stays within the Game Commission’s authority.
Along with positive economic benefits, there remains potential health and environmental risks unique to development on these public lands. Some studies indicate that users of these public lands could have potential exposure to pollution both in the air and in the water from active oil and gas infrastructure. The ease of public access to abandoned and active oil and gas infrastructure is a potential risk, as well. On the environmental side, many have argued that habitat fragmentation from oil and gas development is contradictory to the missions of the agencies. Both agencies have independent water monitoring groups specific to oil and gas activities as well as state regulated DEP monitoring. The potential negative effects on ground and surface water quality is an issue, however, mainly due the vast size of public lands and limited dwellings on these properties.
Use the map below to explore the PA state parks, forests, and game lands that have active oil and gas infrastructure.
Thousands of acres of state forests and game lands have been mined for coal. Like oil and gas, this mineral is subject to similar fee simple ownership issues and is governed by the same laws that allow oil and gas extraction. DCNR, has not signed any virgin coal mining leases since the 1990s, but instead focuses on reclamation projects. There are coal mining operations, however, on forest land where DCNR does not own the mineral rights. The Game Commission still enters into surface and non-surface use agreements for mining.
In many circumstances, mining activity and abandoned mines were inherited by the state agencies and left to them to reclaim. Environmental and health impacts of mining specific to state land are generally attributed more to legacy mining and not to new mining operations.
Acid mine drainage and land subsidence has destroyed rivers and riparian habitats on these lands purposed for conservation.
The ease of public access and limited surveillance of public lands also makes abandoned mines and pits a dangerous health risk. Although threats to humans and water quality exist, abandoned mines have been noted for actually creating new bat habitat for endangered and threatened bat species.
Originally, we sought to quantify the total acreage of public lands affected by coal mining and abandoned mines; however, the dataset required to do so is not yet complete.
The Pennsylvania Department of Environmental Protection is currently in the process of digitizing over 84,000 hand drawn maps of mined coal seams in PA, an expected 15-year project.
Today, they have digitized approximately 30,000. The static map below demonstrates the areas with confirmed coal mining co-located on state lands:
Renewables
The discussion about renewable energy development in PA is almost as complex as the fossil industries. There are no utility-scale renewables on state owned land. Both DCNR and the Game Commission have been approached by developers to lease state land for wind development, however all proposals have been denied.
Even when DCNR owns the surface rights, they still cite the lack of legal authority to lease the land for wind, as their statute does not explicitly state “wind turbines” as a lawful lease option.
The Game Commission does have the legal authority to lease its land for wind development, but has denied 19 out of 19 requests by developers to do so, citing many environmental and surface disturbances as the primary reason.
The development of wind projects in PA has slowed in the past five years, with only one new commercial wind farm being built. This is due to a variety of reasons, including the fact that many of windiest locations on private lands have been developed.
We estimate that 35% of the state’s best wind resource is undevelopable simply because it is on public land.
Like all energy development, wind energy has potential environmental and health impacts, too. Wind could cause habitat fragmentation issues on land purposed for conservation. The wind energy industry also has realized negative effects on bird and bat species, most notably, the endangered Indiana bat. Health impacts unique to public lands and wind development include an increased risk of injury to hunters and recreators related to potential mechanical failure or ice throw off the blades. Unlike fossil energies, however, wind energy has potential to offset air emissions.
We estimate that wind development on PA public lands could offset and estimated 14,480,000 tons of CO2 annually if fully developed.
Commercial wind turbines are currently being installed at hub heights of 80-100 meters where the annual average wind resource is 6.5 m/s or greater. The following map demonstrates areas of Pennsylvania where the wind speeds are 6.5 m/s or greater at 100 meters, including areas overlapping state lands, where no utility scale development has occurred.
Biomass is organic material, such as wood, that is considered renewable because of its ability to be replenished. The harvesting of such wood (timber) occurs on both DCNR and PGC lands and provides funding for these agencies.
Small-scale wind, solar, hydro, geothermal, and biomass projects do exist on PA public lands for onsite consumption, however no renewables exist on a commercial or utility scale.
Both the fossil and renewable energy industries are forecasted to grow in Pennsylvania in the years to come. The complex decisions and obligations to develop energy resources on PA public lands should include thoughtful management and fair use of these public lands for all energy resources.
For more information and details, check out the entire comprehensive report on our website: www.francis.edu/energy.
This work was supported by The Heinz Endowments.
https://www.fractracker.org/a5ej20sjfwe/wp-content/uploads/2017/12/PA-State-Lands-Drilling-Lenker.jpg400900Guest Authorhttps://www.fractracker.org/a5ej20sjfwe/wp-content/uploads/2025/09/2025-Wordmark-Logo.pngGuest Author2017-12-19 11:42:542021-04-15 15:02:04Energy development is happening on your state lands, Pennsylvania
We live in a complex environment of local, regional, national, and international issues. We are constantly bombarded with a news cycle that regenerates at increasingly dizzying speeds. How can we possibly know what is truly important when hyped up twitter controversies clog up our news feeds?
In this quantity-over-quality culture, many of the most important issues and fights for civil rights and energy justice become casualties of a regression to ignorance.
At FracTracker, we disagree with this tactic – especially as it relates to the protests at Standing Rock. FracTracker has previously written about these demonstrations (shown in the map above), and has also analyzed and mapped data on oil spills from pipelines in North Dakota. We will continue FracTracker’s coverage of Standing Rock and the Water Protectors who fought – and continue to fight – the Dakota Access Pipeline (DAPL), known as the Black Snake.
Following the Fight
For those unaware, the fight against the Dakota Access Pipeline operated by Energy Transfer Partners, continues. While the project was green-lighted by the Trump Administration and Bakken oil began flowing in June of 2017, the court has returned the permits to the U.S. Army Corps of Engineers. A U.S. District Court judge ruled that the initial approval of the pipeline did not undergo adequate study of its environmental consequences. The finding stated that the Army Corps provided a flawed model, inadequate for predicting the full impacts of a leak under Lake Oahe. The model does not consider what would happen in the event of a leak under the lake. It models only benzene — one of many toxic chemicals present in crude oil — and models its movement in an unrealistic manner. Energy Transfer Partners claims the model is conservative, but it massively underestimates the potential impacts on human health and wildlife. The Army Corps provides no plan to contain an underground leak or clean contaminated soil and groundwater under Lake Oahe.
On a related note, DAPL’s parent company, Energy Transfer Partners, said in a recent annual report that it may not have sufficient liquid assets to finance a major cleanup project and would likely pass those costs onto local landowners and federal taxpayers. Energy Transfer Partners has since filed a racketeering lawsuit seeking $300 million in damages from the Red Warrior Camp at Standing Rock.
… the agency could simply revise or update its environmental review and again conclude that no EIS (environmental impact statement) is required. If that happens, additional legal challenges are likely. The Tribe believes this court decision should trigger a full EIS, including consideration of route alternatives, just as the Obama administration proposed in December.
Normally, when a permit is issued in violation of the National Environmental Protection Act (NEPA), operations are suspended, which would have forced the DAPL to shut down while the review is conducted. Contrary to the usual protocol, on October 11, 2017 a federal judge ruled that the pipeline will remain operational pending the environmental review by the Army Corps. Standing Rock Sioux Chairman Dave Archambault II has said in a statement, however, “Just because the oil is flowing now doesn’t mean that it can’t be stopped.”
More Information and Resources
The Lakota People’s Law Project (LPLP) has been a resource to Lakota country – an area comprised of nine Indian reservation in North and South Dakota – since 2004. The LPLP supports a number of campaigns including divestment and energy justice, and has published several reports:
Special thanks to the Lakota People’s Law Project and Rachel Hallett-Ralston for the information provided.
In January of 2017, 76 Water Protectors including Chase Iron Eyes were arrested on land granted to the Standing Rock Lakota Sioux Tribe under the 1851 Treaty of Fort Laramie. Chase Iron Eyes, Lead Counsel of the Lakota People’s Law Project, has been charged with felony incitement to riot and misdemeanor criminal trespass. In the interview above, Chase Iron Eyes discusses his involvement with Standing Rock and the political pressures to make an example out of him. Read the Lakota People’s Law Project petition here.
By Kyle Ferrar, Western Program Coordinator, FracTracker Alliance