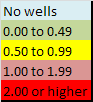
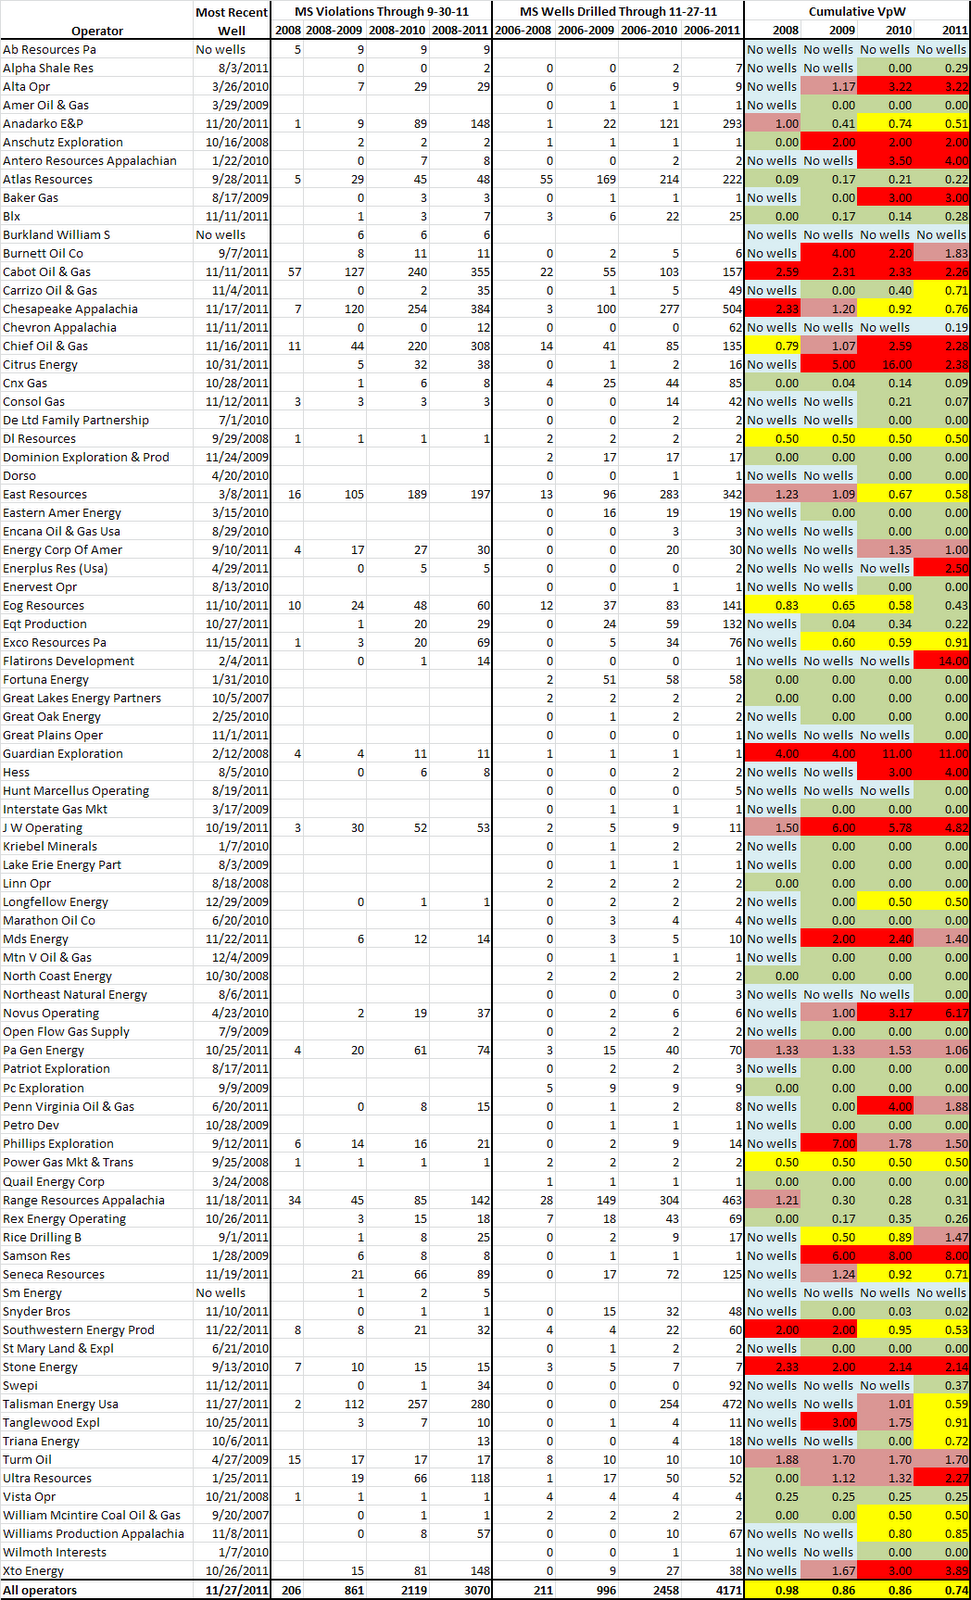
The following chart contains all operators that have either drilled a Marcellus Shale well in Pennsylvania from March 6, 2006 to November 27, 2011, or have been issued a Marcellus Shale related violation by the Pennsylvania Department of Environmental Protection between January 1, 2008 and September 30, 2011. Results are cumulative, thereby reflecting each company’s legacy with the Marcellus Shale, rather than their performances for any given year. The Violations per Well (VpW) score has been color coded for easy reference, with the following scale:
Most companies that are issued violations are well operators, although there do seem to be some midstream companies on the violation list. This might account for some of the blue “No wells” below, but mostly they reflect operators that were not yet active. For example, Antero Resource’s first well was in 2010, so entries for 2008 and 2009 read as “No wells”.
Whenever we look at Marcellus operators over time, the changes in companies has to be dealt with in some way. In this case, I took a minimalist approach: while East Resources, Inc. and East Resources, Llc. were combined, I did not merge name changes that were more substantial than that. For example, even though CNX Gas and Consol Gas are both owned by Consol, I did not merge the two. Another example is St. Mary Land and Exploration changed its name to SM Energy, and those two entries were left unchanged. Because of all of the changes within the industry, I have included the most recent drill date, so that viewers can determine if the drillers are still active.
https://www.fractracker.org/a5ej20sjfwe/wp-content/uploads/2025/09/2025-Wordmark-Logo.png00Matt Kelso, BAhttps://www.fractracker.org/a5ej20sjfwe/wp-content/uploads/2025/09/2025-Wordmark-Logo.pngMatt Kelso, BA2011-11-29 16:44:022020-07-21 10:38:39Violations per Well by Operator Over Time
Several oil and gas datasets from the Pennsylvania Department of Environmental Protection (DEP) have been updated on the FracTracker DataTool, including:
Additionally, a Pennsylvania zip code dataset from the US Census has been added, but it appears to have some errors, with some zip codes inside Pennsylvania missing, and some outside of the border included.
PA zip codes. Please click the “i” tool then any map feature for more information.
Also, Rhiza Labs, the software developer of our DataTool, has been working hard to add new charting functionality to their Upshot platform. Any data that is classified as numeric upon upload can be charted. Play around with it, and let us know what you think.
https://www.fractracker.org/a5ej20sjfwe/wp-content/uploads/2025/09/2025-Wordmark-Logo.png00Matt Kelso, BAhttps://www.fractracker.org/a5ej20sjfwe/wp-content/uploads/2025/09/2025-Wordmark-Logo.pngMatt Kelso, BA2011-10-26 15:43:432020-07-21 10:38:38PA Data Updates, New DataTool Charting Functionality
The Economic Consequences of Marcellus Shale Gas Extraction report outlines some of the key issues explored by a team of researchers centered at Cornell University during the period of New York’s moratorium on high volume hydraulic fracturing (HVHF) for natural gas. Our research focused on Pennsylvania, where Marcellus HVHF drilling has already begun, and on New York, which is still considering how to regulate HVHF, but we also made use of the experience of other states that have shale gas plays where HVHF has been in use far longer than in Pennsylvania.
At 17 pages, this report is a series of snapshots about what we found. For a more fulsome account of our analysis and findings on most of these issues, we encourage you to read the complete working papers and policy briefs we have made available for download.
We launched this research project because it had become evident that the public and policy discussion over the consequences of Marcellus shale gas extraction had devolved to a polarized debate contrasting potential effects on water supplies with potential economic benefits – such as job creation. The consequences for water resources were (and are) receiving a great deal of attention; the economic consequences were not. We did not begin with a disposition for or against shale gas extraction, but we wanted to develop a realistic picture about what to expect, and about the economic consequences both in the short term and in the longer term.
As you will see in the report, the consequences that should concern us all go well beyond environmental concerns, and their economic implications include costs as well as benefits. On balance, is shale gas extraction likely to be an economic winner? Not necessarily. We conclude that while there are real economic benefits for some parties, if shale gas extraction is to be at all a positive force for economic development broadly and long term, it will require intensive planning and a new structure of regulation, monitoring and enforcement – along with the means to pay for it – that are not currently in place.
Susan Christopherson, PhD
Professor, Department of City and Regional Planning, Cornell University
Principal Investigator
https://www.fractracker.org/a5ej20sjfwe/wp-content/uploads/2011/10/PIPELINE_HOUSE.jpg325487Guest Authorhttps://www.fractracker.org/a5ej20sjfwe/wp-content/uploads/2025/09/2025-Wordmark-Logo.pngGuest Author2011-10-20 09:55:362020-07-21 10:38:37Report: Economic Consequences of Marcellus Shale Gas Extraction
The Pennsylvania Department of Environmental Protection’s Bureau of Oil and Gas maintains violation data on their website (download the Excel file). The following is a summary of Marcellus Shale violations issued in the first eight months of this year, including the number of wells that were flagged for violations.
Marcellus Shale violations and offending wells in Pennsylvania: January – August, 2011
https://www.fractracker.org/a5ej20sjfwe/wp-content/uploads/2025/09/2025-Wordmark-Logo.png00Matt Kelso, BAhttps://www.fractracker.org/a5ej20sjfwe/wp-content/uploads/2025/09/2025-Wordmark-Logo.pngMatt Kelso, BA2011-10-05 12:22:162020-07-21 10:38:37January to August Marcellus Shale Violations by Operator
It may not seem like it when you head to the pump, but the price of oil has plummeted in recent months. After peaking near $114 in April, the price has fallen all the way to $77.27, as of today. Natural gas, which was $4.27 last month, has fallen 15 percent since then to $3.62. Surely with all of this uncertainty, the Corbett’s proposed impact fee makes more sense than the traditional severance tax which most states use? Perhaps it would be better to take the predictable lump-sum amount than basing that portion of the state’s coffers on the vagaries of the market?
No, not really.
Corbett’s plan allows the counties to charge up to $40,000 per well per year, for a period of up to 10 years per well. According to the Post-Gazette, his administrations figures it could bring in $120 million in the first year, and up to $200 million per year by the sixth year.
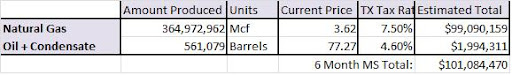
Or, as I pointed out in June, we could tax like Texas. Texas imposes a 7.5% severance tax on natural gas and 4.6% tax on oil and condensate. Using yearlong production data for non Marcellus Shale wells in Pennsylvania and the average wellhead price of gas and price per barrel of liquid hydrocarbons for 2010, I estimated that non-Marcellus wells would have brought in $72.5 million if we taxed our resources just like Texas does. What’s more, based on six month production data, I showed that the wells in the Marcellus Shale formation would produce at least $173 million, for a statewide total of $246 million through all formations.
But that was before the bottom fell out of the price of oil and gas. What if we used today’s low prices as a guide?
Estimated six month severance tax from the Marcellus Shale formation in Pennsylvania.
Even with the low energy prices, that six month total is almost as much as Corbett’s administration figures to raise in a year, and it doesn’t even include the tens of thousands of wells that aren’t drilled into the Marcellus Shale.
While the proposed impact fee does more for Pennsylvania than the current nothing-at-all policy, in the scheme of things, it is a great deal for the drilling industry.
And one final aside: does it seem strange to anyone else to let the counties set the impact fee? Is this some sort of attempt to have them compete with each other to keep the prices low? If so, it seems unlikely to work in my opinion. If a county charges the maximum $40,000, that represents only about 0.8 percent of cost of a well that costs $5 million to drill, and that figure is on the low end of the spectrum. The drilling companies will want to drill where the resources are, and whatever fees or taxes are charged will not change that fact.
According to pages 100-101 of the Oil and Gas Operator’s Manual, a region may be determined to be unsuitable for mining if the mining operation will:
be incompatible with existing State or local land use plans or programs;
affect fragile or historic lands in which such operations could result in significant
damage to important historic, cultural, scientific and esthetic values and natural
systems;
affect renewable resource lands in which such operations could result in a
substantial loss or reduction of long-range productivity of water supply or of
food or fiber products, and such lands to include aquifers and aquifer recharge
areas; or
affect natural hazard lands in which such operations could substantially
endanger life and property, such lands to include areas subject to frequent
flooding and areas of unstable geology.
Marcellus Shale permits that were issued in areas which were deemed to be “unsuitable for mining” according to the PA DEP in 2002.
These seem like worthy goals. So if these areas are unsuitable for coal mining, why is it OK to put gas wells there?
Granted, drilling a well is not quite the same impact as a surface mining operation, but to protect an area from one mode of mineral extraction and not the other seems inconsistent. After all, many of the problems with coal are still relevant for gas drilling, since the drilling operator must go through the coal seam to get to the gas. The pyrite associated with the coal is still exposed to air, meaning that the drilling mud and drill cuttings probably contain sulfuric acid, the key component of acid mine drainage (AMD).
And it’s not just the drill cuttings that could be a source of problems…it could be the well bore itself. Consider the Hughes Bore Hole, which, according to Wikipedia was drilled in the 1920’s to drain underground mines in the area, then capped in the 1950’s. So what’s the big deal? In the 1970’s, pressure built up and the hole burst open, and has been spewing about 800 gallons per minute of acid mine drainage ever since.
Three new West Virginia datasets have been added to the DataTool to keep up to date with Marcellus Shale activities in that state. The West Virginia DEP is the source for all three datasets. Included are:
Marcellus Shale permits in West Virginia through September 6, 2011. Please click the image for a dynamic view.
The permits list was filtered online to include only Marcellus Shale permits, then filtered on the desktop to reflect only “Permit Issued” actions, thereby ignoring applications, renewals, and other actions for the same well. I also converted the coordinate system from UTM’s to the more familiar system decimal degree latitude and longitude. There are 1,868 records in the dataset. One well apparently was given the wrong coordinates, and appears to be in Pennsylvania instead of West Virginia.
Marcellus Shale drilled wells in West Virginia through September 6, 2011. Please click the image for a dynamic view.
Each triangle in the map above represents a Marcellus Shale gas well that was listed as an active well. Location data was determined by matching the unique well numbers to the permits list, above.
Marcellus Shale violations in West Virginia through September 6, 2011. Please click the image for a dynamic view.
The violations list did not mention whether or not the well was a Marcellus Shale well, nor did it give location information. Both of these categories were determined by matching the well number to the permits list.
https://www.fractracker.org/a5ej20sjfwe/wp-content/uploads/2025/09/2025-Wordmark-Logo.png00Matt Kelso, BAhttps://www.fractracker.org/a5ej20sjfwe/wp-content/uploads/2025/09/2025-Wordmark-Logo.pngMatt Kelso, BA2011-09-09 14:16:532020-07-21 10:38:36West Virginia Marcellus Shale Data Updated
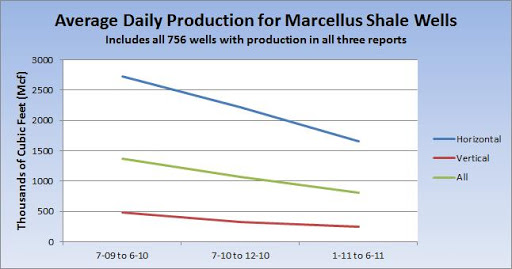
In this post, we will explore the change in production from the 756 Marcellus Shale wells that reported positive (nonzero) production on each of the three reports. Of these, exactly 300 were flagged as horizontal wells on the most recent report, leaving 456 to be classified as vertical wells.
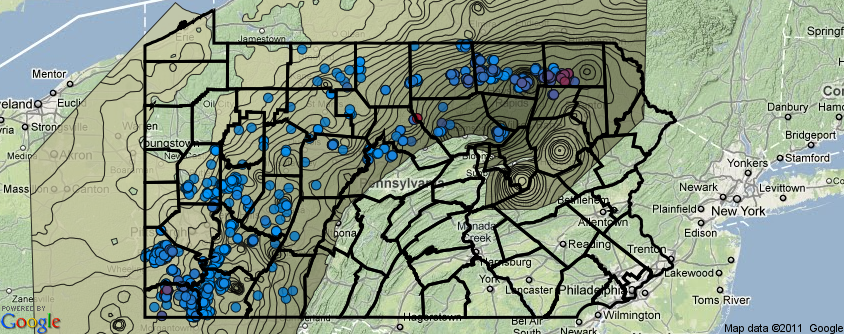
Marcellus Shale production in Pennsylvania from January to June, 2011. Please click the image to see a zoomable and dynamic map. Caveats
It is important to note that the first of the three production cycles is for a one year period, while the other two are for six months each. Luckily, each report includes not only production in thousands of cubic feet (Mcf), but also the number of days for which each well was in production. Therefore, we can look at the data in terms of thousands of cubic feet per day (McfPD), which solves not only the 12 month vs. 6 month problem, but also makes sure that we aren’t comparing six months of production to just a handful of days.
One important factor that this analysis does not account for, however, is when the well first entered production. This is significant, because gas wells typically have a very high initial production, which falls steeply in the months and years ahead. This produces a hyperbolic decline curve, such as this Department of the Interior graph found on Wikipedia.
In this case, we only know that the initial production was some time since 2006 and before June 30, 2010. Add to that fact that there are only three date ranges, and the result is definitely not a proper decline curve.
Results
However, there are results, and they do show decline over time. Interestingly, there are some differences to note between horizontal and vertical Marcellus Shale wells.
Average Marcellus Shale production in thousands of cubic feet (Mcf) for wells on all three production reports.
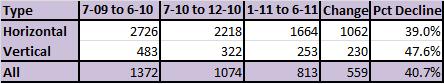
Average Marcellus Shale production showing rates of decline.
The overall production of the sample decreased 40.7 percent from the period ending June 2010 to the one ending one year later. Interestingly, the vertical wells are declining at a sharper rate than horizontal wells, although not dramatically so.
The chart also highlights the amazing difference in production that horizontal drilling provides to Marcellus Shale wells, with average production values 5.6 to 6.9 times higher than their vertical counterparts.
What’s Missing?
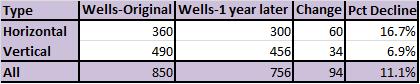
Not all of the Marcellus Shale wells from the July ’09 to June ’10 list were still reporting production for the period that ended one year later. These wells were not included in the above analysis, but are interesting in their own right:
Number of Marcellus Shale wells on the production report for the period ending June 2010 that are also reporting production one year later.
Surprisingly, the rate for horizontal wells no longer producing gas is more than twice as high as their vertical counterparts. Does this mean that a side effect of horizontal drilling is a shorter well production life, as all of the gas is extracted faster? We’ll have to wait and see what future data shows to find out.
https://www.fractracker.org/a5ej20sjfwe/wp-content/uploads/2025/09/2025-Wordmark-Logo.png00Matt Kelso, BAhttps://www.fractracker.org/a5ej20sjfwe/wp-content/uploads/2025/09/2025-Wordmark-Logo.pngMatt Kelso, BA2011-09-05 14:10:382020-07-21 10:38:22Marcellus Shale Production Decline Over Time in Pennsylvania
Pennsylvania Oil & Gas Violation, Inspection, & Enforcement Data on FracTracker.org
On Thursday, August 11th, Matt Kelso spoke to a group of people invited by EARTHWORKS to discuss how well PA is or could enforce natural gas drilling regulations. Check out his presentation (PDF).
https://www.fractracker.org/a5ej20sjfwe/wp-content/uploads/2025/09/2025-Wordmark-Logo.png00FracTracker Alliancehttps://www.fractracker.org/a5ej20sjfwe/wp-content/uploads/2025/09/2025-Wordmark-Logo.pngFracTracker Alliance2011-08-15 13:36:192020-07-21 10:38:20Oil and Gas Data Presentation
I was recently contacted by a resident of New York State who was concerned about Marcellus Shale gas drilling moving into his area. He found a report by geologists Dr. Gary Lash from SUNY – Fredoinia and Dr. Terry Engelder from Penn State that showed the shale layer thinning substantially as it heads north across the Pennsylvania-New York border.
What’s more, this report breaks up the Marcellus Shale into several substrata, including the Union Springs shale and the Oatka Creek shale, which are separated by a thin and intermittent layer of limestone.
On a cursory level, the thickest parts of the Union Springs substratum of the Marcellus Shale seemed to correspond with the highest production areas in Bradford and Susquehanna Counties. Even though there was another high production area in Southwestern Pennsylvania in a relatively thin portion of the Union Springs (and Marcellus Shale in general), it seemed like a reasonable hypothesis to explore. Does the thickness of the shale layer effectively predict the production values from wells in those areas?
Thickness of the Union Springs substratum of the Marcellus Shale and daily production values. As the shale layer gets thicker, it is represented by darker brown bands, while production values range from blue (lowest production) to red (highest production). For more information and a dynamic view, click the image to visit our DataTool.
Karen Edelstein, FracTracker’s New York Liason, digitized the Union Springs thickness map from the Lash-Engelder report, and then I was able to correlate the production values of all Marcellus Shale wells to the average thickness of each category. For the purpose of this exercise, only wells reporting positive (non-zero) production values between July and December 2011 were included. To account for wells in production for only part of that period, I calculated the average daily production in thousands of cubic feet (Mcf) per day.
Thickness of the Union Springs substratum of the Marcellus Shale in feet versus average daily production in thousands of cubic feet (Mcf) per day.
Overall, the correlation isn’t very strong. While the trend line does show moderate increases in production as the Union Springs shale layer thickens, the low R-squared shows that there is a good bit of randomness involved. Part of this was expected, due to the large number of productive wells in Southwestern Pennsylvania, where the formation is quite thin. This would be the notable bump in the plot chart above between 20 and 60 feet of thickness.
Thickness of the Union Springs substratum of the Marcellus Shale and average daily production values. Click the image for more information and a dynamic view.
However, there is another factor that contributes to the poor correlation. As I mentioned above, the trendline does indicate that on average, wells in the thicker formations produce more gas than those in thinner formations, but there are also a large number of duds from the most robust parts of the Union Springs. That is to say, there are a lot of blue dots in the dark brown regions of the map below.
It is likely that if the whole thickness of the Marcellus Shale were considered, the results would have been even worse. In fact, some of the thickest parts of the whole Marcellus, at least according to Lash and Engelder, are in Pike County, which drillers have left alone so far.
So we have not cracked the nut of predicting which areas will yield the highest production returns, but at least we have good company in that regard. Despite the huge amount of data that the oil and gas companies possess, the results that they report to the Pennsylvania Department of Environmental Protection show that they still don’t really know what they’ll find at the bottom of a hole until they drill it.
Although there is clearly more to gas yields than thickness of the shale, it was an interesting exercise, and if the industry ever does figure it out, it will be a multi-billion dollar discovery–keep in mind that each of the thousands of wells planned cost at least $5 million to drill. Here’s hoping that they do figure it out someday, and not just because of the economics. If drilling wildcat wells can be minimized, then many of the significant adverse effects of the industry would also be mitigated as well, at least in areas where production values were estimated to be low.


