FracTracker Alliance and Great Plains Action Society have launched an environmental justice mapping tool to support Indigenous communities in their resistance against CO2 pipelines.
https://www.fractracker.org/a5ej20sjfwe/wp-content/uploads/2024/10/No-CO2-Ppelines-Sioux-City.jpg6721012Gwen Klenkehttps://www.fractracker.org/a5ej20sjfwe/wp-content/uploads/2025/09/2025-Wordmark-Logo.pngGwen Klenke2024-10-22 11:55:082024-10-25 12:10:00Indigenous Communities’ Fight Against CO2 Pipelines in the Great Plains
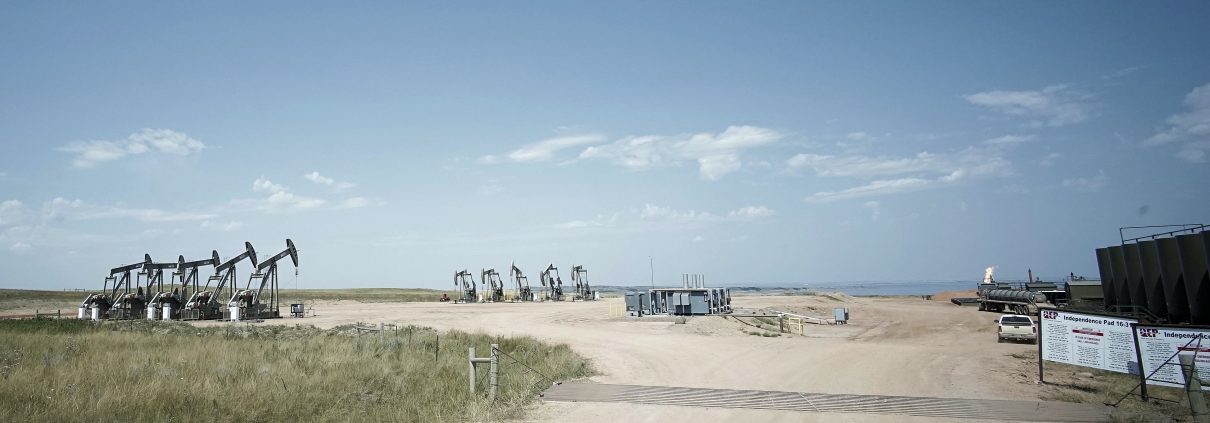
There is a need for more research on the human impact of the oil and gas industry in North Dakota, particularly on landowners and farmers, to understand their experiences and address their concerns effectively.
https://www.fractracker.org/a5ej20sjfwe/wp-content/uploads/2016/10/Nix-Pix-050.jpg30884629FracTracker Alliancehttps://www.fractracker.org/a5ej20sjfwe/wp-content/uploads/2025/09/2025-Wordmark-Logo.pngFracTracker Alliance2024-06-04 16:34:592025-05-02 14:53:36The Importance of Surveying Rural Landowners in North Dakota on Fracking
The interplay between the rights of the owner of the surface estate and the rights of the mineral estate have recently become the subject of both legislation and litigation as the use of subsurface pore space by various energy industries has developed at an increasingly rapid pace in North Dakota.
https://www.fractracker.org/a5ej20sjfwe/wp-content/uploads/2022/08/51119572588_132e0366c1_k_1-e1663254774314.jpg6071364Guest Authorhttps://www.fractracker.org/a5ej20sjfwe/wp-content/uploads/2025/09/2025-Wordmark-Logo.pngGuest Author2022-08-31 14:33:482022-09-15 16:29:45Carbon Capture and Storage: Developments in the Law of Pore Space in North Dakota
As the oil and gas industry feels pressure from former allies and see lending windows from their most loyal banking partners begin to dry up, they will be forced to cut costs elsewhere, and cut corners everywhere. This will come in the form of more industry-friendly regulations on the federal level under the current administration, as well as less stringent oversight at the state level. These trends are explicit manifestations of their desperation and influence.
The state-level laws the oil and gas industries are advocating for can easily fly under the radar. Most people just don’t have the bandwidth to educate themselves on the quiet development of these bills, nor to advocate against them. Much of the public’s attention is understandably focused on the COVID-19 pandemic, mass unemployment, and racial inequality. And, much of the critical attention around oil and gas legislation has correctly focused on the critical infrastructure legislation and related policy proposals we focused on in Part I of this series.
Below, we outline current attempts to weaken environmental regulations in Ohio, North Dakota, and Michigan. It is important to note that this is not an all-inclusive outline, but rather the bills we are aware of through our network of frontline and nonprofit contacts.
Ohio’s House Bill 545
A bill that would be hazardous to the health of all Ohioans, HB 545, intended to “Establish conditions for sale of brine as a commodity,” was introduced by first-term State Representative Adam Holmes, and second-termer Craig Riedel of Western Ohio. This bill would charge the Ohio Department of Natural Resources’ (ODNR) Division of Oil and Gas Resources Management with establishing “conditions and requirements for the sale of brine from oil or gas operations as a commodity, and to exempt that commodity from requirements otherwise applicable to brine.” What could possibly go wrong? The dangers of potentially highly radioactive fracking waste have been known for years, and were recently detailed in great reporting by Justin Nobel for Rolling Stone. Countless others have spent years crying out against radioactive fracking waste being produced, transported, and disposed of all across the Appalachian regions of Ohio, Pennsylvania, and West Virginia.
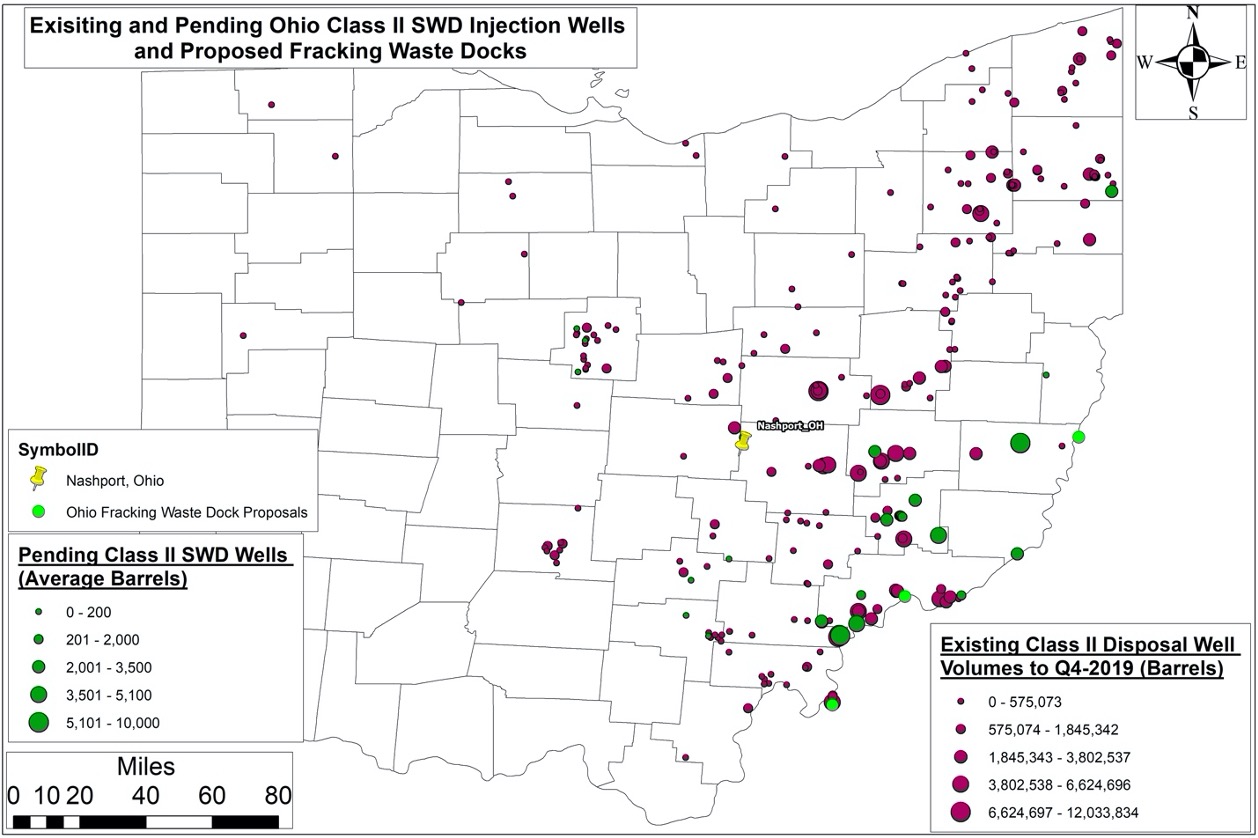
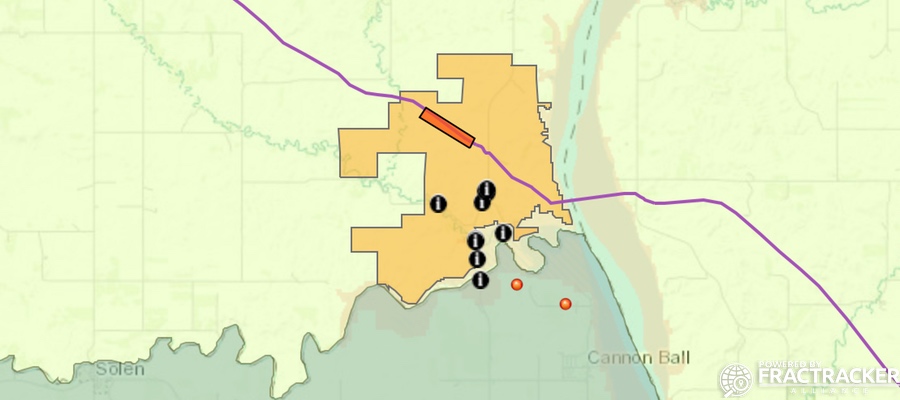
So, quite a bit could – and likely would – go horribly wrong if we allow ODNR to put lipstick on this fracking waste pig, as it were. The worst part about this is that Representative Holmes knows, (or at least should know), better, given that he lives in Nashport, roughly two miles south of a very active Class II Salt Water Disposal Well, and just a couple more miles from nearly a dozen more injection wells (Figure 1).
Figure 1. Existing and Pending Ohio Class II Salt Water Disposal Injection Wells and Proposed Fracking Waste Docks.
This change from quarterly to annual reporting will have profound implications for what little monitoring citizens are permitted. Clearly, the state has little interest or money to conduct monitoring.
An example of how great the lag could be, and how annual data will essentially be useless for any real-time concerns and/or incidents, the current year’s brine volume data will not be available until February 2021, and even then, the operator will have chances to revise the data. FracTracker has been compiling this data quarterly for years, and we will continue to make data that does exist publicly available.
One has to ask who prompted the demand for this change, and who exactly is on The Oil & Gas Division’s review committee. From the vantage point of most Ohioans concerned about this issue, this reporting change is going in the opposite direction of where a state with primacy over its Class II Wells should be going. When the US EPA has primacy over a state’s wells, as it does in Pennsylvania and Virginia, disposal volumes and pressures are reported annually, but the data are at least broken out monthly. (Note: More on Class II Well primacy and the language that allows states to maintain primacy will come in a future piece.)
As Buckeye Environmental Network Executive Director Teresa Mills and matriarch of the Ohio environmental watchdog community told me, “We have less and less and less information. While Pennsylvania’s website has its problems, it is 150% better than what citizens have access to in Ohio.”
Michigan’s Senate Bill 0431
Michigan’s Senate Bill 0431, introduced by Senate Democrat Adam Hollier in August 2019, was quickly reassigned to the Transportation and Infrastructure Committee in Lansing, after being originally introduced in the Natural Resources Committee. This is just the next step in taking away local control from communities. The language of the bill on Line ten states unapologetically that:
“A local unit of government shall not, by ordinance or otherwise, prevent, prohibit, or deny a permit, approval, or other authorization for the extraction, by mining, of natural resources from any property, by a person with property, possessory, or contractual rights to do so … if … The natural resources are valuable …[and] Very serious consequences would not result from the extraction of the natural resources … For purposes of this section, a consequence is very serious if it substantially exceeds the ordinary impacts of customary mining operations, and poses an actual and unnecessary risk to public health, safety, or welfare that cannot be avoided or ameliorated through the imposition of reasonable controls or conditions on the mining operations.”
If you ask residents of towns like Ludington and South Rockwood, Michigan, what it is like to live next to silica sand mines, they’ll tell you they have very little faith in the recently rebranded Michigan Department of Environment, Great Lakes, and Energy (DEGLE), formerly the Department of Environmental Quality (DEQ). This is the same DEQ that was responsible for the Flint water crisis, in which several of its employees plead no contest to misdemeanors related to their actions during the crisis.
When I called Senator Hollier’s office and asked what the motivation for this bill was, his staffer told me that in their eyes, if a mine proposal were to meet or exceed the rigorous requirements of DEGLE, then they felt it was important that no further hurdles be placed in the proposal’s way moving forward.
Another concern of Michiganders that I have spoken to about this bill, and silica sand mining in general, is this stipulation regarding bonding and reclamation:
“The amount of financial assurance shall be the product of $1,500.00 multiplied by the number of acres disturbed by mining operations, but not yet reclaimed, excluding roadways, plant sites, and open water areas that will remain after completion of reclamation … Reclaiming slopes of the banks of the excavation not exceeding one (1) foot vertical to three (3) feet horizontal, measured from the nearest setback line into any area disturbed by mining operations.”
Most folks believe: A) A bond of $1,500 is way too low, considering all the long-term damage from surface mining; B) The carving out for roadways, plant sites, and open water areas leaves a tremendous amount of any mine’s remaining footprint devoid of any chance of reclamation, and ensures potential environmental and human health hazards in perpetuity, and; C) The one foot rise over three feet run threshold leaves a vast amount of any mine’s footprint extremely unstable.
The general sentiment among Michigan nonprofit organizations is summed up by a note I received from Michigan Environmental Council (MEC) President & CEO Conan Smith, stating:
“I believe this bill is part of an intrigue that we’ve been monitoring as two very rich political donors fight over a proposed gravel mine [in] Metamora Township … one who owns the proposed mine, one who neighbors it and is opposed.
We are, as you might imagine, opposed to this bill. The exemption of local control and [the] presumption that an extractive operation is so necessary as to preempt other local concerns and priorities is in itself sufficiently egregious for us. However, this legislation would also leave the extractive industry almost entirely free of citing regulation, as there is no detailed process at the state level either.
The philosophical challenge we face here, as in many cases, is the tension between private property rights and public health, safety, and welfare. With this bill, the sponsors want a presumption that any activity on private land is reasonable, unless it results in a ‘very serious consequence,’ (a term which has basis in current law that this bill also erases). The new definition of seriousness would essentially be something that is not a normal part of the extractive action. Thus, for example, hundreds of trucks rolling down a dirt road might not be a very serious consequence because that’s just part of normal operations …”
In a sign of how quickly support for legislation shifts, and how elected officials will use crises like COVID-19 to push what Naomi Klein calls “Shock Doctrine,”[1] policy designed to facilitate a frictionless transition to “disaster capitalism,” MEC’s Policy Director Sean Hammond told us on May 21st of this year that, “Without the environmental community or local governments changing their positions, I see it very unlikely that this will move anywhere.” But just nine days later, MEC’s President and CEO emailed a group of those concerned about this bill, saying: “Bad news, friends. We learned yesterday that this bill has sudden new life and may be getting a hearing soon … We could certainly use help to dissuade lawmakers from taking this up.”
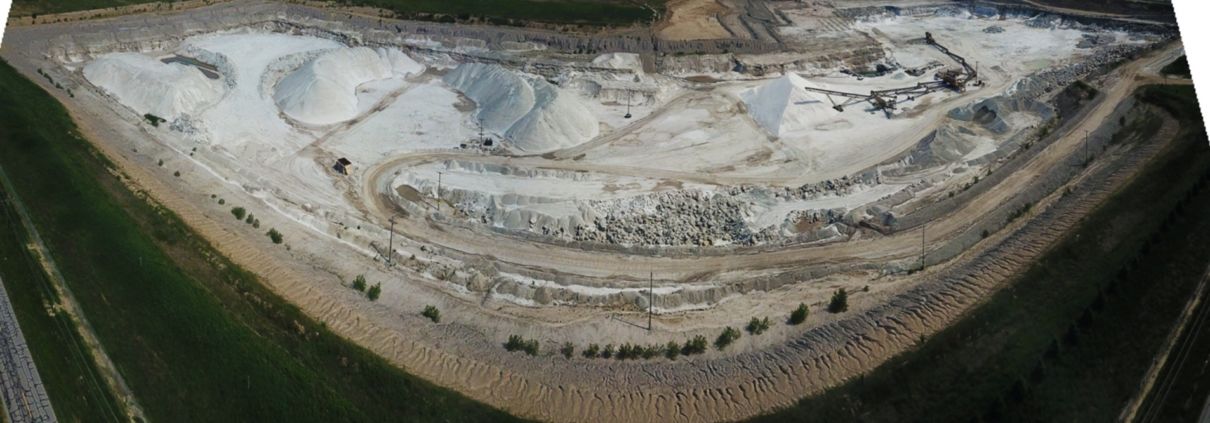
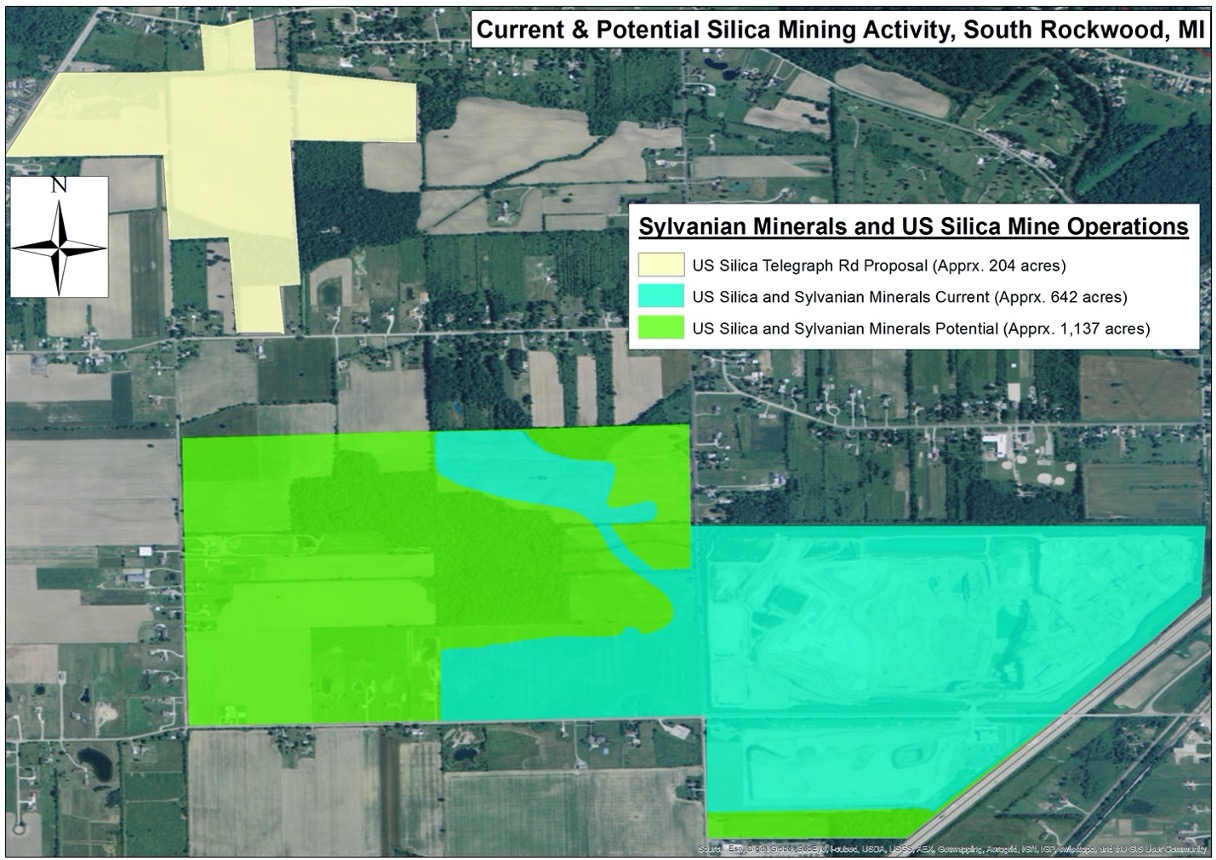
But much of the above has come from those at the policy level, living a healthy distance from Michigan’s mines. For the perspective of someone who actually lives next to a mine, I turned to a close friend and hero of mine, Doug Wood, and his wife Dawn, residents of South Rockwood in Monroe County, just a couple miles southwest of Detroit (Figures 3 and 4). Doug and Dawn sent me the following text regarding SB 0431:
“Ever since frac sand mining came to my community, the mine has expanded and accelerated, crushing silica 12 hours a day, right next to homes. It has been a constant battle to get the local government and the quarry to install air monitoring. Now the AGGREGATE industry is pushing to pass this law, Senate Bill 0431, which takes away all the local community’s controls, including [the control of] fugitive dust. I feel that if this law passes, it will be the end of a healthy, livable community.”
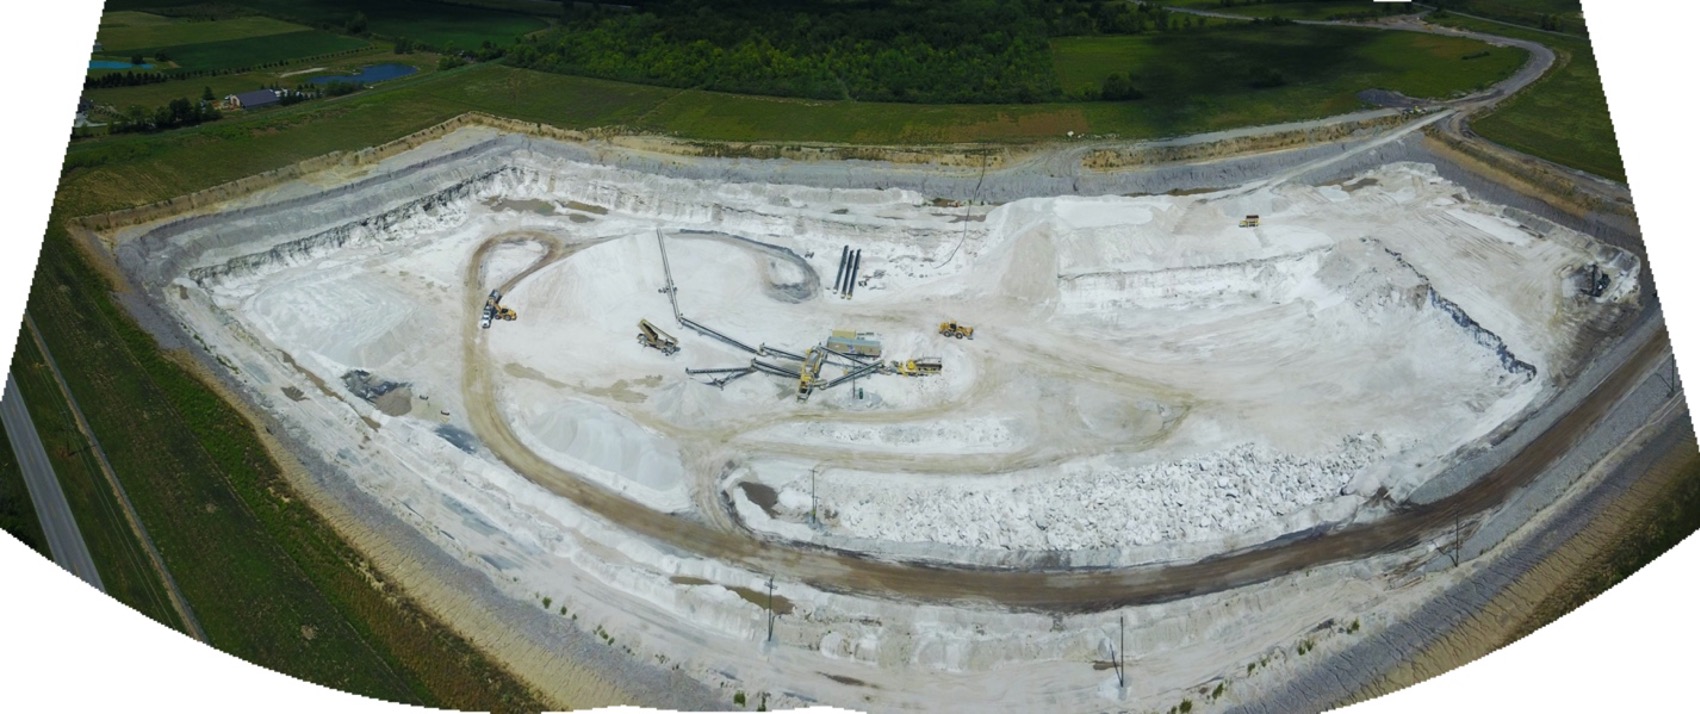
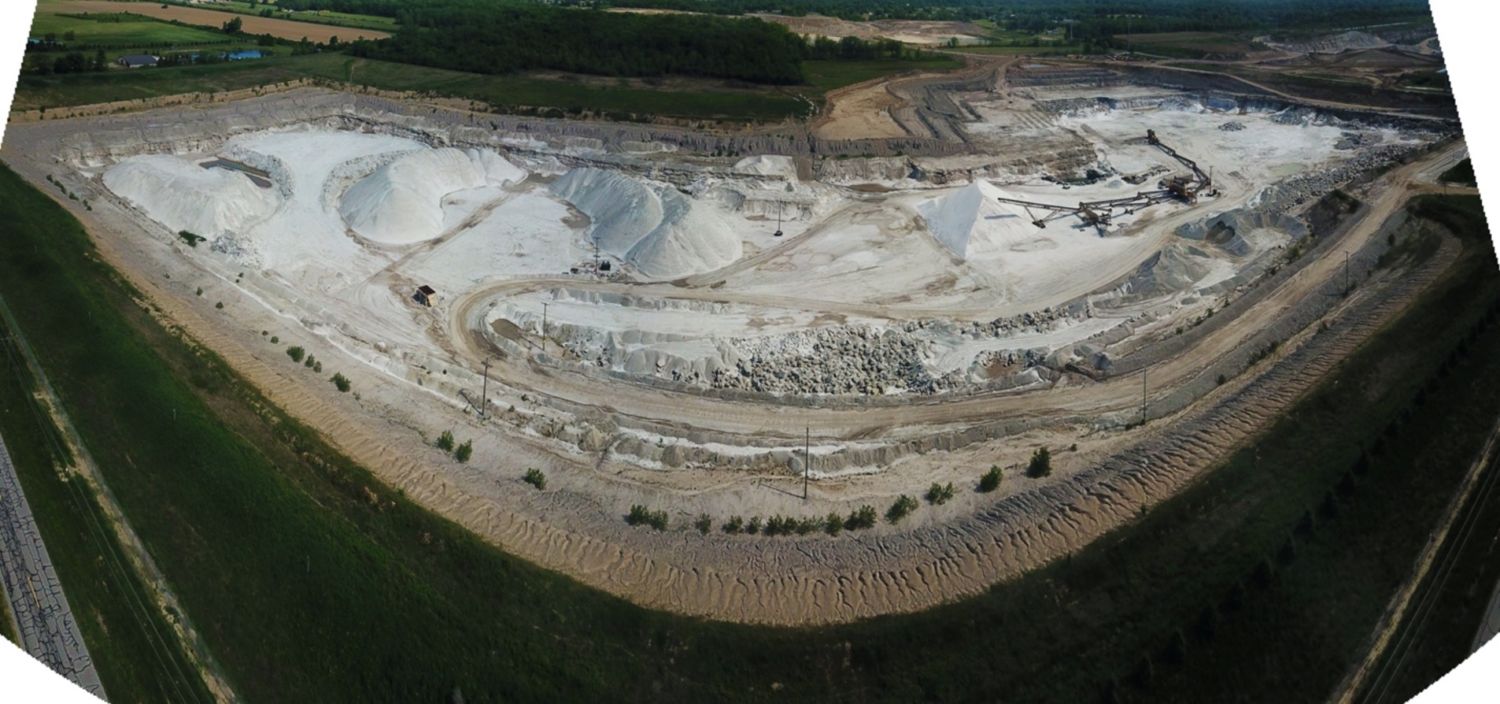
Figure 2. Current and Potential Silica Mining Activity, South Rockwood, Michigan, with Dawn and Doug Wood’s property in the southwest corner of the Light Green US Silica and Sylvanian Minerals Potential Polygon.
Figure 3. The Sylvanian Minerals/US Silica frac sand mine in South Rockwood, Michigan, in August 2017 (top) and June 2020 (bottom), with the Wood’s house to the left/west.
North Dakota’s Senate Bill 2344
North Dakota’s Senate Bill 2344 was first introduced to the Energy and Natural Resources Committee on January 21st of this year by Senators Jessica Unruh (R), Dwight Cook (R), and Donald Schaible (R). The North American oil and gas industry knows it has a massive waste issue that it can’t seem to get its collective head around, and in North Dakota, it has countered this structural uncertainty by claiming that landowners do not own the “subsurface pore space” beneath their property, and that this pore space entitles an operator to inject waste into such voids, without compensating landowners.
As Dakota Resource Council Executive Director Scott Skokos told me, “What I’ve heard from attorneys is that this is a taking. Prior to the law change, the porous ground beneath you was part of your property rights, but now it is the government’s … The reason is that it is a taking without compensation! At the legislative hearings, I’ve never seen so many ranchers and mineral owners at the legislature. They thought that because they are a privileged class they would be listened to, and they weren’t. When they got railroaded, they said, ‘What? The government doesn’t work for me?’” Many that are following this bill and associated legal efforts to challenge it think it has a good chance to make it all the way to the US Supreme Court, because it renders the state’s Oil and Gas Production Damage Compensation Act toothless.
Skokos went on to tell me that in “a prior world, where landowners actually had agency over their property in North Dakota, the state’s Century Code clearly stated in Section 38-11.1-04 that landowners were entitled to damages equivalent to ‘lost land value’ and/or ‘lost use of and access to the surface owner’s land.’”
In Mosser v. Denbury Resources, Inc.[2] in 2017, “Use of Pore Space,” and by association, SB 2344, began to percolate as a topic actually up for debate. The Mosser family did not contest the right of Denbury to dispose of fracking waste within their unitized area. This is only because they were hoping to get fair market value for waste disposal, if they would eventually have to incur the costs of damage to their property.
They alleged “claims for nuisance, for trespass and for damages under the Oil and Gas Production Damage Compensation Act.” Judge Charles Miller ruled in favor of the Mossers and stated clearly that surface owners did in fact own pore space; surface owners are entitled to the above damages resulting from pore space use; the surface owner does not have to demonstrate they are using the pore space; and most importantly, compensation per barrel that others are paying for fracking waste disposal may be used by landowners to determine damages.
This ruling was not to the industry’s liking, and they were determined to have the last word, so they worked with the aforementioned Republican Senators to write SB 2344, which contains tons of language regarding the use of pore space for natural gas and CO2 storage, as well as for Enhanced Oil Recovery (EOR) purposes. Senator Jessica Unruh, when not working on behalf of the good people of North Dakota’s District 33, is the Environmental Manager at Coyote Creek Mining Company. Also, it is important to note that Donald Schaible is the sole sponsor of HB 1426, mentioned earlier, that increased penalties for riot offenses.
The most jaw-dropping component of SB 2344 is that it would add a new definition to the state’s Century Code for the term “land,” to be defined as the solid material of earth – regardless of ingredients – but excluding pore space! Yes, those little voids in the rock beneath North Dakotans homes, or maybe up to and including cracks in the soil during dry summers, would not be classified as land, and ipso facto would not entitle landowners to damages if such voids were to be filled in with, say, radioactive fracking waste!
One can only hope that the “get off my land,” fiercely independent, and at times, Libertarian facade North Dakotans like to display will roar when this bill gets traction. I mean after all, isn’t the motto of Tea Party enthusiasts and Second Amendment zealots “Don’t Tread on Me?”
This is Part II of a two-part series on concerning legislation related to the oil, gas, and petrochemical industries. Part I focuses on repressive “critical infrastructure” bills intending to criminalize environmental protestors. Such legislation has already been passed in 11 states.
[1] Ms. Klein’s website describes the “Shock Doctrine” as the following: “It is a story about violence and shock perpetrated on people, on countries, on economies … [The Shock Doctrine] explodes the myth that the global free market triumphed democratically, and that unfettered capitalism goes hand-in-hand with democracy. Instead … it has consistently relied on violence and shock, and reveals the puppet strings behind the critical events of the last four decades.”
https://www.fractracker.org/a5ej20sjfwe/wp-content/uploads/2020/07/Sylvanian-MineralsUS-Silica-frac-sand-mine-in-South-Rockwood-Michigan-2.jpg7041500Ted Auch, PhDhttps://www.fractracker.org/a5ej20sjfwe/wp-content/uploads/2025/09/2025-Wordmark-Logo.pngTed Auch, PhD2020-07-09 09:13:242021-04-15 14:16:11Trends in Proposed State Legislation to Weaken Environmental Regulations
By Ted Auch, PhD, Great Lakes Program Coordinator and Shannon Smith, Manager of Communications & Development
The oil and gas industry continues to use rhetoric focusing on national security and energy independence in order to advocate for legislation to criminalize climate activists. Backlash against protestors and environmental stewards has only increased since the onset of COVID-19, suggesting that industry proponents are exploiting this public health crisis to further their own dangerous and controversial policies.[1]
Industry actors contributing to the wave of anti-protest bills include American Petroleum Institute (API), IHS Markit, The American Fuel & Petrochemical Manufacturers (AFPM), and most effectively, the American Legislative Exchange Council (ALEC), by way of its primary financial backer, Koch Industries (Fang, 2014, Shelor, 2017).
ALEC is the source of the model legislation “Critical Infrastructure Protection Act” of 2017, intended to make it a felony to “impede,” “inhibit,” “impair,” or “interrupt” critical infrastructure operation and/or construction. Close approximations – if not exact replicas – of this legislative template have been passed in 11 hydrocarbon rich and/or pathway states, and 8 more are being debated in 4 additional states.
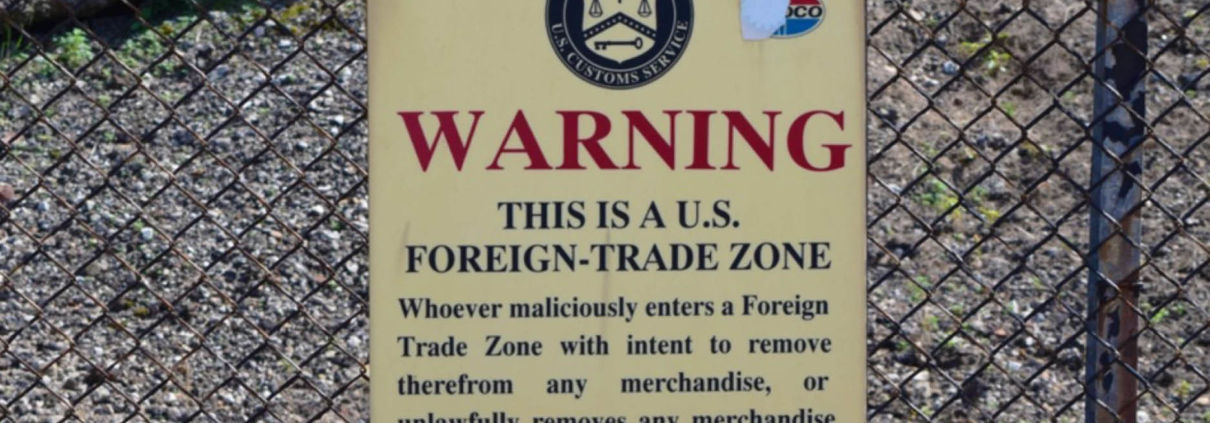
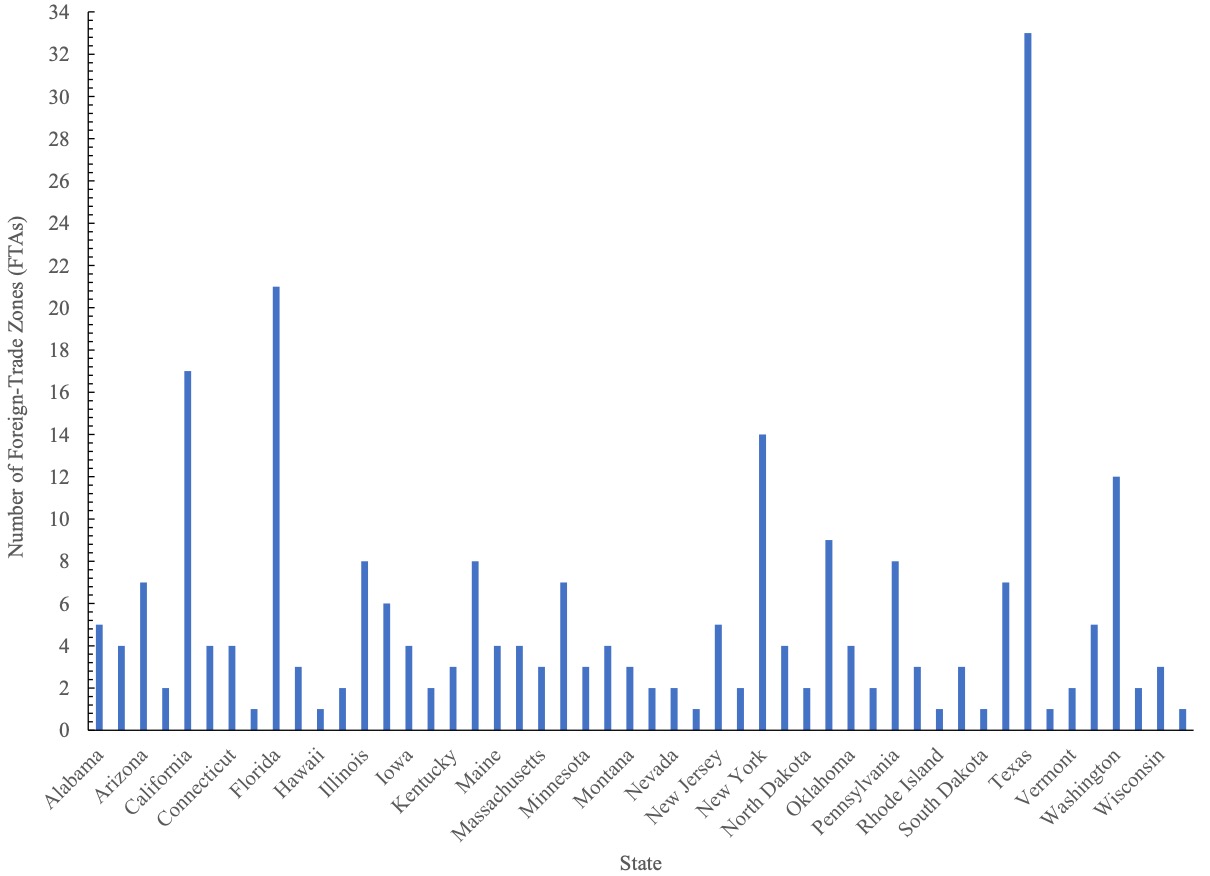
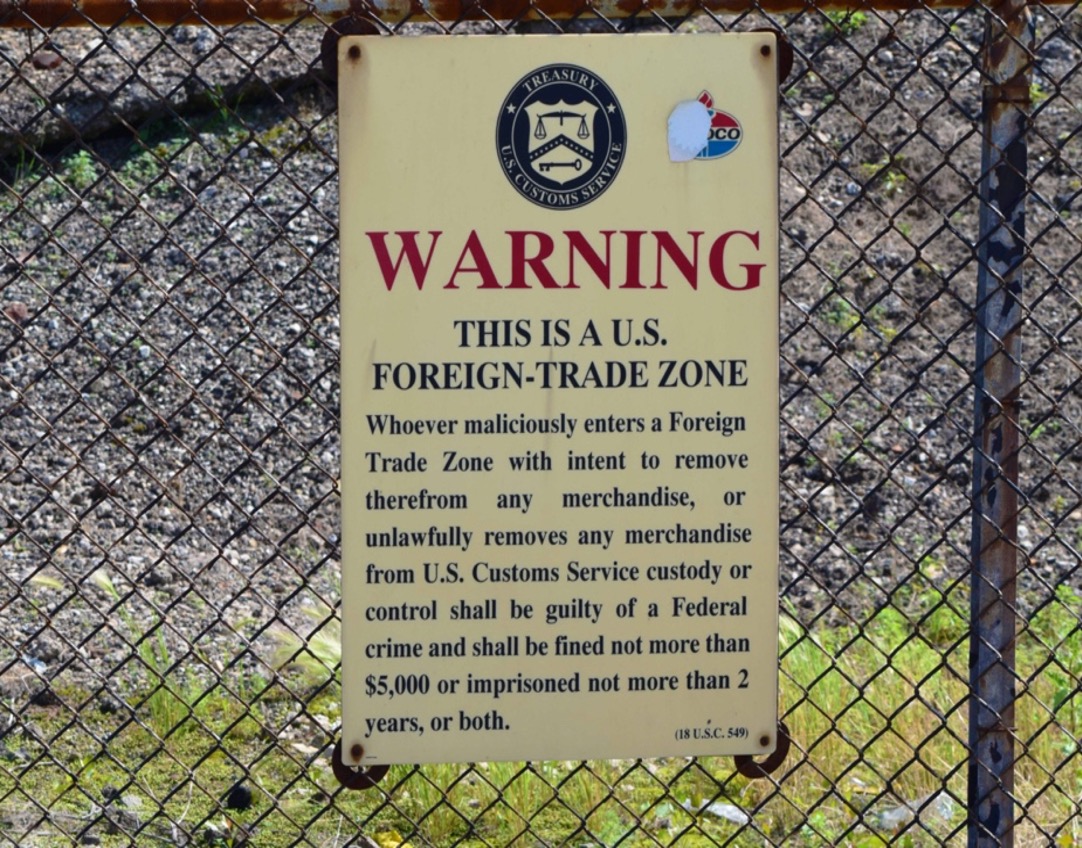
The “critical infrastructure” designation in ALEC’s “Critical Infrastructure Protection Act” is extremely broad, including over 70 pieces of infrastructure, from wastewater treatment and well pads, to ports and pipelines. However, along with the 259 Foreign Trade Zones (FTZ) (Figures 1 and 4) supervised by US Customs and Border Protection (CBP), security is of such importance because over 50% of this infrastructure is related to oil and gas. According to our analysis, there are more than 8,000 unique pieces of infrastructure that fall under this designation, with over 10% in the Marcellus/Utica states of Ohio, West Virginia, and Pennsylvania. See Figure 1 for the number of FTZ per state.
Regarding FTZ, the US Department of Homeland Security doesn’t attempt to hide their genuine nature, boldly proclaiming them “… the United States’ version of what are known internationally as free-trade zones … to serve adequately ‘the public interest’.” If there remains any confusion as to who these zones are geared toward, the US Department of Commerce’s International Administration (ITA) makes the link between FTZ and the fossil fuel industry explicit in its FTZ FAQ page, stating “The largest industry currently using zone procedures is the petroleum refining industry.” (Figure 2)
Figure 1. Number of Foreign-Trade Zones (FTZ) by state as of June 2020.
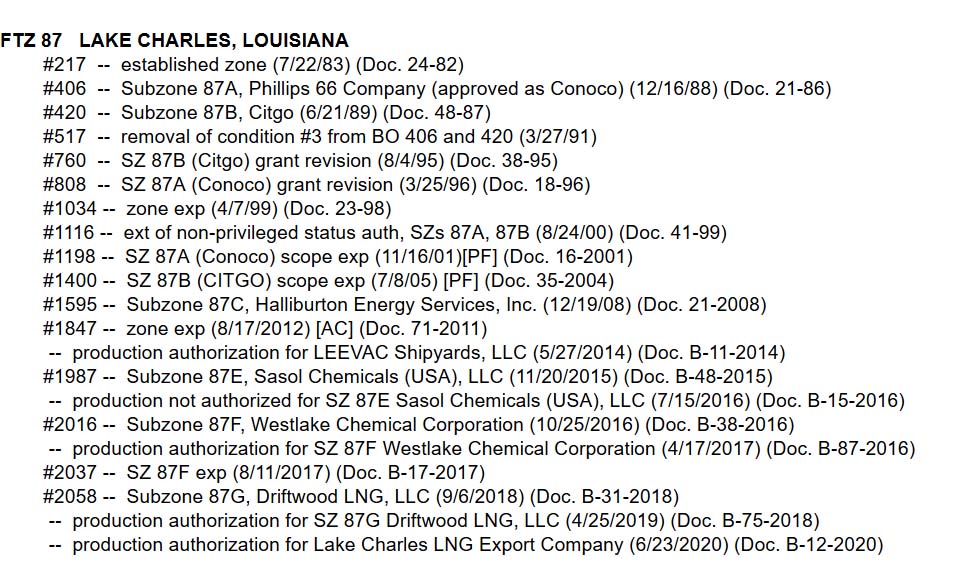
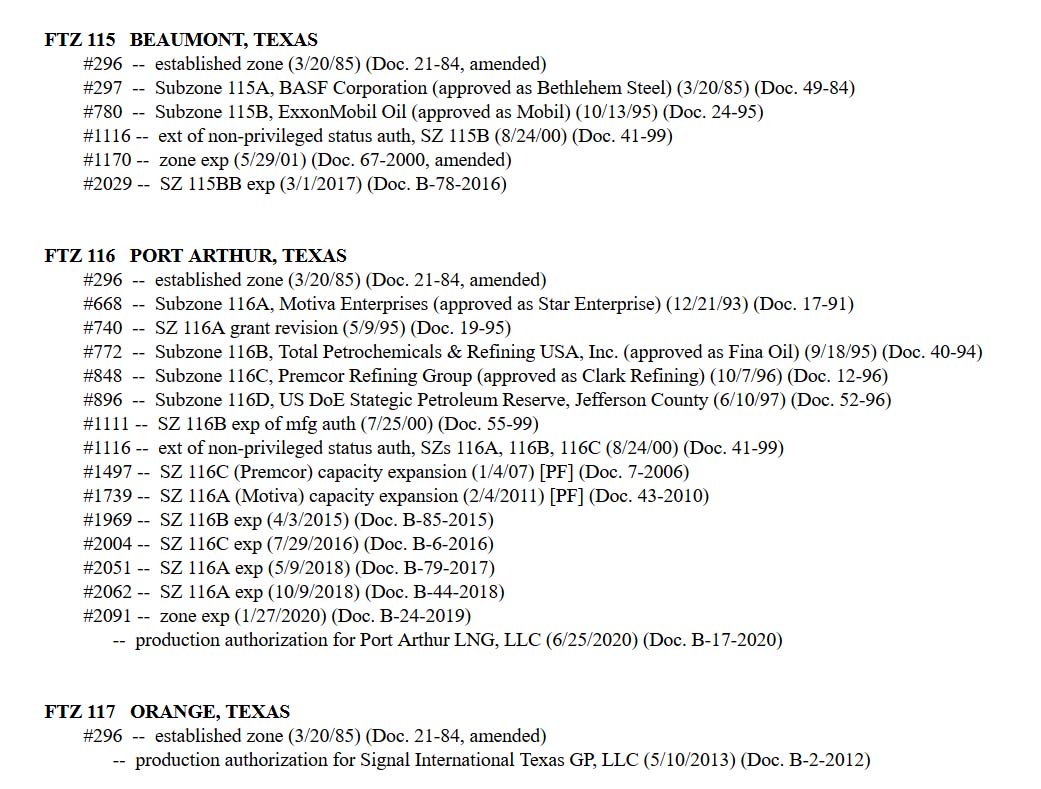
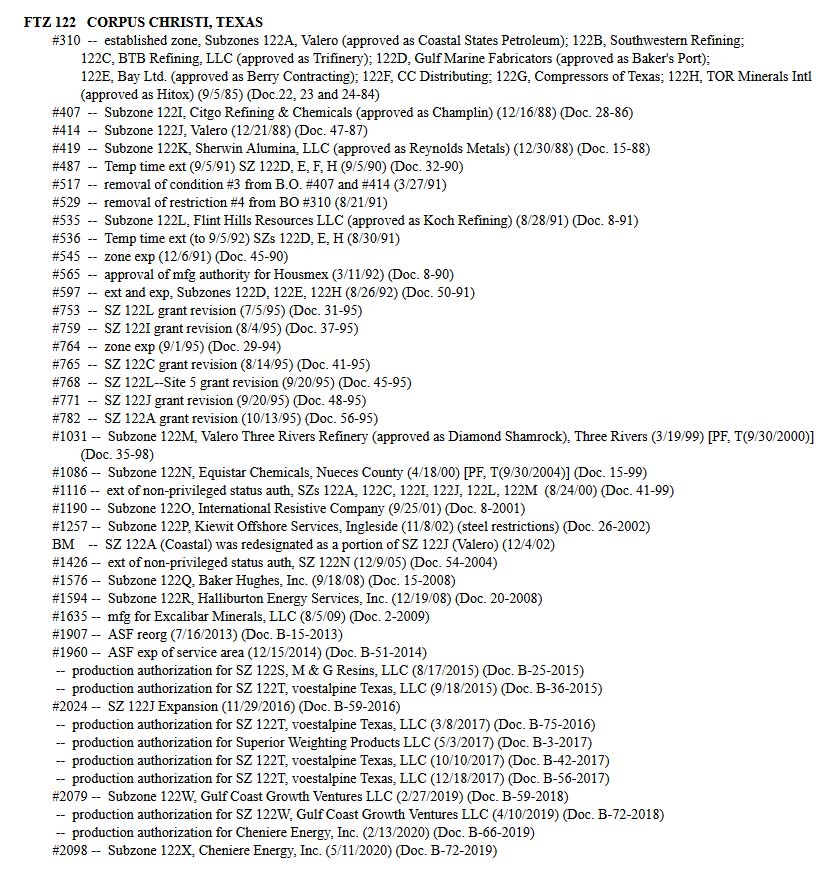
Figure 2. Foreign-Trade Zone (FTZ) Board of Actions in Zones 87 in Lake Charles, LA, 115-117 in and around Port Arthur, TX, and 122 in Corpus Christi, TX. (click on the images to enlarge)
Foreign-Trade Zone (FTZ) Board of Actions in Zone 87 in Lake Charles, Louisiana
Foreign-Trade Zone (FTZ) Board of Actions in Zones 115-117 in and around Port Arthur, Texas
Foreign-Trade Zone (FTZ) Board of Actions in Zone 122 in Corpus Christi, Texas
Much of the oil, gas, and petrochemical industries’ efforts stem from the mass resistance to the Dakota Access Pipeline (DAPL). Native American tribes and environmental groups spent months protesting the environmentally risky $3.78 billion dollar project, which began production in June 2017, after Donald Trump signed an executive order to expedite construction during his first week in office. The Standing Rock Sioux tribe also sued the US government in a campaign effort to protect their tribal lands. The world watched as Energy Transfer Partners (ETP), the company building the pipeline, destroyed Native artifacts and sacred sites, and as police deployed tear gas and sprayed protesters with water in temperatures below freezing.
ETP’s bottom line and reputation were damaged during the fight against DAPL. Besides increasingly militarized law enforcement, the oil and gas industry has retaliated by criminalizing similar types of protests against fossil fuel infrastructure. However, the tireless work of Native Americans and environmental advocates has resulted in a recent victory in March 2020, when a federal judge ordered a halt to the pipeline’s production and an extensive new environmental review of DAPL.
Just days ago, on July 6, 2020, a federal judge ruled that DAPL must shut down until further environmental review can assess potential hazards to the landscape and water quality of the Tribe’s water source. This is certainly a victory for the Standing Rock Sioux Tribe and other environmental defenders, but the decision is subject to appeal.
Since the DAPL conflict began, the industry has been hastily coordinating state-level legislation in anticipation of resistance to other notable national gas transmission pipelines, more locally concerning projects like Class II Oil and Gas Waste Injection Wells, and miles of gas gathering pipelines that transport increasing streams of waste – as well as oil and gas – to coastal processing sites.
The following “critical infrastructure” bills have already been enacted:
STATE
BILL
TITLE
DATE PASSED
West Virginia
HB 4615
NEW PENALTIES FOR PROTESTS NEAR GAS AND OIL PIPELINES
3/25/20
South Dakota
SB 151
NEW PENALTIES FOR PROTESTS NEAR PIPELINES AND OTHER INFRASTRUCTURE
3/18/20
Kentucky
HB 44
NEW PENALTIES FOR PROTESTS NEAR PIPELINES AND OTHER INFRASTRUCTURE
3/16/20
Wisconsin
AB 426
NEW PENALTIES FOR PROTESTS NEAR GAS AND OIL PIPELINES
11/21/19
Missouri
HB 355
NEW PENALTIES FOR PROTESTS NEAR GAS AND OIL PIPELINES
7/11/19
Texas
HB 3557
NEW CRIMINAL AND CIVIL PENALTIES FOR PROTESTS AROUND CRITICAL INFRASTRUCTURE
6/14/19
Tennessee
SB 264
NEW PENALTIES FOR PROTESTS NEAR GAS AND OIL PIPELINES
5/10/19
Indiana
SB 471
NEW PENALTIES FOR PROTESTS NEAR CRITICAL INFRASTRUCTURE
5/6/19
North Dakota
HB 2044
HEIGHTENED PENALTIES FOR PROTESTS NEAR CRITICAL INFRASTRUCTURE
4/10/19
Louisiana
HB 727
HEIGHTENED PENALTIES FOR PROTESTING NEAR A PIPELINE
5/30/18
Oklahoma
HB 1123
NEW PENALTIES FOR PROTESTS NEAR CRITICAL INFRASTRUCTURE
5/3/17
There are an additional eight bills proposed and under consideration in these six states:
STATE
PENDING
TITLE
DATE PROPOSED
Louisiana
HB 197
NEW PENALTIES FOR PROTESTS NEAR CRITICAL INFRASTRUCTURE
2/24/20
Minnesota
HF 3668
NEW PENALTIES FOR PROTESTS NEAR GAS AND OIL PIPELINES
2/24/20
Mississippi
HB 1243
NEW PENALTIES FOR PROTESTS NEAR CRITICAL INFRASTRUCTURE
2/19/20
Alabama
SB 45
NEW PENALTIES FOR PROTESTS NEAR GAS AND OIL PIPELINES
2/4/20
Minnesota
HF 2966
NEW PENALTIES FOR PROTESTS NEAR OIL AND GAS PIPELINES
1/31/20
Minnesota
SF 2011
NEW PENALTIES FOR PROTESTS NEAR GAS AND OIL PIPELINES
3/4/19
Ohio
SB 33
NEW PENALTIES FOR PROTESTS NEAR CRITICAL INFRASTRUCTURE
2/12/19
Illinois
HB 1633
NEW PENALTIES FOR PROTESTS NEAR CRITICAL INFRASTRUCTURE
1/31/19
Desperate Backlash Against Peaceful Protest
Activists and organizations like the American Civil Liberties Union (ACLU) are framing their opposition to such legislation as an attempt to stave off the worst Orwellian instincts of our elected officials, whether they are in Columbus or Mar-a-Lago. On the other hand, industry and prosecutors are framing these protests as terroristic acts that threaten national security, which is why sentencing comes with a felony conviction and up to ten years in prison. The view of the FBI’s deputy assistant director and top official in charge of domestic terrorism John Lewis is that, “In recent years, the Animal Liberation Front and the Earth Liberation Front have become the most active, criminal extremist elements in the United States … the FBI’s investigation of animal rights extremists and ecoterrorism matters is our highest domestic terrorism investigative priority.”
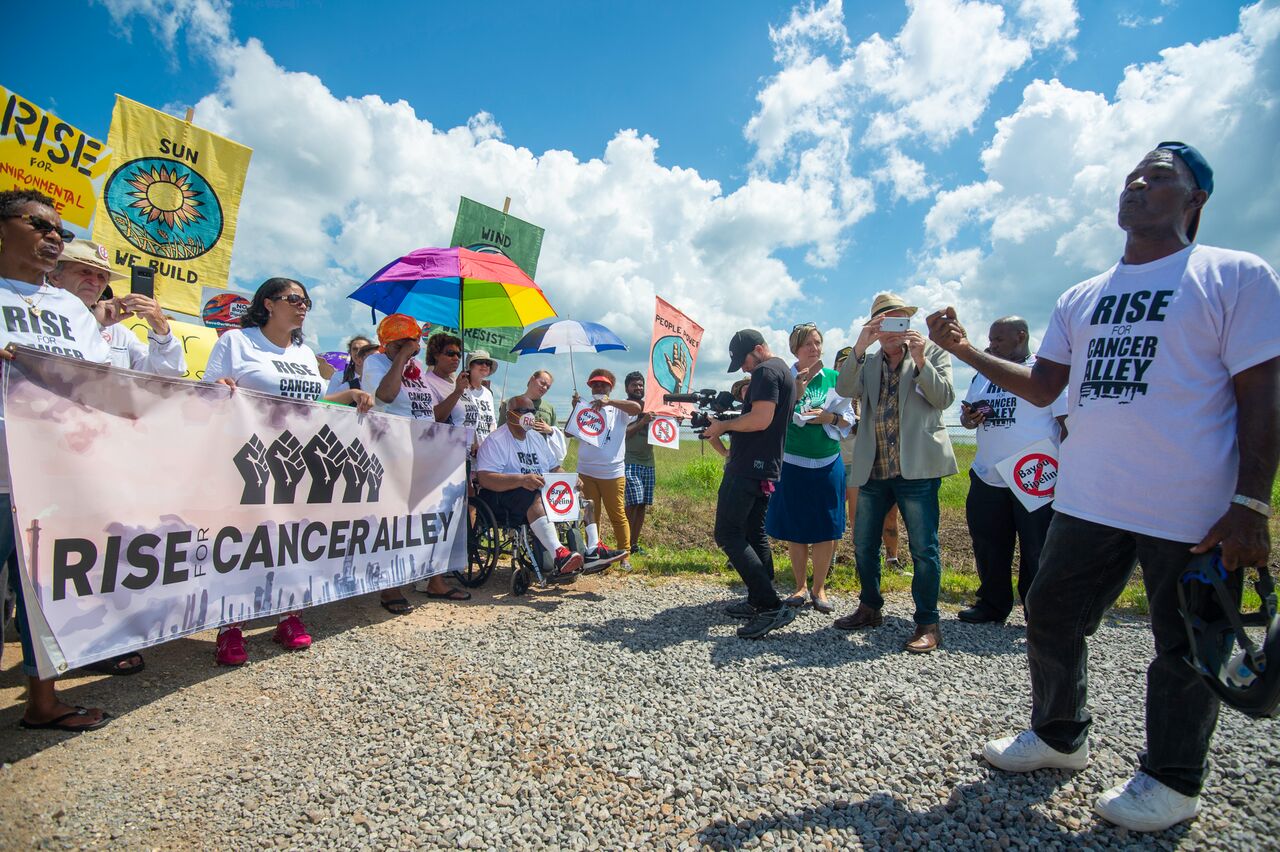
It shocked many when last week, two protesters in the petrochemical-laden “Cancer Alley” region of Louisiana were arrested and charged under the state’s felony “terrorist” law. Their crime? Placing boxes of nurdles – plastic pellets that are the building blocks of many single-use plastic products – on the doorsteps of fossil fuel lobbyists’ homes. To make matters more ridiculous, the nurdles were illegally dumped by the petrochemical company Formosa Plastics.[2] This is outrageous indeed, but is the sort of legally-sanctioned oppression that fossil fuel industry lobbyists have been successfully advocating for years.
American Fuel & Petrochemical Manufacturers (AFPM) stated in a letter of support for ALEC’s legislative efforts:
“In recent years, there has been a growing and disturbing trend of individuals and organizations attempting to disrupt the operation of critical infrastructure in the energy, manufacturing, telecommunications, and transportation industries. Energy infrastructure is often targeted by environmental activists to raise awareness of climate change and other perceived environmental challenges. These activities, however, expose individuals, communities, and the environment to unacceptable levels of risk, and can cause millions of dollars in damage … As the private sector continues to expand and maintain the infrastructure necessary to safely and reliably deliver energy and other services to hundreds of millions of Americans, policymakers should continue to consider how they can help discourage acts of sabotage … Finally, it will also hold organizations both criminally and vicariously liable for conspiring with individuals who willfully trespass or damage critical infrastructure sites.”
Those organizations deemed ‘criminally and vicariously liable’ would in some states face fines an order of magnitude greater than the actual individual, which would cripple margin-thin environmental groups around the country, and could amount to $100,000 to $1,000,000. The AFPM’s senior vice president for federal and regulatory affairs Derrick Morgan referred to these vicarious organizations as “inspiring … organizations who have ill intent, want to encourage folks to damage property and endanger lives …”
One of the most disturbing aspects of this legislation is that it could, according to the testimony and additional concerns of ACLU of Ohio’s Chief Lobbyist Gary Daniels, equate “‘impeding’ and ‘inhibiting’ the ‘operations’ of a critical infrastructure site” with acts as innocuous as Letters to the Editor, labor strikes or protests, attending and submitting testimony at hearings, or simply voicing your concern or objections to the validity of industry claims and its proposals with emails, faxes, phone calls, or a peaceful protest outside critical infrastructure that raises the concern of site security. Mr. Daniels noted in his additional written testimony that the latter, “may prove inconvenient to the site’s staff, under SB 250 they would be an F3 [Third Degree Felony], and that is without someone even stepping foot on or near the property, as physical presence is not required to be guilty of criminal mischief, as found in/defined in Sec. 2907.07(A)(7) of the bill.”
Figure 3. A rally held by the Louisiana-based nonprofit RISE St. James.
This connection, when enshrined into law, will have a chilling effect on freedom of speech and assembly, and will stop protests or thoughtful lines of questioning before they even start. As the Ohio Valley Environmental Coalition (OVEC) put it in their request for residents to ask the governor to veto the now-enacted HB 4615, such a bill is unnecessary, duplicative, deceitful, un-American, unconstitutional, and “will further crowd our jails and prisons.”
To combat such industry-friendly legislation that erodes local government control in Ohio, lawmakers like State Senator Nikki Antonio are introducing resolutions like SR 221, which would, “abolish corporate personhood and money-as-speech doctrine” made law by the Supreme Court of the United States’ rulings in Citizens United v. FEC and Buckley v. Valeo. After all, the overarching impact of ALEC’s efforts and those described below furthers privatized, short-term profit and socialized, long-term costs, and amplifies the incredibly corrosive Citizen’s United decision a little over a decade ago.
Further Criminalization of Protest, Protections for Law Enforcement
Simultaneously, there is an effort to criminalize protest activities through “riot boosting acts,” increased civil liability and decreased police liability, trespassing penalties, and new sanctions for protestors who conceal their identities (by wearing a face mask, for example).
The following bills have already been enacted:
STATE
BILL
TITLE
DATE PASSED
South Dakota
SB 189
EXPANDED CIVIL LIABILITY FOR PROTESTERS AND PROTEST FUNDERS
3/27/19
West Virginia
HB 4618
ELIMINATING POLICE LIABILITY FOR DEATHS WHILE DISPERSING RIOTS AND UNLAWFUL ASSEMBLIES
3/10/18
North Dakota
HB 1426
HEIGHTENED PENALTIES FOR RIOT OFFENCES
2/23/17
North Dakota
HB 1293
EXPANDED SCOPE OF CRIMINAL TRESPASS
2/23/17
North Dakota
HB 1304
NEW PENALTIES FOR PROTESTERS WHO CONCEAL THEIR IDENTITY
2/23/17
In addition, the following bills have been proposed and are under consideration:
STATE
PENDING
TITLE
DATE PROPOSED
Rhode Island
H 7543
NEW PENALTIES FOR PROTESTERS WHO CONCEAL THEIR IDENTITY
2/12/20
Oregon
HB 4126
HARSH PENALTIES FOR PROTESTERS WHO CONCEAL THEIR IDENTITY
1/28/20
Tennessee
SB 1750
NEW PENALTIES FOR PROTESTERS WHO CONCEAL THEIR IDENTITY
1/21/20
Ohio
HB 362
NEW PENALTIES FOR PROTESTERS WHO CONCEAL THEIR IDENTITY
10/8/19
Pennsylvania
SB 887
NEW PENALTIES FOR PROTESTS NEAR “CRITICAL INFRASTRUCTURE”
10/7/19
Massachusetts
HB 1588
PROHIBITION ON MASKED DEMONSTRATIONS
1/17/19
All the while, the Bundy clan of Utah pillage – and at times – hold our public lands hostage, and white male Michiganders enter the state capital in Lansing armed for Armageddon, because they feel that COVID-19 is a hoax. We imagine that it isn’t these types of folks that West Virginia State Representatives John Shott and Roger Hanshaw had in mind when they wrote and eventually successfully passed HB 4618, which eliminated police liability for deaths while dispersing riots and unlawful assemblies.
Contrarily, South Dakota’s SB 189, or “Riot Boosting Act,” was blocked by the likes of US District Judge Lawrence L. Piersol, who wrote:
“Imagine that if these riot boosting statutes were applied to the protests that took place in Birmingham, Alabama, what might be the result? … Dr. King and the Southern Christian Leadership Conference could have been liable under an identical riot boosting law.”
FracTracker collaborated with Crude Accountability on a report documenting increasing reprisals against environmental activists in the US and Eurasia. Read the Report.
Figure 4. Photo of US Treasury Department signage outlining the warning associated with BP’s Whiting, IN, oil refinery designated a Foreign Trade Zone (FTZ). Photo by Ted Auch July 15th, 2015
In all fairness to Mr. Emanuel, he was referring to the Obama administration’s support for the post-2008 bipartisan Wall Street bailout. However, it is critical that we acknowledge the push for critical infrastructure legislation has been most assuredly bipartisan, with Democratic Governors in Kentucky, Louisiana, and Wisconsin signing into law their versions on March 16th of this year, in May of 2018, and in November of 2019, respectively.
Related Legislation in Need of Immediate Attention
In Columbus, Ohio, there are several pieces of legislation being pushed in concert with ALEC-led efforts. These include the recently submitted HB 362, that would “create the crime of masked intimidation.” Phil Plummer and George F. Lang sponsor the bill, with the latter being the same official who introduced HB 625, a decidedly anti-local control bill that would preempt communities from banning plastic bags. Most of the general public and some of the country’s largest supermarket chains have identified plastic bag bans as a logical next step as they wrestle with their role in the now universally understood crimes plastics have foisted on our oceans and shores. As Cleveland Scene’s Sam Allard wrote, “bill mills” and their willing collaborators in states like Ohio cause such geographies to march “boldly, with sigils flying in the opposite direction” of progress, and a more renewable and diversified energy future.
With respect to Plummer and Lang’s HB 362, two things must be pointed out:
1) It is eerily similar to North Dakota’s HB 1304 that created new penalties for protestors who conceal their identity, and
So, when elected officials as far away as Columbus copy and paste legislation passed in the aftermath of the DAPL resistance efforts, it is clear the message they are conveying, and the audience(s) they are trying to intimidate.
Plummer and Lang’s HB 362 would add a section to the state’s “Offenses Against the Public Peace,” Chapter 2917, that would in part read:
No person shall wear a mask or disguise in order to purposely do any of the following:
(A) Obstruct the execution of the law;
(B) Intimidate, hinder, or interrupt a person in the performance of the person’s legal duty; or
(C) Prevent a person from exercising the rights granted to them by the Constitution or the laws of this state.
Whoever violates this proposed section is guilty of masked intimidation. Masked intimidation is a first degree misdemeanor. It was critical for the DAPL protestors to protect their faces during tear gas and pepper spray barrages, from county sheriffs and private security contractors alike.
At the present moment, masks are one of the few things standing between COVID-19 and even more death. Given these realities, it is stunning that our elected officials have the time and/or interest in pushing bills such as HB 362 under the thin veil of law and order.
But judging by what one West Virginia resident and former oil and gas industry draftsman,[3] wrote to us recently, elected officials do not really have much to lose, given how little most people think of them:
“Honestly, it doesn’t seem to matter what we do. The only success most of us have had is in possibly slowing the process down and adding to the cost that the companies incur. But then again, the increase in costs probably just gets passed down to the consumers. One of the biggest drawbacks in my County is that most, if not all, of the elected officials are pro drilling. Many of them have profited from it.”
The oil, gas, and petrochemical industries are revealing their weakness by scrambling to pass repressive legislation to counteract activists. But social movements around the world are determined to address interrelated social and environmental issues before climate chaos renders our planet unlivable, particularly for those at the bottom of the socioeconomic ladder. We hope that by shining a light on these bills, more people will become outraged enough to join the fight against antidemocratic legislation.
This is Part I of a two-part series on concerning legislation related to the oil, gas, and petrochemical industries. Part II focuses on bills that would weaken environmental regulations in Ohio, Michigan, and South Dakota.
By Ted Auch, PhD, Great Lakes Program Coordinator and Shannon Smith, Manager of Communications & Development
[1] See Naomi Klein’s concept of the Shock Doctrine for similar trends.
[2] The community-based environmental organization RISE St. James has been working tirelessly to prevent Formosa Plastics from building one of the largest petrochemical complexes in the US in their Parish. Sharon Lavigne is a leading member of RISE St. James, and is an honored recipient of the 2019 Community Sentinel Award for Environmental Stewardship. Read more on Sharon’s work with RISE St. James here.
[3] This individual lives in Central West Virginia, and formerly monitored Oil & Gas company assets in primarily WV, PA, NY, VA, MD & OH, as well as the Gulf Coast. Towards the end of this individual’s career, they provided mapping support for the smart pigging program, call before you dig, and the pipeline integrity program.
We updated the FracTracker North Dakota Shale Viewer with current data and additional details on the astronomical levels of water used and waste produced throughout the process of fracking for oil and gas in North Dakota.
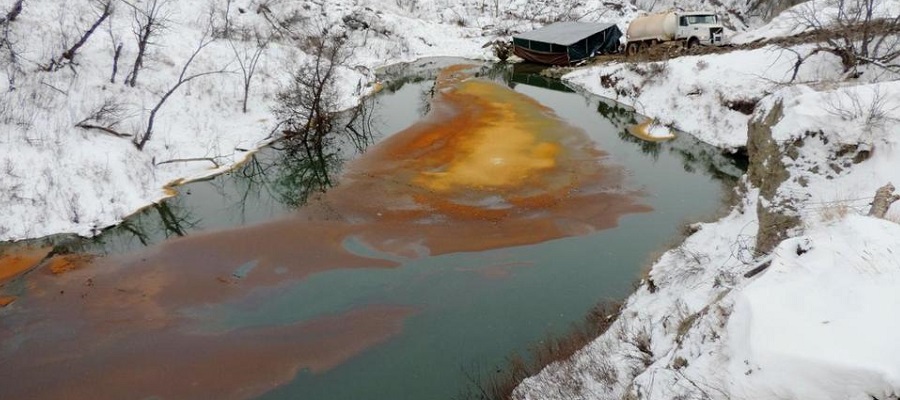
As folks who visit the FracTracker website may know, the fracking industry is predicated on cheap sources of water and waste disposal. The water they use to bust open shale seams becomes part of the waste stream that they refer to by the benign term “brine,” equating it to nothing more than the salt water we swim in when we hit the beaches.
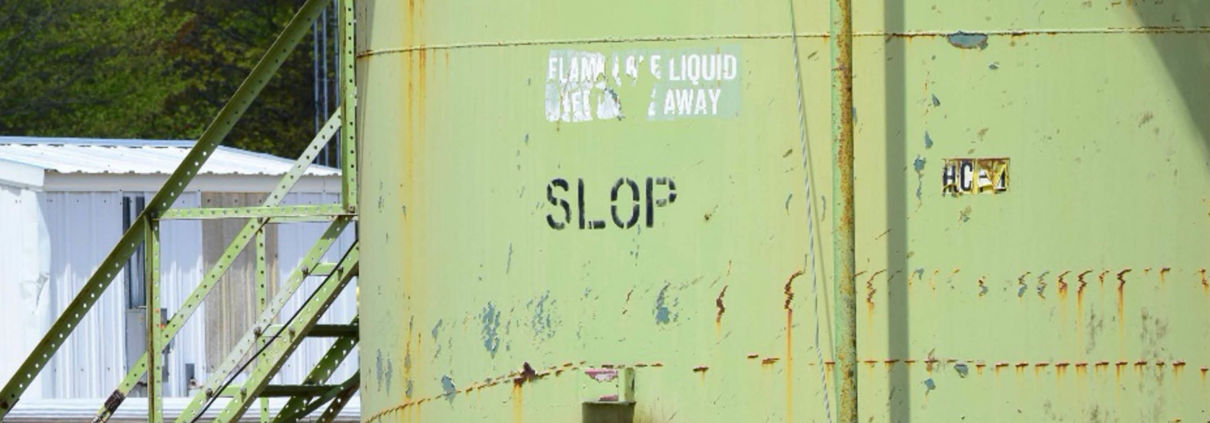
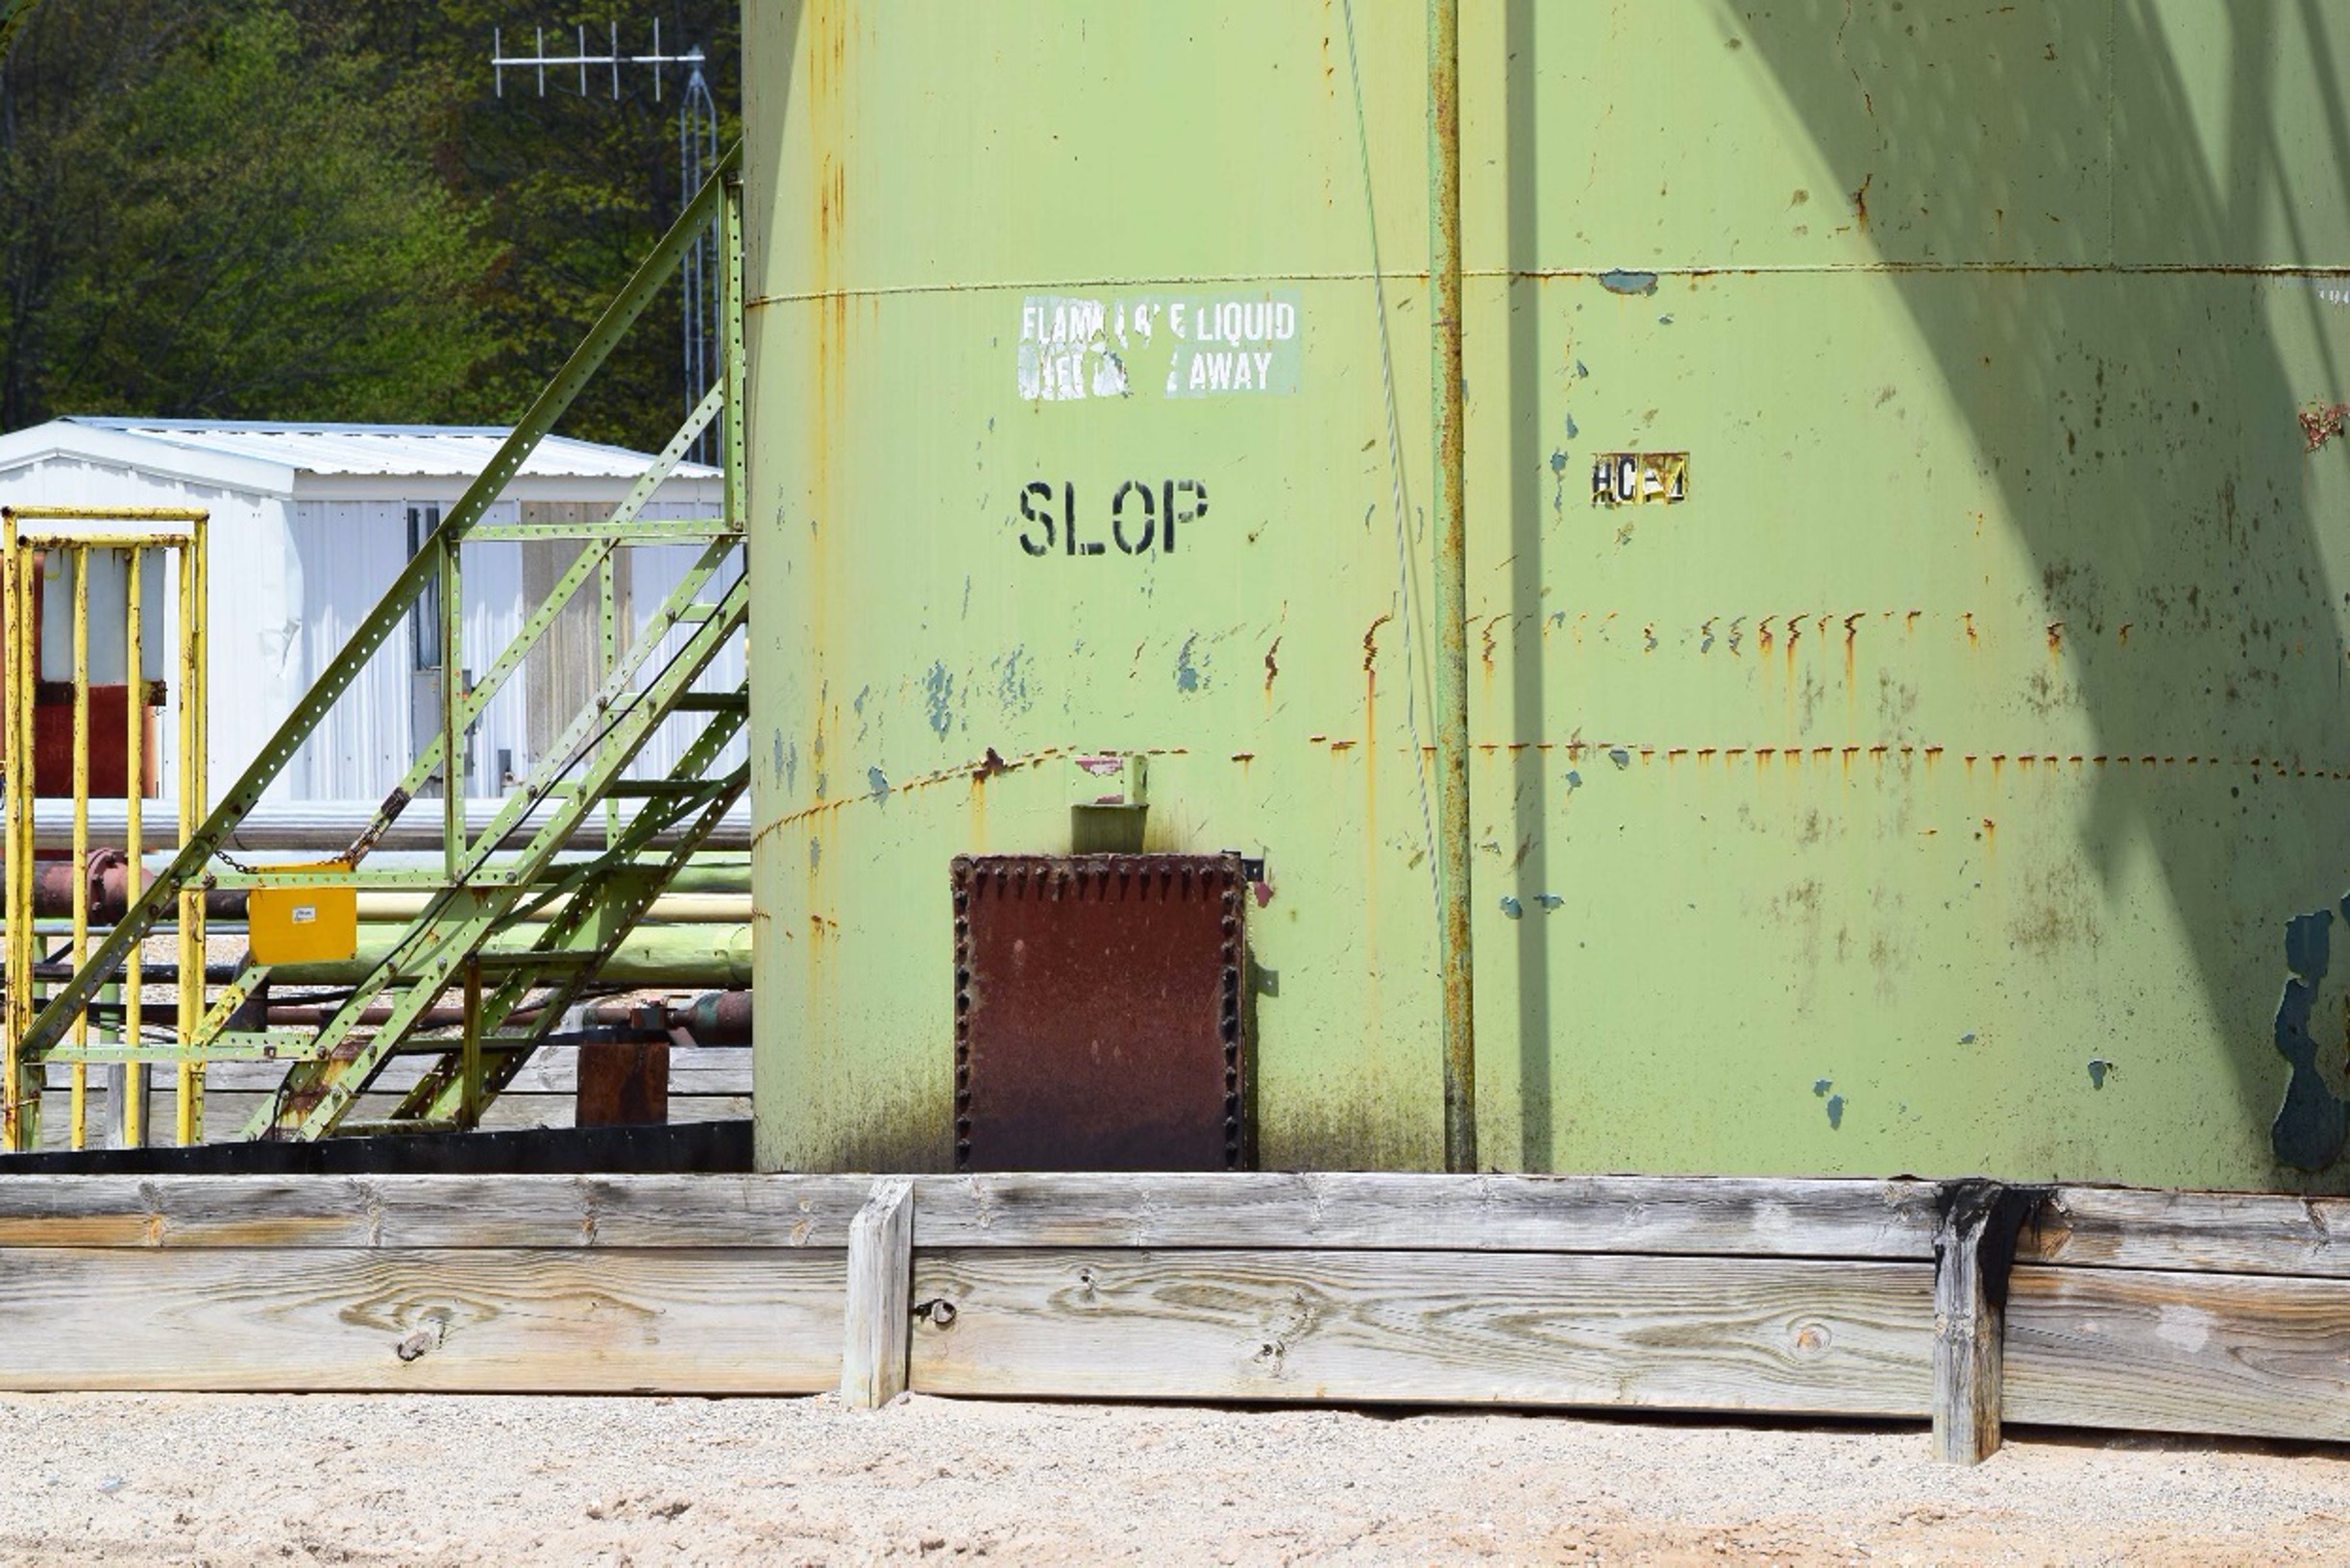
Some oil and gas operators like SWEPI and Enervest in Michigan, however, have taken to calling their waste “SLOP” (Figure 1), which from my standpoint is actually refreshingly honest.
Fracking Energy Return on Investment 2012 – 2020
Since we created our North Dakota Shale Viewer on October 5th, 2012, much has changed across the fracking landscape, while other songs have remained the same. Both of these truths exist with respect to fracking’s impact on water and the industry’s inability to get its collective head around the billions of barrels of oftentimes radioactive waste it produces by its very nature. From the outset, fracking was on dubious footing when it came to the water and waste associated with its operations, and we have seen a nearly universal and exponential increase in water demand and waste production on a per well basis since fracking became the highly divisive topic it remains to this day.
Figure 1. Oil & Gas waste tank operated by SWEPI and Enervest at the Hayes pad, Otsego County, Michigan May 21st, 2016 (44.892933, -84.786530). Photo by Ted Auch, FracTracker Alliance.
Environmental economists like to look at energy sources from a more holistic standpoint vis a vis engineers, traditional economists, and the divide-and-conquer rhetoric from Bismarck to the White House. They do this by placing all manner of energy sources along a spectrum of Energy Return On Energy Invested (EROEI).
It stands to reason that if natural gas from fracking were a real “bridge fuel” in the transition away from coal, it would at least approach or exceed the EROEI of the latter, but at 46:1 coal is still four times more efficient than natural gas. However, it must be said that coal’s days are numbered as well. Witness the recent bankruptcy of coal giant Murray Energy, and the only reason its EROEI has increased or remained steady is because the mining industry has transitioned to almost exclusively mountaintop removal and/or strip mining and the associated efficiencies resulting from mechanization/automation.
The North Dakota Shale Viewer
We enhanced our North Dakota Shale Viewer nearly eight years since it debuted. This exercise included the addition of several data layers that speak to the above issues and how they have changed since we first launched the North Dakota Shale Viewer.
It is worth noting that oil production in total across North Dakota has not even doubled since 2012, and gas production has only managed to increase 3.5-fold. However, the numbers look even worse when you look at these totals on a per well basis, which as I have mentioned seems to me to be the only way reasonable people should be looking at production. Using this lens, we see that production of oil in North Dakota on a per well basis oil is 1% less than it was in 2012 and gas production has not even doubled per well. This is a stunning contrast to the upticks in water and waste we have documented and are now including in our North Dakota Shale Viewer.
Water Demand Rises for Fracking
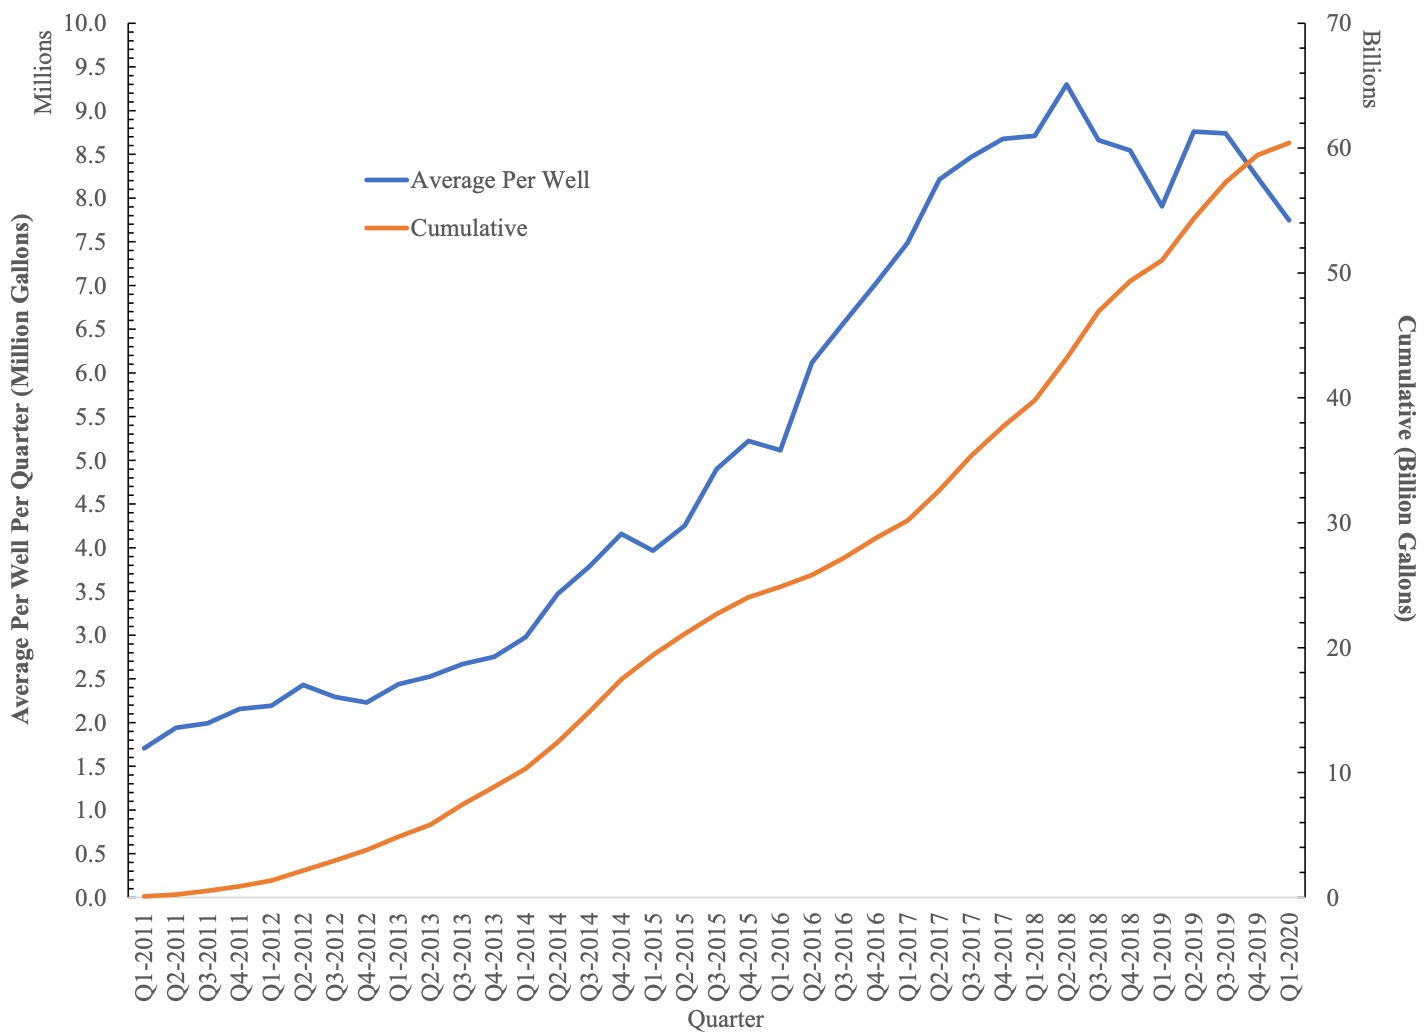
We’ve incorporated individual horizontal well freshwater demand for nearly 12,000 wells up to and including Q1-2020. The numbers are jaw dropping when you consider that at the time we debuted this map North Dakota, unconventional wells were using roughly 2.1 million gallons per well compared to an average of 8.3 million gallons per well so far this year. This per well increase is something we have been documenting for years now in states like Pennsylvania, Ohio, and West Virginia.
This is concerning for multiple reasons, the first being that if fracking ever were to rebound to its halcyon days of the early teens, it would mean some of our country’s most prized and fragile watersheds would be pushed to an irreversible hydrological tipping point. Hoekstra et al. (2012) have come to call this the “blue water” precautionary principle whereby “depletion beyond 20% of a river’s natural flow increases risks to ecological health and ecosystem services.”
Another concern is that while permitting in North Dakota has slowed like it has nationwide, the aforementioned quarterly water usage totals per well are now 5.25 times what they were in October 2012 and the total water used by the industry in North Dakota now amounts to 60.43 billion gallons– that we know of — which is nearly 50 times what the industry had used when we created our North Dakota Shale Viewer (Figure 2).[1]
With respect to the points made earlier about the value of EROEI, this increase in water demand has not been reflected in the productivity of North Dakota’s oil and gas wells, which means the EROEI continues to fall at rate that should make the industry blush. Furthermore, this trend should prompt regulators and elected officials in Bismarck and elsewhere to begin to ask if the long-term and permanent environmental and/or hydrological risk is worth the short-term rewards vis à vis the “blue water” precautionary principle, in this case of the Missouri River, outlined by Hoekstra et al. (2012). It is my opinion that it most assuredly is not and never was worth the risk!
The most stunning aspect of the above divergence in production and water demand is that on a per well basis, water only costs the industry roughly 0.46-0.76% of total well pad costs. This narrow range is a function of the water pricing schemes shared with me by the North Dakota Western Area Water Supply Authority (WAWSA). This speaks to an average price of water between $3.68 and $4.07 per 1,000 gallons for “industrial” use (aka, fracking industry) by way of eight depots and “several hundred miles of transmission and distribution lines” spread across the state’s four northwest counties of Mountrail, Divide, Williams, and McKenzie.
Figure 2. Average Freshwater Demand Per Well and Cumulative Freshwater Demand by North Dakota fracking industry from 2011 to Q1-2020.
Increasing Fracking Waste Production
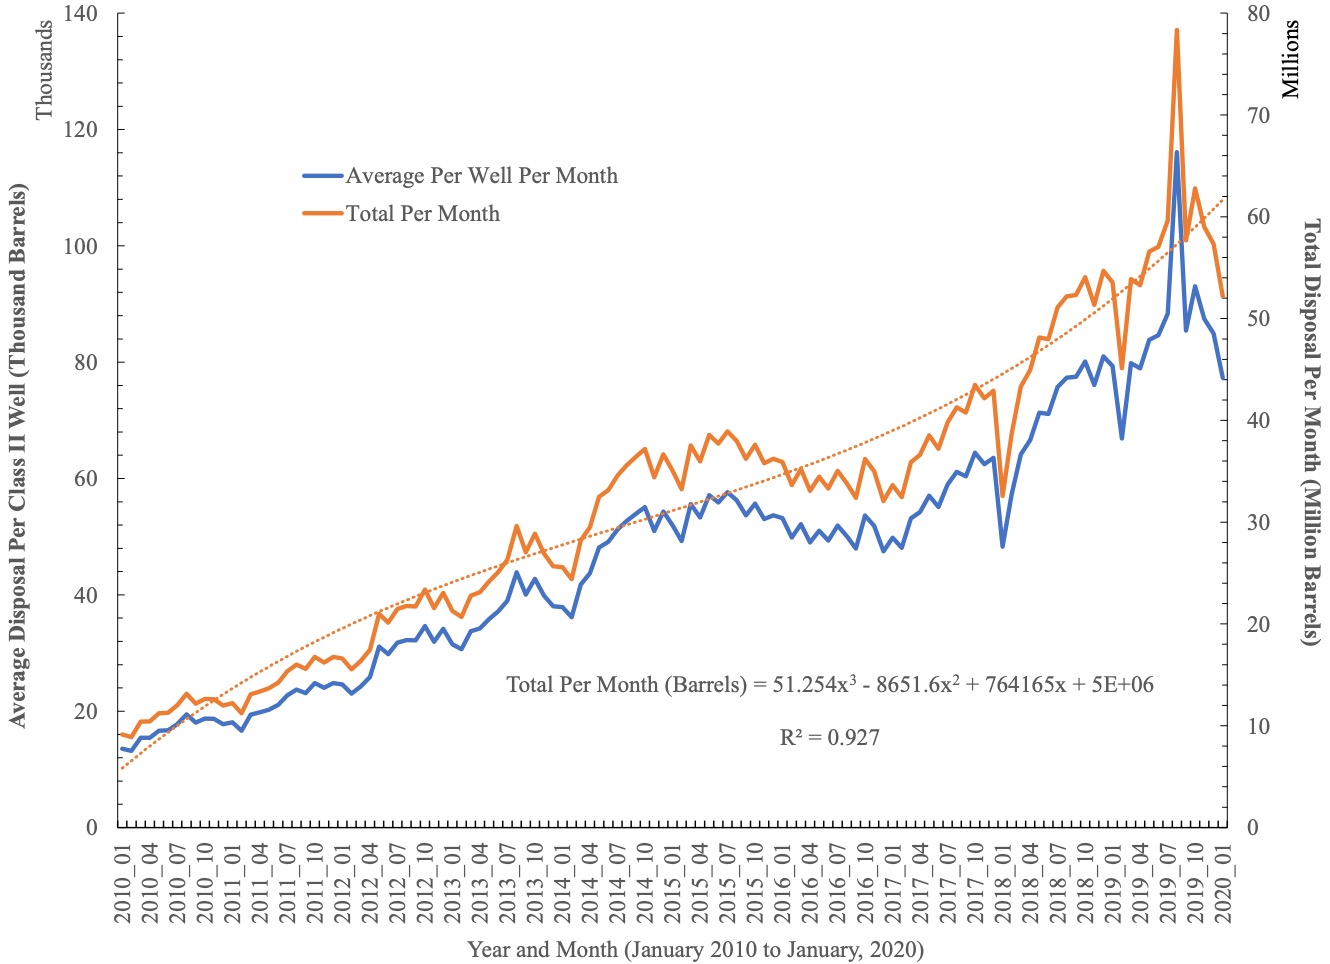
On the fracking waste front, the monthly trend is quite volatile relative to what we’ve documented in states like Oklahoma, Kansas, and Ohio. Nonetheless, the amount of waste produced is increasing per well and in total. How you quantify this increase is quite sensitive to the models you fit to the data. The exponential and polynomial (Plotted in Figure 3) fits yield 4.76 to 9.81 million barrel per month increases, while linear and power functions yield the opposite resulting in 1.82 to 10.91 million-barrel declines per month. If we assume the real answer is somewhere in between we see that fracking waste is increasingly slightly at a rate of 1.51% per year or 460,194 barrels per month.
Figure 3. Average Per Well and Monthly Total Fracking Waste Disposal across 675 North Dakota Class II Salt Water Disposal (SWD) wells from 2010 to Q1-2020.
North Dakota has concerning legislation related to oil and gas waste disposal. Senate Bill 2344 claims that landowners do not actually own the “subsurface pore space” beneath their property. The bill was passed into law by Legislature last Spring but there are numerous lawsuits working against it. We will have further analysis of this bill published on FracTracker.org soon.
FracTracker collaborated with Earthworks to create an interactive map that allows North Dakota residents to determine if oil and gas waste is disposed of or has spilled near them in addition to a list of recommendations for state and local policymakers, including the closing of the state’s harmful oil and gas hazardous waste loophole. Read the report for detailed information about oil and gas waste in North Dakota.
This data is critical to understanding the environmental and/or hydrological impact(s) of fracking, whether it is Central Appalachia’s Ohio River Valley, or in this case North Dakota’s Missouri River Basin. We will continue to periodically update this data.
Without supply-side price signaling or adequate regulation, it appears that the industry is uninterested and insufficiently incentivized to develop efficiencies in water use. It is my opinion that the only way the industry will be incentivized to do so is if states put a more prohibitive and environmentally responsible price on water and waste. In the absence of outright bans on fracking, we must demand the industry is held accountable for pushing watersheds to the brink of their capacity, and in the process, compromising the water needs of so many communities, flora, and fauna.
[1] Here in Ohio where I have been looking most closely at water supply and demand across the fracking landscape it is clear that we aren’t accounting for some 10-12% of water demand when we compare documented water withdrawals in the numerator with water usage in the denominator.
https://www.fractracker.org/a5ej20sjfwe/wp-content/uploads/2020/06/Oil-Gas-waste-tank-in-Michigan-feature-scaled.jpg4301500Ted Auch, PhDhttps://www.fractracker.org/a5ej20sjfwe/wp-content/uploads/2025/09/2025-Wordmark-Logo.pngTed Auch, PhD2020-06-18 10:24:572021-04-15 14:16:44The North Dakota Shale Viewer Reimagined: Mapping the Water and Waste Impact
FracTracker Alliance has released a new national map, filled with energy and petrochemical data. Explore the map, continue reading to learn more, and see how your state measures up!
This map has been updated since this blog post was originally published, and therefore statistics and figures below may no longer correspond with the map
The items on the map (followed by facility count in parenthesis) include:
For oil and gas wells, view FracTracker’s state maps.
Transportation & Storage
Natural gas compressor stations (1,367) – Facilities built along a pipeline route that pressurize natural gas to keep it flowing through the pipeline.
Crude oil rail terminals (94) – Rail terminals that load and unload crude oil (liquid hydrocarbons that have yet to be processed into higher-value petroleum products).
Liquefied natural gas import/export terminals (8) – Facilities that can a) liquefy natural gas so it can be exported as LNG (liquefied natural gas) and/or b) re-gasify LNG so it can be used as natural gas. Natural gas is transported in a liquid state because it takes up less space as a liquid than as a gas.
Natural Gas Underground Storage (486) – Locations where natural gas is stored underground in aquifers, depleted gas fields, and salt formations.
Petroleum Product Terminals (1,484) – Terminals with a storage capacity of 50,000 barrels or more and/or the ability to receive volumes from tanker, barge, or pipeline. Petroleum products include products “produced from the processing of crude oil and other liquids at petroleum refineries, from extraction of liquid hydrocarbons at natural gas processing plants, and from production of finished petroleum products at blending facilities.”
Petroleum Ports (242) – A port that can import and/or export 200,000 or more short tons of petroleum products a year.
Natural gas import/export pipeline facility (54) – A facility where natural gas crosses the border of the continental United States.
Pipelines
Crude oil pipelines – major crude oil pipelines, including interstate truck lines and selected intrastate lines, but not including gathering lines.
Natural gas liquid pipelines – Also referred to as hydrocarbon gas liquid pipelines, they carry the heavier components of the natural gas stream which are liquid under intense pressure and extreme cold, but gas in normal conditions.
Natural gas pipelines– Interstate and intrastate natural gas pipelines. Due to the immensity of this pipeline network and lack of available data, this pipeline layer in particular varies in degree of accuracy.
Petroleum Product Pipelines – Major petroleum product pipelines.
Recent Pipeline Projects – Pipeline projects that have been announced since 2017. This includes projects in various stages, including under construction, complete, planned or canceled. Click on the pipeline for the status.
Processing & Downstream
Natural Gas Processing Plants (478) – Plants that separate impurities and components of the natural gas stream.
Chemical plants (36) – Includes two types of chemical plants – petrochemical production and ammonia manufacturing – that report to EPA’s Greenhouse Gas Reporting Program.
Ethylene Crackers (30) – Also referred to as ethane crackers, these petrochemical complexes that converts ethane (a natural gas liquid) into ethylene. Ethylene is used to make products like polyethylene plastic.
Petroleum Refineries (135) – A plant that processes crude oil into products like petroleum naphtha, diesel fuel, and gasoline.
Power Plants (9,414) – Electric generating plants with a capacity of at least one megawatt, sorted by energy source.
Wind Turbines (63,003) – Zoom in on wind power plants to see this legend item appear.
Natural Resources
Shale Plays (45) – Tight oil and gas shale plays, which are formations where oil and gas can be extracted.
Major Rivers
Solar Energy Potential – Potential solar energy generation, in kilowatt-hours per square meter per day – averaged annually.
This map is by no means exhaustive, but is exhausting. It takes a lot of infrastructure to meet the energy demands from industries, transportation, residents, and businesses – and the vast majority of these facilities are powered by fossil fuels. What can we learn about the state of our national energy ecosystem from visualizing this infrastructure? And with increasing urgency to decarbonize within the next one to three decades, how close are we to completely reengineering the way we make energy?
Key Takeaways
Natural gas accounts for 44% of electricity generation in the United States – more than any other source. Despite that, the cost per megawatt hour of electricity for renewable energy power plants is now cheaper than that of natural gas power plants.
The state generating the largest amount of solar energy is California, while wind energy is Texas. The state with the greatest relative solar energy is not technically a state – it’s D.C., where 18% of electricity generation is from solar, closely followed by Nevada at 17%. Iowa leads the country in relative wind energy production, at 45%.
The state generating the most amount of energy from both natural gas and coal is Texas. Relatively, West Virginia has the greatest reliance on coal for electricity (85%), and Rhode Island has the greatest percentage of natural gas (92%).
With 28% of total U.S. energy consumption for transportation, many of the refineries, crude oil and petroleum product pipelines, and terminals on this map are dedicated towards gasoline, diesel, and other fuel production.
Petrochemical production, which is expected to account for over a third of global oil demand growth by 2030, takes the form of chemical plants, ethylene crackers, and natural gas liquid pipelines on this map, largely concentrated in the Gulf Coast.
Electricity generation
The “power plant” legend item on this map contains facilities with an electric generating capacity of at least one megawatt, and includes independent power producers, electric utilities, commercial plants, and industrial plants. What does this data reveal?
In terms of the raw number of power plants – solar plants tops the list, with 2,916 facilities, followed by natural gas at 1,747.
In terms of megawatts of electricity generated, the picture is much different – with natural gas supplying the highest percentage of electricity (44%), much more than the second place source, which is coal at 21%, and far more than solar, which generates only 3% (Figure 1).
Figure 1. Electricity generation by source in the United States, 2019. Data from EIA.
This difference speaks to the decentralized nature of the solar industry, with more facilities producing less energy. At a glance, this may seem less efficient and more costly than the natural gas alternative, which has fewer plants producing more energy. But in reality, each of these natural gas plants depend on thousands of fracked wells – and they’re anything but efficient.
The cost per megawatt hour of electricity for a renewable energy power plants is now cheaper than that of fracked gas power plants. A report by the Rocky Mountain Institute, found “even as clean energy costs continue to fall, utilities and other investors have announced plans for over $70 billion in new gas-fired power plant construction through 2025. RMI research finds that 90% of this proposed capacity is more costly than equivalent [clean energy portfolios, which consist of wind, solar, and energy storage technologies] and, if those plants are built anyway, they would be uneconomic to continue operating in 2035.”
The economics side with renewables – but with solar, wind, geothermal comprising only 12% of the energy pie, and hydropower at 7%, do renewables have the capacity to meet the nation’s energy needs? Yes! Even the Energy Information Administration, a notorious skeptic of renewable energy’s potential, forecasted renewables would beat out natural gas in terms of electricity generation by 2050 in their 2020 Annual Energy Outlook.
This prediction doesn’t take into account any future legislation limiting fossil fuel infrastructure. A ban on fracking or policies under a Green New Deal could push renewables into the lead much sooner than 2050.
In a void of national leadership on the transition to cleaner energy, a few states have bolstered their renewable portfolio.
Figure 2. Electricity generation state-wide by source, 2019. Data from EIA.
One final factor to consider – the pie pieces on these state charts aren’t weighted equally, with some states’ capacity to generate electricity far greater than others. The top five electricity producers are Texas, California, Florida, Pennsylvania, and Illinois.
Transportation
In 2018, approximately 28% of total U.S. energy consumption was for transportation. To understand the scale of infrastructure that serves this sector, it’s helpful to click on the petroleum refineries, crude oil rail terminals, and crude oil pipelines on the map.
Transportation Fuel Infrastructure. Data from EIA.
The majority of gasoline we use in our cars in the US is produced domestically. Crude oil from wells goes to refineries to be processed into products like diesel fuel and gasoline. Gasoline is taken by pipelines, tanker, rail, or barge to storage terminals (add the “petroleum product terminal” and “petroleum product pipelines” legend items), and then by truck to be further processed and delivered to gas stations.
China leads the world in this movement. In 2018, just over half of the world’s electric vehicles sales occurred in China. Analysts predict that the country’s oil demand will peak in the next five years thanks to battery-powered vehicles and high-speed rail.
In the United States, the percentage of electric vehicles on the road is small but growing quickly. Tax credits and incentives will be important for encouraging this transition. Almost half of the country’s electric vehicle sales are in California, where incentives are added to the federal tax credit. California also has a “Zero Emission Vehicle” program, requiring electric vehicles to comprise a certain percentage of sales.
We can’t ignore where electric vehicles are sourcing their power – and for that we must go back up to the electricity generation section. If you’re charging your car in a state powered mainly by fossil fuels (as many are), then the electricity is still tied to fossil fuels.
Petrochemicals
Many of the oil and gas infrastructure on the map doesn’t go towards energy at all, but rather aids in manufacturing petrochemicals – the basis of products like plastic, fertilizer, solvents, detergents, and resins.
Natural gas processing plants separate components of the natural gas stream to extract natural gas liquids like ethane and propane – which are transported through the natural gas liquid pipelines. These natural gas liquids are key building blocks of the petrochemical industry.
Ethane crackers process natural gas liquids into polyethylene – the most common type of plastic.
The chemical plants on this map include petrochemical production plants and ammonia manufacturing. Ammonia, which is used in fertilizer production, is one of the top synthetic chemicals produced in the world, and most of it comes from steam reforming natural gas.
As we discuss ways to decarbonize the country, petrochemicals must be a major focus of our efforts. That’s because petrochemicals are expected to account for over a third of global oil demand growth by 2030 and nearly half of demand growth by 2050 – thanks largely to an increase in plastic production. The International Energy Agency calls petrochemicals a “blind spot” in the global energy debate.
Petrochemical development off the coast of Texas, November 2019. Photo by Ted Auch, aerial support provided by LightHawk.
Investing in plastic manufacturing is the fossil fuel industry’s strategy to remain relevant in a renewable energy world. As such, we can’t break up with fossil fuels without also giving up our reliance on plastic. Legislation like the Break Free From Plastic Pollution Act get to the heart of this issue, by pausing construction of new ethane crackers, ensuring the power of local governments to enact plastic bans, and phasing out certain single-use products.
“The greatest industrial challenge the world has ever faced”
Mapped out, this web of fossil fuel infrastructure seems like a permanent grid locking us into a carbon-intensive future. But even more overwhelming than the ubiquity of fossil fuels in the US is how quickly this infrastructure has all been built. Everything on this map was constructed since Industrial Revolution, and the vast majority in the last century (Figure 3) – an inch on the mile-long timeline of human civilization.
Figure 3. Global Fossil Fuel Consumption. Data from Vaclav Smil (2017)
In fact, over half of the carbon from burning fossil fuels has been released in the last 30 years. As David Wallace Wells writes in The Uninhabitable Earth, “we have done as much damage to the fate of the planet and its ability to sustain human life and civilization since Al Gore published his first book on climate than in all the centuries—all the millennia—that came before.”
What will this map look like in the next 30 years?
A recent report on the global economics of the oil industry states, “To phase out petroleum products (and fossil fuels in general), the entire global industrial ecosystem will need to be reengineered, retooled and fundamentally rebuilt…This will be perhaps the greatest industrial challenge the world has ever faced historically.”
Is it possible to build a decentralized energy grid, generated by a diverse array of renewable, local, natural resources and backed up by battery power? Could all communities have the opportunity to control their energy through member-owned cooperatives instead of profit-thirsty corporations? Could microgrids improve the resiliency of our system in the face of increasingly intense natural disasters and ensure power in remote regions? Could hydrogen provide power for energy-intensive industries like steel and iron production? Could high speed rail, electric vehicles, a robust public transportation network and bike-able cities negate the need for gasoline and diesel? Could traditional methods of farming reduce our dependency on oil and gas-based fertilizers? Could zero waste cities stop our reliance on single-use plastic?
Of course! Technology evolves at lightning speed. Thirty years ago we didn’t know what fracking was and we didn’t have smart phones. The greater challenge lies in breaking the fossil fuel industry’s hold on our political system and convincing our leaders that human health and the environment shouldn’t be externalized costs of economic growth.
https://www.fractracker.org/a5ej20sjfwe/wp-content/uploads/2020/02/National-map-feature-3.png400900Erica Jacksonhttps://www.fractracker.org/a5ej20sjfwe/wp-content/uploads/2025/09/2025-Wordmark-Logo.pngErica Jackson2020-02-28 17:35:142022-05-02 15:21:42National Energy and Petrochemical Map
We live in a complex environment of local, regional, national, and international issues. We are constantly bombarded with a news cycle that regenerates at increasingly dizzying speeds. How can we possibly know what is truly important when hyped up twitter controversies clog up our news feeds?
In this quantity-over-quality culture, many of the most important issues and fights for civil rights and energy justice become casualties of a regression to ignorance.
At FracTracker, we disagree with this tactic – especially as it relates to the protests at Standing Rock. FracTracker has previously written about these demonstrations (shown in the map above), and has also analyzed and mapped data on oil spills from pipelines in North Dakota. We will continue FracTracker’s coverage of Standing Rock and the Water Protectors who fought – and continue to fight – the Dakota Access Pipeline (DAPL), known as the Black Snake.
Following the Fight
For those unaware, the fight against the Dakota Access Pipeline operated by Energy Transfer Partners, continues. While the project was green-lighted by the Trump Administration and Bakken oil began flowing in June of 2017, the court has returned the permits to the U.S. Army Corps of Engineers. A U.S. District Court judge ruled that the initial approval of the pipeline did not undergo adequate study of its environmental consequences. The finding stated that the Army Corps provided a flawed model, inadequate for predicting the full impacts of a leak under Lake Oahe. The model does not consider what would happen in the event of a leak under the lake. It models only benzene — one of many toxic chemicals present in crude oil — and models its movement in an unrealistic manner. Energy Transfer Partners claims the model is conservative, but it massively underestimates the potential impacts on human health and wildlife. The Army Corps provides no plan to contain an underground leak or clean contaminated soil and groundwater under Lake Oahe.
On a related note, DAPL’s parent company, Energy Transfer Partners, said in a recent annual report that it may not have sufficient liquid assets to finance a major cleanup project and would likely pass those costs onto local landowners and federal taxpayers. Energy Transfer Partners has since filed a racketeering lawsuit seeking $300 million in damages from the Red Warrior Camp at Standing Rock.
… the agency could simply revise or update its environmental review and again conclude that no EIS (environmental impact statement) is required. If that happens, additional legal challenges are likely. The Tribe believes this court decision should trigger a full EIS, including consideration of route alternatives, just as the Obama administration proposed in December.
Normally, when a permit is issued in violation of the National Environmental Protection Act (NEPA), operations are suspended, which would have forced the DAPL to shut down while the review is conducted. Contrary to the usual protocol, on October 11, 2017 a federal judge ruled that the pipeline will remain operational pending the environmental review by the Army Corps. Standing Rock Sioux Chairman Dave Archambault II has said in a statement, however, “Just because the oil is flowing now doesn’t mean that it can’t be stopped.”
More Information and Resources
The Lakota People’s Law Project (LPLP) has been a resource to Lakota country – an area comprised of nine Indian reservation in North and South Dakota – since 2004. The LPLP supports a number of campaigns including divestment and energy justice, and has published several reports:
Special thanks to the Lakota People’s Law Project and Rachel Hallett-Ralston for the information provided.
In January of 2017, 76 Water Protectors including Chase Iron Eyes were arrested on land granted to the Standing Rock Lakota Sioux Tribe under the 1851 Treaty of Fort Laramie. Chase Iron Eyes, Lead Counsel of the Lakota People’s Law Project, has been charged with felony incitement to riot and misdemeanor criminal trespass. In the interview above, Chase Iron Eyes discusses his involvement with Standing Rock and the political pressures to make an example out of him. Read the Lakota People’s Law Project petition here.
By Kyle Ferrar, Western Program Coordinator, FracTracker Alliance
Pipelines are hailed as the “safest” way to transport crude oil and other refinery products, but federal and state data show that pipeline incidents are common and present major environmental and human health hazards. In light of current events that have green-lighted multiple new pipeline projects, including several that had been previously denied because of the environmental risk they pose, FracTracker Alliance is continuing to focus on pipeline issues.
In this article we look at the record of oil spills, particularly those resulting from pipeline incidents that have occurred in North Dakota, in order to determine the risk presented by the soon-to-be completed Dakota Access Pipeline.
Standing Rock & the DAPL Protest
To give readers a little history on this pipeline, demonstrators in North Dakota, as well as across the country, have been protesting a section of the Dakota Access Pipeline (DAPL) near the Standing Rock Sioux Tribe’s lands since April 2016. The tribe’s momentum has shifted the focus from protests at the build site to legal battles and a march on Washington DC. The pipeline section they are protesting has at this point been largely finished, and is slated to begin pumping oil by April 2017. This final section of pipe crosses under Lake Oahe, a large reservoir created on the Missouri River, just 1.5 miles north of the Standing Rock Sioux Tribal Lands. The tribe has condemned the pipeline because it cuts through sacred land and threatens their environmental and economic well-being by putting their only source for drinking water in jeopardy.
Pipelines
… supposedly safest form of transporting fossil fuels, but …
However, what makes one form of land transport safer than the others is dependent on which factor is being taken into account. When considering the costs of human death and property destruction, pipelines are indeed the safest form of land transportation. However, for the amount of oil spilled, pipelines are second-worst, beaten only by trucks. Now, when it comes to environmental impact, pipelines are the worst.
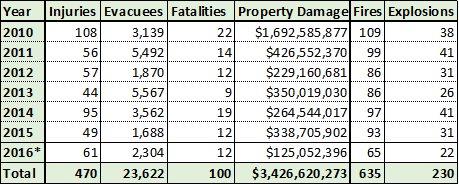
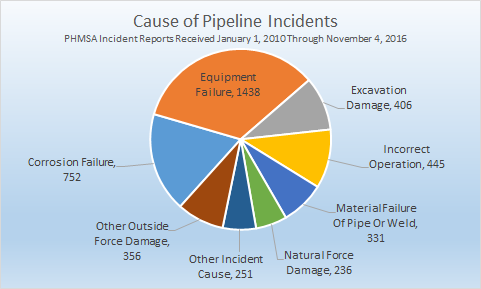
What is not debatable is the fact that pipelines are dangerous, regardless of factor. Between 2010 and October 2016 there was an average of 1.7 pipeline incidents per day across the U.S. according to data from the Pipeline and Hazardous Materials Safety Administration (PHMSA). These incidents have resulted in 100 reported fatalities, 470 injuries, and over $3.4 billion in property damage. More than half of these incidents were caused by equipment failure and corrosion (See Figures 1 and 2).
Figure 1. Impacts of pipeline incidents in the US. Data collected from PHMSA on November 4th, 2016 (data through September 2016). Original Analysis
Figure 2. Cause of pipeline incidents for all reports received from January 1, 2010 through November 4, 2016. Original Analysis
Recent Spills in North Dakota
To dig into the risks posed in North Dakota more specifically, let’s take a look at some spill data in the state.
Map 1. Locations of Spills in North Dakota, with volume represented by size of markers
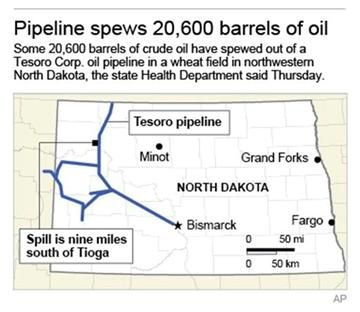
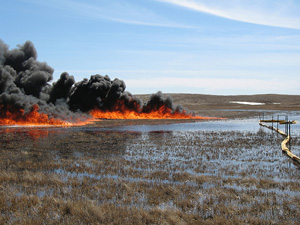
In North Dakota alone there have been 774 oil spill incidents between 2010 and September 2016, spilling an average of 5,131 gallons of oil per incident. The largest spill in North Dakota in recent history, and one of the largest onshore oil spills in the U.S., took place in September 2013. Over 865,000 gallons of crude oil spilled into a wheat field and contaminated about 13 acres. The spill was discovered several days later by the farmer who owns the field, and was not detected by remote monitors. The state claims that no water sources were contaminated and no wildlife were hurt. However, over three years of constant work later, only about one third of the spill has been recovered.
Below we have analyzed available spill data for North Dakota, including the location and quantity of such incidents.
North Dakota saw an average of 111 crude oil spills per year, or a total of 774 spills from 2010 to October 2016. The greatest number of spills occurred in 2014 with a total of 163. But 2013 had the largest spill with 865,200 gallons and also the highest total volume of oil spilled in one year of 1.3 million gallons. (Table 1)
Table 1. Data on all spills from 2010 through October 2016. Data taken from PHMSA and North Dakota.
2010
2011
2012
2013
2014
2015
Jan-Oct 2016
Number of Spills
55
80
77
126
163
117
156
Total Volume (gallons)
332,443
467,544
424,168
1,316,910
642,521
615,695
171,888
Ave. Volume/Spill (gallons)
6,044
5,844
5,509
10,452
3,942
5,262
1,102
Largest Spill (gallons)
158,928
106,050
58,758
865,200
33,600
105,000
64,863
The total volume of oil spilled from 2010 to October 2016 was nearly 4 million gallons, about 2.4 million of which was not contained. Most spills took place at wellheads, but the largest spills occurred along pipelines. (Table 2)
Table 2. Spills by Source. Data taken from PHMSA and North Dakota.
Wellhead
Vehicle Accident
Storage
Pipeline
Equipment
Uncontained
All Spills
Number of Spills
694
1
12
54
13
364
774
Total Volume (gallons)
2,603,652
84
17,010
1,281,798
68,623
2,394,591
3,971,169
Ave. Volume/Spill (gallons)
3,752
84
1,418
23,737
5,279
6,579
5,131
Largest Spill (gallons)
106,050
84
10,416
865,200
64,863
865,200
865,200
A. Sensitive Areas Impacted
5,875 square miles
Total Affected Areas (408 linear miles)
Spills that were not contained could potentially affect sensitive lands and waterways in North Dakota. Sensitive areas include Native American Reservations, waterways, drinking water aquifers, parks and wildlife habitat, and cities. Uncontained spill areas overlapped, and potentially contaminated, 5,875 square miles of land and water, and 408 miles of streams.
Drinking Water Aquifers – 2,482.3 total square miles:
Non-Community Aquifer – 0.3 square miles
Community Aquifer – 36 square miles of hydrologically connected aquifer
Surficial Aquifer – 2,446 square miles of hydrologically connected aquifer
A large area of potential drinking water (surficial aquifers) are at risk of contamination. Of the aquifers that are in use, aquifers for community use have larger areas that are potentially contaminated than those for non-community use.
Native American Tribal Reservation
Fort Berthold, an area of 1,569 square miles
Cities – 67 total square miles
Berthold
Dickinson
Flaxton
Harwood
Minot
Petersburg
Spring Brook
Stanley
West Fargo
Map 2. Areas where Oil Spills Present Public Health Threats
Floodplains – 73 square miles of interconnected floodplains
Streams – 408 miles of interconnected streams
Of the 364 oil spills that have occurred since 2010, 229 (63%) were within 1/4 mile of a waterway
Of the 61 Uncontained Brine Spills that have occurred since 2001, 38 (63%) were within 1/4 mile of a waterway.
If a spill occurs in a floodplain during or before a flood and is uncontained, the flood waters could disperse the oil over a much larger area. Similarly, contaminated streams can carry oil into larger rivers and lakes. Explore Map 3 for more detail.
Using ArcGIS software, uncontained spill locations were overlaid on spatial datasets of floodplains, stream beds, groundwater regions, sensitive habitats, and other sensitive regions.
The average extent (distance) spilled oil traveled from uncontained spill sites was calculated to 400 meters. This distance was used as a buffer to approximate contact of waterways, floodplains, drinking water resources, habitat, etc. with uncontained oil spills.
https://www.fractracker.org/a5ej20sjfwe/wp-content/uploads/2017/04/OilSpill_12.16_crop.jpg400900Kyle Ferrar, MPHhttps://www.fractracker.org/a5ej20sjfwe/wp-content/uploads/2025/09/2025-Wordmark-Logo.pngKyle Ferrar, MPH2017-04-11 16:15:232021-04-15 15:03:11Oil Spills in North Dakota: What does DAPL mean for North Dakota’s future?
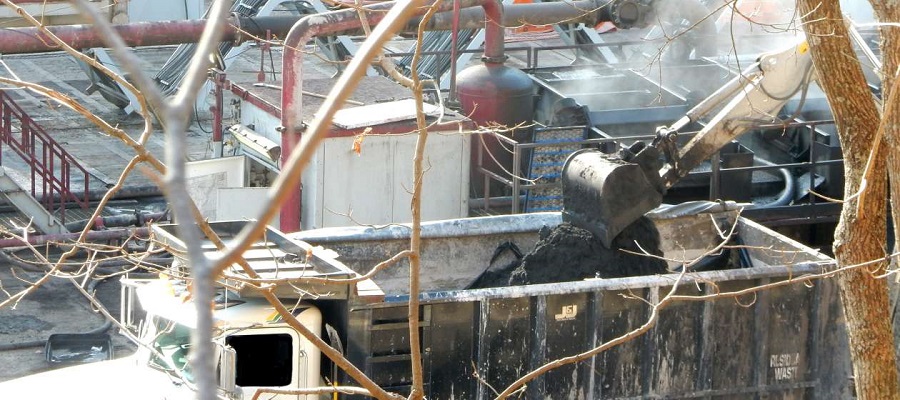
Highlighting the maps of radioactive oil and gas exploration and production wastes created in collaboration with the Western Organization of Research Councils
By Kyle Ferrar, Western Program Coordinator, FracTracker Alliance
Scott Skokos, Western Organization of Research Councils
Oil and gas waste can be radioactive, but it is not considered “hazardous,” at least according to the federal government. In this article, we summarize several of the hazardous risks resulting from the current federal policy that fails to regulate this massive waste stream, and the gaps left by states. Of the six states mapped in this assessment, only the state of Montana has initiated any type of rule-making process to manage the waste.
When it comes to unconventional oil and gas waste streams:
Nobody can say how much of any type of waste is being produced, what it is, and where it’s ending up. – Nadia Steinzor, Earthworks
Why is accurate waste data so hard to come by? The Earthworks report, Wasting Away explains that the U.S. EPA intentionally exempted oil and gas exploration and production wastes from the federal regulations known as the Resource Conservation and Recovery Act (RCRA) despite concluding that such wastes “contain a wide variety of hazardous constituents.” As a result, there is very little waste tracking and reporting of oil and gas waste data nationally.
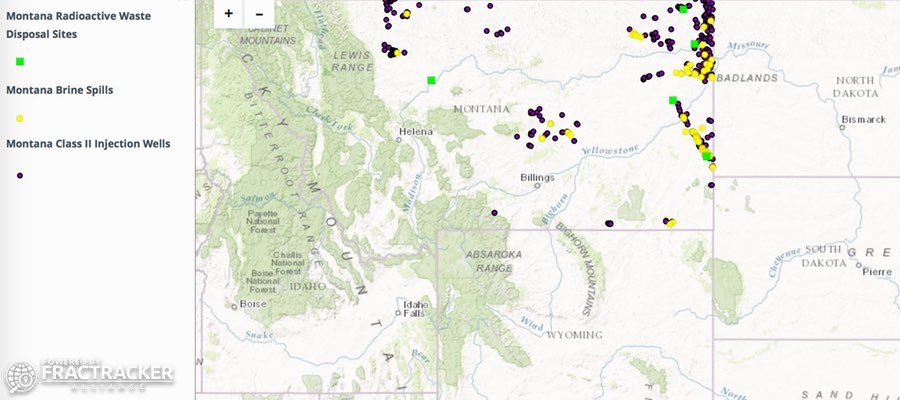
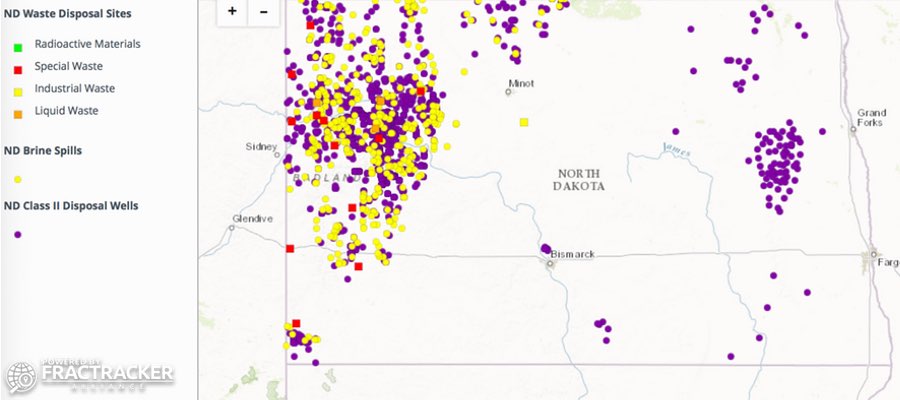
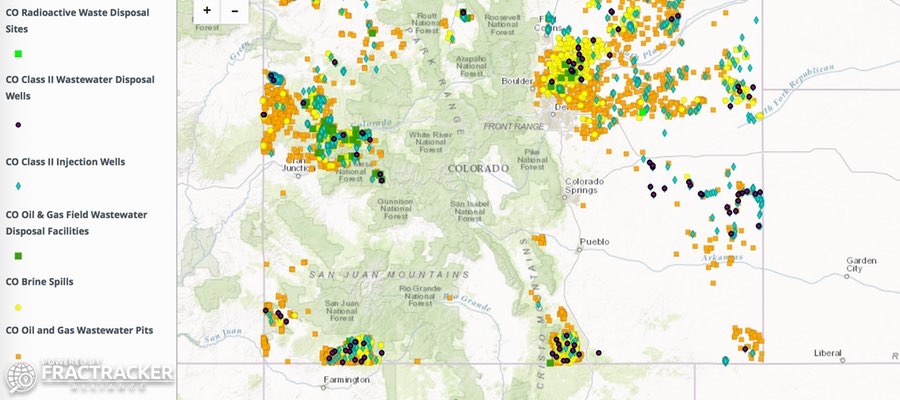
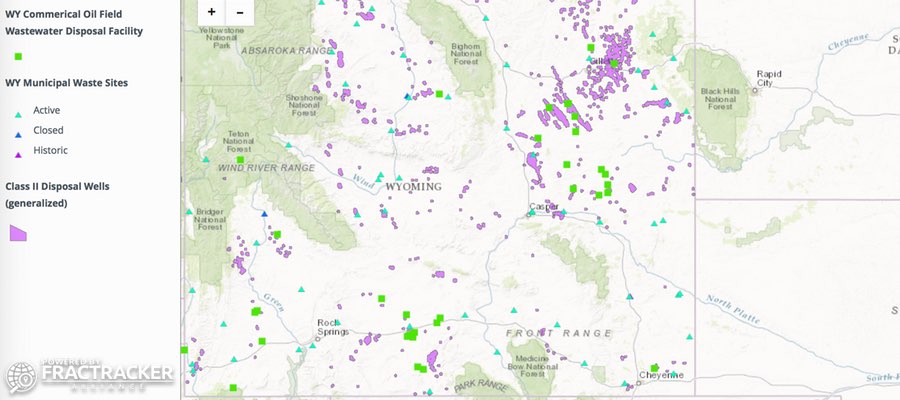
State Waste Management Maps
Some data is available at the state level, so we at FracTracker have compiled, cleaned, and mapped what little data we could find.
State-specific maps have been created for Montana, North Dakota, Colorado, and Wyoming – see below:
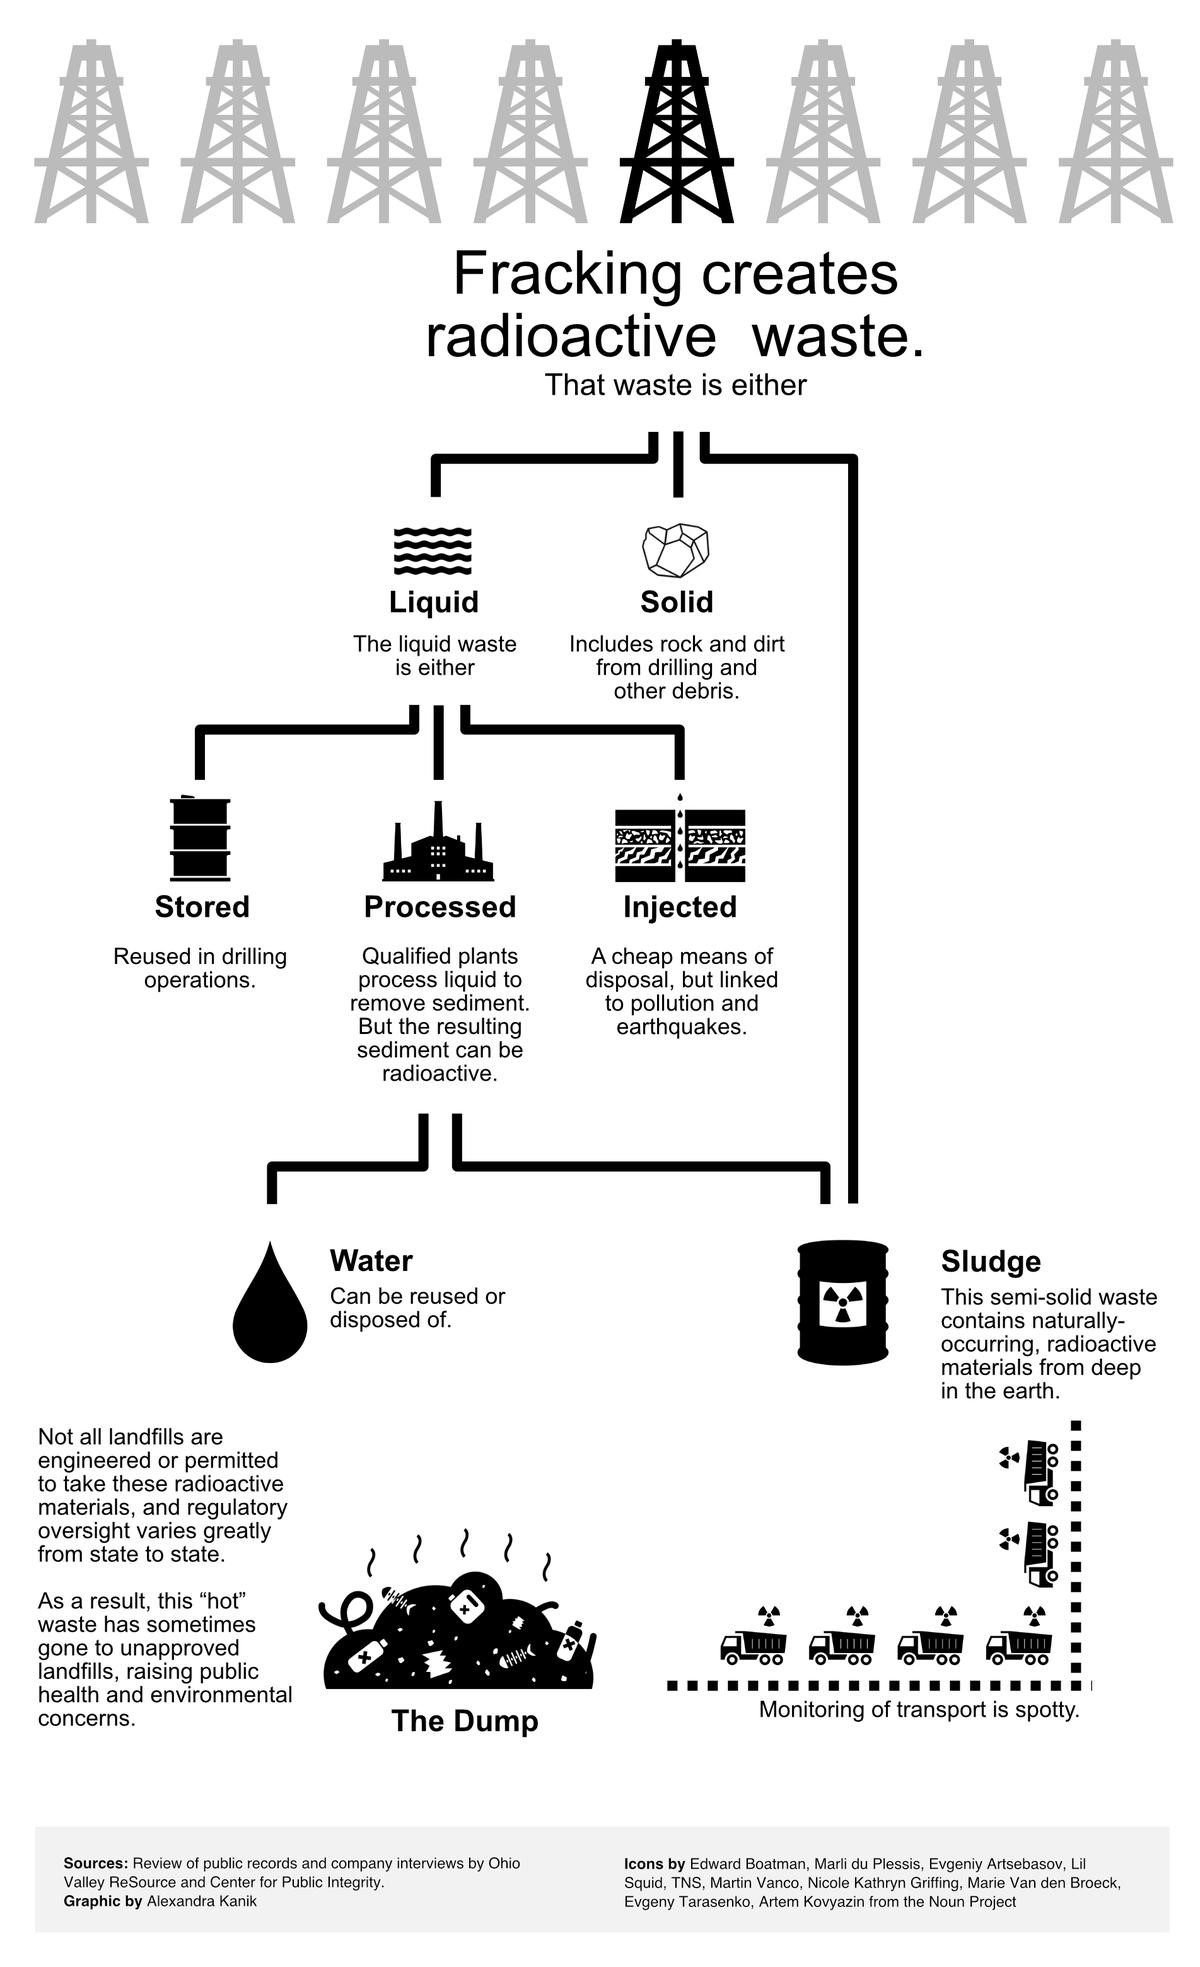
When we hear about “radioactive waste” associated with the energy industry, nuclear power stations and fission reactors are usually what come to mind. But, as the EPA explains, fracking has transformed the nature of the oil and gas waste stream. Components of fracking waste differ from conventional oil and gas exploration and production wastes in a number of ways:
In general, the waste stream has additional hazardous components, and that transformation includes increased radioactivity.
Fracking has allowed for more intrusive drilling, penetrating deep sedimentary formations using millions of gallons of fluid.
Drilling deeper produces more drill cuttings.
The process of hydraulic fracking introduces millions more gallons of fluid into the ground that then return to the surface. These returns are ultimately contaminated and require disposal.
The formations targeted for unconventional development are mostly ancient seabeds still filled with salty “brines” known as “formation waters.”
In addition to the hazardous chemicals in the fracking fluid pumped into the wells for fracking, these unconventional formations contain larger amounts of heavy metals, carcinogens and other toxics. This also includes more radioisotopes such as Uranium, Thorium, Radium, Potassium-40, Lead-210, and Polonium-210 than the conventional formations that have supplied the majority of oil and gas prior to the shale boom.
A variety of waste products make up the waste stream of oil and gas development, and each is enhanced with naturally occurring radioactive materials (NORM). This waste stream must be treated and disposed of properly. All the oil and gas equipment – such as production equipment, processing equipment, produced water handing equipment, and waste management equipment – also need to be considered as sources of radioactive exposure.
Figure 1 below explains where the waste from fracking goes after it leaves the well pad.
Figure 1. Breakdown of the radioactive oil and gas waste life-cycle
Three facets of the waste stream particularly enhanced with NORMs by fracking include scales, produced waters, and sludges.
A. Scales
When injected into the ground, fracking fluid mixes with formation waters, dissolving metals, radioisotopes and other inorganic compounds. Additionally the fracking liquids are often supplemented with strong acids to reduce “scaling” from precipitate build up (to prevent clogging up the well). Regardless, each oil well generates approximately 100 tons of radioactive scale annually. As each oil and gas reservoir is drained, the amount of scale increases. The EPA reports that lead-210 and polonium-210 are commonly found in scales along with their decay product radon at concentrations estimated to be anywhere from 480 picocuries per gram (pCi/g) to 400,000 pCi/g). Scale can be disposed of as a solid waste, or dissolved using “scale inhibitors.” These radioactive elements then end up in the liquid waste portion of the waste stream, known as produced waters.
B. Produced Waters
In California, strong acids are used to further dissolve formations to stimulate additional oil production. Acidic liquids are able to dissolve more inorganic elements and compounds such as radioisotopes. While uranium and thorium are not soluble in water, their radioactive decay products such as radium dissolve in the brines. The brines return to the surface as “produced water.” As the oil and gas in the formation are removed, much of what is pumped to the surface is formation water.
Consequently, declining oil and gas fields generate more produced water. The ratio of produced water to oil in conventional well was approximately 10 barrels of produced water per barrel of oil. According to the American Petroleum Institute (API), more than 18 billion barrels of waste fluids from oil and gas production are generated annually in the United States. There are several options for managing the liquid waste stream. The waste could be treated using waste treatment facilities, reinjected into other wells to enhance production (a cheaper option), or injected for disposal. Before disposal of the liquid portion, all the solids in the solution must be removed, resulting in a “sludge.”
C. Sludges
The U.S. EPA reports that conventional oil production alone produces 230,000 million tons – or five million ft3 (141 cubic meters) – of TENORM sludge each year. Unconventional processes produce much more sludge waste than conventional processes. The average concentration of radium in sludges is estimated to be 75 pCi/g, while the concentration of lead-210 can be over 27,000 pCi/g. Sludges present a high risk to the environment and a higher risk of exposure for people and other receptors in those environments because sludges are typically very water soluble.
Federal Exemptions
According to the EPA, “because the extraction process concentrates the naturally occurring radionuclides and exposes them to the surface environment and human contact, these wastes are classified as Technologically Enhanced Naturally Occurring Radioactive Material (TENORM).” Despite the conclusions that oil and gas TENORM pose a risk to the environment and humans, the EPA exempts oil and gas exploration and production wastes from the definition of “hazardous” under Resource Conservation and Recovery Act (RCRA) law. In fact, most wastes from all of the U.S. fossil fuel energy industry, including coal-burning and natural gas, are exempt from the disposal standards that hazardous waste normally requires.
The Center for Public Integrity calls this radioactive waste stream “orphan waste,” because no single government agency is fully managing it.
Just last month (January 10, 2017) the U.S. EPA agreed to review federal regulations of oil and gas waste – a process they were meant to do every 3 years for the last 30 years. The EPA has until March 15, 2019, to determine whether or not regulatory changes are warranted for “wastes associated with the exploration, development, or production of crude oil, natural gas, or geothermal energy.” With the recent freeze on all U.S. EPA grants, however, it is not clear whether these regulations will receive the review they need.
State Regulations
Regulation of this waste stream is left up to the states, but most states do not require operators to manage the radioactivity in oil and gas wastes, either. Because of the federal RCRA exemptions most state policies ignore the radioactive issue altogether. Operators are free to dispose of the waste at any landfill facility, unless the landfill tells them otherwise. For detailed analyses of state policies, see pages 10-45 of the No Time to Waste report. FracTracker has also covered these issues in Pennsylvania and Ohio.
Another issue that screams for federal consideration of this waste stream is that states do not have the authority to determine whether or not the wastes can cross their borders. States also do not have the jurisdiction to decide whether or not facilities in their state can accept waste from across state lines. That determination is reserved for federal jurisdiction, and there are not any federal laws regulating such wastes. In fact, these wastes are strategically exempt from federal regulation for just these reasons.
Why can’t the waste be treated?
This type of industrial waste actually cannot be treated, at least not entirely. Unlike organic pollutants that can be broken down, inorganic constituents of the waste cannot be simply disintegrated out of existence. Inorganic components include heavy metals like arsenic and bromides, as well as radioactive isotopes of radium, lead, and uranium. Such elements will continue to emit radiation for hundreds-to-thousands of years. The best option available is to find a location to “isolate” and dispose of these wastes – a sacrifice zone.
Current management practices do their best to separate the liquid portions from the solid portions, but that’s about it. Each portion can then be disposed independently of each other. Liquids are injected into the ground, which is the cheapest option where it is available. If enough of the dissolved components (heavy metals, salts, and radioisotopes) can be removed, wastewaters are discharged into surface waters. The compounds and elements that are removed from the liquid waste stream are hyper-concentrated in the solid portion of the waste, described as “sludge” in the graphic above. This hazardous material can be disposed of in municipal or solid waste landfills if the state regulators do not require the radioactivity or toxicity of this material to be a consideration for disposal. There are not federal requirements, so unless there is a specific state policy regarding the disposal, it can end up almost anywhere with little oversight. These chemicals do not magically disappear. They never disappear.
Risks
There are multiple pathways for contamination from facilities that are not qualified to manage radioactive and hazardous wastes. At least seven different environmental pathways provide potential risks for human exposure. They include:
Radon inhalation,
External gamma exposure,
Groundwater ingestion,
Surface water ingestion,
Dust inhalation,
Food ingestion, and
Skin beta exposure from particles containing the radioisotopes.
According to the EPA, the low-level radioactive materials in drilling waste present a definitive risk to those exposed. High risk examples include dust suppression and leaching. If dust is not continuously suppressed, radioactive materials in dust pose a risk to people at these facilities or those receptors or secondary pathways located downwind of the facilities. Radioactive leachate entering surface waters and groundwaters is also a significant threat. A major consideration is that radioactive waste can last in these landfills far longer than the engineered lifespans of landfills, particularly those that are not designed to retain hazardous wastes.
Cases of Contamination
North Dakota
In North Dakota, the epicenter of the Bakken Oil Fields, regulators were not ready for the massive waste streams that came from the fast growing oil fields. This allowed thousands of wastewater disposal wells be drilled to dispose of salty wastewater without much oversight, and no places in state for companies to dispose of radioactive solid waste. Many of the wastewater disposal wells were drilled haphazardly, and as a result many contaminated surrounding farmland with wastewater. With regard to radioactive solid waste, the state until recently had a de facto ban on solid radioactive waste disposal due to their radioactivity limit being 5 picocuries per gram. The result of this de facto ban made it so companies either had to make one of two decisions: 1. Haul their radioactive solid waste above the limit out of state to facilities in Idaho or Colorado; or 2. Risk getting caught illegally dumping waste in municipal landfills or just plain illegal dumping in roadsides, buildings, or farmland.
In 2014, a massive illegal dumping site was discovered in Noonan, ND when North Dakota regulators found a gas station full of radioactive waste and filter socks (the socks used to filter out solid waste from wastewater, which contain high levels of radioactivity). Following the Noonan, ND incident North Dakota regulators and politicians began discussions regarding the need for new regulations to address radioactive solid waste.
In 2015, North Dakota moved to create rules for the disposal of solid radioactive waste. Its new regulations increase the radioactivity limit from 5 picocuries per gram to 50 picocuries per gram, and sets up new requirements for the permitting of waste facilities accepting radioactive waste and the disposal of radioactive waste in the waste facilities. Dakota Resource Council, a member group of WORC, challenged the rules in the courts, arguing the rules are not protective enough and that the agency responsible for the rules pushed through the rules without following the proper procedures. Currently the rules are not in effect until the litigation is settled.
Pennsylvania
In Pennsylvania, the hotbed of activity for Marcellus Shale gas extraction, the regulatory body was ill equipped and uninformed for dealing with the new massive waste stream when it first arrived on scene. Through 2013, the majority of wastewater was disposed of in commercial and municipal wastewater treatment facilities that discharge to surface waters. Numerous facilities engaged in this practice without amending their federal discharge permits to include this new waste stream.
Waste treatment facilities in Pennsylvania tried to make the waste streams less innocuous by diluting the concentrations of these hazardous pollutants. They did this by mixing the fracking wastes with other waste streams, including industrial discharges and municipal waste. Other specialized facilities also tried to remove these dissolved inorganic elements and filter them from the discharge stream.
As a result of site assessments by yours-truly and additional academic research, these facilities realized that such hazardous compounds do not simply dilute into receiving waters such as the Allegheny, Monongahela, and Ohio rivers. Instead, they partition (settle) into sediments where they are hyper-concentrated. As a result of the lawsuits that followed the research, entire river bottoms in Pennsylvania had to be entirely dug up, removed, and disposed of in hazardous waste landfills.
Action Plans Needed
Massive amounts of solid and liquid wastes are still generated during drilling exploration and production from the Marcellus Shale. There is so much waste, operators don’t know what to do with it. In Pennsylvania, there is not much they can do with it, but it is not just Pennsylvania. Throughout the Ohio River Valley, operators struggle to dispose of this incredibly large waste stream.
Ohio, West Virginia, and Pennsylvania have all learned that this waste should not be allowed to be discharged to surface waters even after treatment. So it goes to other states – those without production or the regulatory framework to manage the wastes. Like every phase of production in the oil and gas industry, operators (drillers) shop around for the lowest disposal costs. In Estill County, Kentucky, the State Energy and Environment Department just recently cited the disposal company Advance Disposal Services Blue Ridge Landfill for illegally dumping hydraulic fracturing waste. The waste had traveled from West Virginia Marcellus wells, and ended up at an ignorant or willfully negligent waste facility.
In summary, there is inadequate federal oversight of potentially hazardous waste coming from the oil and gas industry, and there are serious regulatory gaps within and between states. Data management practices, too, are lacking. How then, is the public health community supposed to assess the risk that the waste stream poses to people? Obviously, a more thorough action plan is needed to address this issue.
Feature image: Drill cuttings being prepared to be hauled away from the well pad. Photo by Bill Hughes, OVEC
https://www.fractracker.org/a5ej20sjfwe/wp-content/uploads/2016/04/PublicIntegrity_Bill-Hughes_re.jpg400900Kyle Ferrar, MPHhttps://www.fractracker.org/a5ej20sjfwe/wp-content/uploads/2025/09/2025-Wordmark-Logo.pngKyle Ferrar, MPH2017-03-09 13:20:442021-04-15 15:03:39Oil and Gas Wastes are Radioactive – and Lack Regulatory Oversight
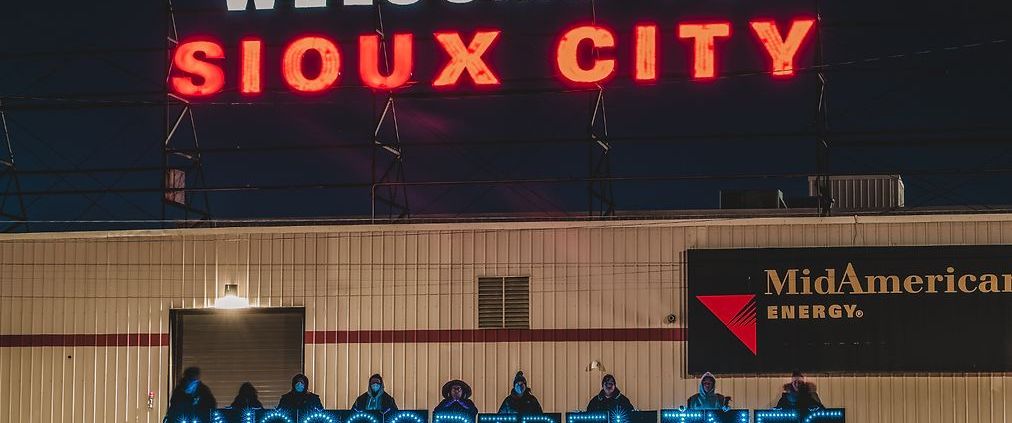 Great Plains Action Society