Allegheny County, PA – Drilling, Leasing, and Zoning Trends
By Kirk Jalbert, Manager of Community-Based Research and Engagement
and Matt Kelso, Manager of Data and Technology
FracTracker recently updated its Pennsylvania Shale Viewer to reflect the latest data on unconventional oil and gas permits and active wells in the state. Within this data, we noticed an increase in permitting over the past year for Allegheny County, PA. We have worked on a number of recent initiatives aimed at expanding conversations about unconventional oil and gas drilling by mapping mineral rights leasing and zoning ordinances in Allegheny County. In this article, we bring these various analyses together.
The analysis below can assist residents and public officials in preparing for what appears to be a pending wave of new development.
Untapped Reserves
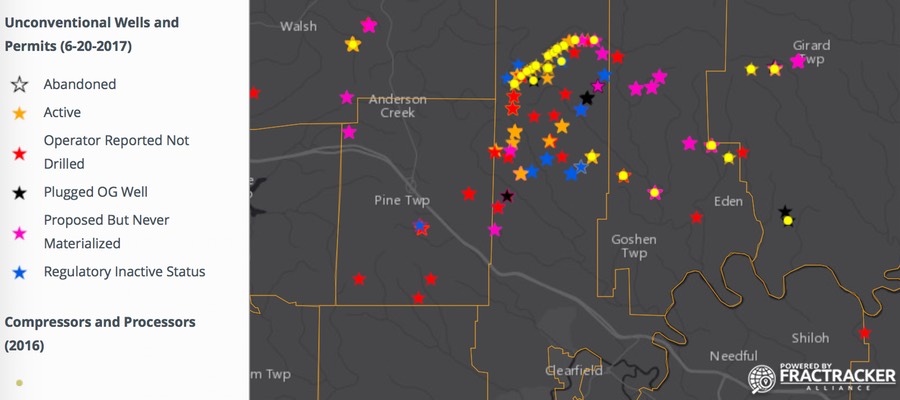
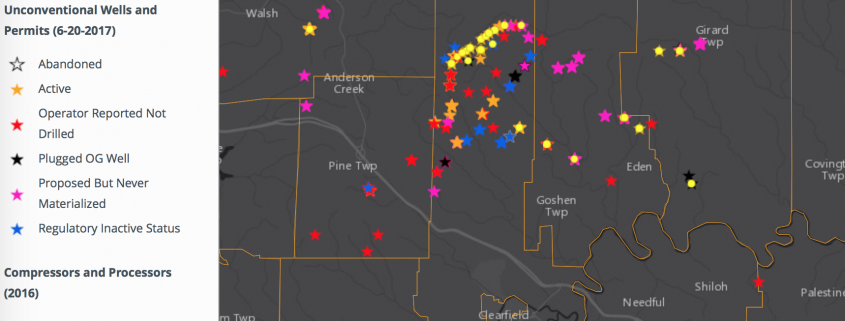
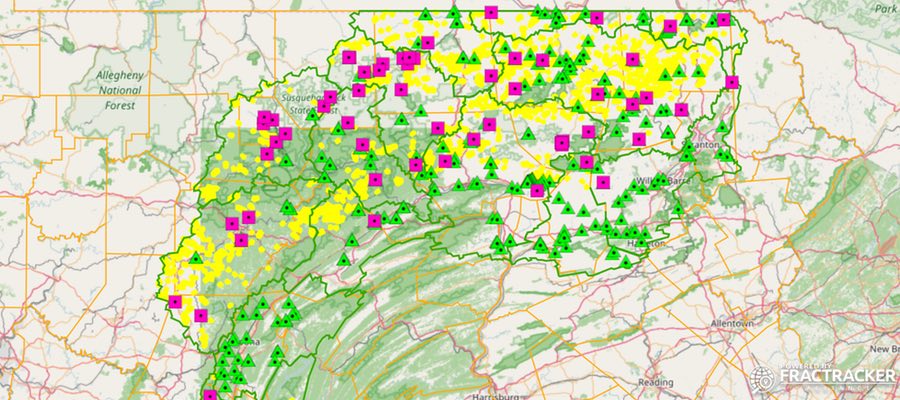
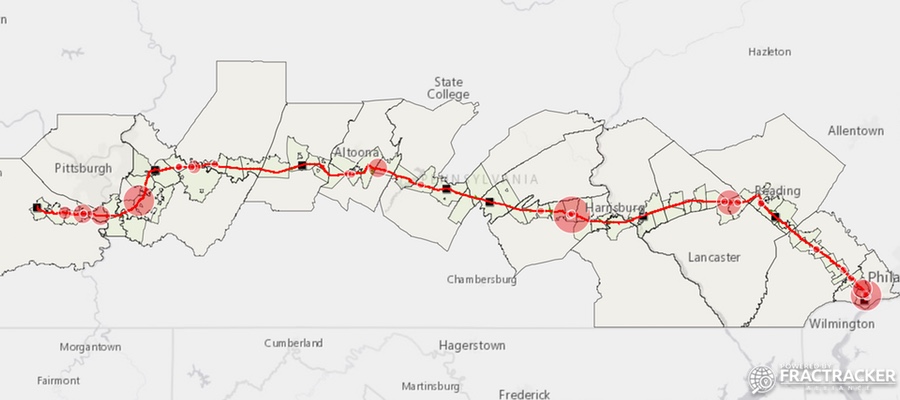
Over the past decade, unconventional oil and gas development has predominantly occurred in areas where shale formations are densest and most productive. For instance, the map below illustrates wells and permits in Southwestern Pennsylvania that track along the Marcellus Shale. An outlier on the map is Allegheny County when compared to its neighbors such as Washington and Greene Counties just to the south—two of the most drilled in the Commonwealth.
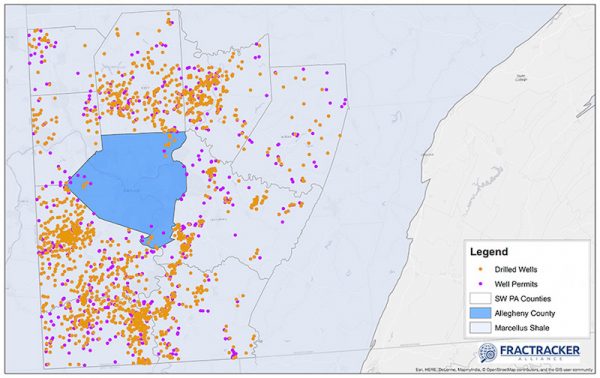
Unconventional wells and permits in Southwest Pennsylvania
A few factors may explain these spatial anomalies. First, oil and gas companies are generally reluctant to operate in heavily populated areas. This is partly due to the complications of acquiring leases and easements in tightly packed communities.
Infrastructure is second consideration. In the absence of compressor stations and midstream pipelines, companies can’t get their product to market.
A third factor is the stronger political opposition often found in urban centers. For example, Pittsburgh’s 2010 fracking ban pushed back against drillers and had a chilling effect in bordering municipalities. Many of Allegheny County’s municipalities have, thus, had the luxury of putting oil and gas-related land use decisions on the back burner. Nevertheless, operators have maintained interest in extracting untapped shale reserves that lie beneath their borders.
Recent Permitting & Drilling Trends
Within Allegheny County, PA, there are now 24 well pads containing a combined 248 permitted wells, of which 109 currently have an active status. On average, these numbers show a 20% increase in well permits annually (40-50 per year) since 2014. This figure compares to less than 10 per year prior to 2012. Furthermore, while only partway through 2017, we’ve already reached this 20% increase in new permits (41 since 8/24), with the overwhelming number of these being issues for Findlay and Forward Townships. A table and graph of permitting activity since 2008 is seen below.
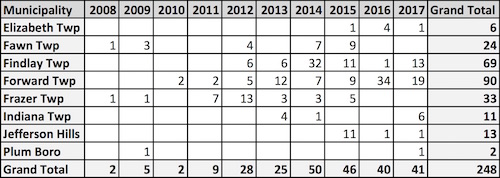
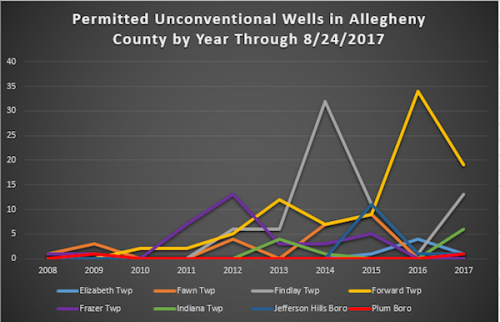
Table and graph of permitted wells in Allegheny County
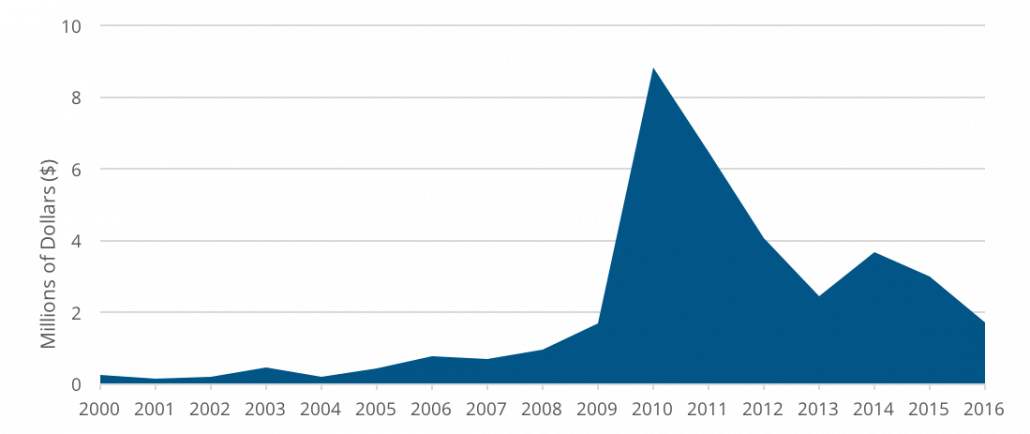
Interestingly, the number of active wells over the past few years does not track with increasing number of permits. In fact, active wells peaked in 2014-2015 and have steadily declined since, as is seen in the table and graph below. We credit these opposing trends to operators placing their wells into inactive status during a period of lower gas prices. Meanwhile, operators are increasing their applications for new wells in preparation for a predicted rebound as well as new pipelines and processing facilities coming online for delivering to new markets.
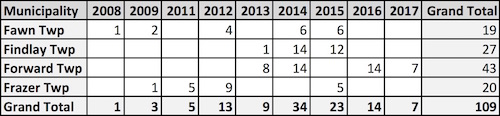
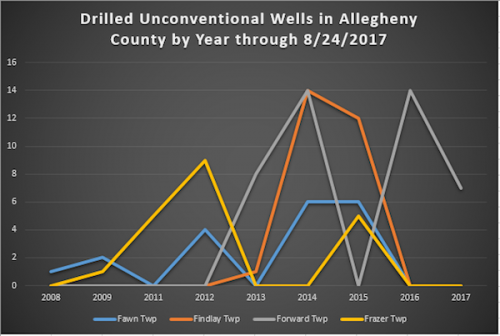
Table and graph of active wells in Allegheny County
Predicting Development: Mineral Rights Leasing
The locations of permits and active wells are not always good indicators of long-term future development. A better picture can be painted with data on properties leased for eventual drilling. In 2016, FracTracker built the Allegheny County Lease Mapping Project, which revealed the extent of oil and gas leasing agreements across the region. From that work came some interesting findings.
There are 467,200 acres in Allegheny County. We found 63,014 acres (18% of the county) are under some kind of oil and gas agreement – this includes mineral rights leases, as well as other agreement such as pipeline rights of ways. It is important to note that as many as 15% of the records we obtained in executing the project could not be mapped due to missing metadata (many block/lot numbers were no longer provided with online records after 2010), so these are conservative estimates.
The list below shows the top five municipalities found to have the most leases. Of note is how West Deer, North Fayette, and Elizabeth townships all have a significant number of leases, but do not yet register in permitting activity.
Most Leased Municipalities in Allegheny County, PA
- West Deer Township (5,325 leases)
- North Fayette Township (5,070 leases)
- Elizabeth Township (4,070 leases)
- Fawn Township (3,872 leases)
- Forward Township (3,801)
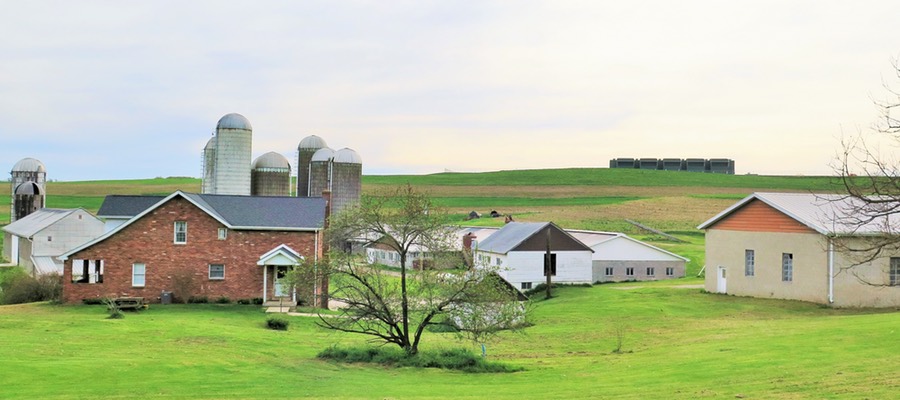
We also discovered that more than 70% of leased properties were zoned residential or agricultural, despite the fact that unconventional oil and gas development is a highly disruptive and industrialized activity. The list below shows a breakdown of zoning designations.
Leased Properties Zoning
-
- Residential (37%)
- Agricultural (34%)
- Commercial (23%)
- Industrial (3%)
- Other (3%)
Status of Protective Zoning
In 2013, the Pennsylvania Supreme Court upended state laws governing local oil and gas zoning rights with its landmark Robinson Township v. Commonwealth of Pennsylvania decision. The court struck down parts of Act 13 that imposed statewide zoning standards for oil and gas development. Zoning ordinances with stronger ordinances are now being adopted by some townships. However, many others have zoning codes that reflect pre-Robinson language, which allows mineral extraction everywhere, regardless of whether it is a compatible land use.
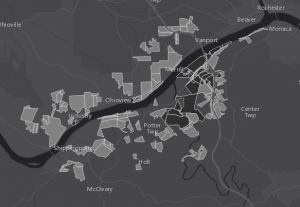
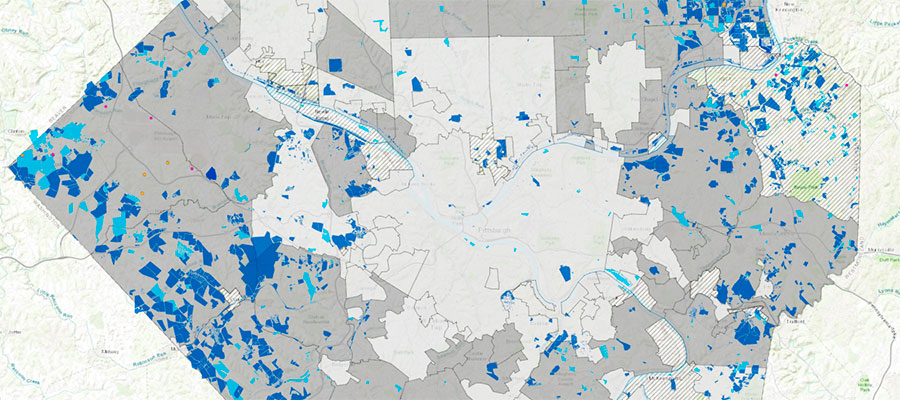
Drawing the connections between drilling trends, leasing activity, and protective zoning is, therefore, significant. Over the past six months, FracTracker has worked with Food & Water Watch to put our lease mapping data and state drilling data in context with assessments of Allegheny County’s municipal oil and gas zoning ordinances. The map below illustrates these overlaps.
Map of Allegheny County Drilling, Leasing, and Zoning
View map fullscreen | How FracTracker maps work
Analysis
Allegheny County contains 130 municipalities. Food & Water Watch was able to obtain and review zoning codes for 104 of these 130. At least 56 municipalities have no zoning ordinances specific to oil and gas development. Of greatest concern, when placed in context with leasing and permitting data, FracTracker found that leases already existed in 43 of these 56 municipalities without oil and gas ordinances, although 8 of these 43 were found to have other less restrictive language regulating specific oil and gas activities, such as seismic testing. Fawn Township, one of the most permitted and most leased municipalities in the county, was found to have no oil and gas zoning ordinance.
Conclusions
It’s important to recognize that there is a significant difference between conventional oil and gas development and today’s heavily industrialized unconventional extraction industry. In many of Allegheny County’s municipalities there seems to be a presumption that there is no need to prepare zoning codes for drilling, despite data that suggest increased oil and gas development may be just around the corner.
With the deeper understanding of Allegheny County’s permitting trends, leasing activities, and the state of protective zoning presented in this article, municipalities would be wise to assess where they stand. Reviewing and updating their respective zoning codes to determine if they sufficiently address concerns related to unconventional drilling could be the most effective way to protect the interests of their residents.
 The Pennsylvania Department of Environmental Protection (DEP) posted information on potential regulatory violations associated with these IRs on the