As an American, you are part owner of 640 million acres of our nation’s shared public lands managed by the federal government. And chances are, you’ve enjoyed a few of these lands on family picnics, weekend hikes or summer camping trips. But did you know that some of your lands may also be leading to toxic air pollution and poor health for you or your neighbors, especially in 5 western states that have high oil and gas drilling activity?
A set of new interactive maps created by FracTracker, The Wilderness Society, and partner groups show the threatened populations who live within a half mile of federal oil and gas wells – people who may be breathing in toxic pollution on a regular basis.
Altogether, air pollution from oil and gas development on public lands threatens at least 73,900 people in the 5 western states we examined. The states, all of which are heavy oil and gas leasing areas, include Colorado, New Mexico, North Dakota, Utah and Wyoming.
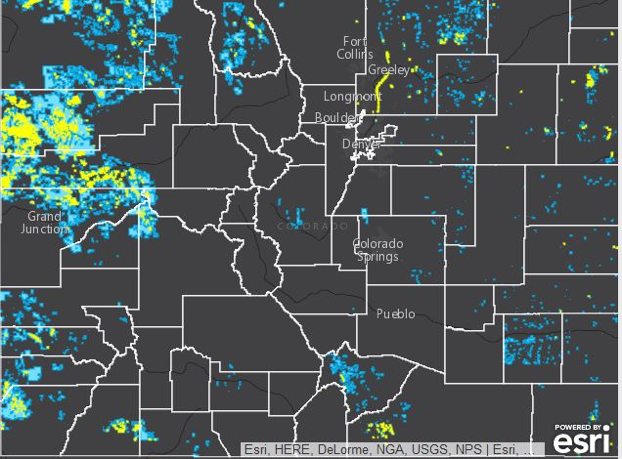
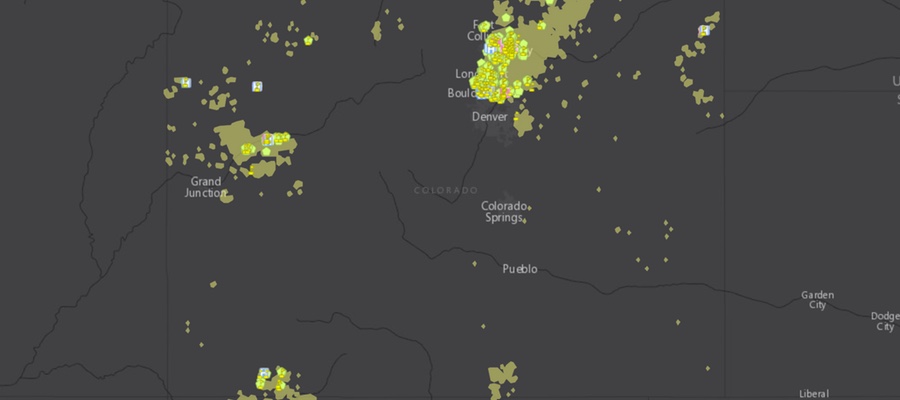
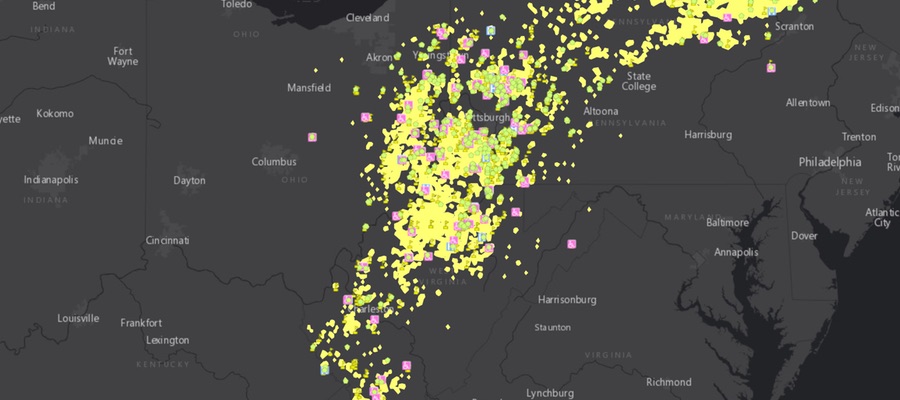
Figure 1. Close up of threat map in Colorado
In each state, the data show populations living near heavy concentrations of wells. For example just northeast of Denver, Colorado, in the heavily populated Weld County, at least 11,000 people are threatened by oil and gas development on public lands (Figure 1).
Western cities, like Farmington, New Mexico; Gillette, Wyoming; and Grand Junction, Colorado are at highest risk of exposure from air pollution. In New Mexico, especially, concentrated oil and gas activity disproportionately affects the disadvantaged and minorities. Many wells can be found near population centers, neighborhoods and even schools.
Colorado: Wells concentrated on Western Slope, Front Range
Note: The threatened population in states are a conservative estimate. It is likely that the numbers affected by air pollution are higher.
In 2014, Colorado became the first state in the nation to try to curb methane pollution from oil and gas operations through comprehensive regulations that included inspections of oil and gas operations and an upgrade in oil and gas infrastructure technology. Colorado’s new regulations are already showing both environmental and financial benefits.
But nearly 16,000 people – the majority living in the northwestern and northeastern part of the state – are still threatened by pollution from oil and gas on public lands.
Many of the people whose health is endangered from pollution are concentrated in the fossil-fuel rich area of the Western Slope, near Grand Junction. In that area, three counties make up 65% of the total area in Colorado threatened by oil and gas development.
In Weld County, just northeast of Denver, more than 11,000 residents are threatened by air pollution from oil and gas production on federal lands. But what’s even more alarming is that five schools are within a half mile radius of wells, putting children at risk on a daily basis of breathing in toxins that are known to increase asthma attacks. Recent studies have shown children miss 500,000 days of school nationally each year due to smog related to oil and gas production.
State regulations in Colorado have helped improve air quality, reduce methane emissions and promote worker care and safety in the past two years, but federal regulations expected by the end of 2016 will have a broader impact by regulating pollution from all states.
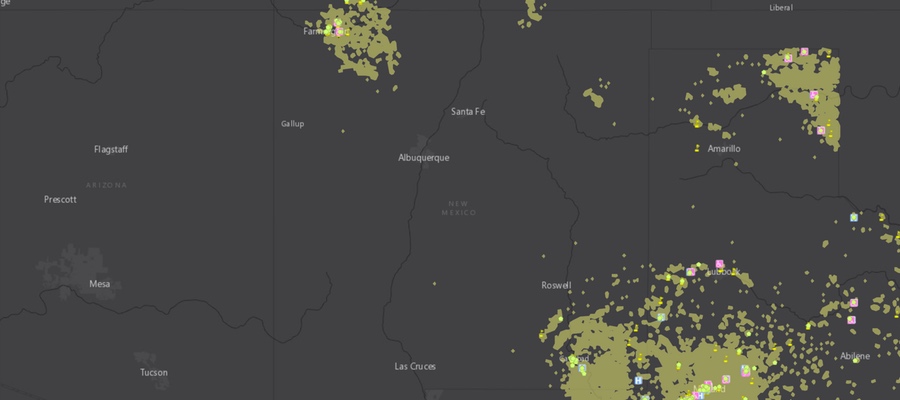
New Mexico: Pollution seen from space threatens 50,000 people
With more than 30,000 wells covering 4.6 million acres, New Mexico is one of the top states for oil and gas wells on public lands. Emissions from oil and gas infrastructure in the Four Corners region are so great, they have formed a methane hot spot that has been extensively studied by NASA and is clearly visible from space.
Nearly 50,000 people in northwestern New Mexico – 40% of the population in San Juan County – live within a half mile of a well.
Dangerous emissions from those wells in San Juan County disproportionately affect minorities and disadvantaged populations, with about 20% Hispanic, almost 40% Native American, and over 20% living in poverty.
Another hot spot of oil and activity is in southeastern New Mexico stretching from the lands surrounding Roswell to the southern border with Texas. Wells in this region also cover the lands outside of Carlsbad Caverns National Park, potentially affecting the air quality and visibility for park visitors. Although less densely populated, another 4,000 people in two counties – with around 50% of the population Hispanic – are threatened by toxic air pollution.
Wyoming: Oil and gas emissions add to coal mining pollution
Pollution from oil and gas development in Wyoming, which has about as many wells as New Mexico, is focused in the Powder River Basin. This region in the northeast of the state provides 40% of the coal produced in the United States.
Oil and gas pollution threatens approximately 4,000 people in this region where scarred landscapes and polluted waterways are also prevalent from coal mining.
With the Obama administration’s current pause on federal coal leasing and a review of the federal coal program underway, stopping pollution from oil and gas on public lands in Wyoming would be a major step in achieving climate goals and preserving the health of local communities.
Utah: Air quality far below federal standards
Utah has almost 9,000 active wells on public lands. Oil and gas activity in Utah has created air quality below federal standards in one-third of Utah’s counties, heightening the risk of asthma and respiratory illnesses. Especially in the Uintah Basin in northeastern Utah – where the majority of oil and development occurs – a 2014 NOAA-led study found oil and gas activity can lead to high levels of ozone in the wintertime that exceed federal standards.
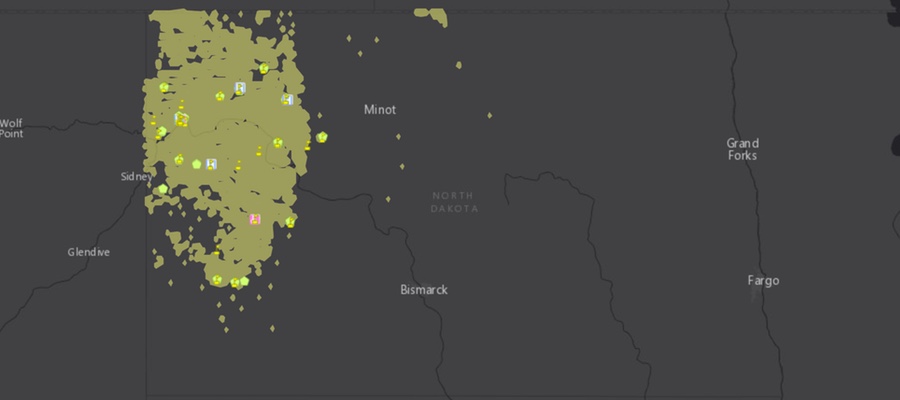
North Dakota: Dark skies threatened by oil and gas activity
The geology of western North Dakota includes the Bakken Formation, one of the largest deposits of oil and gas in the United States. As a result, high oil and gas production occurs on both private and public lands in the western part of the state.
Nearly 650 wells on public lands are clustered together here, directly impacting popular recreational lands like Theodore Roosevelt National Park.
The 70,000-plus-acre park – named after our president who first visited in 1883 and fell in love with the incredible western landscape – is completely surrounded by high oil and gas activity. Although drilling is not allowed in the park, nearby private and public lands are filled with active wells, producing pollution, traffic and noise that can be experienced from the park. Due to its remote location, the park is known for its incredible night sky, but oil and gas development increases air and light pollution, threatening visibility of the Milky Way and other astronomical wonders.
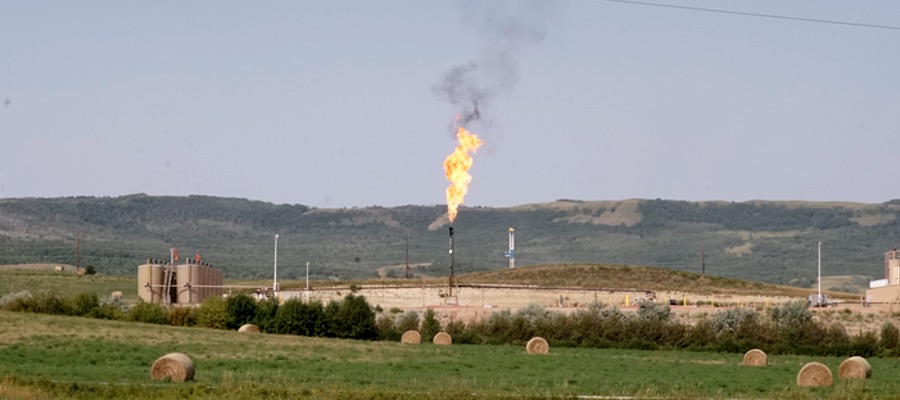
Now that we can see how many thousands of people are threatened by harmful emissions from our public lands, it is more important than ever that we finalize strong federal regulations that will help curb the main pollutant of natural gas – methane – from being leaked, vented, and flared from oil and gas infrastructure on public lands.
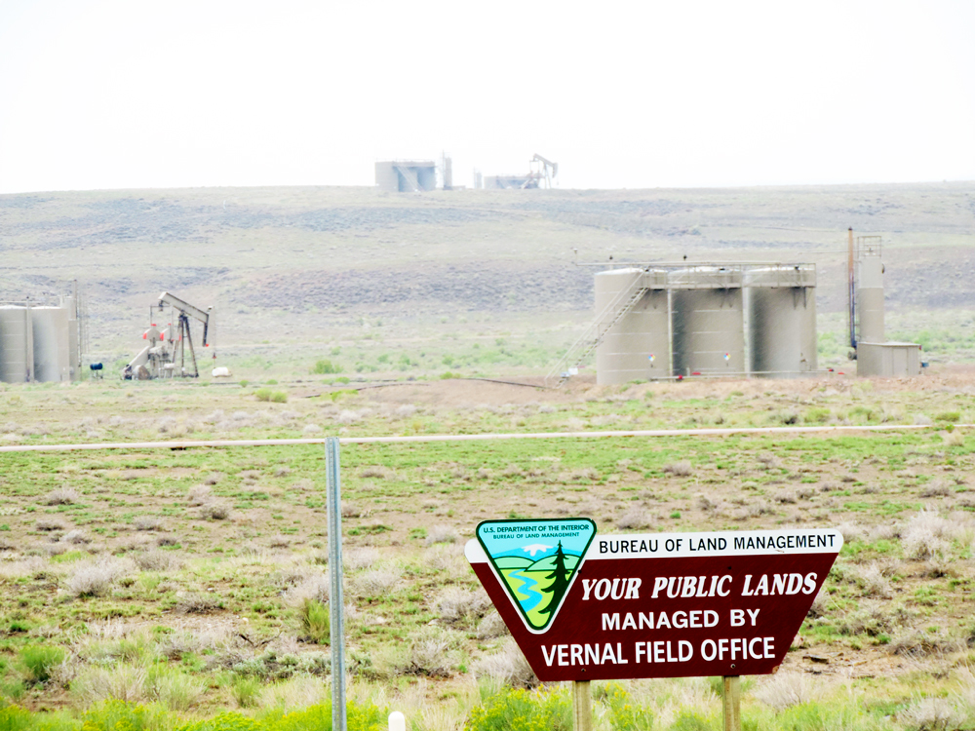
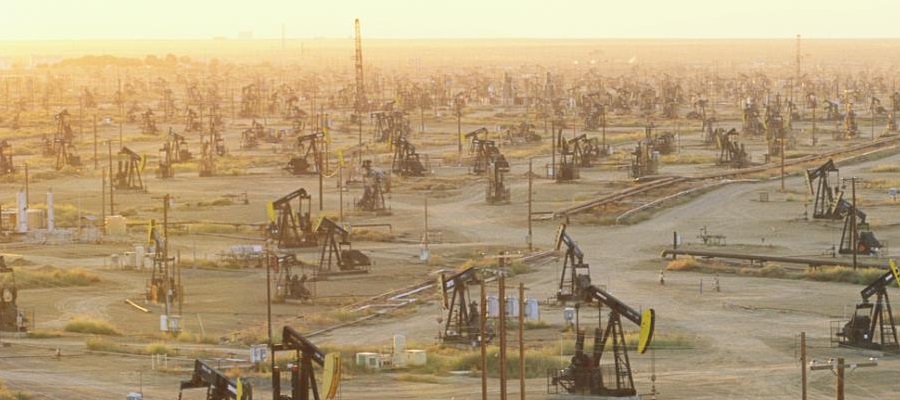
Federal oil and gas wells in western states produce unseen pollution that threatens populations at least a half mile away. Photo: WildEarth Guardians, flickr.
We need to clean up our air now
With U.S. public lands accounting for 1/5 of the greenhouse gas footprint in the United States, we need better regulations to reduce polluting methane emissions from the 96,000 active oil and gas wells on public lands.
Right now, the Bureau of Land Management is finalizing federal regulations that are expected by the end of 2016. These regulations are expected to curb emissions from existing sources – wells already in production – that are a significant source of methane pollution on public lands. This is crucial, since by 2018, it is estimated that nearly 90% of methane emissions will come from sources that existed in 2011.
Final regulations from the Bureau of Land Management will also add to other regulations from the EPA and guidance from the Obama administration to modernize energy development on public lands for the benefit of the American people, landscapes and the climate. In the face of a changing climate, we need to continue to monitor fossil fuel development on public lands and continue to push the government towards better protections for land, air, wildlife and local communities.
By The Wilderness Society – The Wilderness Society is the leading conservation organization working to protect wilderness and inspire Americans to care for our wild places. Founded in 1935, and now with more than 700,000 members and supporters, The Wilderness Society has led the effort to permanently protect 109 million acres of wilderness and to ensure sound management of our shared national lands.
https://www.fractracker.org/a5ej20sjfwe/wp-content/uploads/2016/10/ProdPublicLand-Feature.jpg400900Guest Authorhttps://www.fractracker.org/a5ej20sjfwe/wp-content/uploads/2025/09/2025-Wordmark-Logo.pngGuest Author2016-10-31 09:00:302021-04-15 15:04:23Interactive maps show nearness of oil and gas wells to communities in 5 states
North Dakota is now in its third oil boom due to the drilling technologies of horizontal drilling and hydraulic fracturing that have made once-inaccessible oil accessible. The Bakken formation covers western North Dakota, eastern Montana, and parts of Manitoba and Saskatchewan. At the height of the boom in 2014, just under 12,000 wells were active across the west, extracting 1.1 million barrels (bbl) of oil per day and flaring at 32%. The boom has bumped North Dakota to the second largest oil and gas producing state, second only to Texas.
Dakota Resource Council (DRC) is a member-led, grassroots organization that has been working in extraction-impacted communities in North Dakota since 1978. DRC’s members work on oil and gas campaigns that aim to eliminate impacts to land, air, water, and livelihoods of the citizens of North Dakota. Campaign issues on oil and gas industry damage include: flaring, pipelines, radioactive/oilfield waste, state accountability, and oil-by-rail.
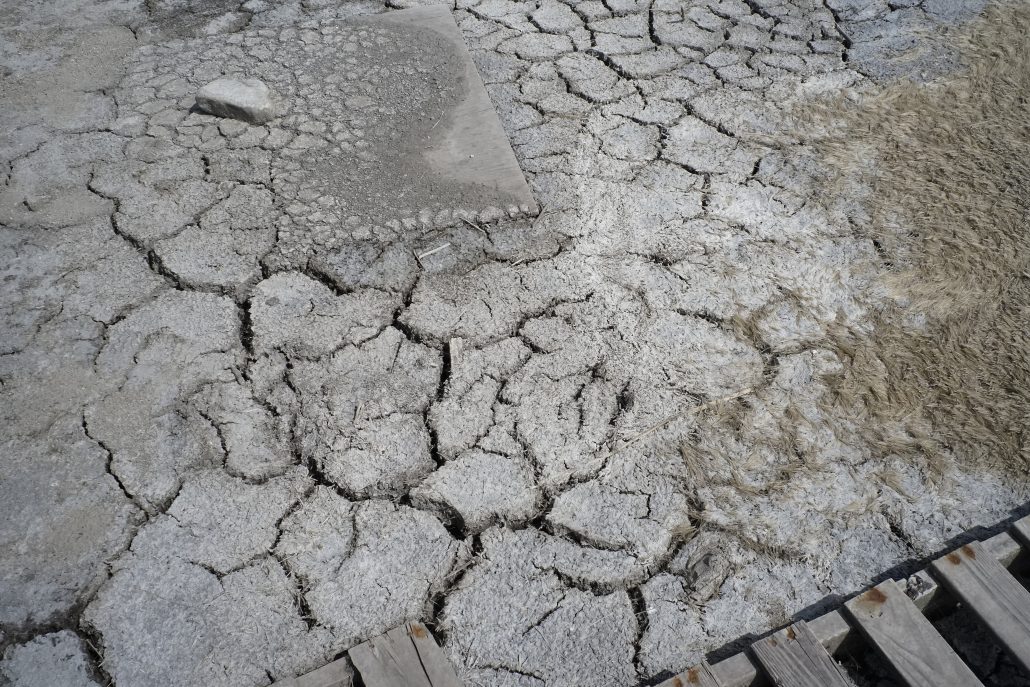
The following photos from DRC show impacts of current and legacy oil and gas extraction in western North Dakota – an area in the heart of the Bakken that is historically a rich agricultural and ranching region. The vast contrast between the two industries are not complementary.
Bear Den Bay Incident
Fort Berthold Indian Reservation is the epicenter of fracking in the Bakken. On July 8, 2014 a wastewater pipeline rupture was accidentally discovered in rural Mandaree on the reservation. The pipeline is owned by Crestwood Midstream, LLC – a Texas-based company.
An estimated 1 million gallons of toxic saltwater ran down a ravine, ending up in the tributary of Bear Den Bay, which is located ¼ mile from the city of Mandaree’s water intake. The spill was contained, but the state doesn’t know exactly how much waste went into the bay. Tribal administration released a statement that beaver dams prevented the fluids from reaching the lake.
Weeks after the incident Crestwood released a statement saying:
… while assessment of the effect is ongoing, examination and testing to date show that an area of grass, brush and trees about 200 yards long sustained damage. Some produced water ran down a ravine into natural pools in a small stream at the bottom, but it appears that the produced water stopped there… The impact on fish and wildlife appears to have been minimal, in fact beavers, turtles, frogs, deer and pelicans have been seen returning to and re-inhabiting the impacted area.
To date, there has been no penalty for the damage that has been done to the land and reclamation is ongoing. Below are photos documenting the incident’s effects:
Western North Dakota has weathered through two previous oil booms in the early 1950’s and 1980’s. Previous booms left behind infrastructure that sits abandoned today. Due to hydraulic fracking technology, once-inaccessible oil is now accessible. These pre-existing wells are called legacy wells, that produce roughly 5% of North Dakota’s 1.2 million barrels per day.
Much of these wells contain infrastructure that has been in place for over 60 years. Pipelines have not been mapped or regulated in North Dakota until recently. Farmers are finding underground tanks and pipelines filled with toxic sludge. Just like previous oil booms, North Dakota was not prepared for the cost of extraction. Scroll through the following gallery showing a variety of legacy sites in ND.
https://www.fractracker.org/a5ej20sjfwe/wp-content/uploads/2016/10/ND-Flaring-DRC-Feature.jpg400900Guest Authorhttps://www.fractracker.org/a5ej20sjfwe/wp-content/uploads/2025/09/2025-Wordmark-Logo.pngGuest Author2016-10-20 11:10:332021-04-15 15:04:23Documenting Oil and Gas Industry Damage in North Dakota
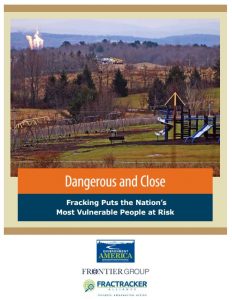
Cover of Dangerous and Close report. Click to view report
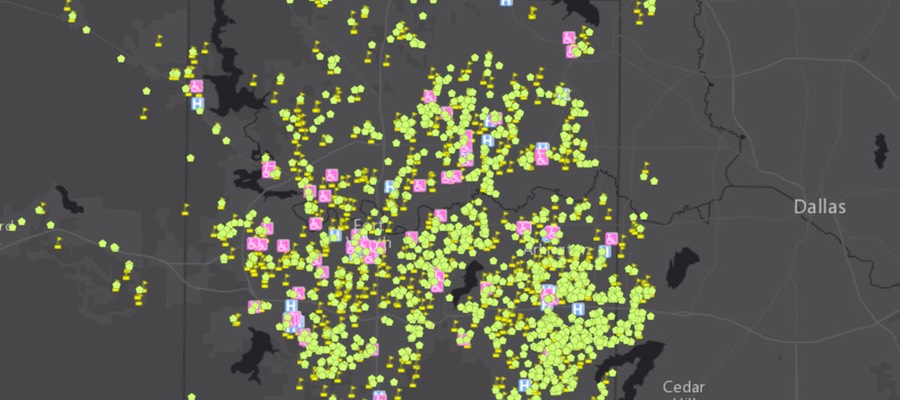
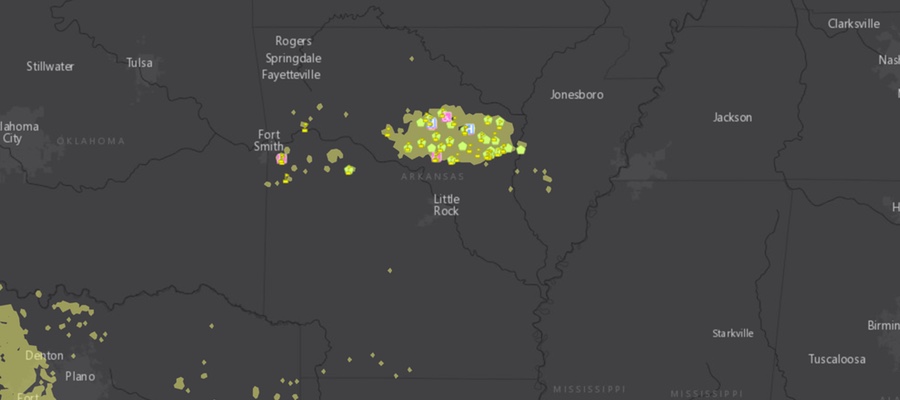
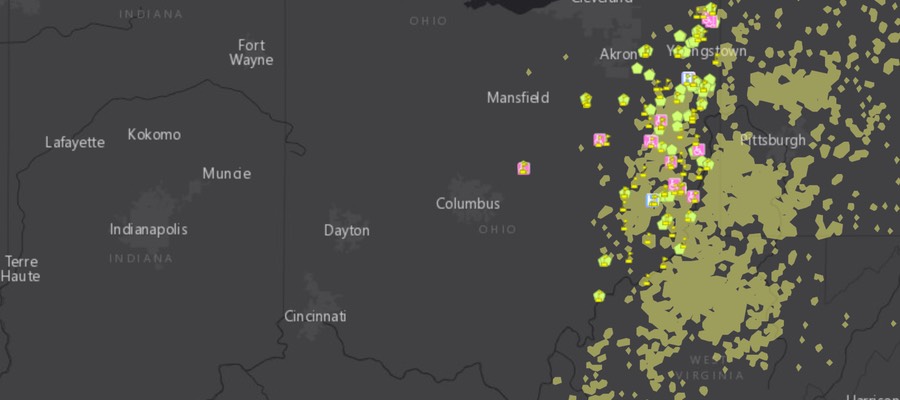
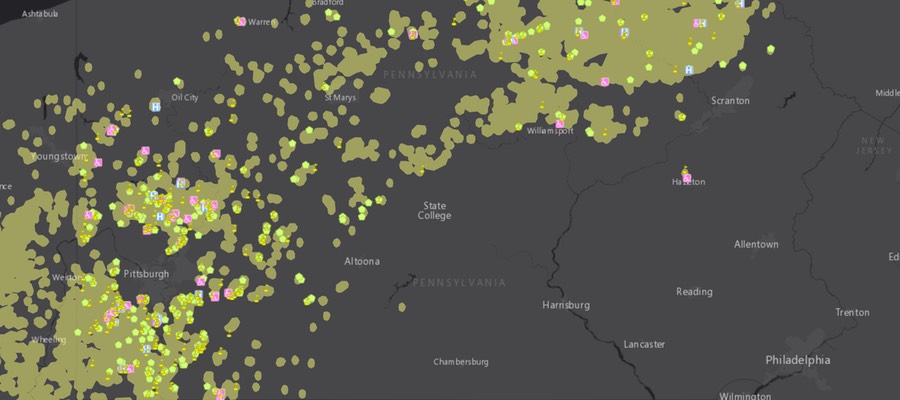
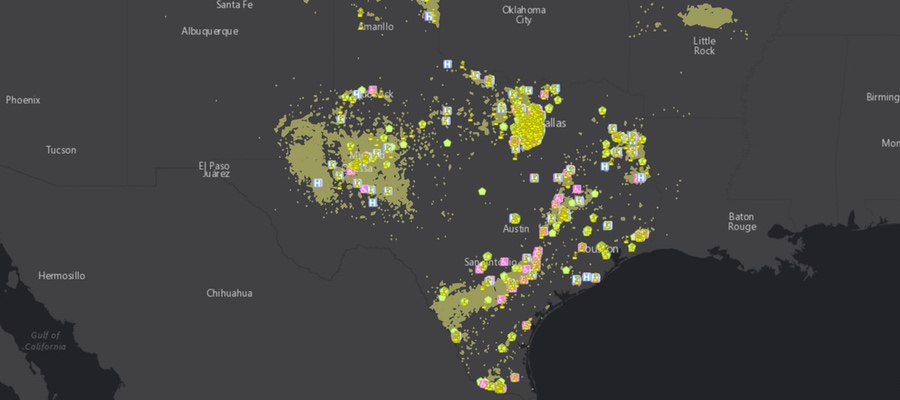
FracTracker Alliance has been working with the Frontier Group and Environment America on a nationwide assessment of “fracked” oil and gas wells. The report is titled Dangerous and Close, Fracking Puts the Nation’s Most Vulnerable People at Risk. The assessment analyzed the locations of fracked wells and identified where the fracking has occurred near locations where sensitive populations are commonly located. These sensitive sites include schools and daycare facilities because they house children, hospitals because the sick are not able to fight off pollution as effectively, and nursing homes where the elderly need and deserve clean environments so that they can be healthy, as well. The analysis used data on fracked wells from regulatory agencies and FracFocus in nine states. Maps of these nine states, as well as a full national map are shown below.
No one deserves to suffer the environmental degradation that can accompany oil and gas development – particularly “fracking” – in their neighborhoods. Fracked oil and gas wells are shown to have contaminated drinking water, degrade air quality, and sicken both aquatic and terrestrial ecosystems. Additionally, everybody responds differently to environmental pollutants, and some people are much more sensitive than others. In fact, certain sects of the population are known to be more sensitive in general, and exposure to pollution is much more dangerous for them. These communities and populations need to be protected from the burdens of industries, such as fracking for oil and gas, that have a negative effect on their environment. Commonly identified sensitive groups or “receptors” include children, the immuno-compromised and ill, and the elderly. These groups are the focus of this new research.
National Map
National interactive map of sensitive receptors near fracked wells
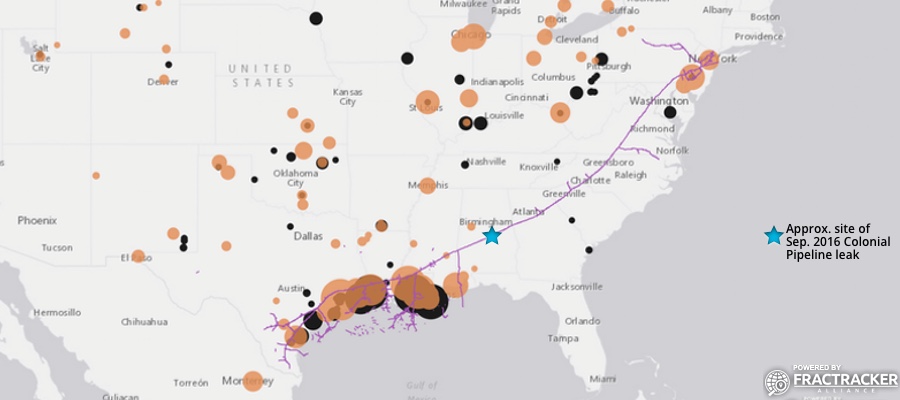
On September 9, 2016 a pipeline leak was detected from the Colonial Pipeline by a mine inspector in Shelby County, Alabama. It is estimated to have spilled ~336,000 gallons of gasoline, resulting in the shutdown of a major part of America’s gasoline distribution system. As such, we thought it timely to provide some data and a map on the Colonial Pipeline Project.
Figure 1. Dynamic map of Colonial Pipeline route and related infrastructure
The Colonial Pipeline was built in 1963, with some segments dating back to at least 1954. Colonial carries gasoline and other refined petroleum projects throughout the South and Eastern U.S. – originating at Houston, Texas and terminating at the Port of New York and New Jersey. This ~5,000-mile pipeline travels through 12 states and the Gulf of Mexico at one point. According to available data, prior to the September 2016 incident for which the cause is still not known, roughly 113,382 gallons had been released from the Colonial Pipeline in 125 separate incidents since 2010 (Table 1).
Table 1. Reported Colonial Pipeline incident impacts by state, between 3/24/10 and 7/25/16
State
Incidents (#)
Barrels* Released
Total Cost ($)
AL
10
91.49
2,718,683
GA
11
132.38
1,283,406
LA
23
86.05
1,002,379
MD
6
4.43
27,862
MS
6
27.36
299,738
NC
15
382.76
3,453,298
NJ
7
7.81
255,124
NY
2
27.71
88,426
PA
1
0.88
28,075
SC
9
1639.26
4,779,536
TN
2
90.2
1,326,300
TX
19
74.34
1,398,513
VA
14
134.89
15,153,471
Total**
125
2699.56
31,814,811
*1 Barrel = 42 U.S. Gallons
** The total amount of petroleum products spilled from the Colonial Pipeline in this time frame equates to roughly 113,382 gallons. This figure does not include the September 2016 spill of ~336,000 gallons.
Unfortunately, the Colonial Pipeline has also been the source of South Carolina’s largest pipeline spill. The incident occurred in 1996 near Fork Shoals, South Carolina and spilled nearly 1 million gallons of fuel into the Reedy River. The September 2016 spill has not reached any major waterways or protected ecological areas, to-date.
Additional Details
Owners of the pipeline include Koch Industries, South Korea’s National Pension Service and Kohlberg Kravis Roberts, Caisse de dépôt et placement du Québec, Royal Dutch Shell, and Industry Funds Management.
For more details about the Colonial Pipeline, see Table 2.
Table 2. Specifications of the Colonial and/or Intercontinental pipeline
https://www.fractracker.org/a5ej20sjfwe/wp-content/uploads/2016/09/ColonialPipeline-Feature.jpg400900FracTracker Alliancehttps://www.fractracker.org/a5ej20sjfwe/wp-content/uploads/2025/09/2025-Wordmark-Logo.pngFracTracker Alliance2016-09-26 13:35:032021-04-15 15:04:25A Proper Picture of the Colonial Pipeline’s Past
FracTracker has been increasingly looking at oil and gas drilling in Colorado, and we’re finding some interesting and concerning issues to highlight. Firstly, operators in Colorado are not required to report volumes of water use or freshwater sources. Additionally, this analysis looked at how wastewater in Colorado is injected, and found that the majority is injected into Class II disposal wells (85%) while recycling wastewater is not common. Open-air pits for evaporation and percolation of wastewater is still a common practice. Colorado has at least 340 zones granted aquifer exemptions from the Clean Water Act for injecting wastewater into groundwater. The analysis also found that Weld County produces the most oil and gas in the state, while Rio Blanco and Las Animas counties produce more wastewater. And finally, Rio Blanco injects the most wastewater of all Colorado counties. Learn more about groundwater threats in Colorado below:
Introduction
Working directly with communities in Weld County, Colorado the FracTracker Alliance has identified issues concerning oil and gas exploration and production in Colorado that are of particular concern to community stakeholder groups. The issues include air quality degradation, environmental justice concerns for communities most impacted by oil and gas extraction, and leasing of federal mineral estates. Analysis of data for Colorado’s Front Range has identified areas where setback regulations are not followed or are inadequate to provide sufficient protections for individuals and communities and our analysis of floodplains shows where oil and gas operations pose a significant risk to watersheds. In this article we focus on the specific threat to groundwater resources as a result of particular waste disposal methods, namely underground injection and land application in disposal pits and sumps. We also focus on the sources of the immense amount of water necessary for fracking and other extraction processes.
Groundwater Threats
Numerous threats to groundwater are associated with oil and gas drilling, including hydraulic fracturing. Research from other regions shows that the majority of groundwater contamination events actually occur from on-site spills and poor management and disposal of wastes. Disposal and storage sites and spill events can allow the liquid and solid wastes to leach and seep into groundwater sources. There have been many groundwater contamination events documented to have occurred in this manner. For example, in 2013, flooding in Colorado inundated a main center of the state’s drilling industry causing over 37,380 gallons of oil to be spilled from ruptured pipelines and damaged storage tanks that were located in flood-prone areas. There are serious concerns that the oil-laced floodwaters have permanently contaminated groundwater, soil, and rivers.
Waste Management
In Colorado, wastes are managed several ways. If the wastewater is not recycled and used again in other production processes such as hydraulic fracturing, drilling fluids disposal must follow one of three rules:
Additionally the wastes can be dried and buried in additional drilling pits, with restrictions for crop land. For oily wastes, those containing crude oil, condensate or other “hydrocarbon-containing exploration and production waste,” there are additional land application restrictions that mostly require prior removal of free oil. These various sites and facilities are mapped below, along with aquifer exemptions and other map layers related to water quality.
Figure 1. Interactive map of groundwater threats in Colorado
In 2015, Colorado injected a total of 649,370,514 barrels of oil and gas wastewater back into the ground. That is 27,273,561,588 gallons, which would fill over 41,000 Olympic sized swimming pools. Injected into the ground in deep formations, this water is forever removed from the water cycle.
Allowable injection fluids include a variety of things you do not want to drink:
Produced Water
Drilling Fluids
Spent Well Treatment or Stimulation Fluids
Pigging (Pipeline Cleaning) Wastes
Rig Wash
Gas Plant Wastes such as:
Amine
Cooling Tower Blowdown
Tank Bottoms
This means that federal exemptions to Underground Injection Control (UIC) regulations for oil and gas exploration and production have nothing to do with environmental chemistry and risk, and only consider fluid source.
Why the concern?
Why are we concerned about these wastes? To quote the regulation, “it is possible for an exempt waste and a non-exempt hazardous waste to be chemically very similar” (RCRA). Since oil and gas development is considered part of the United State’s strategic energy policy, the entire industry is exempt from many federal regulations, such as the Safe Drinking Water Act (SDWA), which protects underground sources of drinking water (USDW).
The Colorado Oil and Gas Conservation Commission has primacy over the UIC permits and the Colorado Department of Public Health and Environment (CDPHE) administers the environmental protection laws related to air quality, waste discharge to surface water, and commercial disposal facilities. Under the UIC program, operators are legally allowed to inject wastewater containing heavy metals, hydrocarbons, radioactive elements, and other toxic and carcinogenic chemicals into groundwater aquifers.
The State of CO Injection Wells
According to the COGCC production reports for the year 2015, there are 9,591 active injection wells with volumes reported to the regulatory agency. Additionally, there are of course distinctions within the UIC rules for different types of injection wells, although the COGCC does not provide comprehensive data to distinguish between these types.
Injecting into the same geological formation or “zone” as producing wells is typically considered EOR, although some of the injected water will ultimately remain in the ground. Injecting into a producing formation is an immediate qualification for receiving an aquifer exemption.
EOR operations require considerably more energy and resources than conventional wells, and therefore have a higher water carbon footprint. If the wastewater is “recycled” as hydraulic fracturing fluid, the injections are exempt from all UIC regulations regardless. These are two options for the elimination of produced wastewater, although much of it will return to the surface in the future along with other formation waters. When the produced waters reach a certain level of salinity the fluid can no longer be used in enhanced recovery or stimulation, so final disposal of wastewater is typically necessary. These liquid wastes may then go to UIC Class II Disposal Wells.
Class II Injection Wells
The wells injecting into non-producing formations are therefore disposal wells, since they are not “enhancing production.” Of the almost 10,000 active injection wells in Colorado there are OVER 670 class II disposal well facilities; 402 facilities are listed as currently active. These facilities may or may not host multiple wells. By filtering the COGCC production and injection well database by target formation, we find that there are over 1,070 wells injecting into non-producing formations. These disposal wells injected at least 66,193,874 barrels (2,780,142,708 gallons) of wastewater in 2015 alone.
Where is the waste going?
A simple life-cycle assessment of wastewater in Colorado shows that the majority of produced water is injected back underground into class II disposal and EOR wells. The percentage of injected produced waters has been increasing since 2012, and in 2015 85% of the total volume of produced water in 2015 was injected.
If we assume that all the volume injected was produced wastewater, this still leaves 60 million barrels of produced water unaccounted for. Some of this volume may have been recycled and used for hydraulic fracturing, but this is rarely the case. Other options for disposal include commercial oilfield wastewater disposal facilities (COWDF) that use wastewater sumps (pits) for evaporation and percolation, as well as land application, to dilute the solid and liquid wastes by mixing them into soil.
Centralized Exploration and Production Waste Management Facilities
Figure 2. Chevron Wastewater Land Application and Pit “Disposal” Facility. Photo by COGCC
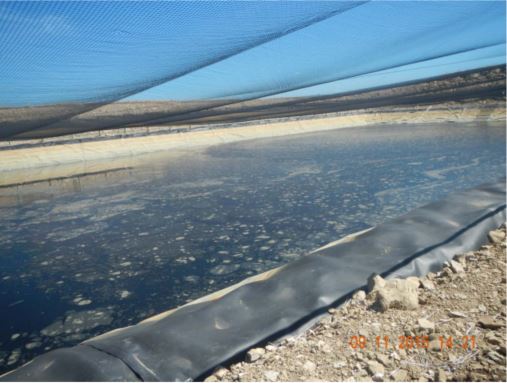
As can be seen in the Figure 2 to the right, land application sites are little more than farms that don’t grow anything, where wastewater is mixed with soil. Groundwater monitoring wells around these sites measure the levels of some contaminants. Inspection reports show that sampling of the wastewater is not usually – if ever – conducted. The only regulatory requirement is that oil is not visibly noticeable as a sheen on the wastewater fluids in impoundments, such as the one in Figure 3 below, operated by Linn Operating Inc., which is covered in an oily sheen.
In most other hydrocarbon producing states, open-air pits or sumps are not allowed for a variety of reasons. At FracTracker, we have covered this issue in other states, as well. In New Mexico, for example, the regulatory agency outlawed the use of pits after finding cased where 369 pits were documented to have contaminated groundwater. California is another state that still uses above ground pits for disposal. At sites in California, plumes of contaminants are being monitored as they spread from the facilities into surrounding regions of groundwater. Additionally, these wastewater pit disposal sites present hazards for birds and wildlife. There have been a number of papers documenting bird deaths in pits, and the risk for migratory bird species is of high concern. Other states like California are struggling with the issue of closing these types of open-air pit facilities. Closing these facilities means that more wastewater will be injected in Class II disposal wells.
Figure 3. Linn energy oily wastewater disposal pit
Production and Injection Volumes
The data published by the COGCC for well production and injection volumes shows some unique trends. An analysis of injection and production well volumes shows Class II Injection is tightly connected to exploration and production activities. This finding is not surprising. Class II injection wells are considered a support operation for the production wells, and therefore should be expected to be similarly related. Wastewater injection wells are needed where oil and gas extraction is occurring, particularly during the exploration and drilling phases.
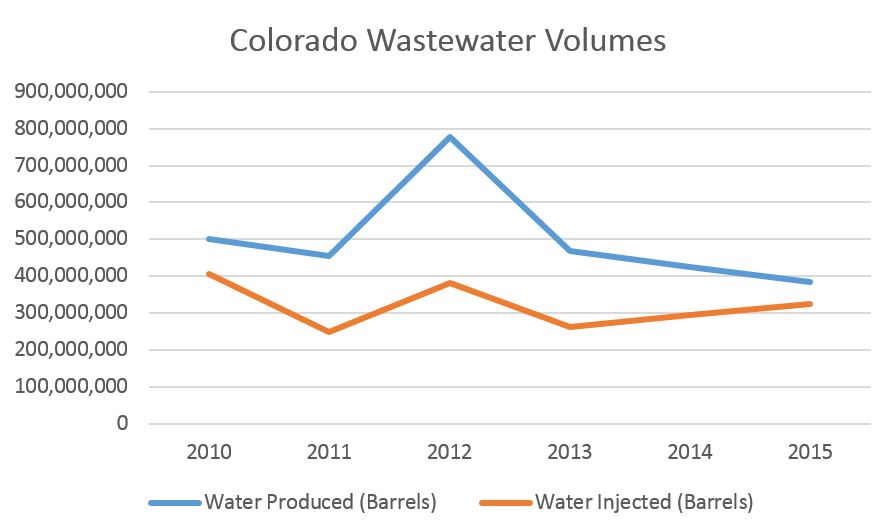
Looking at the graphs in Figures 4-6 below, it is obvious that injection volumes have been consistently tied to production of wastewater. It is also clear that the trend since 2012 shows that an increasingly larger percentage of wastewater is being injected each year. This trend follows the sharp increase in high volume hydraulic fracturing activity that occurred in 2012. During this boom in exploration and drilling activity, recycling of flowback for additional hydraulic fracturing activities most likely accounts for some of the discrepancy in accounting for the fact that 200% more wastewater was produced than was injected in 2012.
When Figure 4 (below) is compared to the graphs in Figures 5 and 6 (further below) it is also interesting to note that produced water volumes in 2015 are at a 5-year low as of 2015, while production volumes of both natural gas and oil are at a 5-year high. Wastewater volumes are linked to production volumes, but there are many other factors, including geological conditions and types of extraction technologies being used, that have a massive affect on wastewater volumes.
Figure 4. Colorado wastewater volumes by year (barrels)
The graphs in Figures 5 and 6 below show different trends. Gas production in Colorado has remained relatively constant over the last five years with a sharp increase in 2015, while oil production volumes have been continually increasing, with the largest increase of 49% from 2014 to 2015, and 46% the year prior.
Figures 5-6
Colorado’s Front Range, specifically Weld County, is increasing oil production at a fast rate. New multi-well well-pads are being permitted in neighborhoods and urban and suburban communities without consideration for even elementary schools. Weld County currently has 2,169 new wells permitted within the county. The figure is higher than the next 9 counties combined. The other top three counties with the most well permits are 2. Garfield (1,130) and 3. Rio Blanco (189), for perspective. Additionally, 74% of pending permits for new wells are located in Weld County.
How Counties Compare
The top 10 counties for oil production are very similar to the top 10 counties for both produced and injected volumes, although there are some inconsistencies (Table 1). For example, Las Animas County produces the second largest amount of produced wastewater, but is not in the top 10 of oil producing counties. This is because the majority of wells in Las Animas County produce natural gas. Natural gas wells do not typically produce as much wastewater as oil wells. The counties and areas with the most oil and gas production are also the regions with the most injection and surface waste disposal, and therefore surface water and groundwater degradation.
Table 1. Top 10 CO counties for gas production, oil production, wastewater production, and injection volumes in 2015.
Gas Production
Oil Production
Wastewater Production
Injection Volumes
Rank
County
Gas1
County
Oil2
County
Water2
County
Water2
1
Weld
568,919,168
Weld
112,898,400
Rio Blanco
113,132,037
Rio Blanco
138,502,742
2
Garfield
556,855,359
Rio Blanco
4,412,578
Las Animas
45,868,907
Weld
50,360,796
3
La Plata
322,029,940
Gardield
1,744,900
Weld
37,665,571
Garfield
29,022,147
4
Las Animas
78,947,042
Araahoe
1,661,204
Garfield
34,704,673
La Plata
23,211,646
5
Rio Blanco
57,284,876
Lincoln
1,194,435
Washington
25,075,998
Washington
15,105,886
6
Mesa
32,200,936
Cheyenne
1,192,162
La Plata
23,352,861
Las Animas
13,706,555
7
Yuma
25,960,947
Adams
664,530
Cheyenne
9,326,944
Cheyenne
10,309,413
8
Archuleta
13,648,006
Moffat
419,893
Moffat
7,712,323
Logan
5,930,937
9
Moffat
13,610,219
Washington
413,603
Logan
5,606,828
Mesa
5,611,075
10
Gunnison
4,805,541
Jackson
407,537
Morgan
4,197,849
La Plata
4,992,391
1. Units are in MCF = Thousand cubic feet of natural gas;
2. Units are in Barrels
Aquifer Exemptions
Operators are given permission by the U.S. EPA to inject wastewater into groundwater aquifers in certain locations where groundwater formations are particularly degraded or when operators are granted aquifer exemptions. Aquifer exemptions are not regions where the groundwater is not suitable for use as drinking water. Quite the contrary, as any aquifer with groundwaters above a 10,000 ppm total dissolved solids (TDS) threshold are fast-tracked for injection permits. When the TDS is below 10,000 ppm operators can apply for an exemption from SDWA (safe drinking water act) for USDWs (underground sources of drinking water), which otherwise protects these groundwater sources. An exemption can be granted for any of the following three reasons. The formation is:
hydrocarbon producing,
too deep to economically access, or
too “contaminated” to economically treat.
Since the first requirement is enough to satisfy an exemption, most class II wells are located within oil and gas fields. Other considerations include approval of mineral owners’ permissions within ¼ mile of the well. On the map above, you can see the ¼ mile buffers around active injection wells. If you live in Colorado, and suspect you live within the ¼ mile buffer of an injection well, you can input an address into the search field in the top-right corner of the map to fly to that location.
Sources of Water
The economic driver for increasing wastewater recycling is mostly influenced by two factors. First, states with many class II disposal wells, like Colorado, have much lower costs for wastewater disposal than states like Pennsylvania, for example. Additionally, the cost of water in drought-stricken states makes re-use more economically advantageous.
These two factors are not weighted evenly, though. On the Colorado front range, water scarcity should make recycling and reuse of treated wastewater a common practice. The stress of sourcing fresh water has not yet become a finanacial restraint for exploration and production. Water scarcity is an issue, but not enough to motivate operators to recycle. According to an article by Small, Xochitl T (2015) “Geologic factors that impact cost, such as water quality and availability of disposal methods, have a greater impact on decisions to recycle wastewater from hydraulic fracturing than water scarcity.” As long as it is cheaper to permit new injection wells and contaminate potential USDW’s than to treat the wastewater, recycling practices will be largely ignored. Even in Colorado’s arid Front Range where the demand for freshwater frequently outpaces supply, recycling is still not common.
Fresh Water Use
The majority of water used for hydraulic fracturing is freshwater, and much of it is supplied from municipal water systems. There are several proposals for engineering projects in Colorado to redirect flows from rivers to the specific municipalities that are selling water to oil and gas operators. These projects will divert more water from the already stressed watersheds, and permanently remove it from the water cycle.
The Windy Gap Firming Project, for example, plans to dam the Upper Colorado River to divert almost 10 billion gallons to six Front Range cities including Loveland, Longmont, and Greeley. These three cities have sold water to operators for fracking operations. Greeley in particular began selling 1,500 acre-feet (500 million gallons) to operators in 2011 and that has only increased . The same thing is happening in Fort Lupton, Frederick, Firestone, and in other communities. Additionally, the Northern Integrated Supply Project proposes to drain an additional 40,000 acre feet/year (13 billion gallons) out of the Cache la Poudre River northwest of Fort Collins. The Seaman Reservoir Project by the City of Greeley on the North Fork of the Cache la Poudre River proposes to drain several thousand acre feet of water out of the North Fork and the main stem of the Cache la Poudre. And finally, the Flaming Gorge Pipeline would take up to 250,000 acre feet/year (81 billion gallons) out of the Green and Colorado Rivers systems, among others.
Other Water Sources
Unfortunately, not much more is known about sources and amounts of water for used for fracking or other oil and gas development operations. Such a data gap seems ridiculous considering the strain on freshwater sources in eastern Colorado and the Front Range, but regulators do not require operators to obtain permits or even report the sources of water they use. Legislative efforts to require such reporting were unsuccessful in 2012.
Now that development and fracking operations are continuously moving into urban and residential areas and neighborhoods, sourcing water will be as easy as going to the nearest fire hydrant. Allowing oil and gas operators to use municipal water sources raises concerns of conflicts of interest and governmental corruption considering public water systems are subsidized by local taxpayers, not well sites.
Conclusions
In Colorado, exploration and drilling for oil and natural gas continues to increase at a fast pace, while the increase in oil production is quite staggering. As this trend continues, the waste stream will continue to grow with production. This means more Class II injection wells and other treatment and disposal options will be necessary.
While other states are working to end the practices that have a track record of surface water and groundwater contamination, Colorado is issuing new permits. Colorado has issued 7 permits for CEPWMF’s in 2016 alone, some of them renewals. While there aren’t any eco-friendly methods of dealing with all the wastewater, the use of pits and land application presents high risk for shallow groundwater aquifers. In addition, sacrificing deep groundwater aquifers with aquifer exemptions is not a sustainable solution. These are important considerations beyond the obvious contribution of carbon dioxide and methane to the issue of climate change when considering the many reasons why hydrocarbon fuels need to be eliminated in favor of clean energy alternatives.
By Kyle Ferrar, Western Program Coordinator & Kirk Jalbert, Manager of Community Based Research & Engagement, FracTracker Alliance
Cover photo by COGCC
https://www.fractracker.org/a5ej20sjfwe/wp-content/uploads/2016/09/Chevronwastewaterpit_Coverphoto.jpg400900Kyle Ferrar, MPHhttps://www.fractracker.org/a5ej20sjfwe/wp-content/uploads/2025/09/2025-Wordmark-Logo.pngKyle Ferrar, MPH2016-09-20 09:01:182021-04-15 15:04:27Groundwater Threats in Colorado
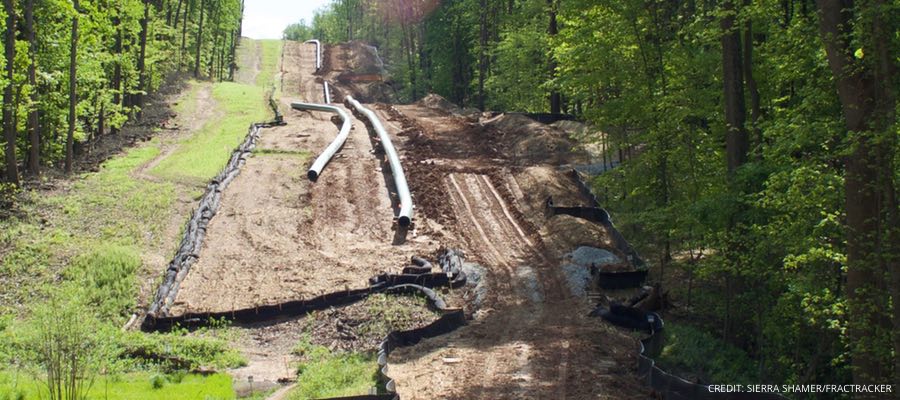
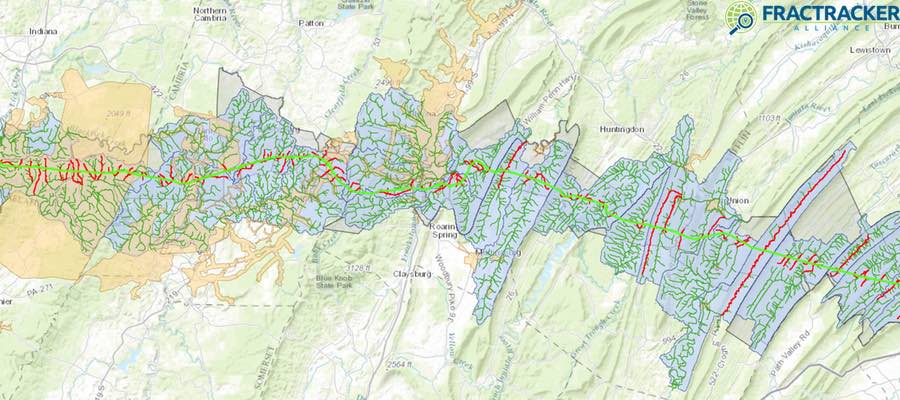
Mariner East 2 (ME 2) is a $2.5 billion, 350 mile-long pipeline that, if built, would be one of the largest pipeline construction projects in Pennsylvania’s history—carving a fifty-foot wide path through 17 counties. A project of Sunoco Logistics, ME 2 would have the capacity to transport 275,000 barrels a day of propane, ethane, butane, and other hydrocarbons from the shale fields of Western Pennsylvania and neighboring states to an international export terminal in Marcus Hook, located on the Delaware River.
ME 2 has sparked a range of responses from residents in Pennsylvania, however, including concerns about recent pipeline accidents, the ethics of taking land by eminent domain, and the unknown risks to sensitive ecosystems. Below we explore the watersheds that could be impacted by this proposed pipeline.
Watershed Impacts
While some components of Sunoco’s ME 2 proposal are approved, the project requires more permits from the Pennsylvania Department of Environmental Protection (DEP) before construction can begin. Among those are permits to build through and under stream and wetlands. Many of the waters threatened by ME 2 are designated by the Commonwealth as “exceptional value” (EV) or “high quality” (HQ) and are supposed to be given greater protections from harm. Water Obstruction and Encroachment Permits, also known as “Chapter 105” permits, are required for any building activities that would disrupt any body of water, including wetlands and streams. Sunoco applied for these so-called “Chapter 105” permits in the summer of 2015, but its applications were rejected as incomplete several times.
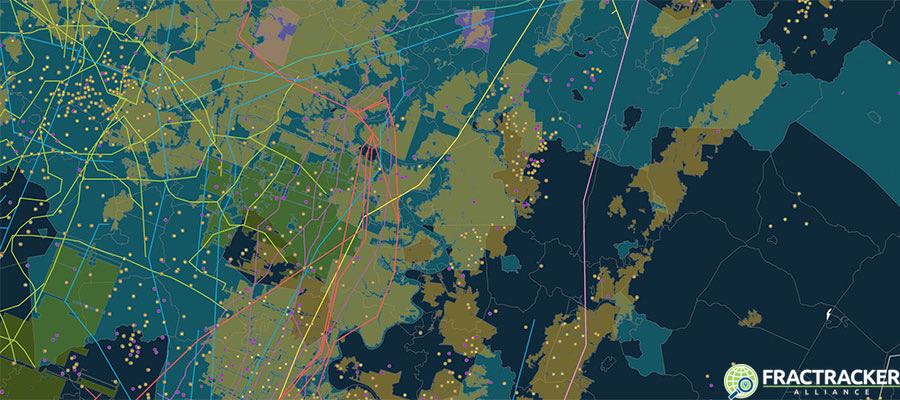
The below map shows the ME 2 route as of May 2016 relative to the watersheds and streams it will cross. Zoom into the map to see additional layers. Note that this is the most accurate representations of ME 2’s route we have seen to date. MWA provided the shapefiles for ME 2’s route to FracTracker Alliance and continues its investigations into potential watershed impacts.
In total, ME 2’s path will include 1,227 stream crossings, 570 wetland crossings, and 11 pond crossings. Of the 1,227 stream crossings, 19 are EV and 318 are HQ, meaning that 337 crossings will disturb what DEP refers to as “special protection” waters. In addition, there are 129 exceptional value wetlands being crossed. These numbers were compiled by Mountain Watershed Association (MWA) from Sunoco’s permitting applications. MWA also identified 2 HQ streams in Washington County, and 3 HQ streams in Blair County, that are proposed to be crossed that are not acknowledged as being HQ in Sunoco’s permits.
Public Comment Period Open
People living along the proposed route are sometimes in the best position to see what the route looks like from the ground, where wetlands and streams are, and what kinds of wetlands and streams they are. The DEP is accepting public comments on Sunoco’s ME 2 Ch. 105 permit application through Wednesday, August 24. Each DEP regional office receives separate Ch. 105 applications depending on where the pipeline routes through different counties. Those wishing to comment on the project can do so through the DEP regional office websites: DEP Southwest Region, DEP South-central Region, DEP Southeast Region. For guidance on how to write comments on permits, see MWA’s Pipeline Project Information & Talking Points.
Written by Kirk Jalbert, PhD, MFA – Manager of Community-Based Research & Engagement, FracTracker Alliance
https://www.fractracker.org/a5ej20sjfwe/wp-content/uploads/2016/08/Mariner-East-2-Feature.jpg400900FracTracker Alliancehttps://www.fractracker.org/a5ej20sjfwe/wp-content/uploads/2025/09/2025-Wordmark-Logo.pngFracTracker Alliance2016-08-23 09:55:022020-03-12 17:14:44Mariner East 2 and Watershed Risks
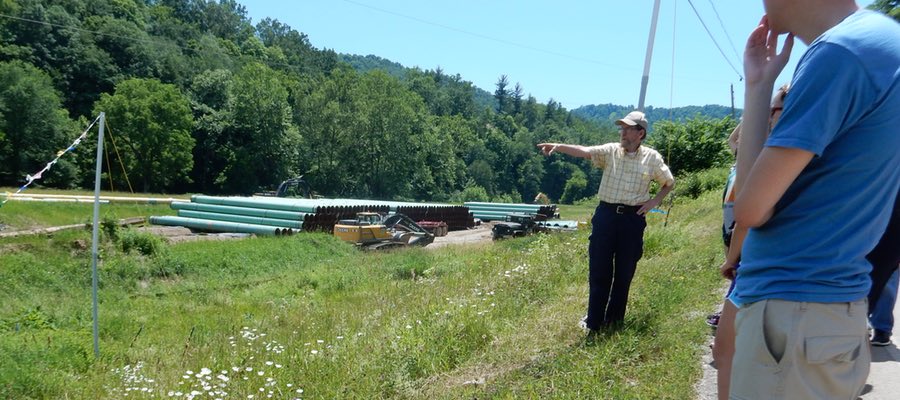
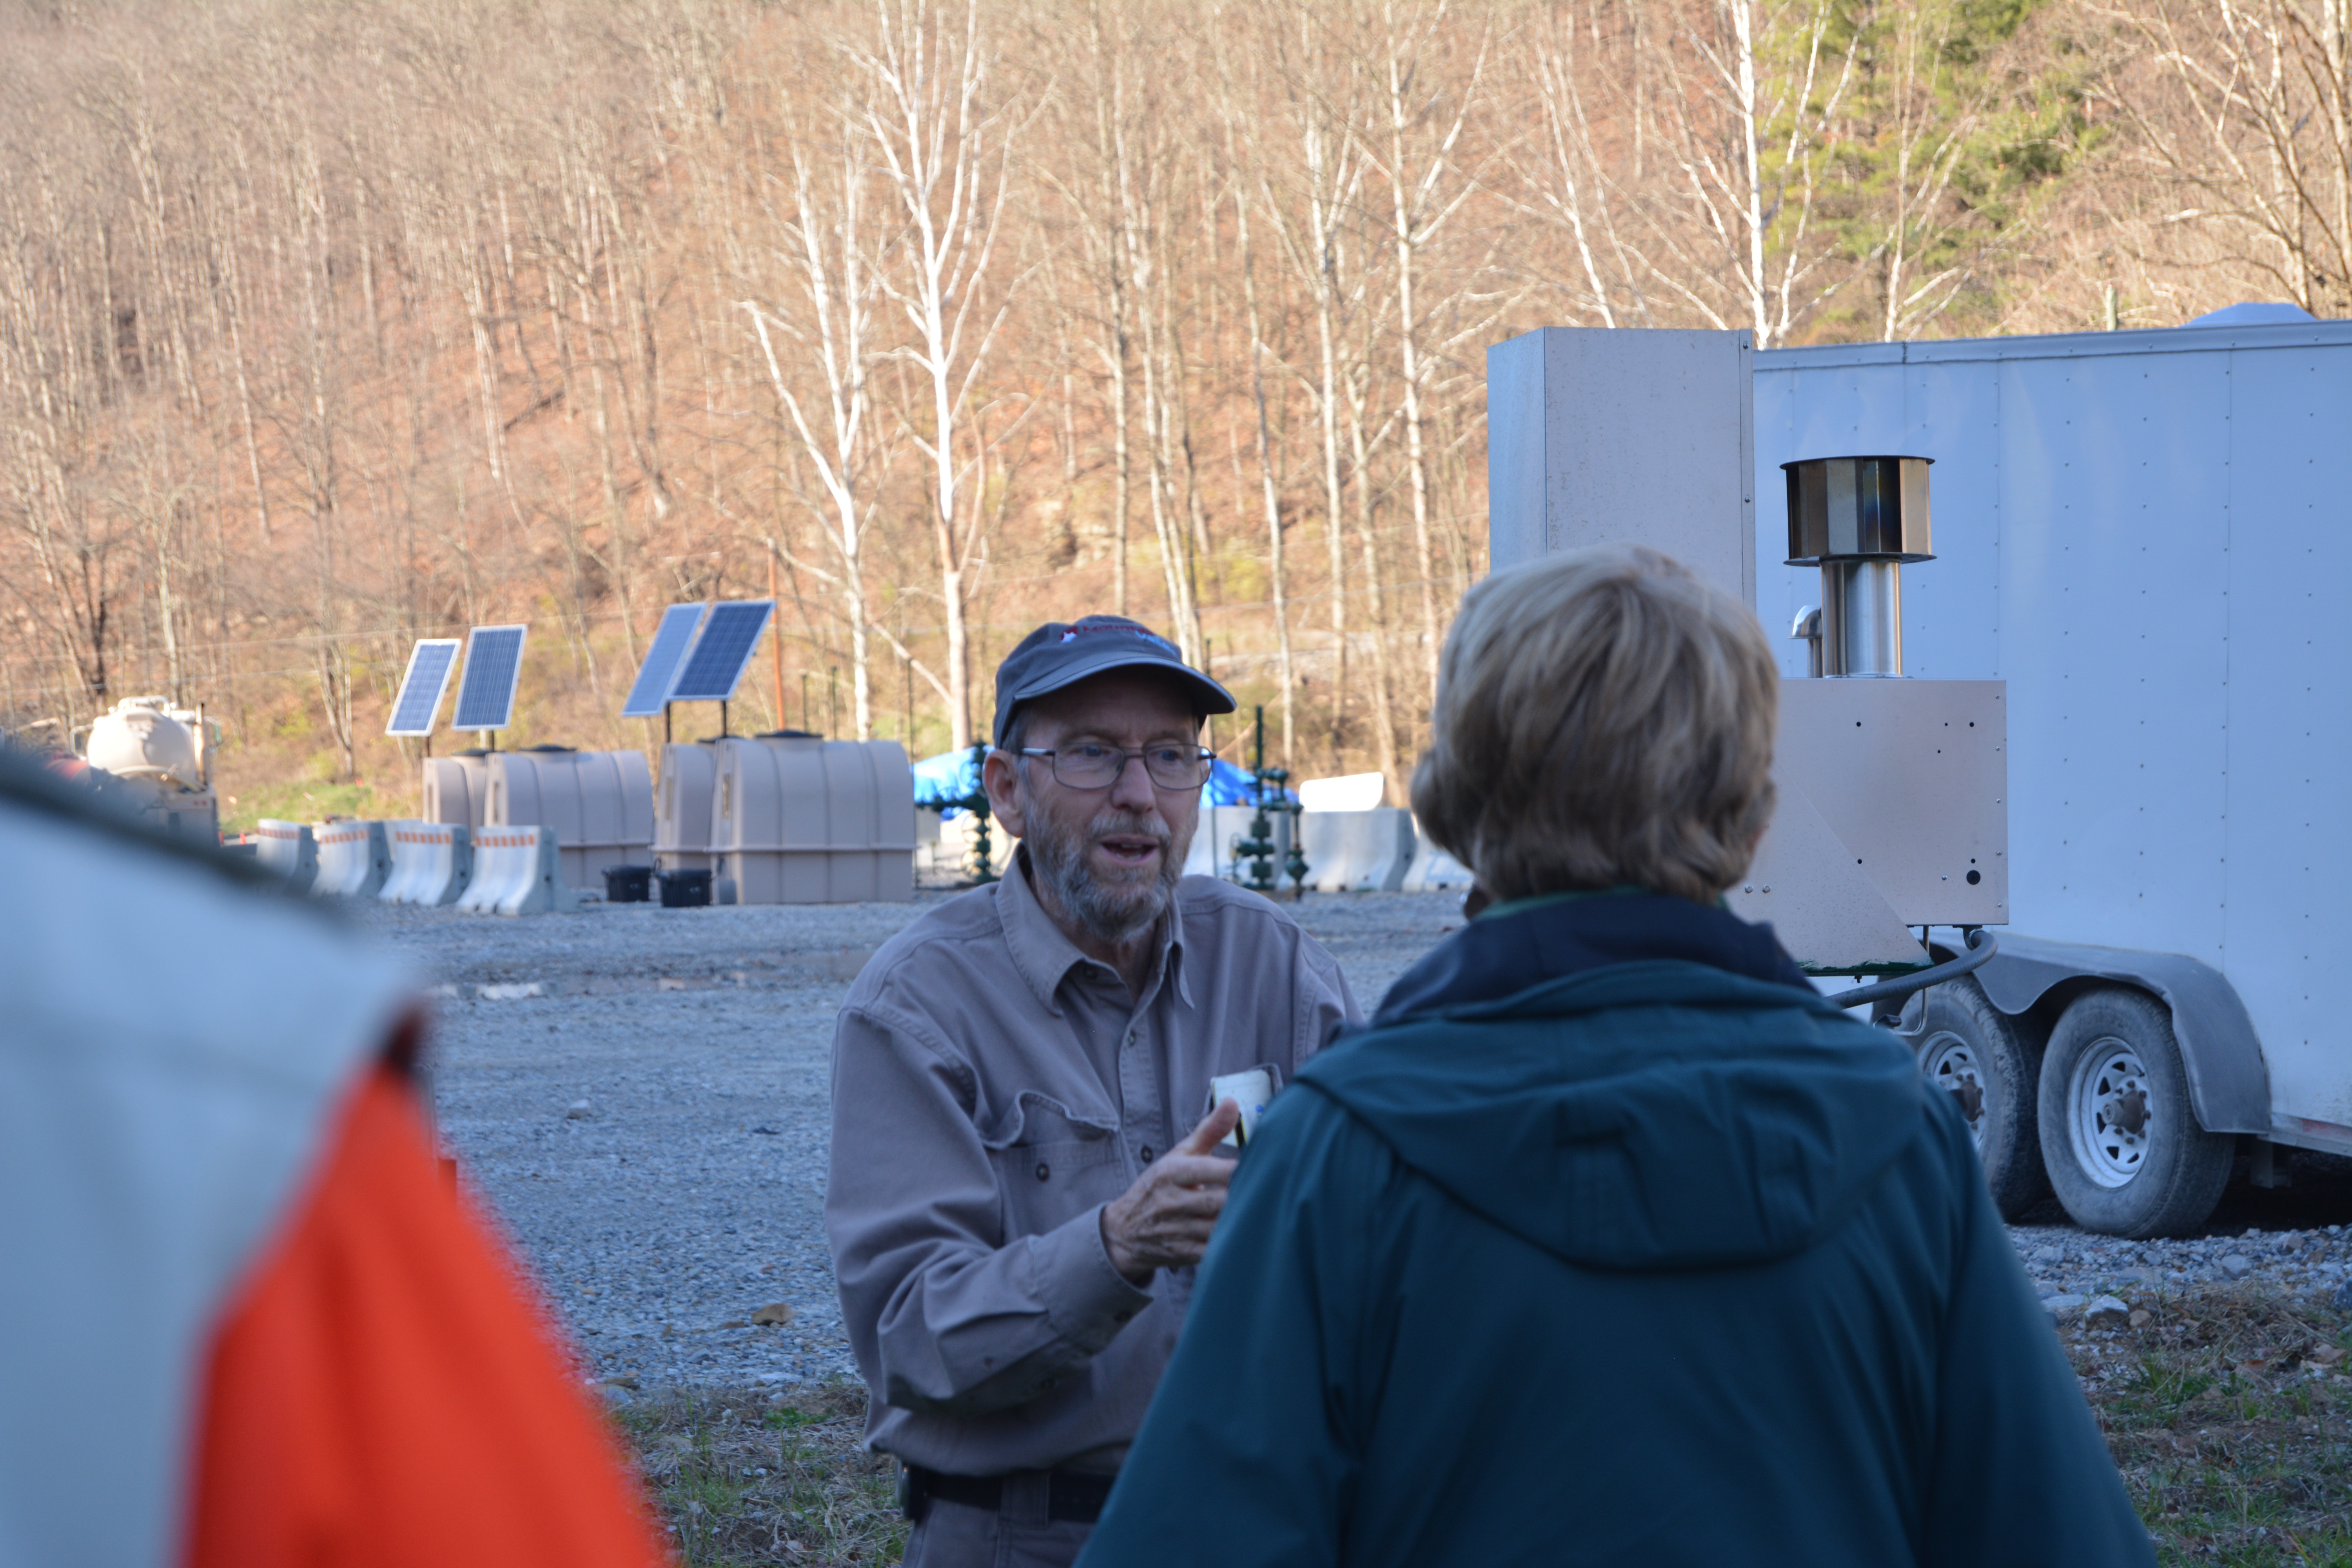
As many of you know, educating the public is a FracTracker Alliance core value – a passion, in fact. In addition to our maps and resources, we help to provide hands-on education, as well. The extraordinary Bill Hughes is a FracTracker partner who has spent decades “in the trenches” in West Virginia documenting fracking, well pad construction, water withdrawals, pipeline construction, accidents, spills, leaks, and various practices of the oil and gas industry. He regularly leads tours for college students, reporters, and other interested parties, showing them first-hand what these sites look, smell, and sound like.
While most of us have heard of fracking, few of us have seen it in action or how it has changed communities. The tours that Bill provides allow students and the like to experience in person what this kind of extraction means for the environment and for the residents who live near it.
Biking to Support FracTracker and Bill Hughes
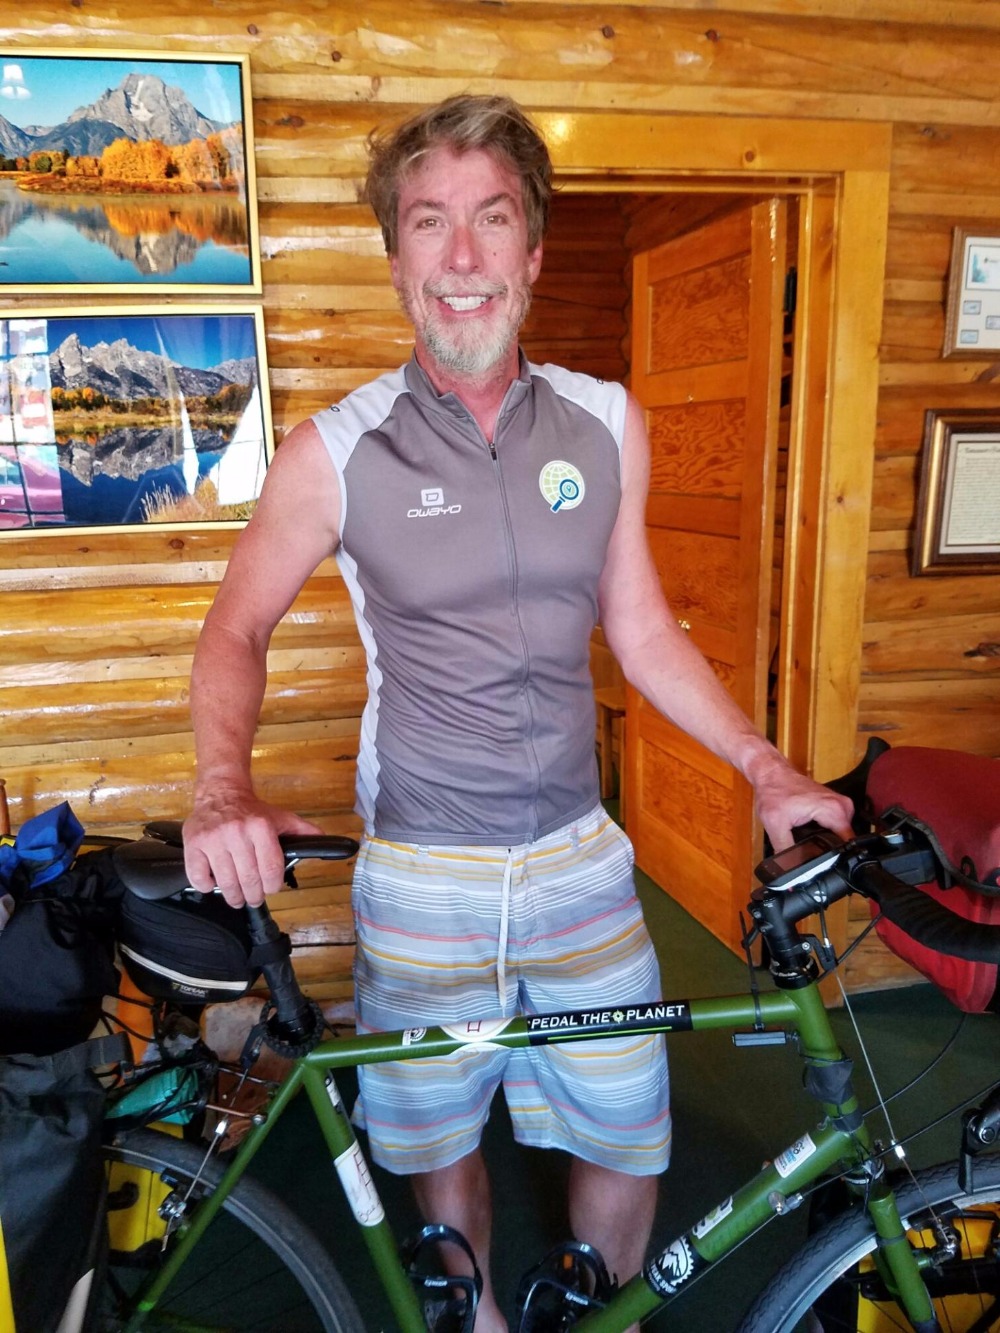
Dave Weyant at the start of his cross-country Pedal for the Planet bike trip
In the classic spirit of non-profit organizations, we work in partnership with others whenever possible. Right now, as you read this posting, another extraordinary Friend of FracTracker, Dave Weyant (a high school teacher in San Mateo, CA), is finishing his cross-country cycling tour – from Virginia to Oregon in 70 days.
Dave believes strongly in the power of teaching to reach the hearts of students and shape their thinking about complicated issues. As such, he has dedicated his journey to raising money for FracTracker. He set up a GoFundMe campaign in conjunction with his epic adventure, and he will donate whatever he raises toward Bill’s educational tours.
Help us celebrate Dave Weyant’s courage, vision, and generosity – and support Bill Hughes’s tireless efforts to open eyes, evoke awareness, and foster communication about fracking – by visiting Dave’s GoFundMe page and making a donation. Every gift of any size is most welcome and deeply appreciated.
100% of the funds raised from this campaign will go to support Bill’s oil and gas tours in West Virginia. FracTracker Alliance is a registered 501(c)3 organization. Your contribution is tax deductible.
And to those of you who have already donated, thank you very much for your support!
https://www.fractracker.org/a5ej20sjfwe/wp-content/uploads/2016/07/Hughes-Tour-Feature.jpg400900Guest Authorhttps://www.fractracker.org/a5ej20sjfwe/wp-content/uploads/2025/09/2025-Wordmark-Logo.pngGuest Author2016-07-27 10:30:012020-03-11 16:48:40A Cross-Country Ride to Support Oil and Gas Tours in West Virginia
Over 38,000 oil and gas wells have likely been hydraulically fractured in California. The last permitted hydraulic fracturing operation in CA was approved in June 2015. Additionally, new aquifer exemption proposals will make it easier for operators to obtain hydraulic fracturing permits. One of the most interesting and troubling issues we found when analyzing the data on violations is that operators with the highest number of new well permits are also responsible for the majority of violations. In this article, we provide a look at these and other the trends of unconventional drilling in CA.
Updated CA Shale Viewer
First of all, the CA Shale Viewer has been updated! New data has been uploaded into the map about unconventional drilling in California, and new data resources have been used to identify shale gas activity (Fig. 1). Recent reports in CA have exposed what many researchers expected – hydraulic fracturing has been occurring in the state without any oversight or documentation for a long time.
In this presentation of the Updated CA Shale Viewer we showcase an analysis of these new data sources that better describe unconventional drilling in CA. We then look to new well permitting data to see what current spatial trends may mean for future oil and gas development. We also look at a sample of operator violations issued by the state regulatory agency to tell us a bit about who the bad actors may be.
Figure 1. CA Shale Viewer – Location of well stimulation & other unconventional oil & gas activity
Fracking in California has been put on hold at the moment as a result of low oil prices combined with the new permitting requirements for groundwater monitoring. In 2015, the CA Council on Science and Technology (CCST) released a report on hydraulic fracturing, as required by State Bill 4, proposed by Senator Pavley. The legislation required the Division of Oil, Gas and Geothermal Resources to create regulations for hydraulic fracturing and other stimulation activities such as acidizing. The report highlighted the necessity of protecting California’s groundwater resources. As another requirement of SB4, the state water resources control board adopted Model Criteria for Groundwater Monitoring in areas of Oil and Gas Well Stimulation, which includes three main components:
Area-specific required groundwater monitoring near stimulation wells by operators
Requirements for designated contractor sampling and testing
Regional scale groundwater monitoring to be implemented by the State Water Board
With these requirements in place to protect groundwater, using hydraulic fracturing and other “extreme” high energy input techniques to extract oil is not currently economical in California. Operators have not submitted a permit application for hydraulic fracturing in CA since June 2015.
This status may change in the near future, though, as DOGGR has proposed groundwater monitoring exemptions for 3 large aquifer systems in Kern and Arroyo Grande counties. Such a proposal would mean that operators would not have to monitor for groundwater contamination in these areas when using hydraulic fracturing or other stimulation technologies like acidizing.
Previous Fracking Activity
One outcome of the aforementioned CCST report on hydraulic fracturing was a review of stimulation activity that has occurred in CA but went undocumented. Researchers at Lawrence Berkeley National Laboratory (LBNL) screened thousands of oil and gas well logs and records to calculate the extent to which hydraulic fracturing was actually being used in California’s oil fields. LBNL derived “Well Stimulation Treatment” probabilities based on the number of well records that reported utilizing hydraulic fracturing.
Probabilities were then derived for each pool, which is a geographically isolated formation within an oil field. Using these probabilities, FracTracker calculated a conservative estimate for the number of stimulated wells in the state at over 38,000. There are 228,010 unique Well ID’s listed in the DOGGR database. This puts the proportion of hydraulically fractured wells in California at 16.7% of the total 228,090 wells known.
New Wells
Whereas many other states break down their oil and gas data to show in what phase of development a well may be, CA identifies all wells between the permitted and producing/injecting phase as “new.” In Figure 2 below you can see the wells identified in 2016 as “new.” The DOGGR dataset shows there are currently 6,561 new wells in California as of July 2016. Counts of new well permits were calculated for individual operators and are listed below in Table 1.
Table 1. Top 10 operators according to new well permit counts in California, along with the number of new well permits currently active, the percent those permits represent of total new well permits in the state, and the percentage of violations the operator is responsible in the DOGGR dataset provided to FracTracker Alliance.
Order
Operator
Permit Count
Permit %
Violations %
1
Aera Energy LLC
2012
30.67%
22.34%
2
Chevron U.S.A. Inc.
968
14.75%
20.35%
3
California Resources Production Corporation
768
11.70%
5.89%
4
Linn Operating, Inc.
574
8.75%
12.04%
5
E & B Natural Resources Management Corporation
572
8.71%
1%
6
California Resources Elk Hills, LLC
374
5.70%
5.52%
7
Seneca Resources Corporation
185
2.82%
2.83%
8
Freeport-McMoRan Oil & Gas LLC
164
2.50%
15.22%
9
Vaquero Energy, Inc.
154
2.35%
0.22%
10
Macpherson Oil Company
116
1.77%
2.09%
There are 68 fields in CA that have added new wells in the new DOGGR dataset published in July 2016. The top 10 fields are listed in Table 2 below.
Table 2. Top 10 Oil Fields by Permit (New Well) Count
Order
Oil Field
Well Count
1
Belridge, South
1518
2
Midway-Sunset
903
3
Poso Creek
553
4
Lost Hills
488
5
Cymric
336
6
Kern River
294
7
Elk Hills
276
8
Kern Front
233
9
McKittrick
186
10
Belridge, North
174
In Figure 2 below, the counts of new wells in fields are shown in shades of yellow/red. The fields with the highest number of new wells are located in the Central Valley. The top 10 operators’ wells are also identified. The majority of new well permits are located in the South Belridge oil field, and the majority of those wells are operated by Aera Energy. As can be seen in the map, most new wells are located in fields in Kern county, but Santa Barbara and Fresno, and even Salinas counties have fields with 40 or more new well permits.
Figure 2. New Well Permitting Map of Unconventional Drilling in California
In most states with heavy oil and gas drilling, data on violations is collected by the state regulatory agency, aggregated in datasets and spreadsheets, and made available to the public. FracTracker has done analyses with such data in the past.
In Pennsylvania for instance, a 2011 look at the data showed us that as the number of inspectors on the ground in the Marcellus Shale fields increases, the number of violations/well actually decrease. This was important information that challenged the cynical hypothesis: that more inspectors mean additional eyes on the ground to identify more violations during inspections. In reality, more inspectors actually mean that operators are held to higher standards, and further best management practices (BMPs) are employed. This trend at least seemed to be the case in Pennsylvania. As a regulatory agency, such knowledge is incredibly important, and even validates increased spending and budgets for more personnel.
In California, the issue of publishing violations data is again met with a similar response from the Division of Oil Gas and Geothermal Resources (DOGGR), specifically the “Oh, is that my job?” question.
How is it shared?
At FracTracker, we spent time working with regulatory officials at DOGGR to get some data on violations. We were informed that at some point in the future, the data may be aggregated and available digitally. Until then, however, a request for the data would have to be made to each of the six district offices individually and would take approximately a year to pull together scanned copies of violations notices in PDF format. Unfortunately, we at FracTracker do not have the capacity to process such files. Instead we asked for anything DOGGR had digitally available, and we were provided with a sample subset of 2,825 violations dating mostly from 2013 and 2014 and only in District 2, the Los Angeles Basin.
What does CA violations data look like?
Looking at the sample of data in Table 2, we see that the majority of violations are caused by the operators that also have the most new well permits. Aera Energy, in particular, is responsible for over 1/5 of all violations in our sample set. Limiting factors and sampling bias of the sample set of violations may impact this analysis, though, as all violations are limited to Los Angeles County. Operators that mostly operate in the Central Valley will be under represented in the violations count. When more violations data becomes available we will be sure to expand this analysis.
Bans and Regulations on Unconventional Drilling in California
Although every state regulatory agency lambasts that they have the most comprehensive and conservative set of oil and gas extraction regulations, California regulators may actually be right. That is, save for New York which has banned hydraulic fracturing outright.
As the price of oil rebounds closer to $100/barrel, there will be more interest by operators to increase unconventional drilling in California. The addition of new aquifer exemptions will make it all the more appealing. These local movements are therefore incredibly important to ensure that “extreme” extraction methods like fracking don’t expand in the future.
Feature Photo: South Belridge field by Sarah Leen, National Geographic
https://www.fractracker.org/a5ej20sjfwe/wp-content/uploads/2016/07/southbelridge_NatGeo_re.jpg400900Kyle Ferrar, MPHhttps://www.fractracker.org/a5ej20sjfwe/wp-content/uploads/2025/09/2025-Wordmark-Logo.pngKyle Ferrar, MPH2016-07-26 04:35:192020-03-12 17:18:14Trends in California’s Oil and Gas Development


