Can Californians Escape Oil and Gas Pollution?
The city of Los Angeles is considering a 2,500-foot setback safety buffer between residences and oil and gas wells. Support for the proposal is being led by the grassroots group Stand Together Against Neighborhood Drilling (STAND-LA). The push for a setback follows a recent report by the Los Angeles County Department of Public Health. According to Stand LA:
The report, requested by both the Los Angeles County Supervisors and the Los Angeles City Council, outlines the health impacts faced by residents living, attending school or worshiping near one of Los Angeles County’s 3,468 active oil wells, 880 of which operate in the City of Los Angeles.
The Department outlines the clear health impacts on residents living near active oil wells, including: adverse birth outcomes, increased cancer risk, eye, nose and throat irritation, exacerbation of asthma and other respiratory illnesses, neurological effects such as headaches and dizziness, gastrointestinal effects such as nausea and abdominal pain, and mental health impacts such as depression, anxiety or fatigue.
This information is, of course, nothing new. Living near oil and gas extraction activities, and specifically actively producing wells, has been shown in the literature to increase risks of various health impacts – including asthma and other respiratory diseases, cardiovascular disease, cancer, birth defects, nervous disorders and dermal irritation, among others.1
Spatial Assessment
While Los Angeles would benefit the most from any type of setback regulation due to the county and city’s high population density, the rest of the state would also benefit from the same.
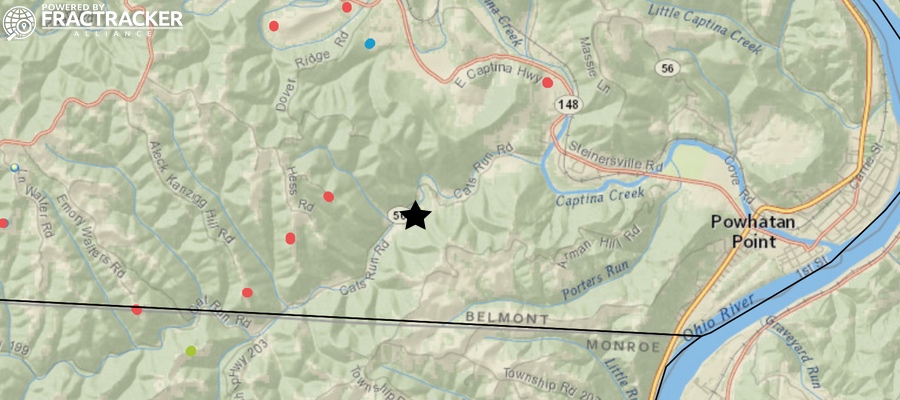
We conducted an assessment of the number of California citizens living proximal to active oil and gas production wells to see who all would be affected by such a change. Population counts were estimated for individuals living within 2,500 feet of an oil and gas production well for the entire state. An interactive map of the wells that fall within 2,500 feet of a residence in California is shown just below in Figure 1.
California 2,500’ oil and gas well buffer map
View map fullscreen | How FracTracker maps work | Map Data (CSV): Aquifer Exemptions, Class II Wells
Figure 1. California 2,500’ oil and gas well buffer, above. The map shows a 2,500’ buffer around active oil and gas wells in California. Wells that are located within 1,000’; 1,500’; and 2,500’ from a residence, hospital or school are also shown in the map. The counts of individuals located within 2,500’ of an active well are displayed for census tracts.
Population Statistics
The number and percentage of California residents living within 2,500 feet of an active (producing) oil and gas well are listed below:
We calculated population counts within the setbacks for smaller census-designated areas, including counties and census tracts. The results of the calculations are presented in Table 1 below.
Table 1. Population Counts by County
| County | Total Pop. | Impacted Pop. | Impacted % Non-White | Impacted % Hispanic |
| Los Angeles | 9,818,605 | 541,818 | 0.54 | 0.46 |
| Orange | 3,010,232 | 202,450 | 0.25 | 0.19 |
| Kern | 839,631 | 71,506 | 0.34 | 0.43 |
| Santa Barbara | 423,895 | 8,821 | 0.44 | 0.71 |
| Ventura | 823,318 | 8,555 | 0.37 | 0.59 |
| San Bernardino | 2,035,210 | 6,900 | 0.42 | 0.59 |
| Riverside | 2,189,641 | 5,835 | 0.46 | 0.33 |
| Fresno | 930,450 | 2,477 | 0.34 | 0.50 |
| San Joaquin | 685,306 | 2,451 | 0.55 | 0.42 |
| Solano | 413,344 | 2,430 | 0.15 | 0.15 |
| Colusa | 21,419 | 1,920 | 0.39 | 0.70 |
| Contra Costa | 1,049,025 | 1,174 | 0.35 | 0.30 |
Table 1 presents the counts of individuals living within 2,500 feet of an active oil and gas well, aggregated by county. Only the top 12 counties with the highest population counts are shown. “Impacted Population” is the count of individuals estimated to live within 2,500 feet of an oil and gas well. The “% Non-white” and “% Hispanic” columns report the estimated percentage of the impacted population of said demographic. There may be some overlap in these categories.
Conclusions
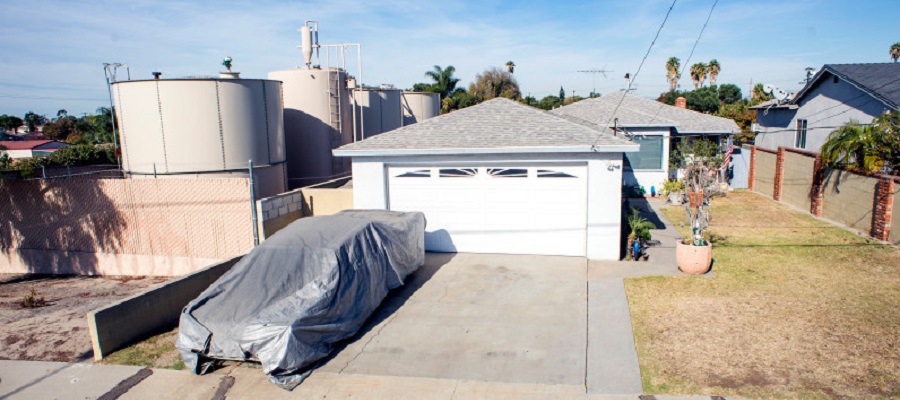
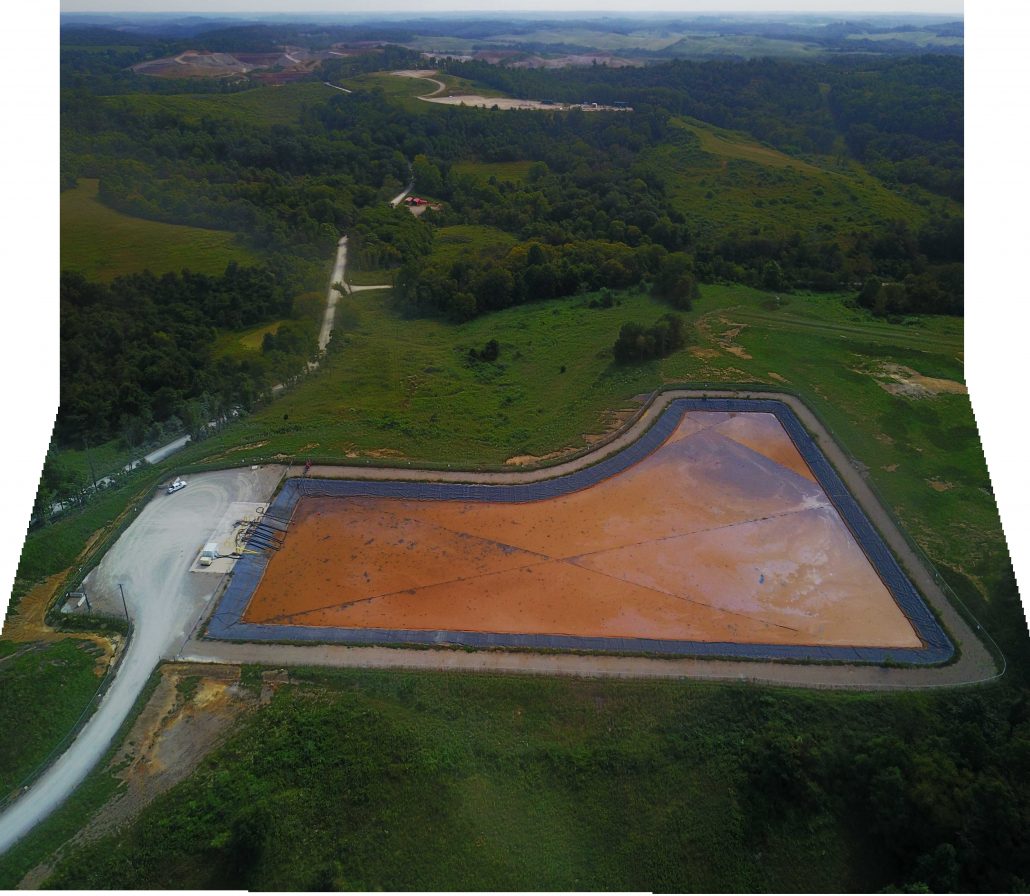
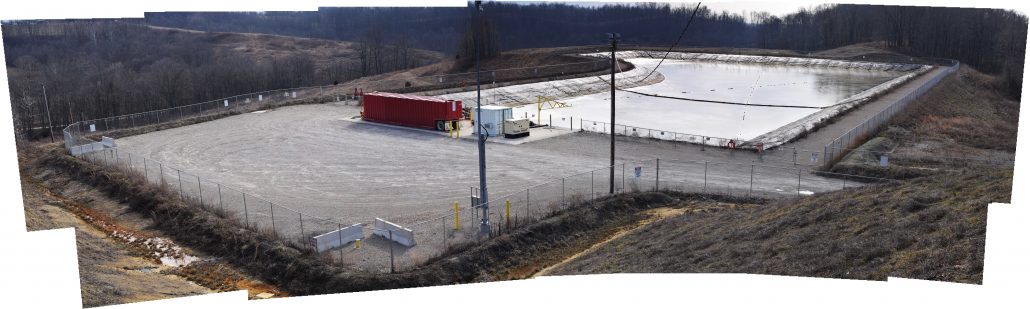
California is unique in many ways, beautiful beaches and oceans, steep mountains, massive forests, but not least of all is the intensity of the oil and gas industry. Not only are some of the largest volumes of oil extracted from this state, but extraction occurs incredibly close to homes, sometimes within communities – as shown in the photo at the top of this post.
The majority of California citizens living near active production wells are located in Los Angeles County – well over half a million people. LA County makes up 61% of Californians living within 2,500 feet of an oil and gas well, and half of them are non-white minority, people of color.
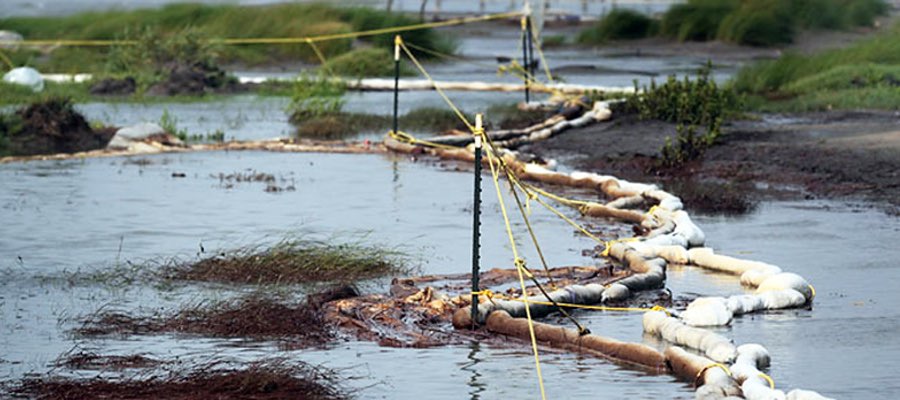
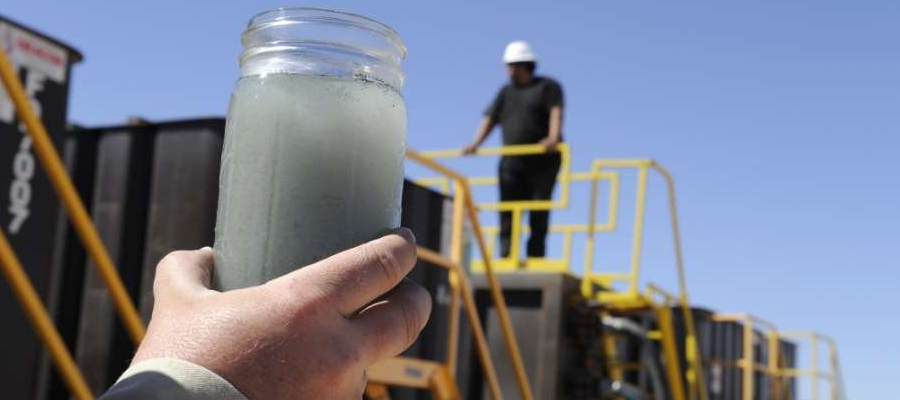
Additionally, the well sample population used in this analysis is limited to only active production wells. Much more of California’s population is exposed to pollutants from the oil and gas support activities and wells. These pollutants include acidic vapors, hydrocarbons, and diesel particulate matter from exhaust.
Our numbers are, therefore, a conservative estimate of just those living near extraction wells. Including the other activities would increase both the total numbers and the demographic percentages because of the high population density in Los Angeles.
For many communities in California, therefore, it is essentially impossible for residents to escape oil and gas pollution.
The Analysis – How it was done!
Since the focus of this assessment was the potential for impacts to public health, the analysis was limited to oil and gas wells identified as active – meaning they are producing or are viable to produce oil and/or natural gas. This limitation on the dataset was justified to remain conservative to the most viable modes of exposure to contaminants from well sites. Under the assumption that “plugged,” “buried,” or “idle” wells that are not producing (or at least reporting production figures to DOGGR) do not purvey as much as a risk of air emissions, the main route of transport for pollutants to the surrounding communities is via air emissions from “producing” oil and gas wells. The status of wells was taken from DOGGR’s “AllWells.zip” dataset (downloaded 3/7/18).
Analysis Steps:
- The first step was to identify oil and gas wells in California affected by 2,500’ and shorter setbacks from occupied dwellings. To achieve this, the footprints of occupied dwellings were identified, and where there was not a data source available the footprints were digitized.
- Using GIS tools, 2,500’ buffers were generated from the boundary of the occupied dwellings and a subset of active oil and gas wells located within the buffer zone were generated.
- A combination of county and city zoning data and county parcel data was used to direct the selection of building footprint GIS data and the generation of additional building footprint data. Building footprint data is readily available for a number of California cities, but was not available for rural areas.
- Existing footprint data was vetted using zoning codes.
- Areas located within 2,500’ of well-heads were prioritized for screening satellite imagery in areas zoned for residential use.
Analytical Considerations
Buildings and facilities housing vulnerable populations were also included. Vulnerable populations include people such as children, the elderly, and the immunocompromised. These areas pose an elevated risk for such sensitive populations when they live near hazardous sites, such as oil fields in LA. A variety of these types of sites were included in the GIS analysis, including schools and healthcare facilities.
GIS techniques were used to buffer active oil and gas wells at 2,500 feet. GIS shapefiles and 2010 Decennial census data was downloaded from American Fact Finder via Census.gov for the entire state of California at the census block level.2 Census block GIS layers were clipped to the 2,500-foot buffers. Population data found in Summary File 1 for the 2010 census was attached to the clipped census block GIS layers. Adjusted population counts were calculated according to the proportion of the area of the census block falling within the 2,500’ buffer.
References
- Shonkoff, Seth B.C.; Hays, Jake. 2015. Toward an understanding of the environmental and public health impacts of shale gas development: an analysis of the peer-reviewed scientific literature, 2009-2014. PSE Healthy Energy.
- U.S. Census Bureau. 2010 Census Summary File 1.
By Kyle Ferrar, Western Program Coordinator, FracTracker Alliance
Cover photo by Leo Jarzomb | SGV Tribune


