The majority of FracTracker’s posts are generally considered articles. These may include analysis around data, embedded maps, summaries of partner collaborations, highlights of a publication or project, guest posts, etc.
By Matt Unger and Gianna Calisto, FracTracker PA Interns
Recently, a Grist.com article, entitled Hey! Did somebody frack my favorite beer? caught our attention here at FracTracker Alliance. In the piece, a concerned citizen questioned whether or not fracking could be affecting what many consider to be the crown jewel of Pennsylvania brewing – Yuengling. The author responded very thoroughly, but needed a map to help show the locations of breweries closest to drilling. To help identify any potential problems and hopefully allow the Commonwealth’s beer drinkers to drink easily tonight, we’ve pulled together such a map.
The PA Beer and Unconventional Drilling Map
Click on the map to explore the breweries and nearby drilling activity
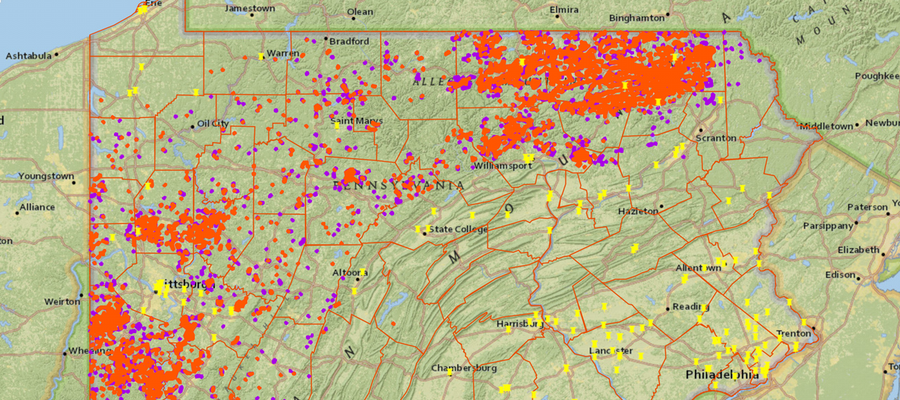
On this map you will see all of the drilled wells (orange), permitted wells (purple), and breweries / brewpubs that we could find in Pennsylvania as of 11-16-2014. The data was gathered from the PA DEP website and The Beer Mapping Project, as well as from a tool our map below contains that allows the viewer to measure distances between two points.
The breweries/brewpubs in the South Central and South Eastern parts of the state are located quite a long distance away from unconventional well pads. This means that Yuengling is likely safe so long as there are no pipeline or traffic incidents nearby!
Even the other areas of Pennsylvania show that brewing near areas of fracking is relatively uncommon. However, there are a few exceptions, particularly in the North Eastern and South Western parts of the state.
Select Results
Yuengling Brewery: 38 Miles from the nearest permitted well, 40 miles from the nearest drilled well.
Iron City Brewing Company: 12 miles from the nearest permitted well, 11.7 miles from the nearest drilled well. Both well sites are upstream from the brewery.
Nimble Hill Brewing Company: 0.5 miles from nearest drilled and permitted well
Use the measure tool on the fullscreen map to explore more about PA brewing and its proximity to drilling.
Things to Consider
The Grist article that we referred to earlier did a great job at outlining some of the risks of drilling and caveats to supporting your favorite brewery. Simply being located near a drilling site does not necessarily mean that the area’s water and air are polluted, but it is a risk. In addition to the points that Grist made, keep in mind that fracking can have other, more indirect effects on the beer industry; well pads are not the only places where effects on the environment can be seen. Spills and traffic involving the transportation of drilling resources, products, and waste pose very serious risks through the areas that these items are transported. This intense industrial activity can also give off localized air pollution. The map above only begins to highlight all of the potential beer-scare scenarios, unfortunately.
If you do feel that your favorite beer is being affected by nearby drilling activity, there are very easy things that you can do, as the Grist article explains. In the mean time, we at FracTracker will happily taste test each PA brewery’s product should the need arise!
If there are other maps that you would like to see made showing where drilling is located near you, just let us know.
The FracTracker Alliance periodically takes a deeper look into the unconventional oil and gas data in Pennsylvania, in order to provide updates for some frequently requested statistics on the industry. Here we provide updated PA data and trends as of December 4, 2014. Since unconventional drilling began in the Commonwealth permits have been issued to drill 15,573 unconventional wells, according to data from the Pennsylvania DEP. Many – 8,696 (56%) – of those permits have actually been drilled. In terms of violations, there have been 5,983 entries on the statewide Compliance Report for unconventional wells throughout the state, which are attributed to 1,790 distinct wells.
Pennsylvania Shale Viewer Map
Please click here for the full screen version, with additional map tools and controls.
Additional Stats
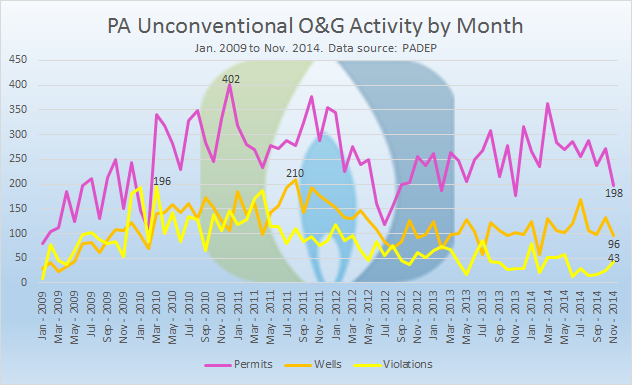
The number of permits, wells, and violations vary significantly from month to month, but each category is well off of its peak. The largest number of unconventional permits issued in a single month was 402, which was in December 2010, more than twice as many as were issued last month. In that year, there were six months with 300 or more permits issued, whereas there has only been one such month to date in 2014.
PA unconventional O&G activity per month from Jan. 2009 to Nov. 2014. Source: PADEP
The 210 wells spudded (drilled) in August 2011 represents the high water mark, and is more than two times the amount of wells drilled last month. In the 28 months between March 2010 and June 2012, the industry failed to spud 100 wells only once, reaching 98 in April 2011. In the first 11 months of 2014, that plateau was missed three times, with a low of 58 spuds in February.
There was a significant spike in violations appearing on the compliance report from December 2009 through August 2011. More than 100 violations were issued in 17 out of 21 months, including 196 in March 2010. The number of violations issued has slowed down considerably since then, with November 2014 being the 34th straight month with fewer than 100 violations. Only 14 violations were issued in June 2014.
Violations per Well (VpW)
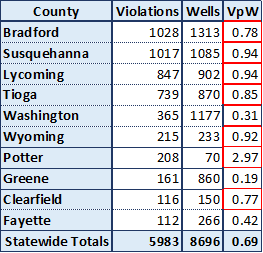
Unconventional violations per well by county in PA, showing the 10 counties with the largest number of violations. Counties with an above average Violations per Well (VpW) score are highlighted in red.
We often ask whether drilling is more problematic in some areas than others. Since the number of wells varies depending upon the location, we must approach this question by looking at the number of violations issued per well drilled (VpW). However, there is an important caveat to consider. Put simply, what is a violation? The Pennsylvania DEP publishes a Compliance Report for unconventional wells, which has 5,983 incidents listed from 2000 through December 4, 2014. However, it used to be common for the DEP to lump several incidents into the same Violation ID number, although this is not the case for more recent infractions. When the DEP counts violations issued, they look at the total number of unique Violation ID numbers that have been issued, not the total number of incidents on the report. Here, we include the more inclusive list of items on the compliance report.
Of the 10 counties with the largest number of violations issued, only 3 counties have a violations per well mark below the statewide average. Notably, each of those three counties are located in Southwestern Pennsylvania. It is unclear from these numbers what is going on in Potter County, but clearly there is a significant problem in that location – with almost three violations issued per well drilled, Potter County has a VpW score 4.3 times the statewide average.
Operator Trends
Before we look at the operators with the most violations, there is an additional caveat to consider: It is relatively common for wells to change hands over their operational lifetimes. This characteristic could be due to one company buying another out, or simply transferring some of their assets. Still, wells changing from one operator to another is a normal aspect of the oil and gas industry. Such a fact matters for this analysis because while violations issued always stick with the responsible party in the DEP data, the name of the operator changes on the Spud Report to the current operator.
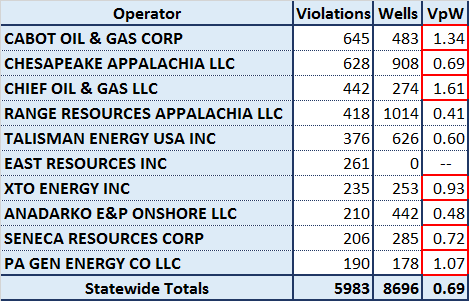
Unconventional violations per well by operator in PA, showing the 10 operators with the largest number of violations. Operators with an above average Violations per Well (VpW) score are highlighted in red.
Because of how these datasets are maintained, we see that East Resources has 261 violations for zero wells, which is of course an impossibly large ratio. That is because East sold off its stake in the Marcellus to Royal Dutch Shell, which does business as SWEPI in Pennsylvania. SWEPI, by the way, is 13th on the list of violations in its own right, with 154 violations for 675 wells, resulting in a 0.23 VpW. If the legacy violations for the old East wells were included, the result would be a 0.61 ViW score, which is almost three times as high, but still below the statewide average. FracTracker doesn’t do the analysis that way, both because it is unfair to the new operator to charge them with violations that they had nothing to do with, as well as being nearly impossible to keep track of the various transactions that result in wells changing hands over the years.
Cover image by Pete Stern, 2013.
https://www.fractracker.org/a5ej20sjfwe/wp-content/uploads/2014/12/PA-Stern-Feature.jpg400900Matt Kelso, BAhttps://www.fractracker.org/a5ej20sjfwe/wp-content/uploads/2025/09/2025-Wordmark-Logo.pngMatt Kelso, BA2014-12-08 10:51:402020-07-21 10:34:09Updated PA Data and Trends
By Samantha Malone – Manager of Education, Communications, & Partnerships
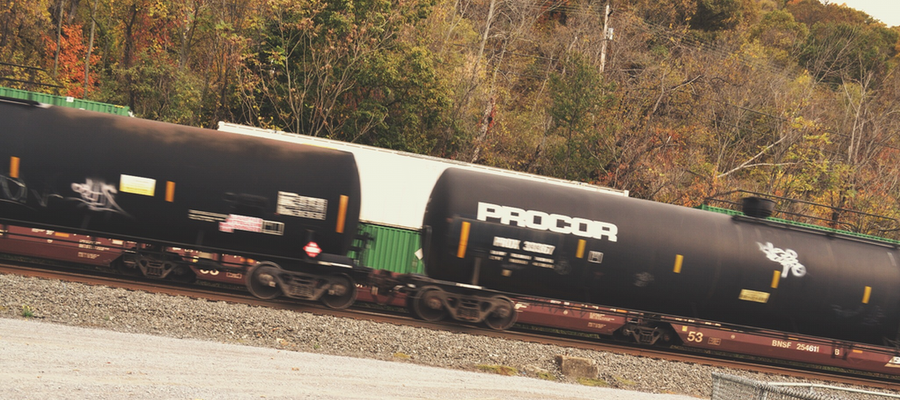
FracTracker Alliance and the CREATE Lab at CMU recently launched a pilot project to track the transportation of volatile crude oil as it passes through Pennsylvania and specifically the Pittsburgh region.
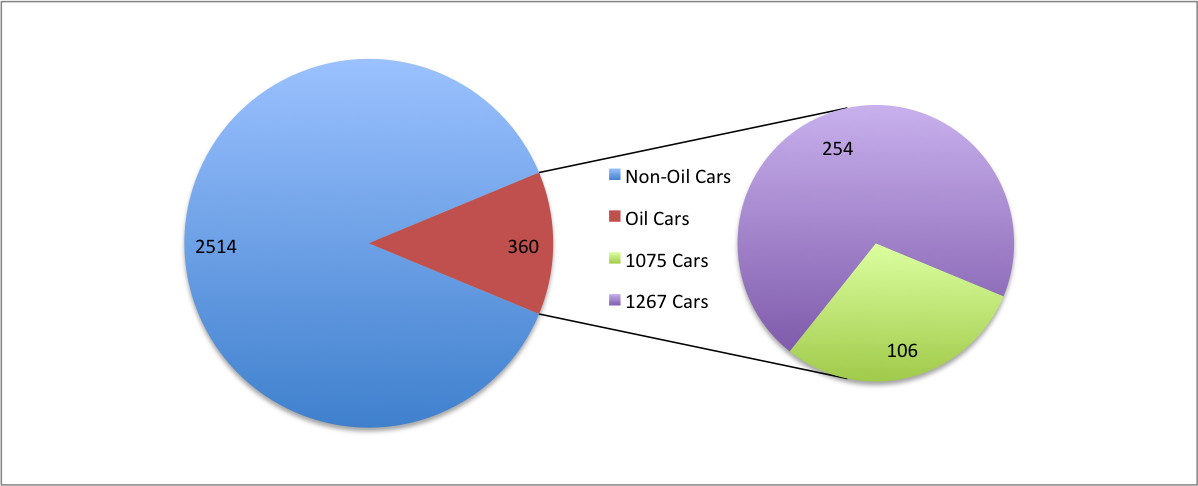
For a bit of background, we were specifically interested in how many cars marked with either a 1075 or 1267 placard (shown below). 1075 placards designate cars that are carrying or recently carried (not yet cleaned out) butane, LPG, propane, or a flammable gas. Alternatively, 1267 placards are warning signs for cars carrying petroleum crude oil or some sort of flammable liquid.
DOT Placard 1075 Butane, LPG, Propane, Flammable Gas, Class 2
DOT Placard 1267 Petroleum Crude Oil, Flammable Liquid, Class 3
Oil Train Counts
Over 11 hours we counted 28 trains, 10 of which contained at least one car with the 1075 or 1267 placard. Most of these trains were quite long, with 28 trains hauling 2,874 cars.
The largest inbound train with the 1267 placard that we identified and estimated to be full was hauling 97 crude tankers. If they were indeed full, this train carried between 2.5 and 3.4 million gallons of crude oil. As a point of reference, the Lac-Mégantic derailment that occurred in 2013 in Quebec and killed 47 people was only carrying 74 Bakken crude cars.
Of the 2,874 cars that we counted, 360 were carrying some sort of oil product. Of those oil cars, approximately 70% were of the 1267 variety (Figure 1).
Figure 1. Ratio of oil cars to total documented by volunteers in Pittsburgh, PA over 11 hours
Speed Matters
The fastest oil train that we observed was going approximately 50 MPH. This train was likely full, based on load estimates and the direction it was traveling. This speed violates a voluntary compliance that crude trains run <40 MPH through high-threat areas. A train that derailed in Lynchburg, VA in April was traveling just 24 mph. Our counting location would likely qualify as a high-threat area, as we were near Neville Island, relatively close to ALCOSAN and the City of Pittsburgh, and just a few yards from the Ohio River and residential homes.
While Pittsburgh certainly has its share of oil trains, concern over the dangers that these trains pose to towns along its tracks extends far beyond the Pittsburgh area. Groups as far as California have gathered together to monitor train traffic. We hope that by tracking and monitoring the number of oil trains over time, we can begin to understand the risks that these trains pose should an incident occur.
The Data Collection Process
Here is how we collected the above data: On October 21st our staff, interns, and generous volunteers spent designated shifts observing the passing of trains and the contents of their cars between about 7:30 AM and 6:30 PM. Under the cover of a pop-up shelter, teams of at least three participants videotaped trains as they passed in either direction, counted and recorded the number of cars that they carried, and most importantly identified and counted specific placards that labeled individual cars as oil-carrying.
Many thanks to the groups who helped with this pilot count: volunteer citizens, Group Against Smog and Pollution, Three Rivers Waterkeeper, Women for a Healthy Environment, our interns from Pitt and Duquesne, and CMU staff.
The CREATE Lab then reviewed and analyzed the collected information and video feed. You can take a look at some of the high-resolution video feed they were able to collect with their BreatheCam. If you have specific questions about the train counting protocol or would like to set up one of your own, please contact us.
About Us
FracTracker Alliance is a non-profit with an office in the Pittsburgh area whose mission is to share maps, data, and analyses to communicate impacts of the global oil and gas industry and to inform actions that positively shape our energy future. www.fractracker.org
The Community Robotics, Education and Technology Empowerment Lab (CREATE Lab) explores socially meaningful innovation and deployment of robotic technologies and is based out of Carnegie Mellon University. www.cmucreatelab.org
https://www.fractracker.org/a5ej20sjfwe/wp-content/uploads/2014/12/OilTrains-Feature.png400900FracTracker Alliancehttps://www.fractracker.org/a5ej20sjfwe/wp-content/uploads/2025/09/2025-Wordmark-Logo.pngFracTracker Alliance2014-12-02 17:45:302021-04-20 14:17:04Oil Trains Passing Through Pittsburgh
By Samantha Malone, Manager of Education, Communications & Partnerships, FracTracker Alliance
North Dakota sure is popular recently. You might wonder why ND’s oil and gas development has been such a hot topic when the average monthly temperature there in November is only 27° F. Below we summarize the recent ND coverage and why the state has been the focus of several conversations lately.
The Intensity of Drilling
On November 22nd The New York Times launched a two-part series starting with The Downside of the Boom. Herein, the NY Times highlights how North Dakota’s regulatory system is insufficient to manage a hefty oil and gas industry. Part two in the series looks into Where Oil and Politics Mix in ND. This investigative journalism series questioned how well the state is managing oil and gas development, which was followed quickly by criticism of the series by state officials. If you haven’t checked out this series and its incredible visuals yet, I would highly recommend it.
FracTracker maintains a shale viewer map of North Dakota and its horizontal oil wells if you would like to explore where the industry is operating. Interestingly, ND is one of the few states where the horizontally drilled well data is available to the public. (Horizontal wells jut out from the vertical wells below ground.) Our interactive map of ND includes zooming features, well API information, and a measurement tool to examine horizontal well lengths. The screenshot below shows that one of the laterals on this map extends out two miles underground. Click the map to explore more:
Interactive Map of ND Wells on FracTracker, with Measurement Tool
Alternatively, here the New York Times shows what ND would look like if all of the state’s oil wells were aboveground:
NYTimes Graphic: What North Dakota Would Look Like if Its Oil Drilling Lines Were Aboveground
NPCA
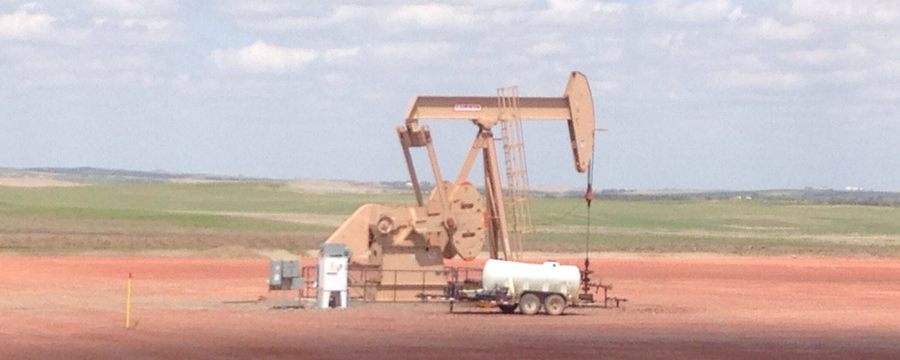
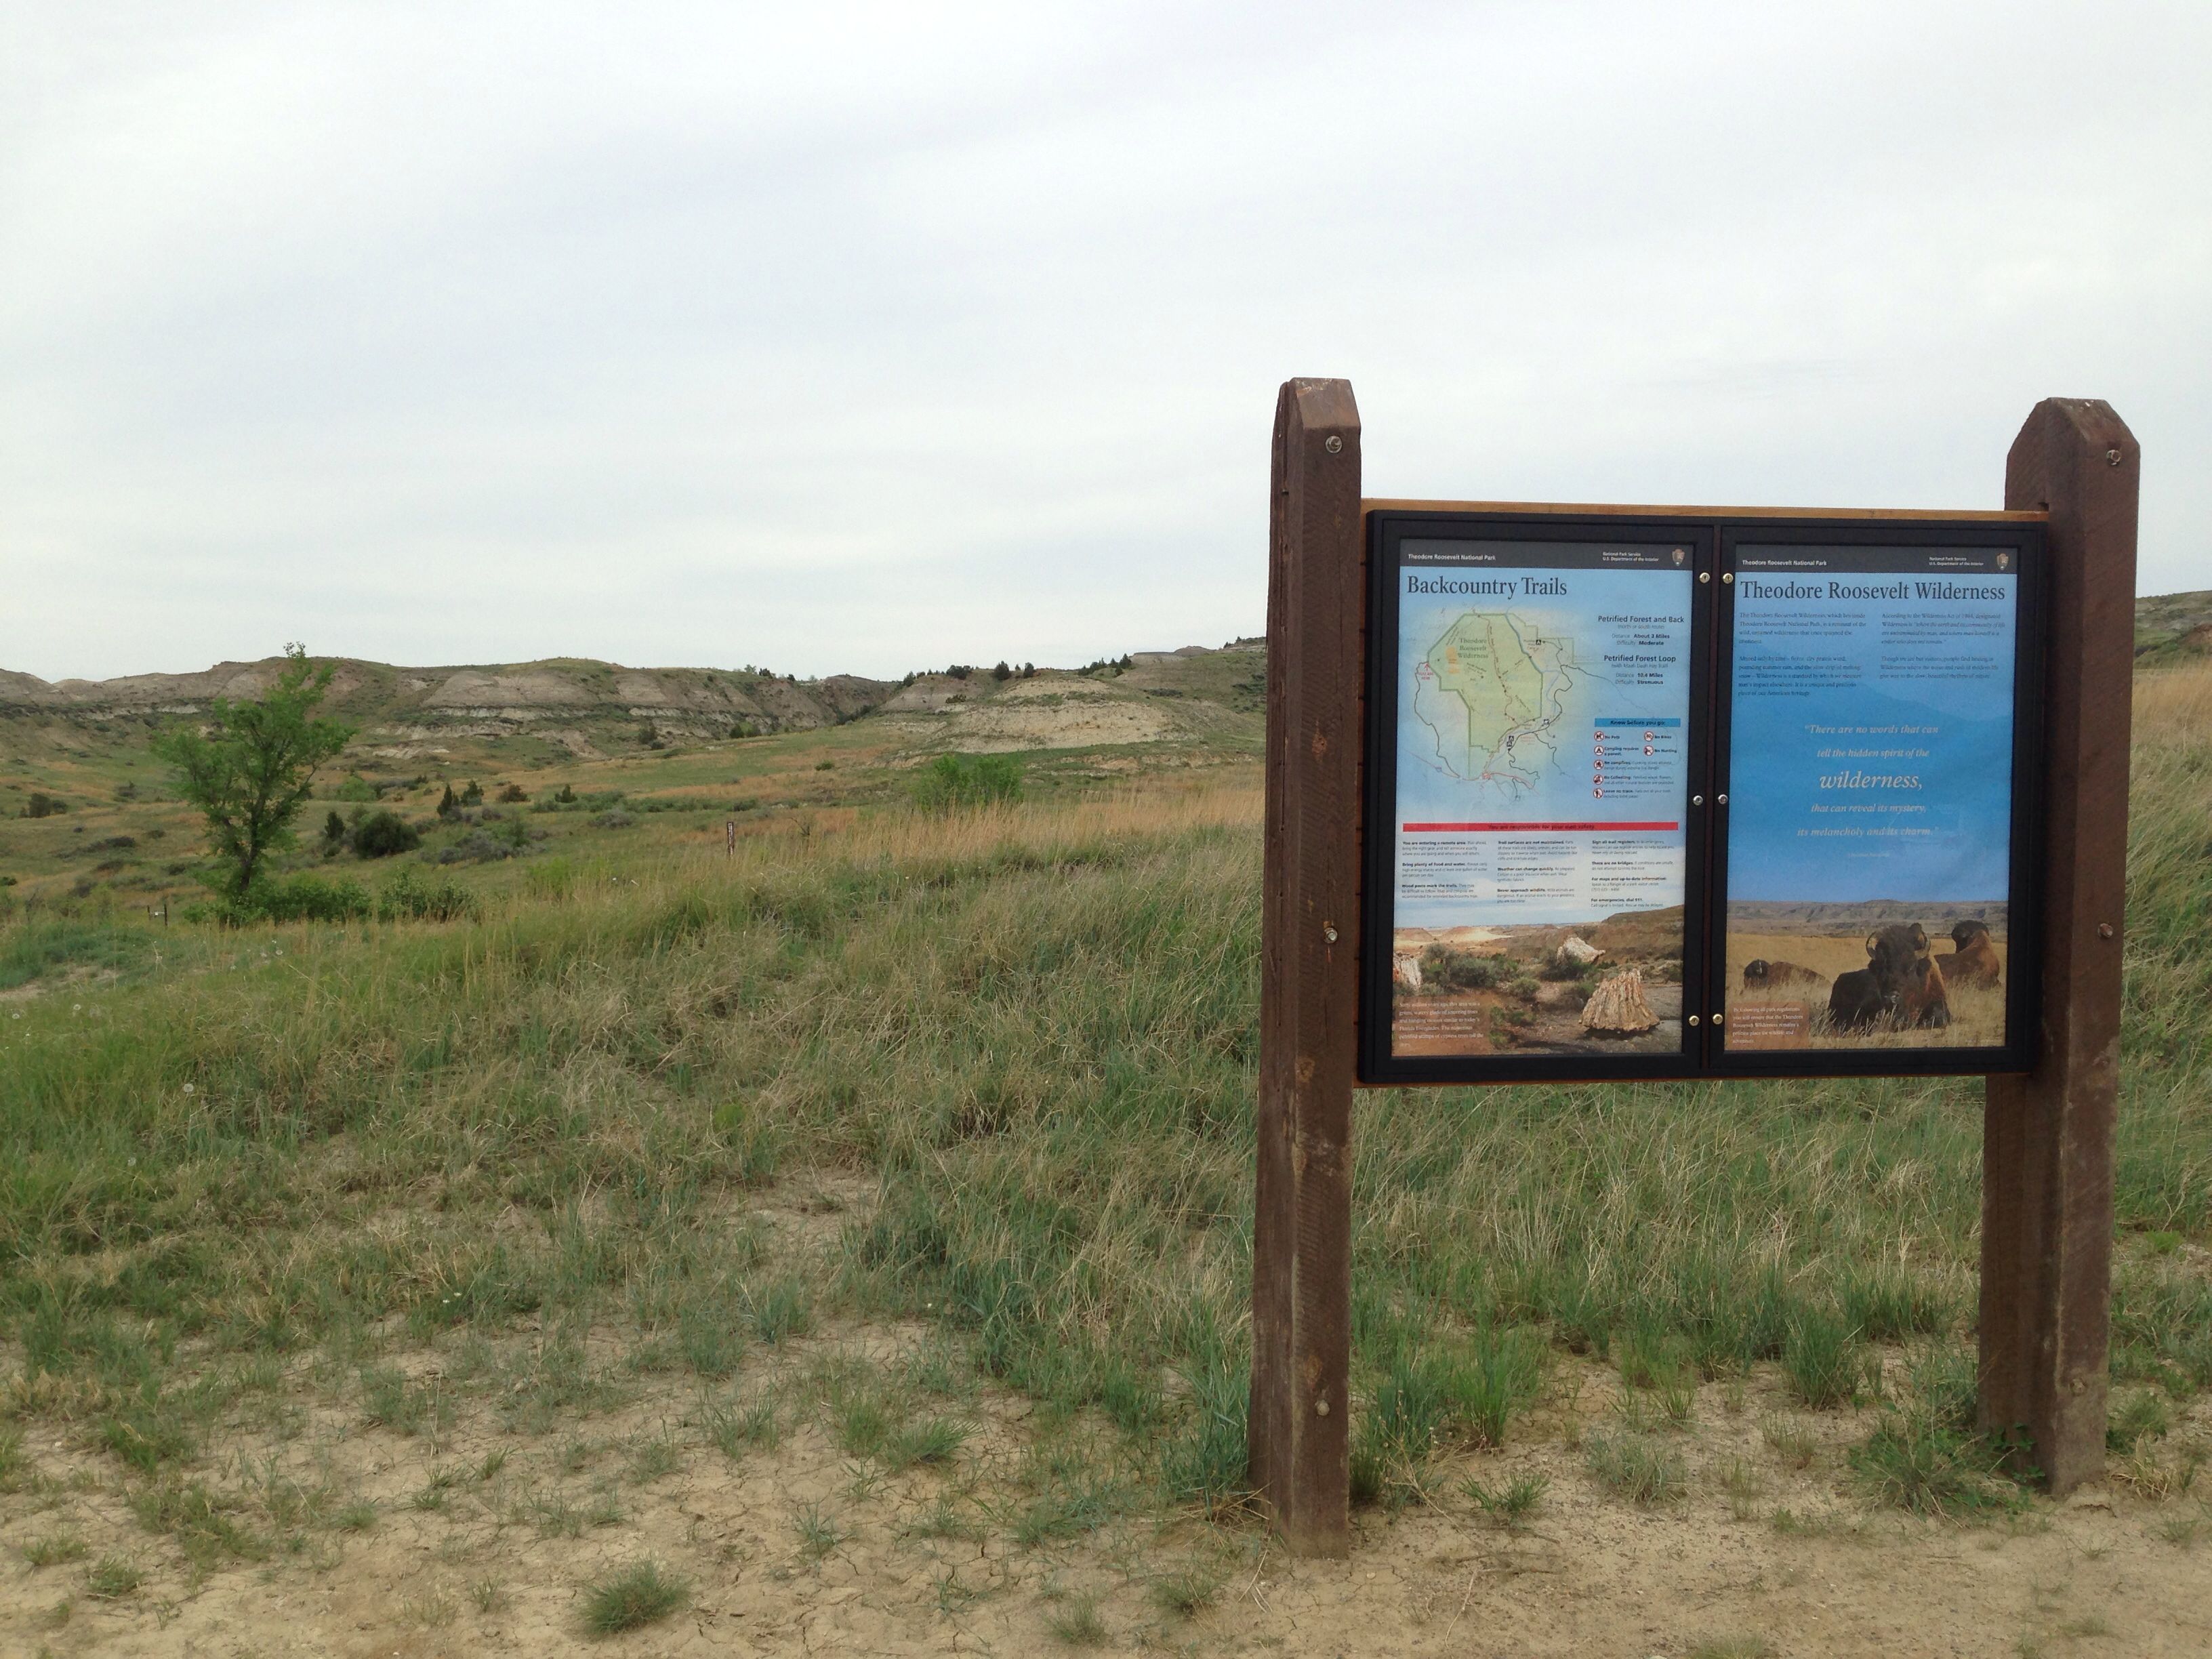
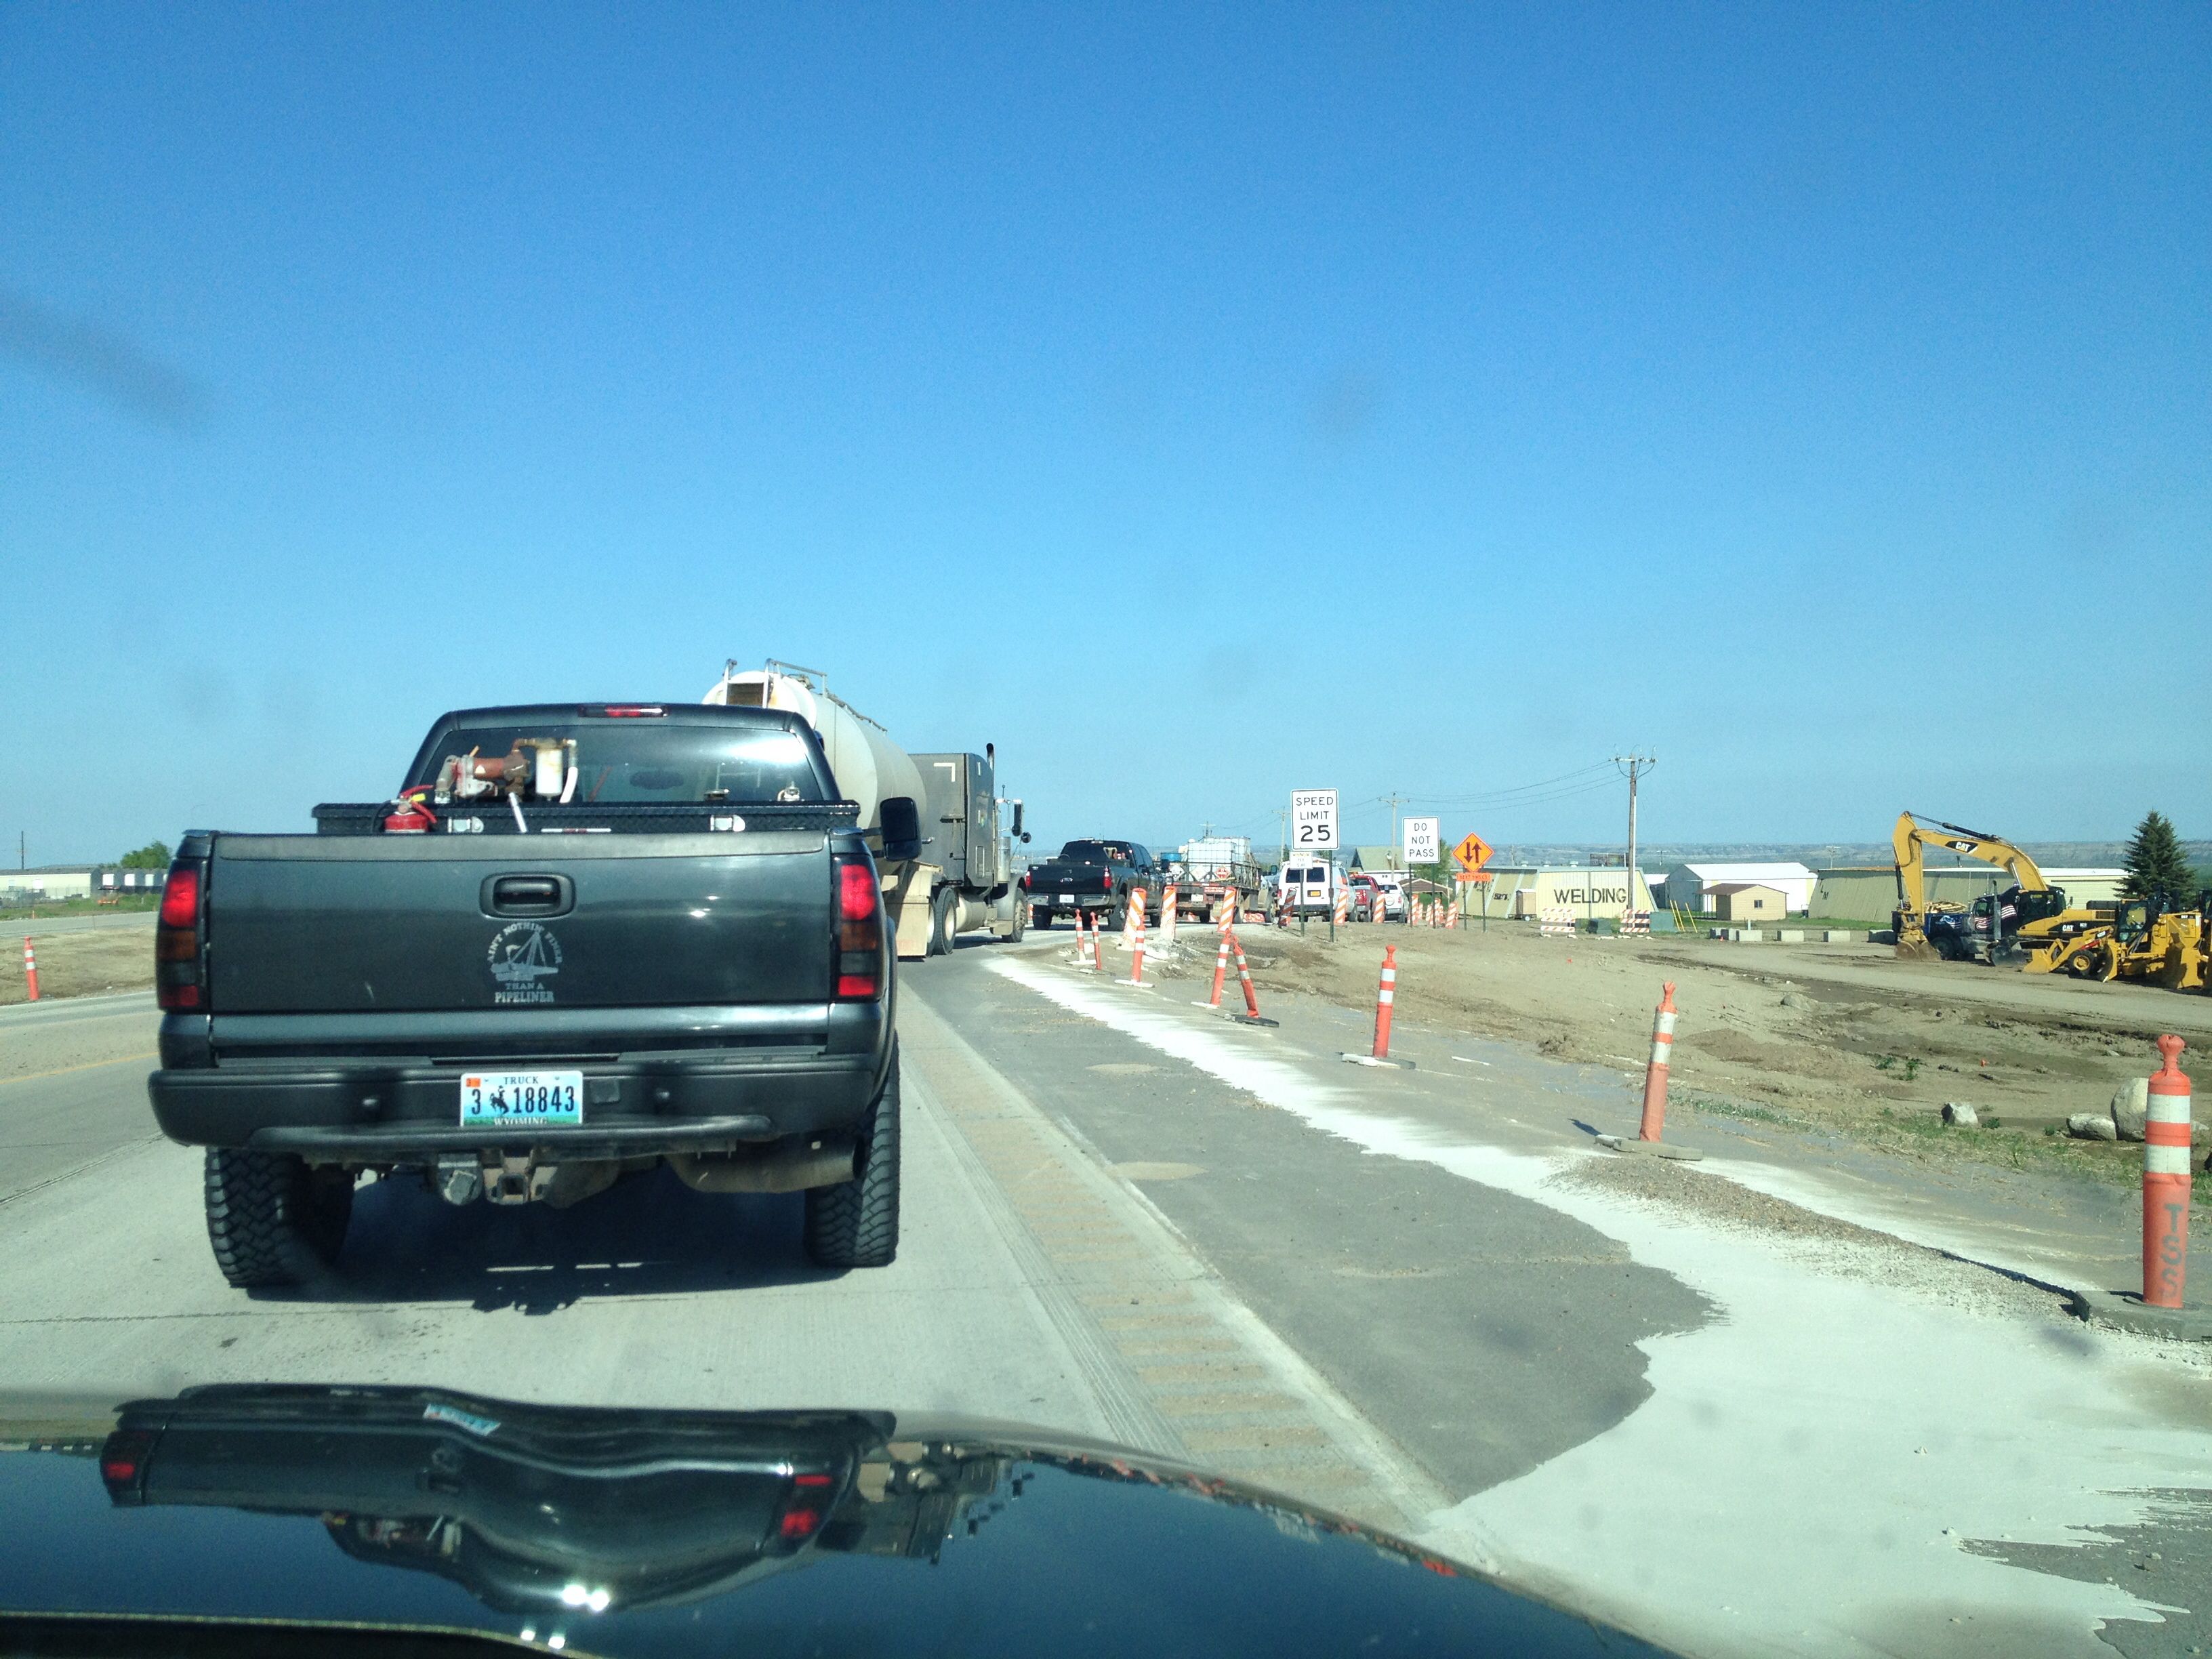
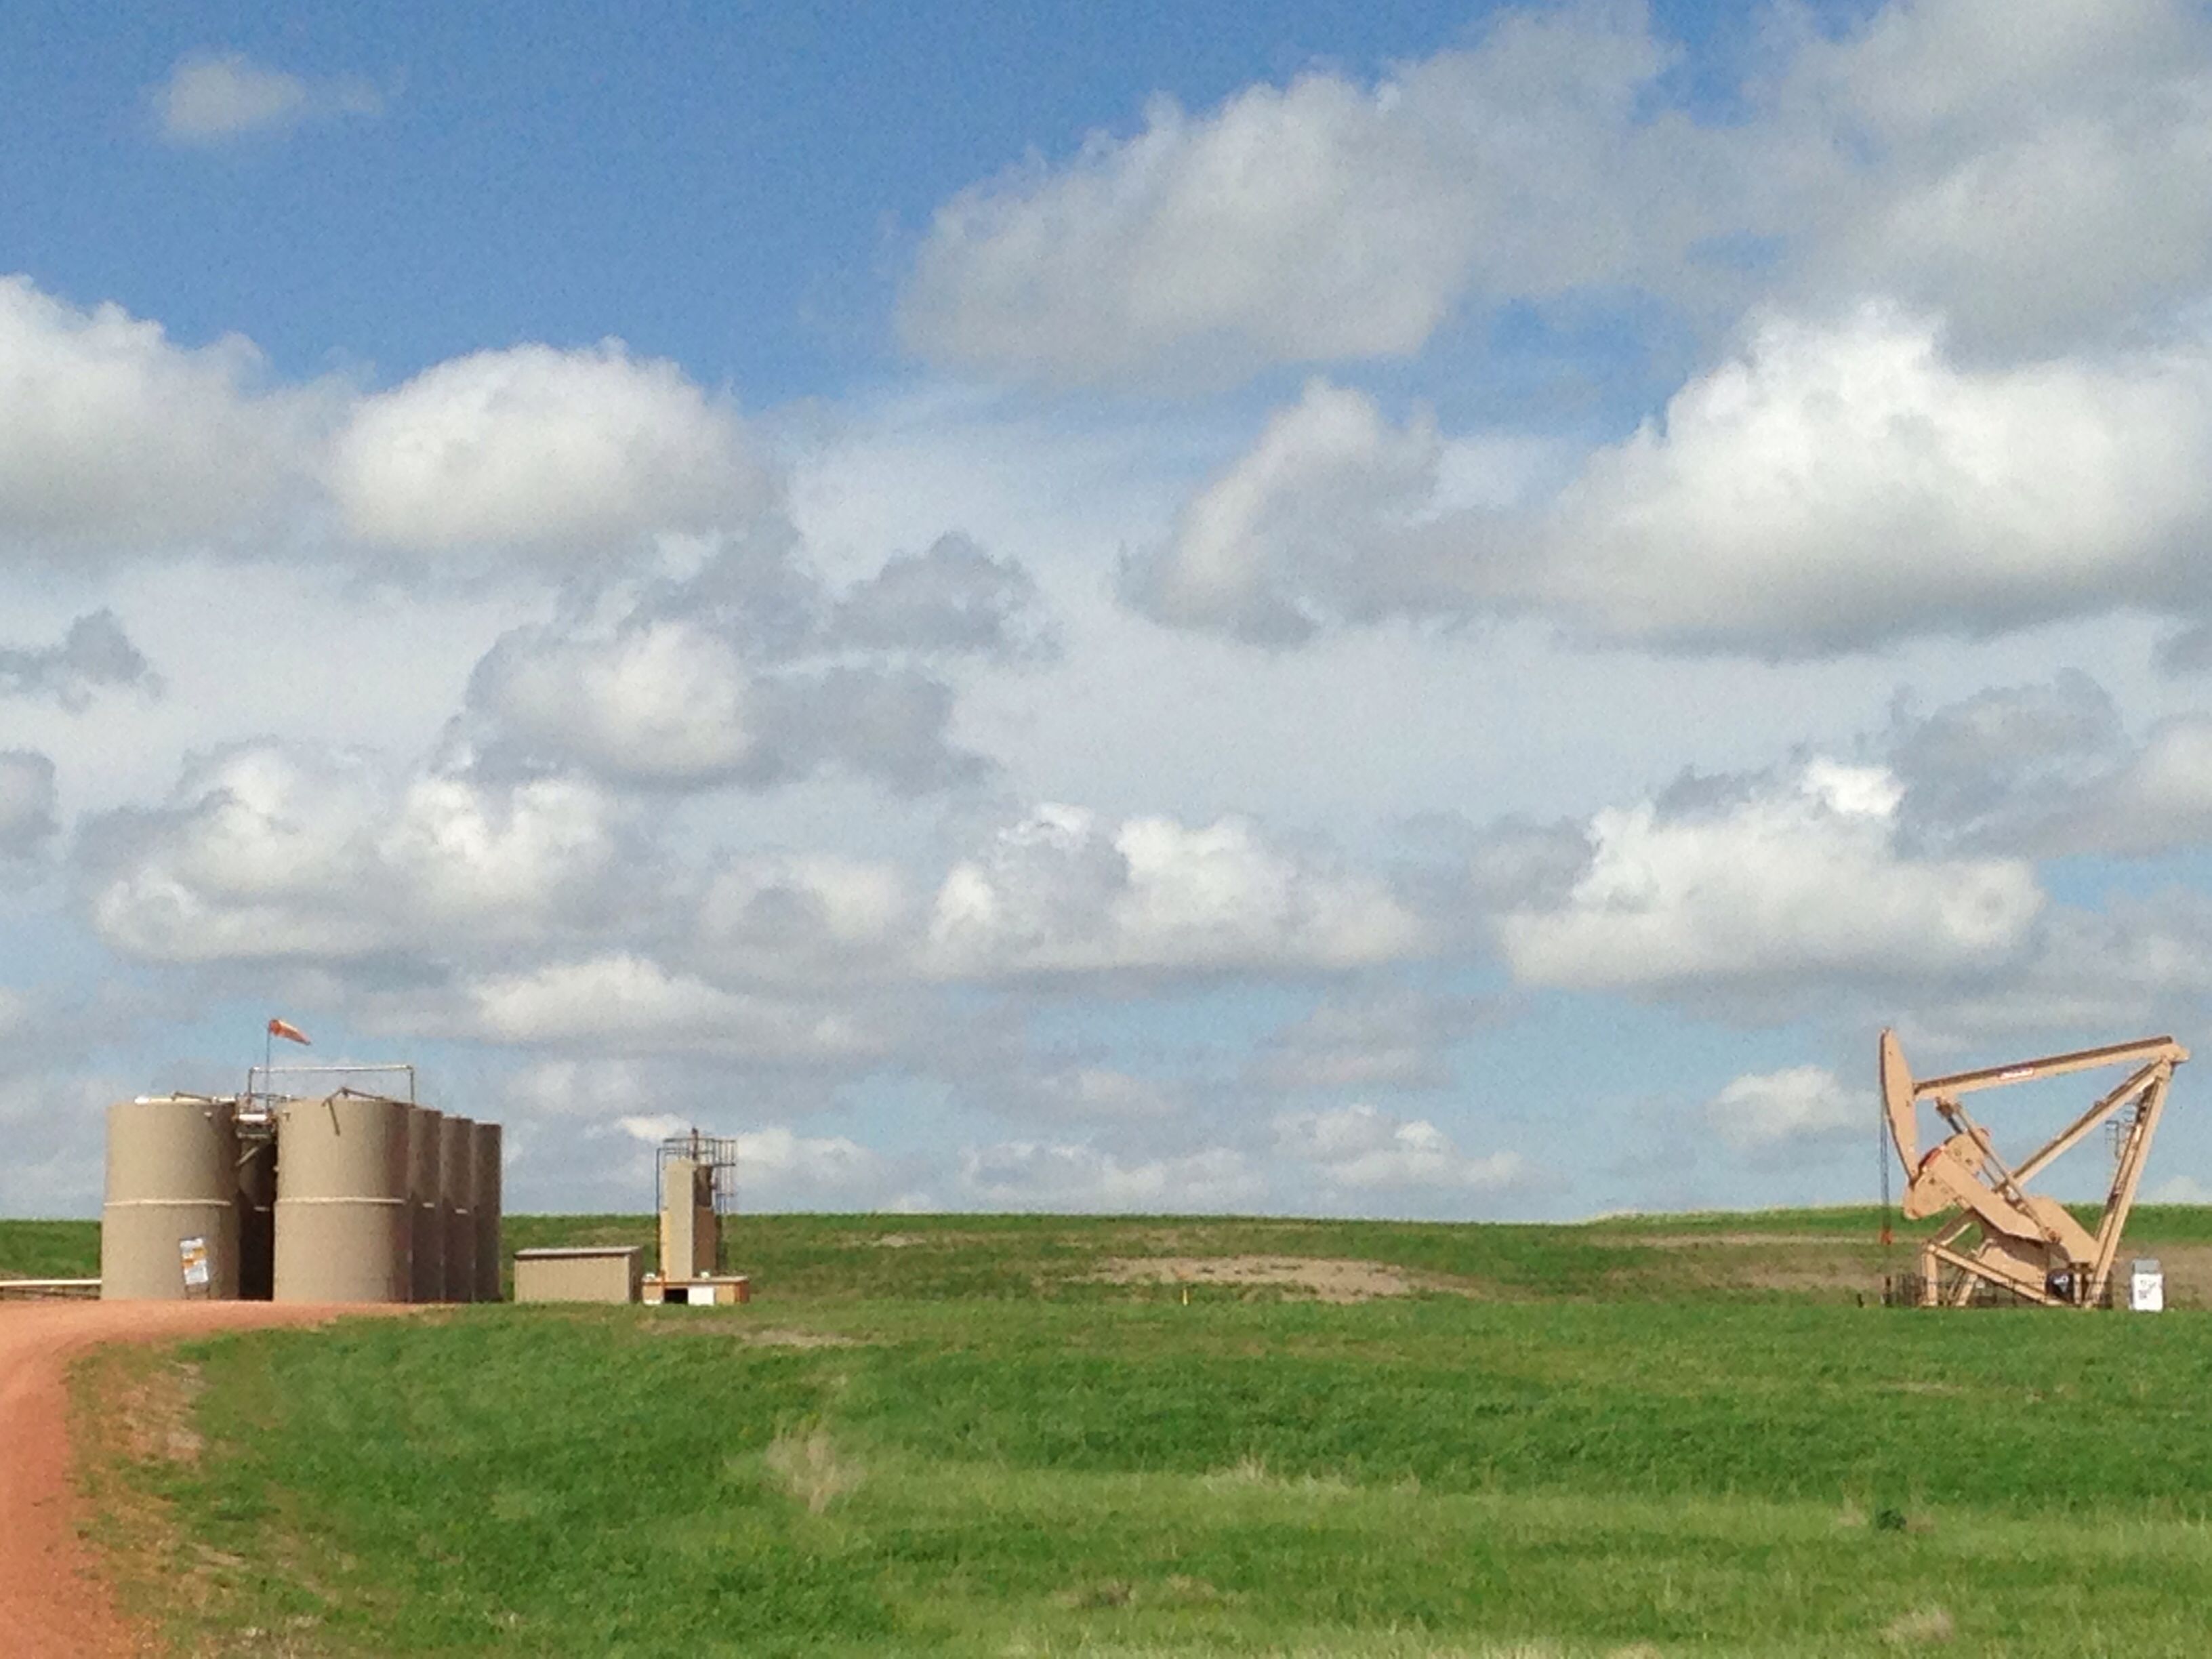
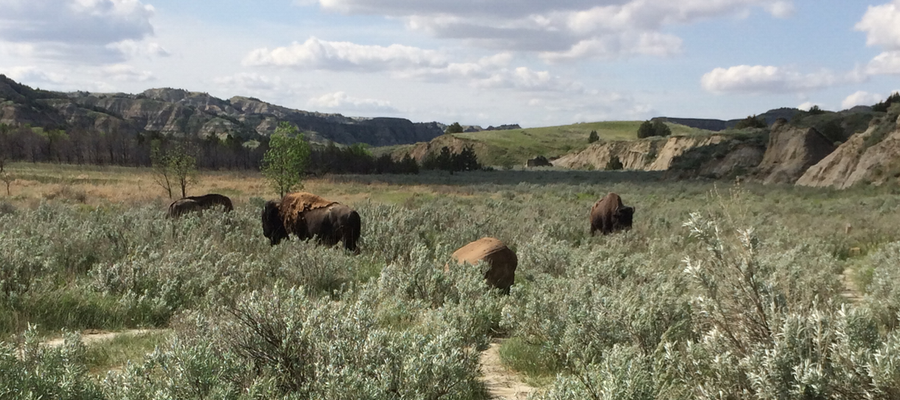
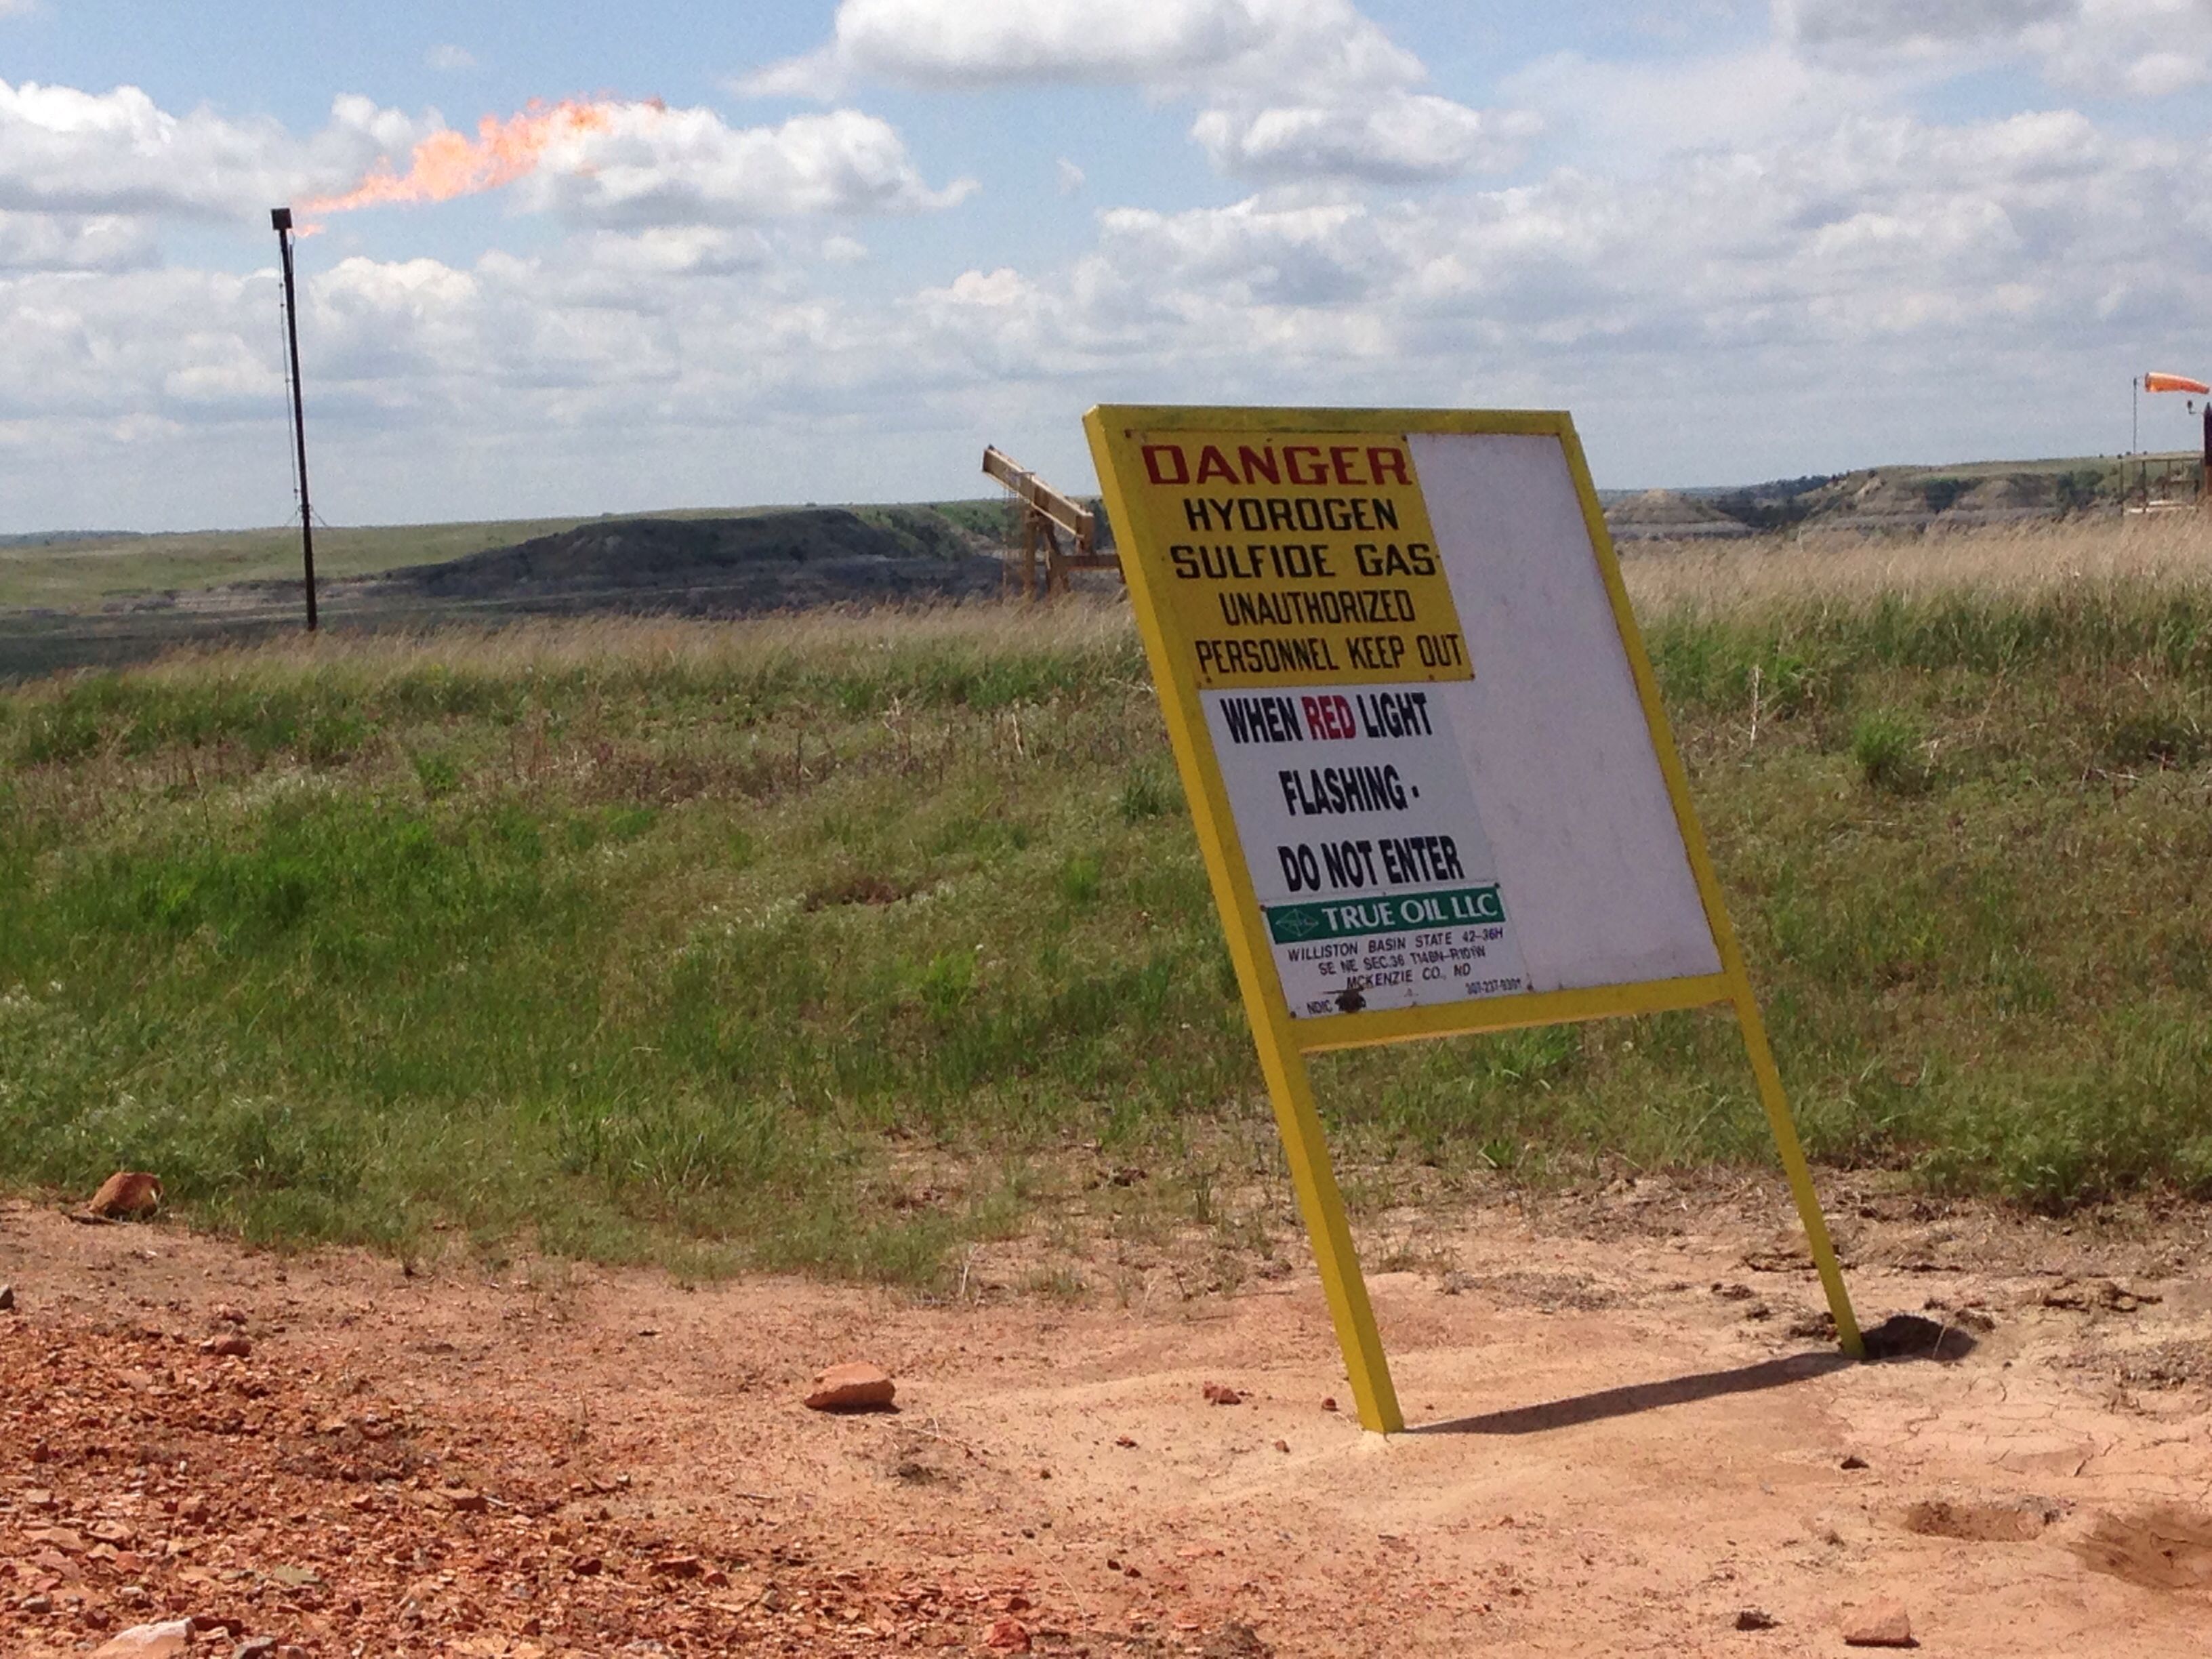
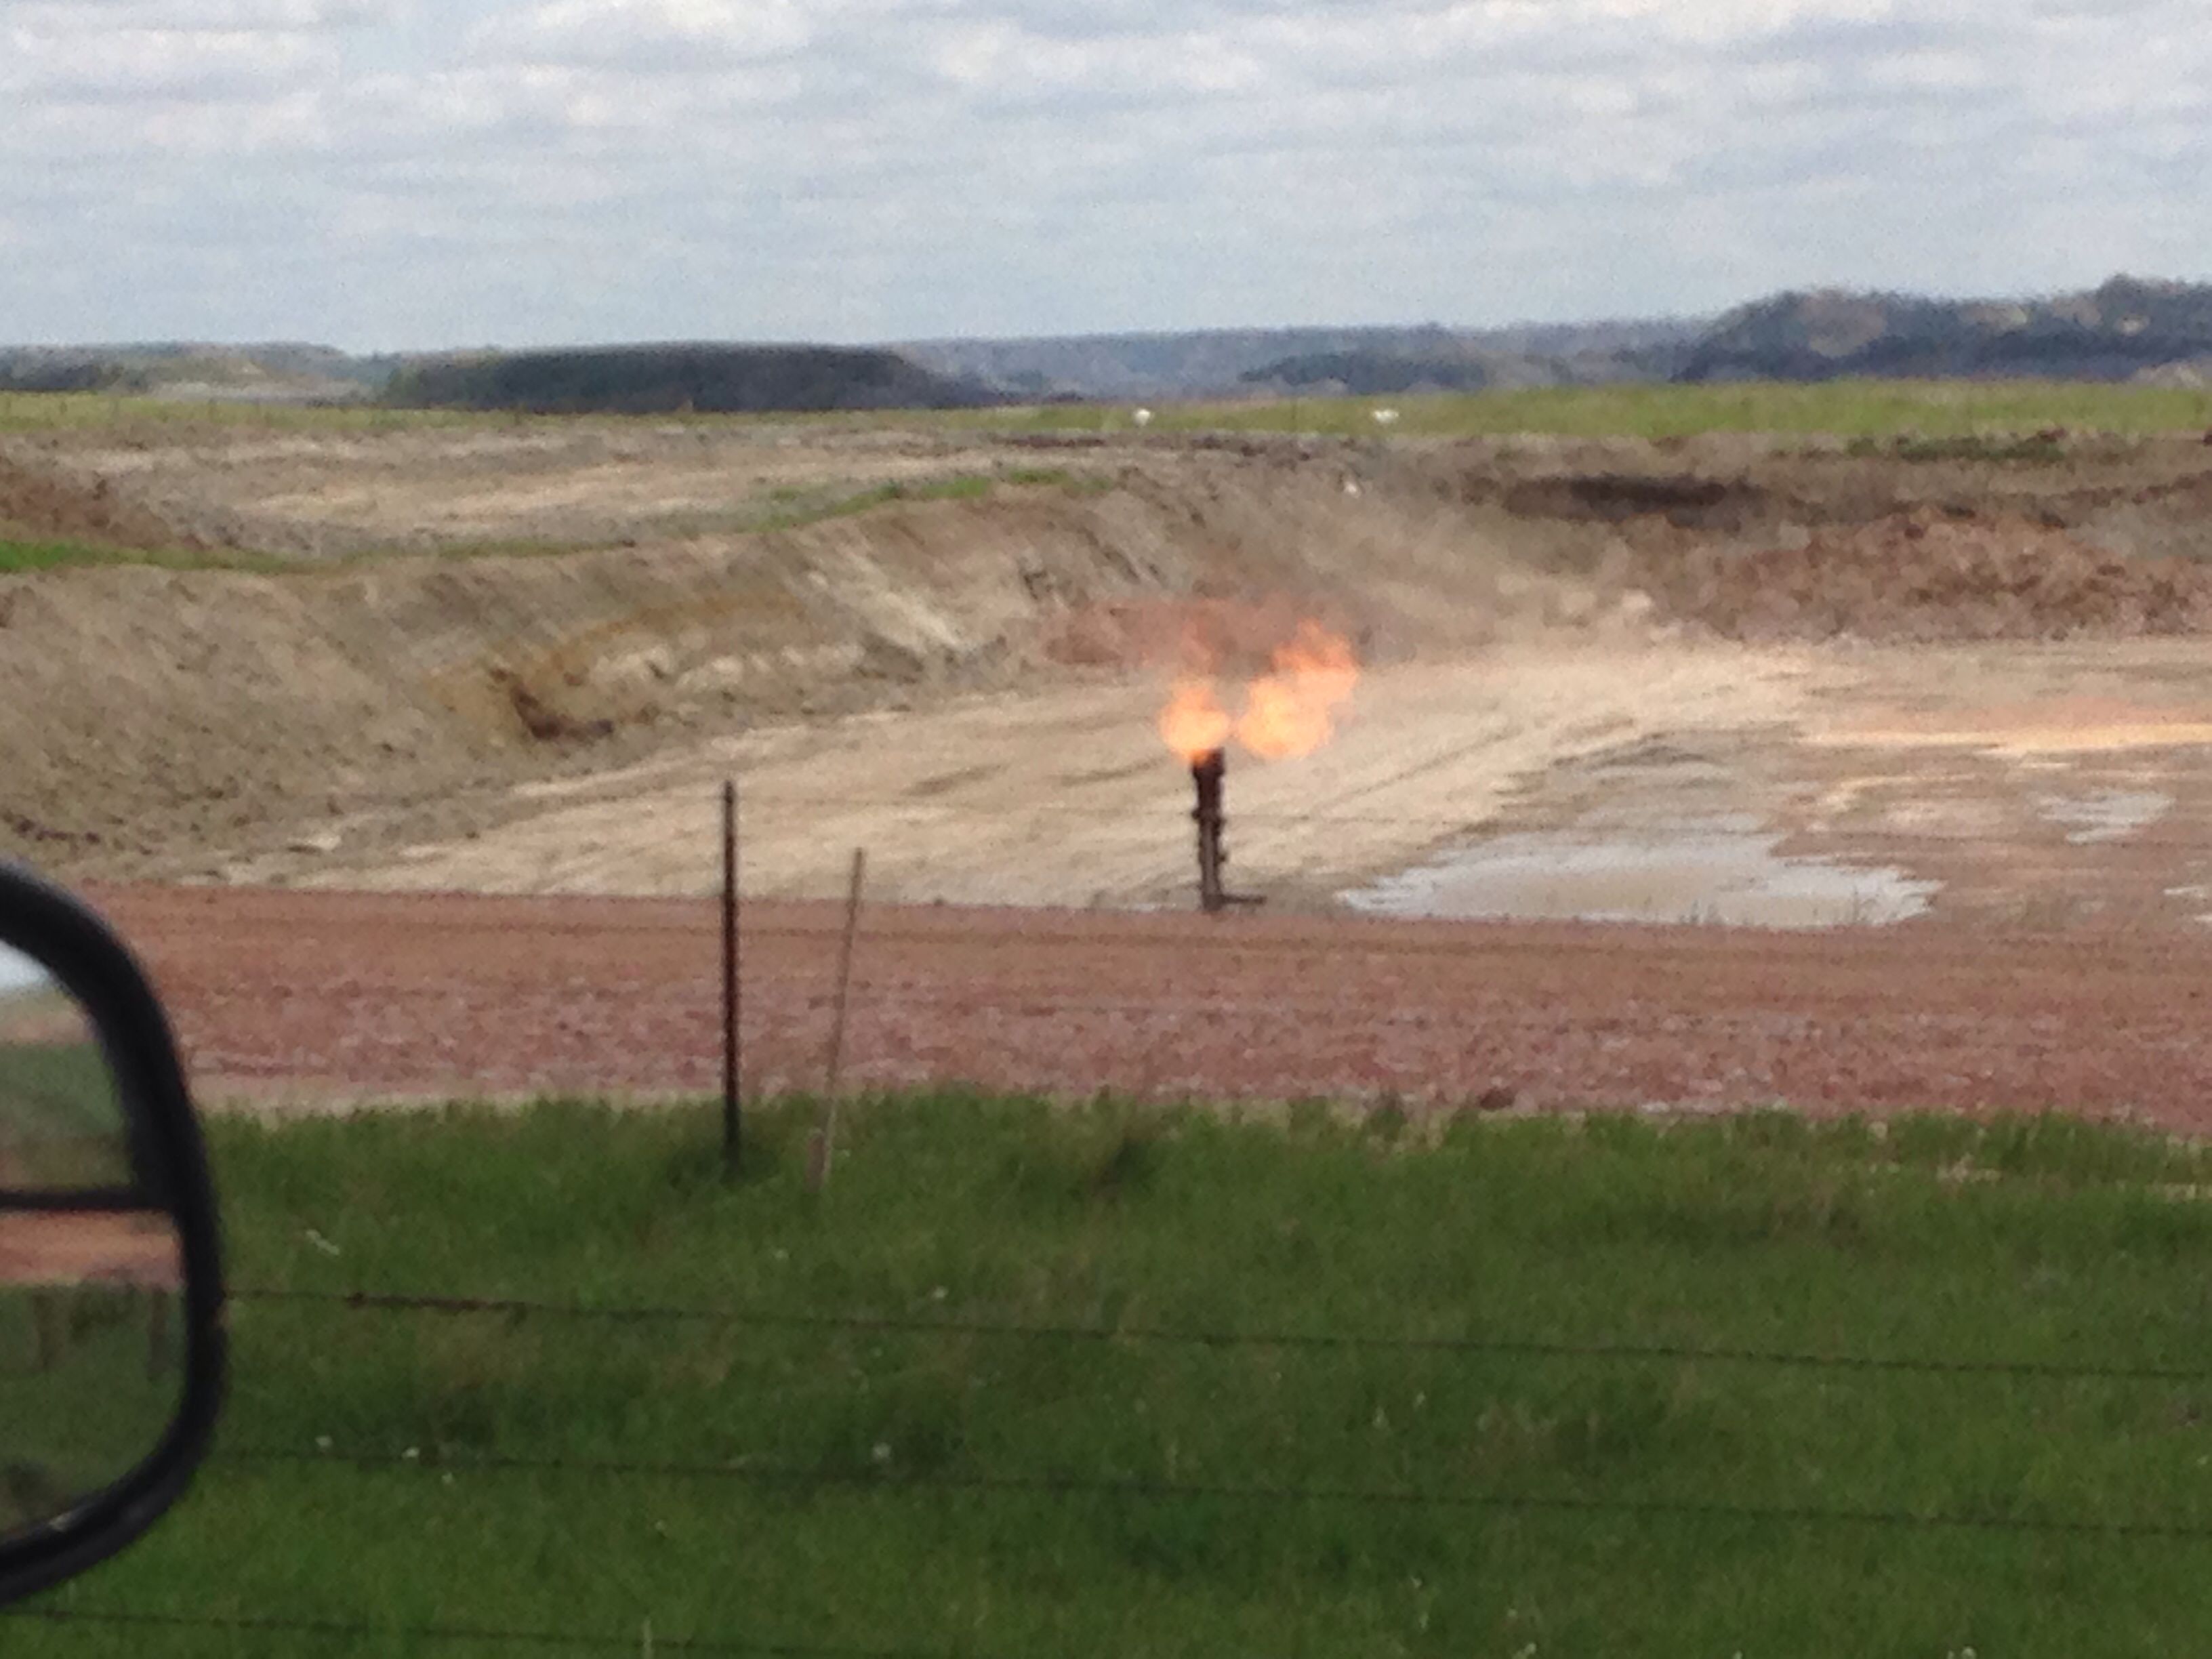
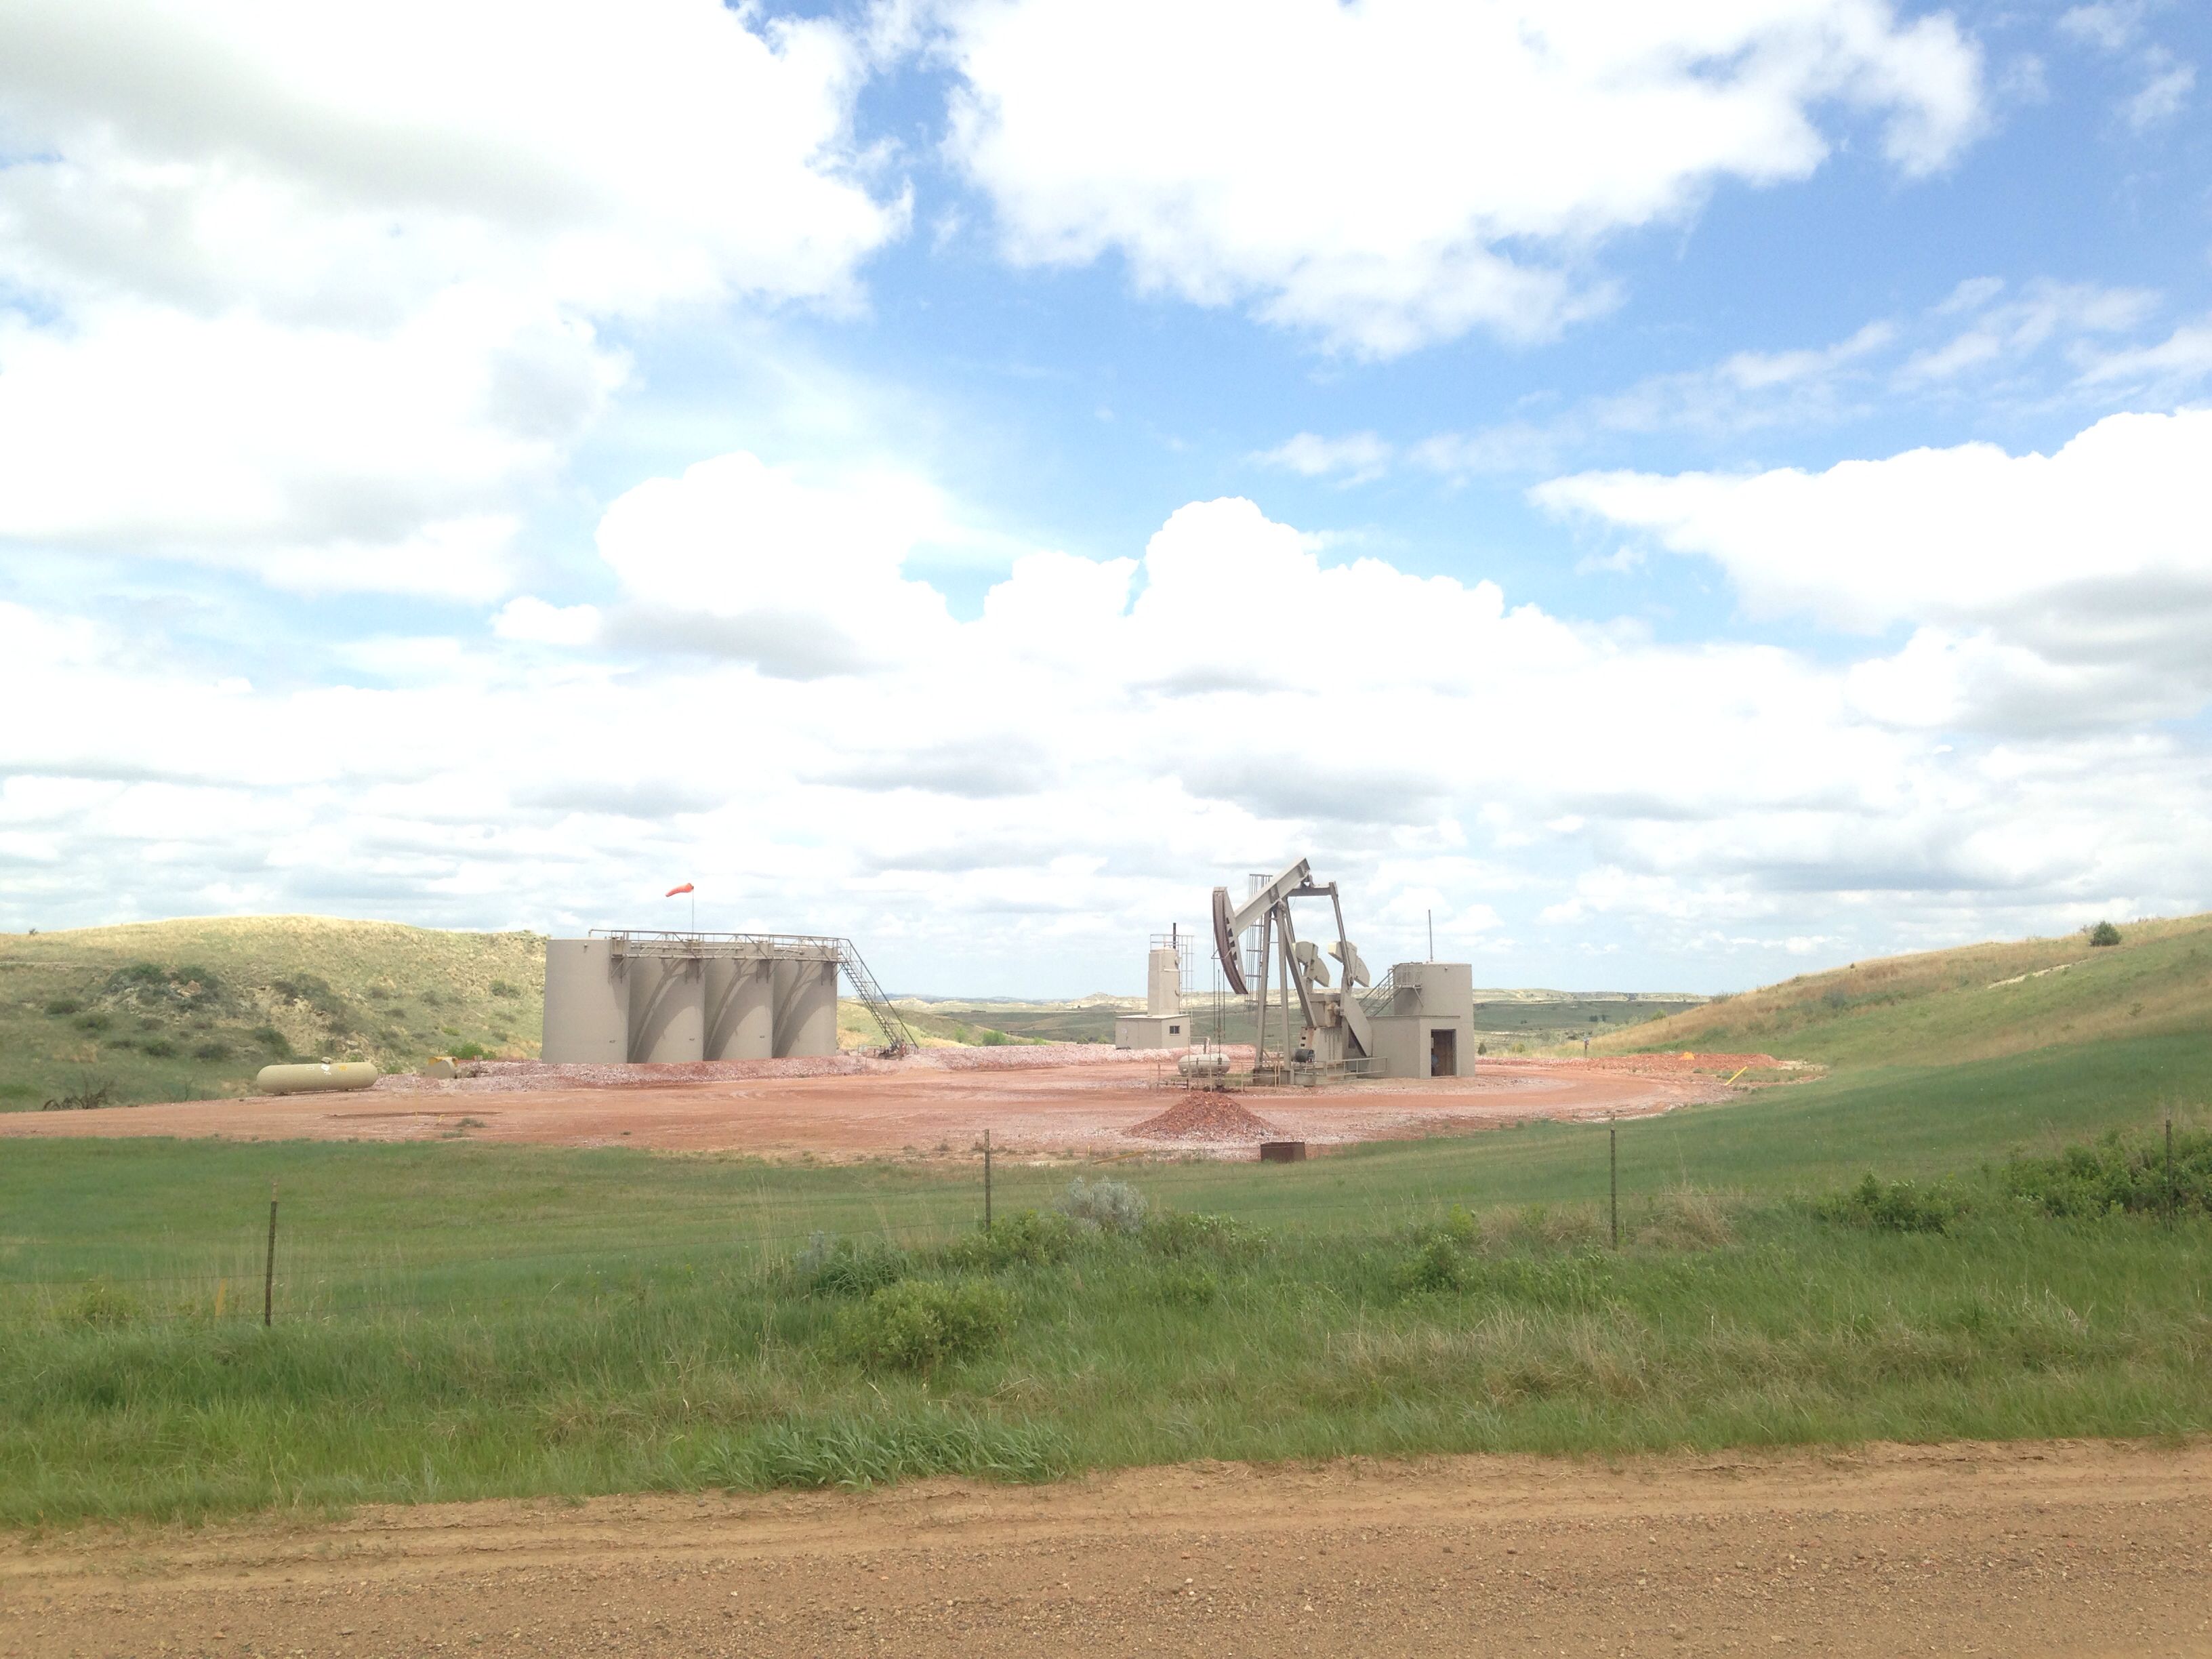
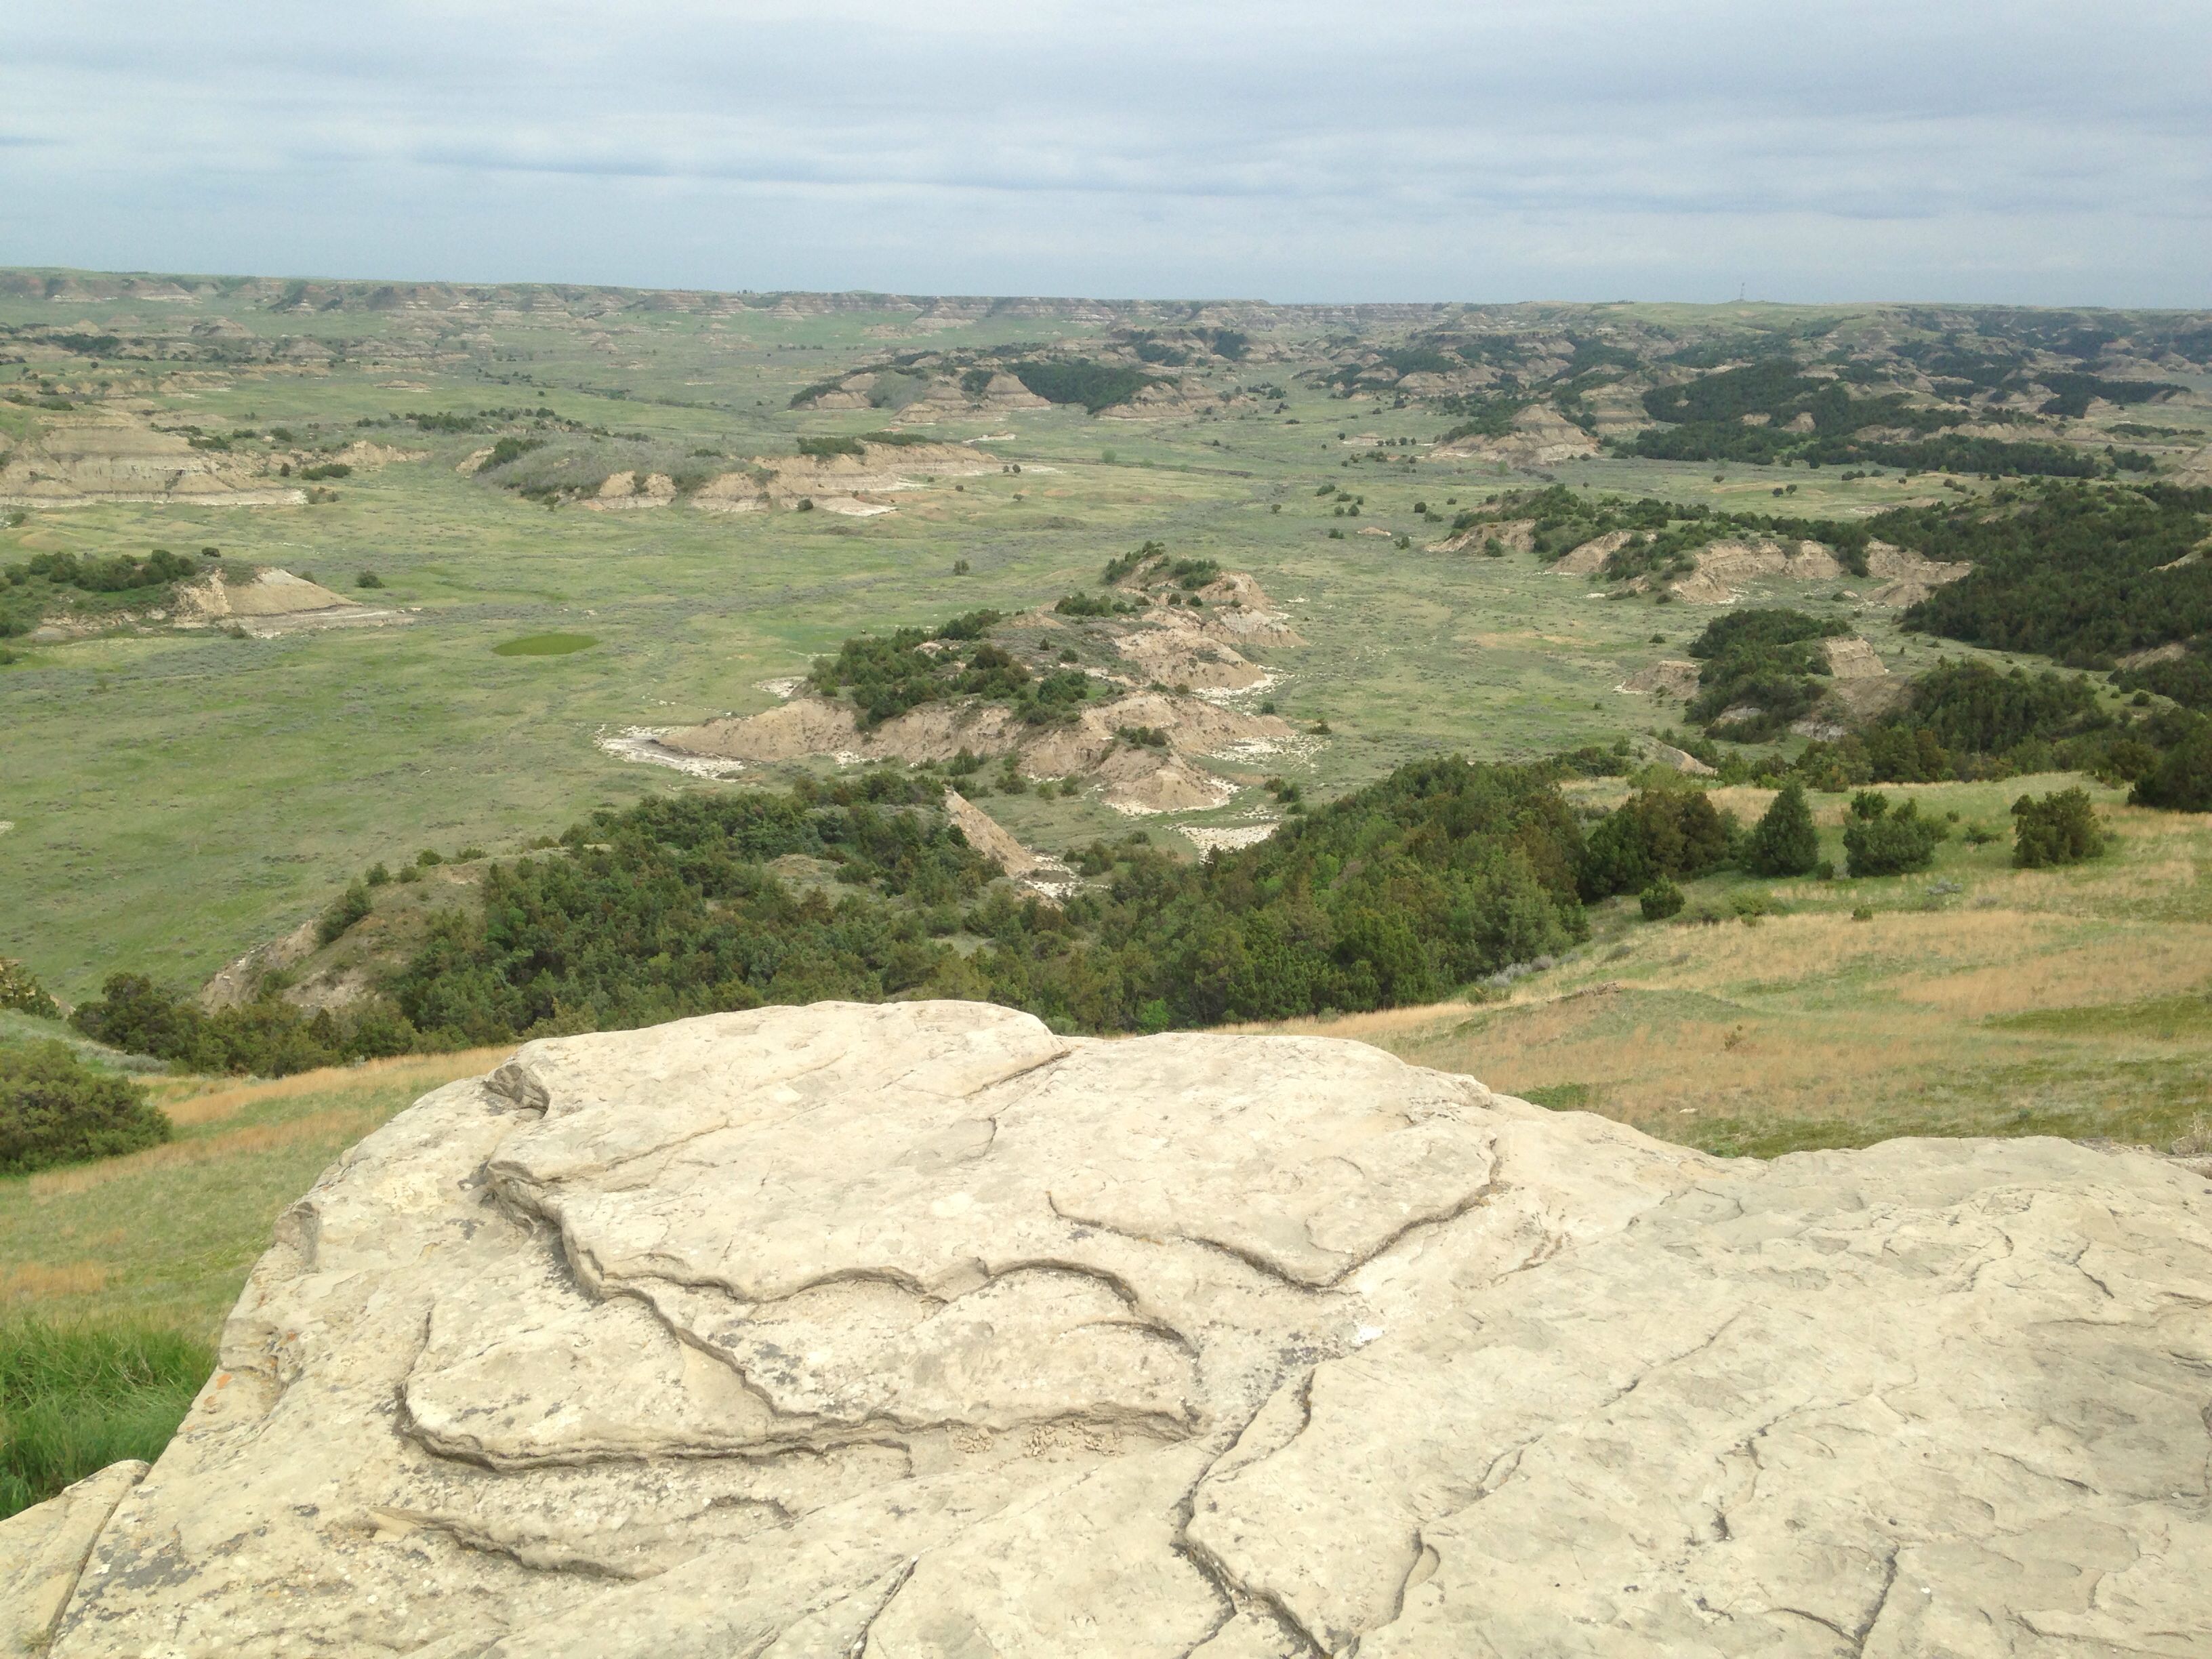
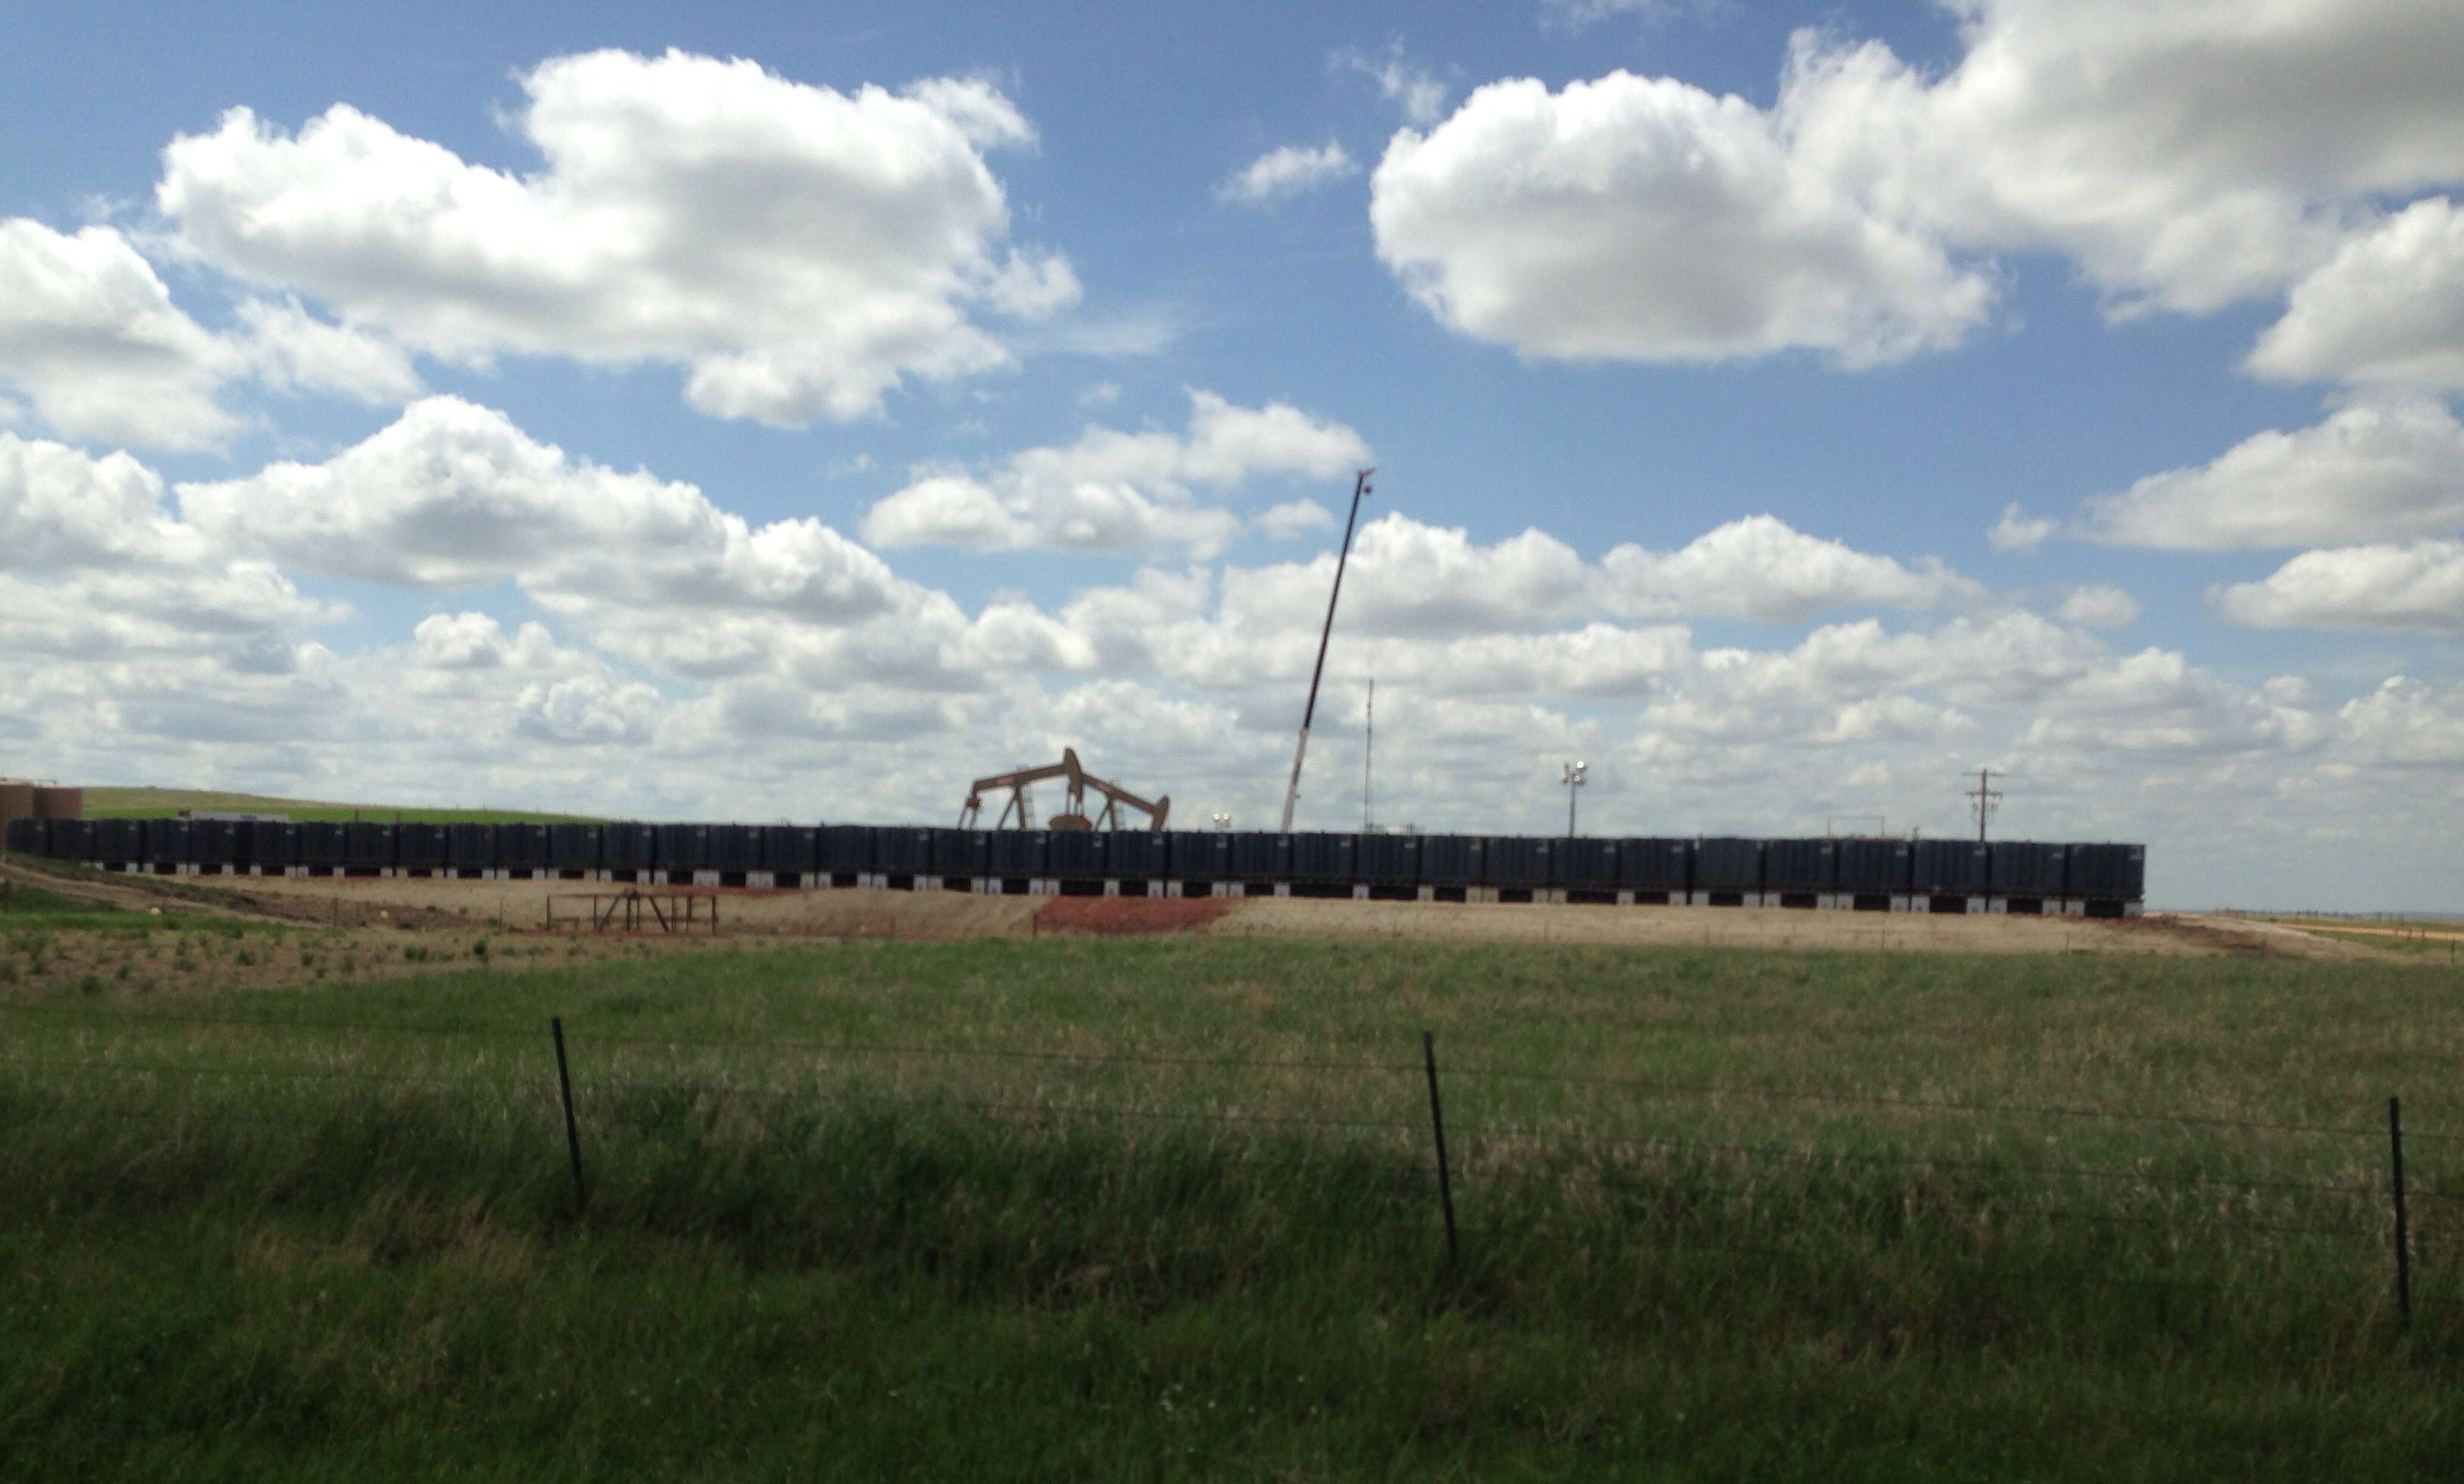
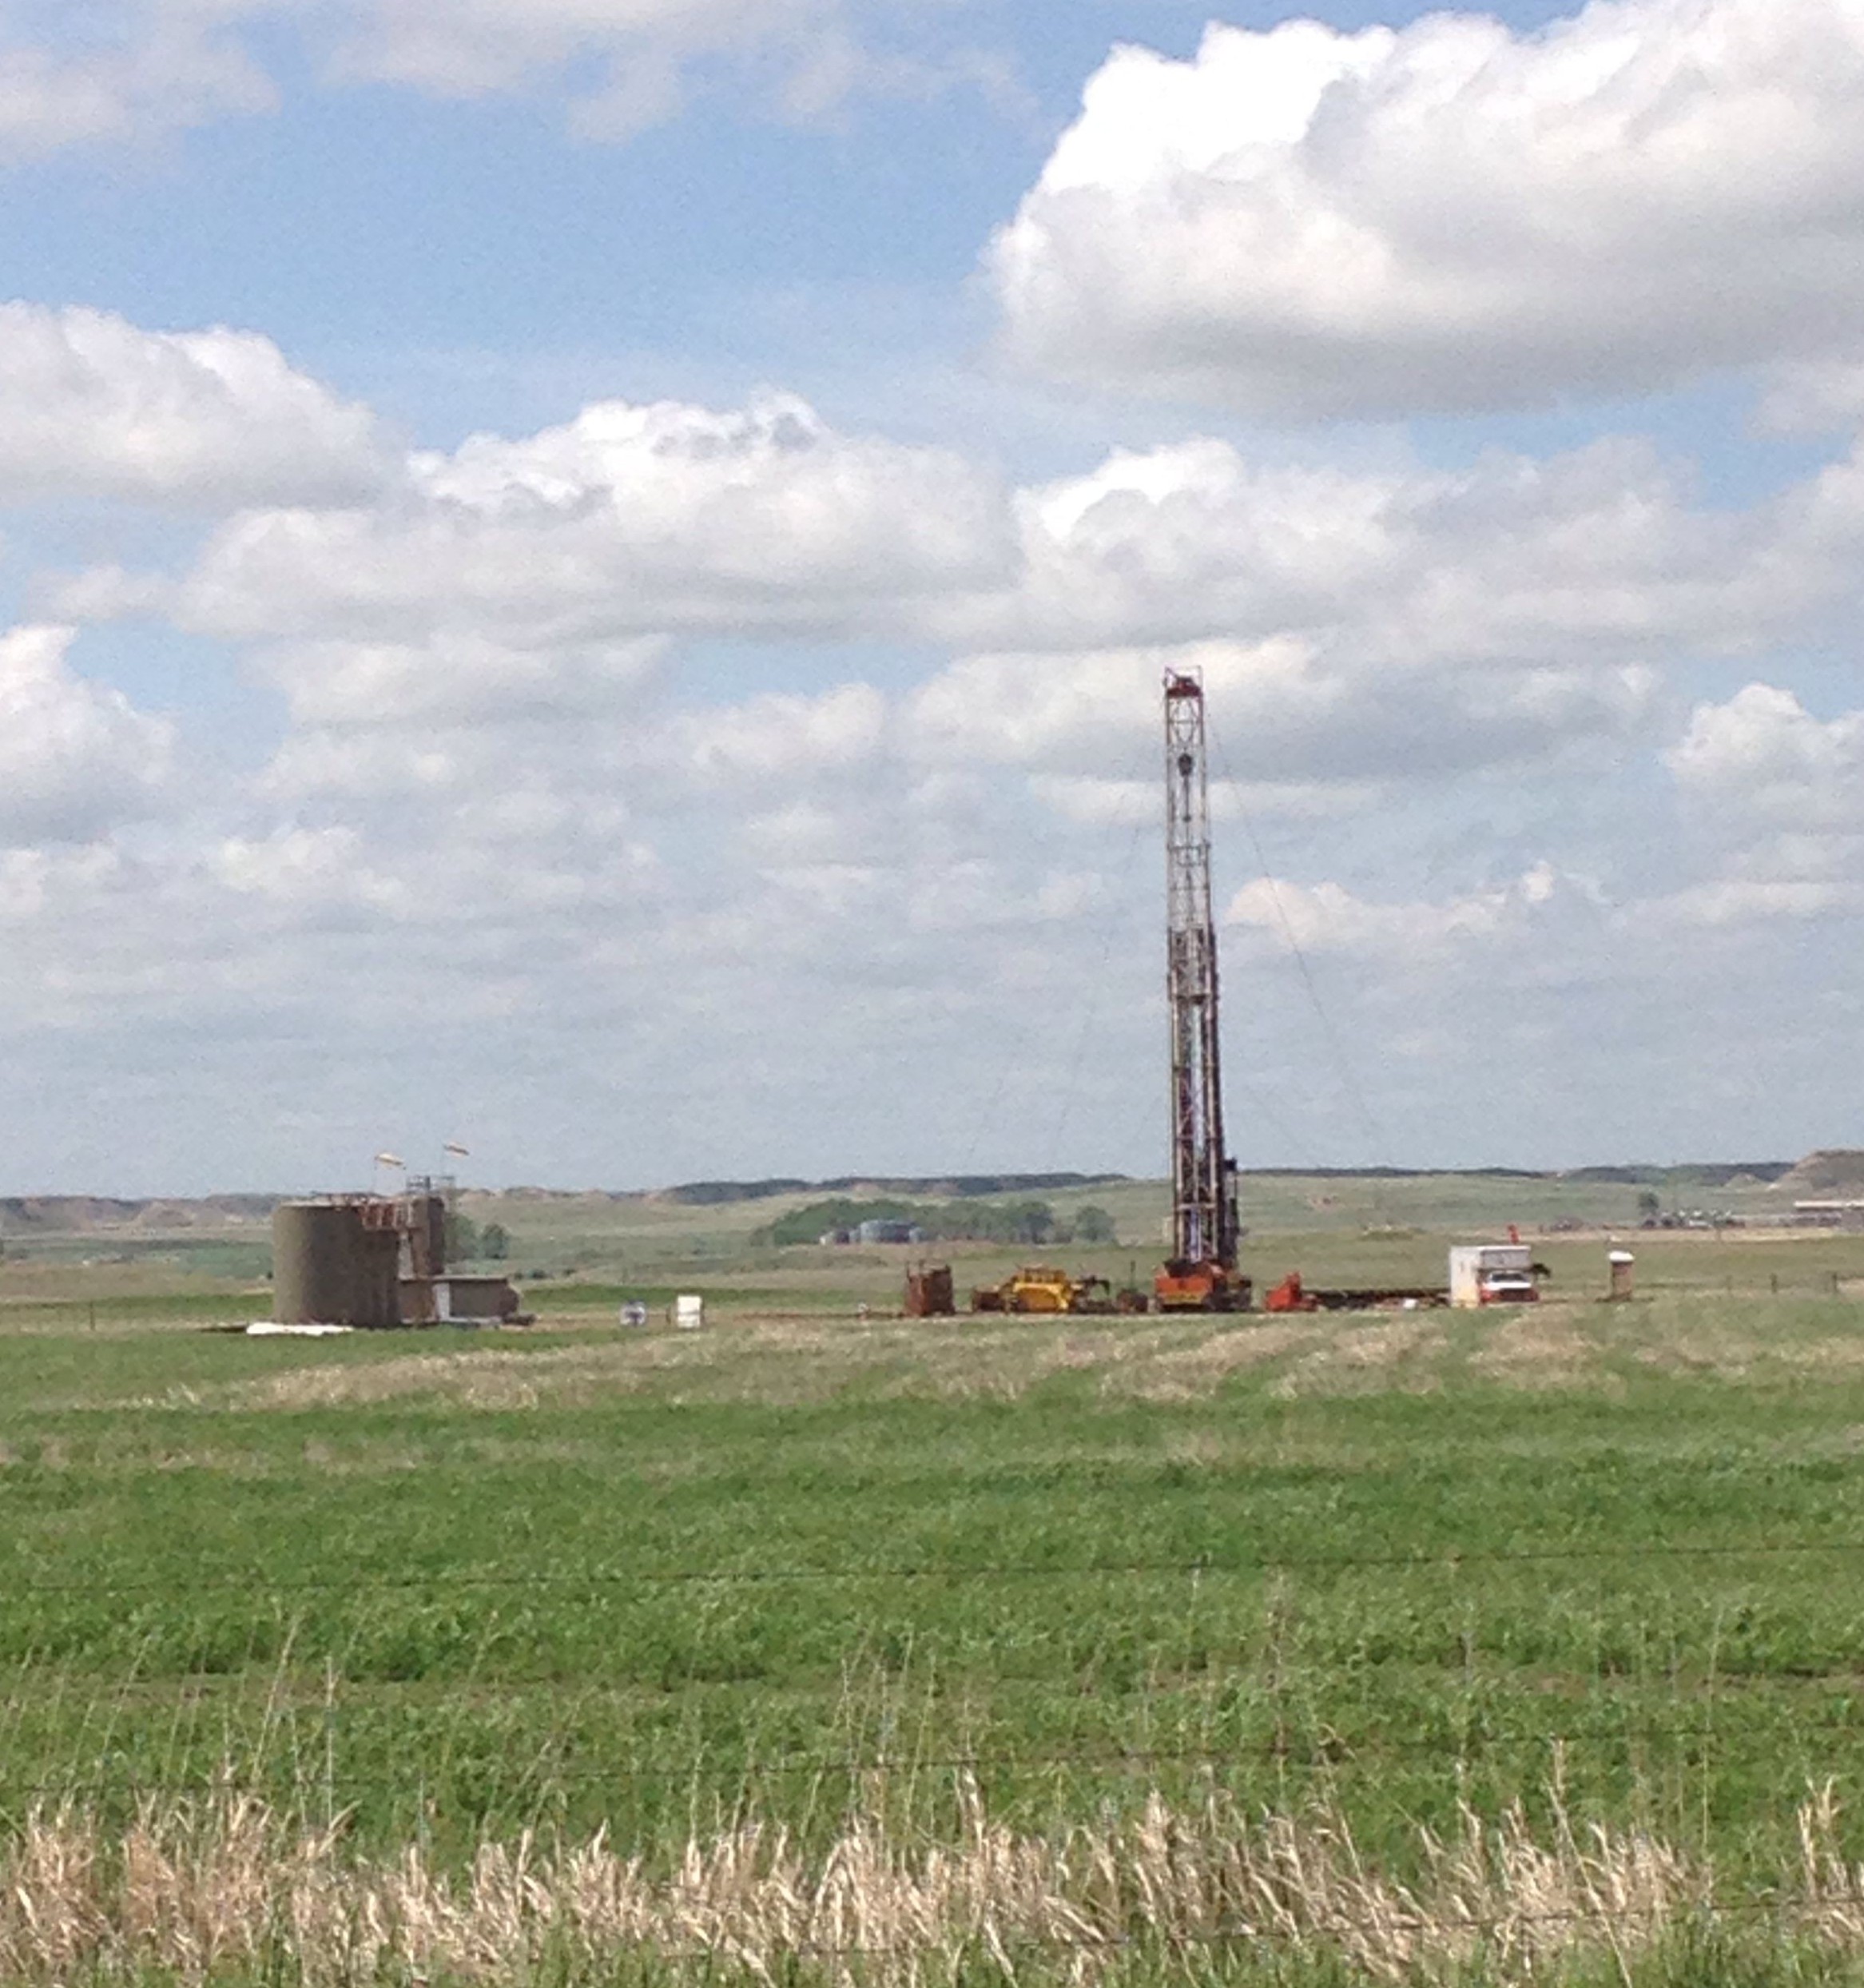
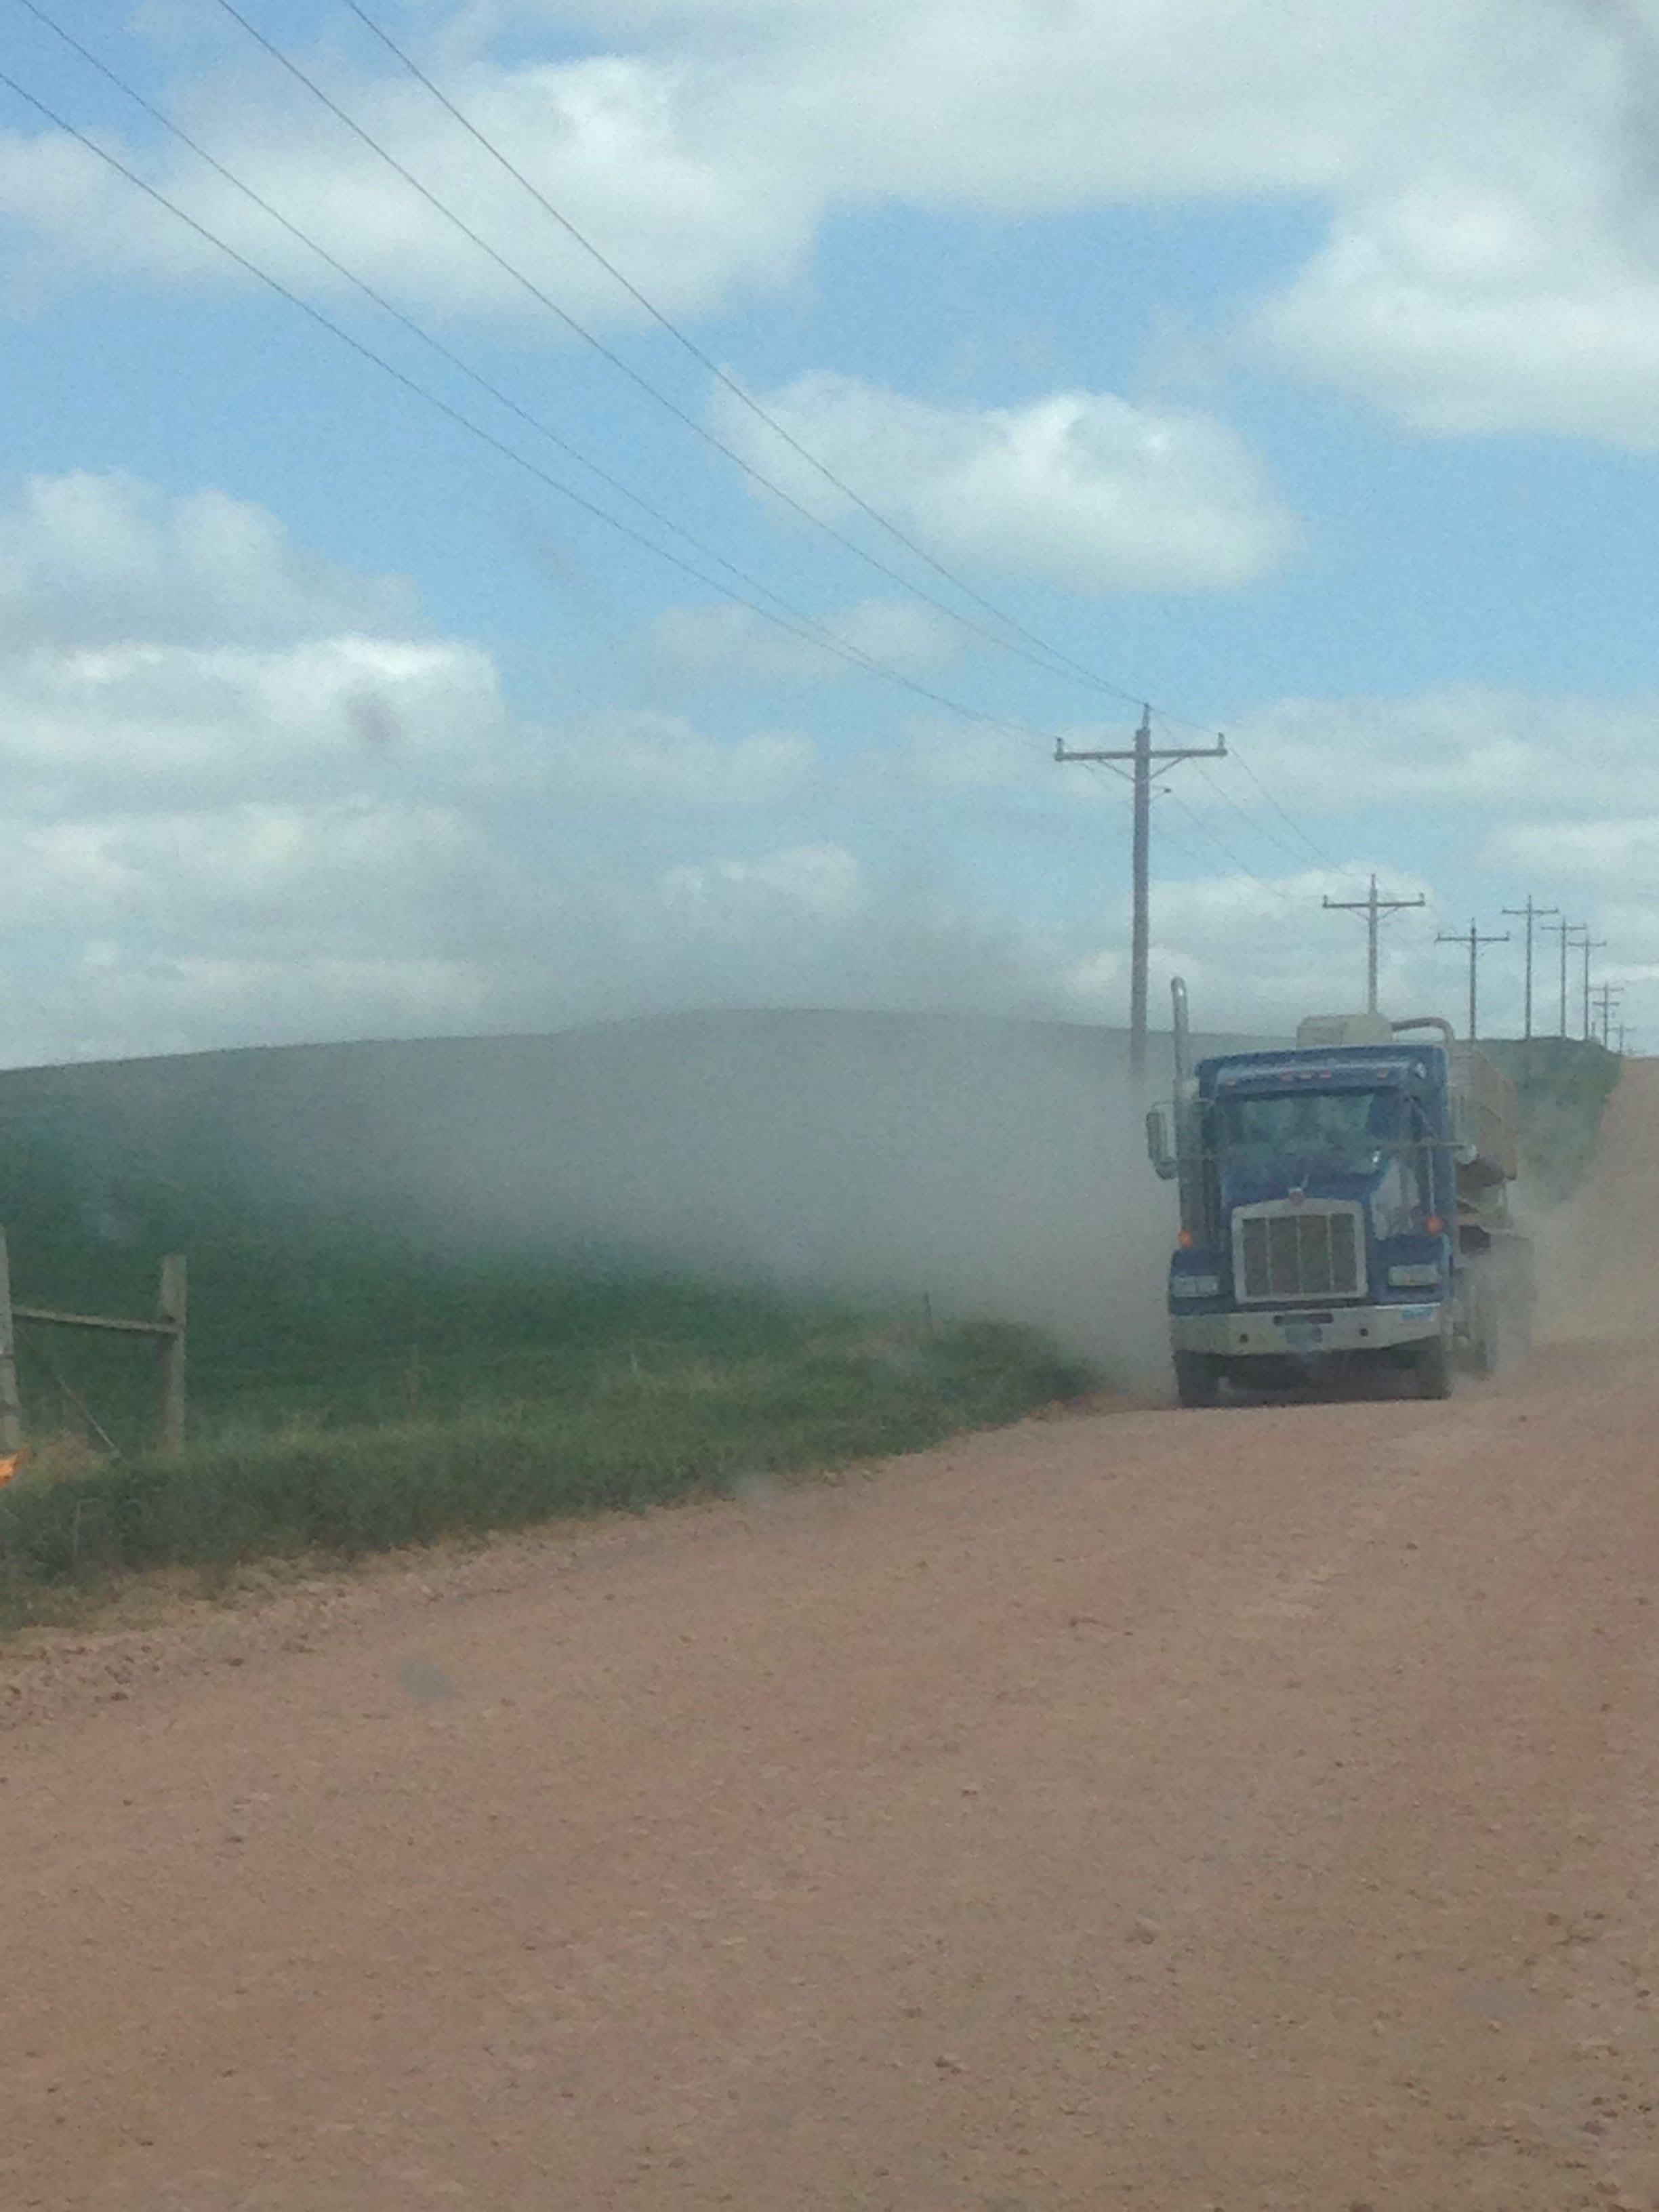
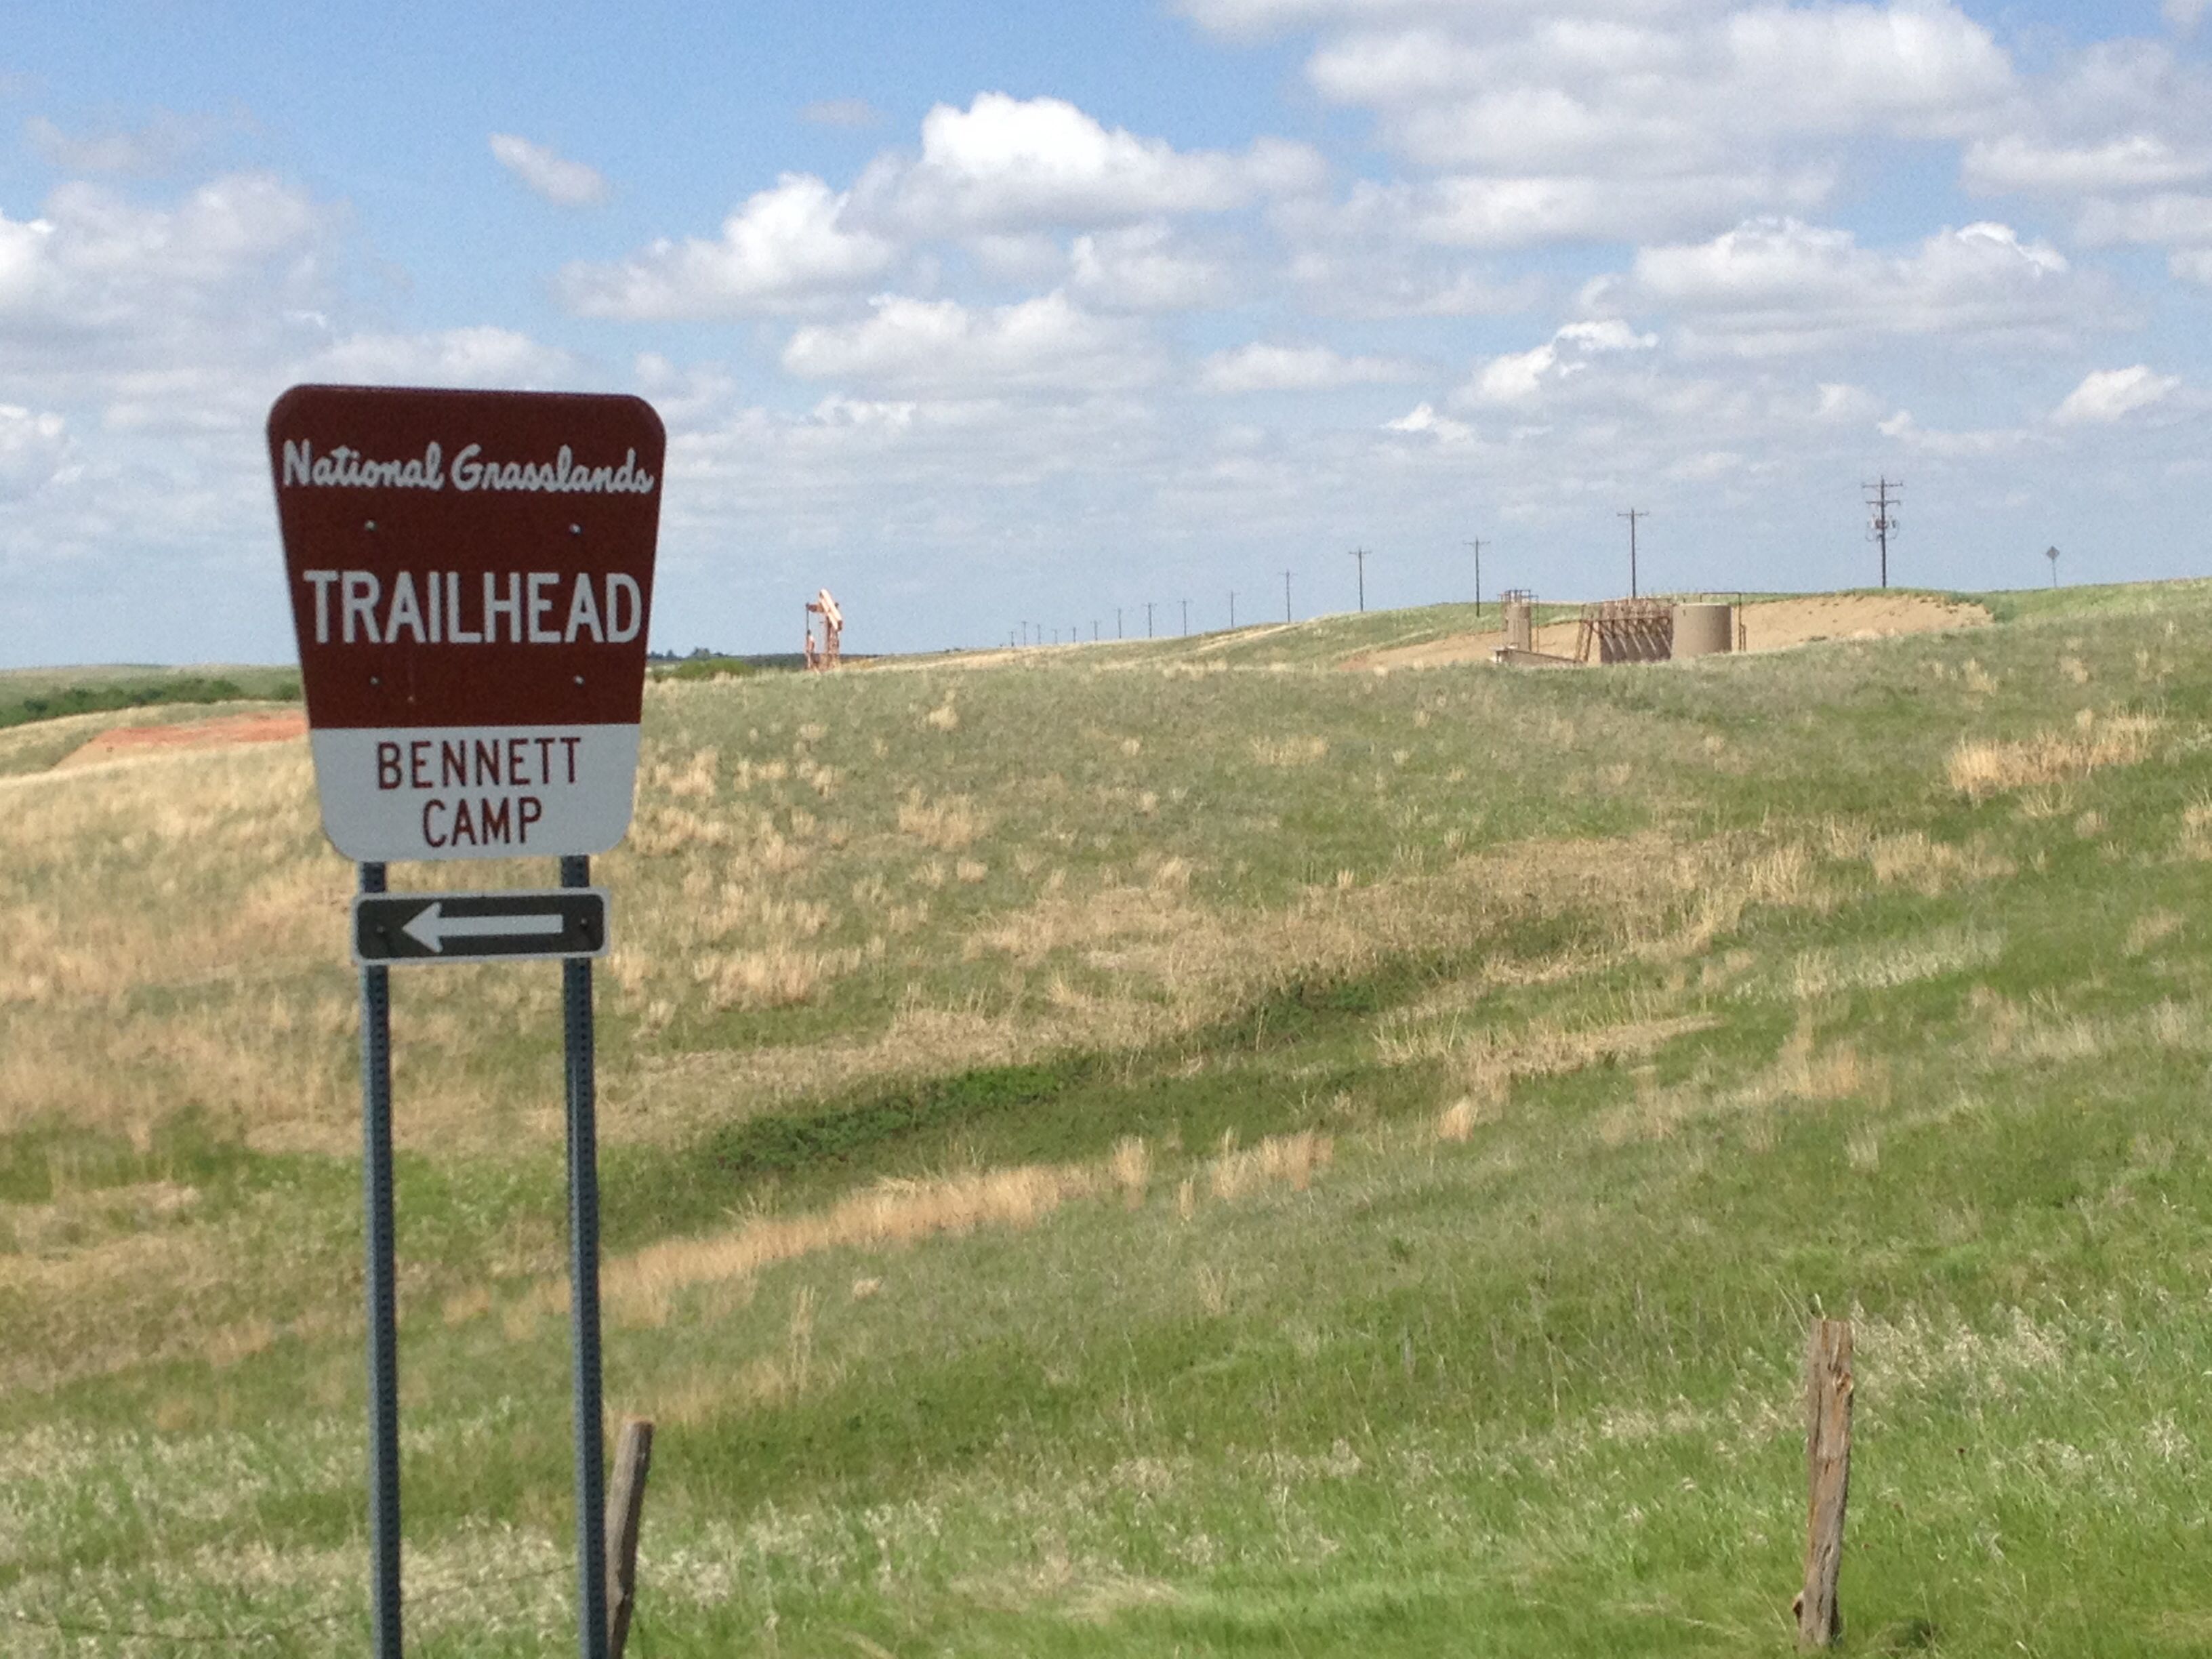
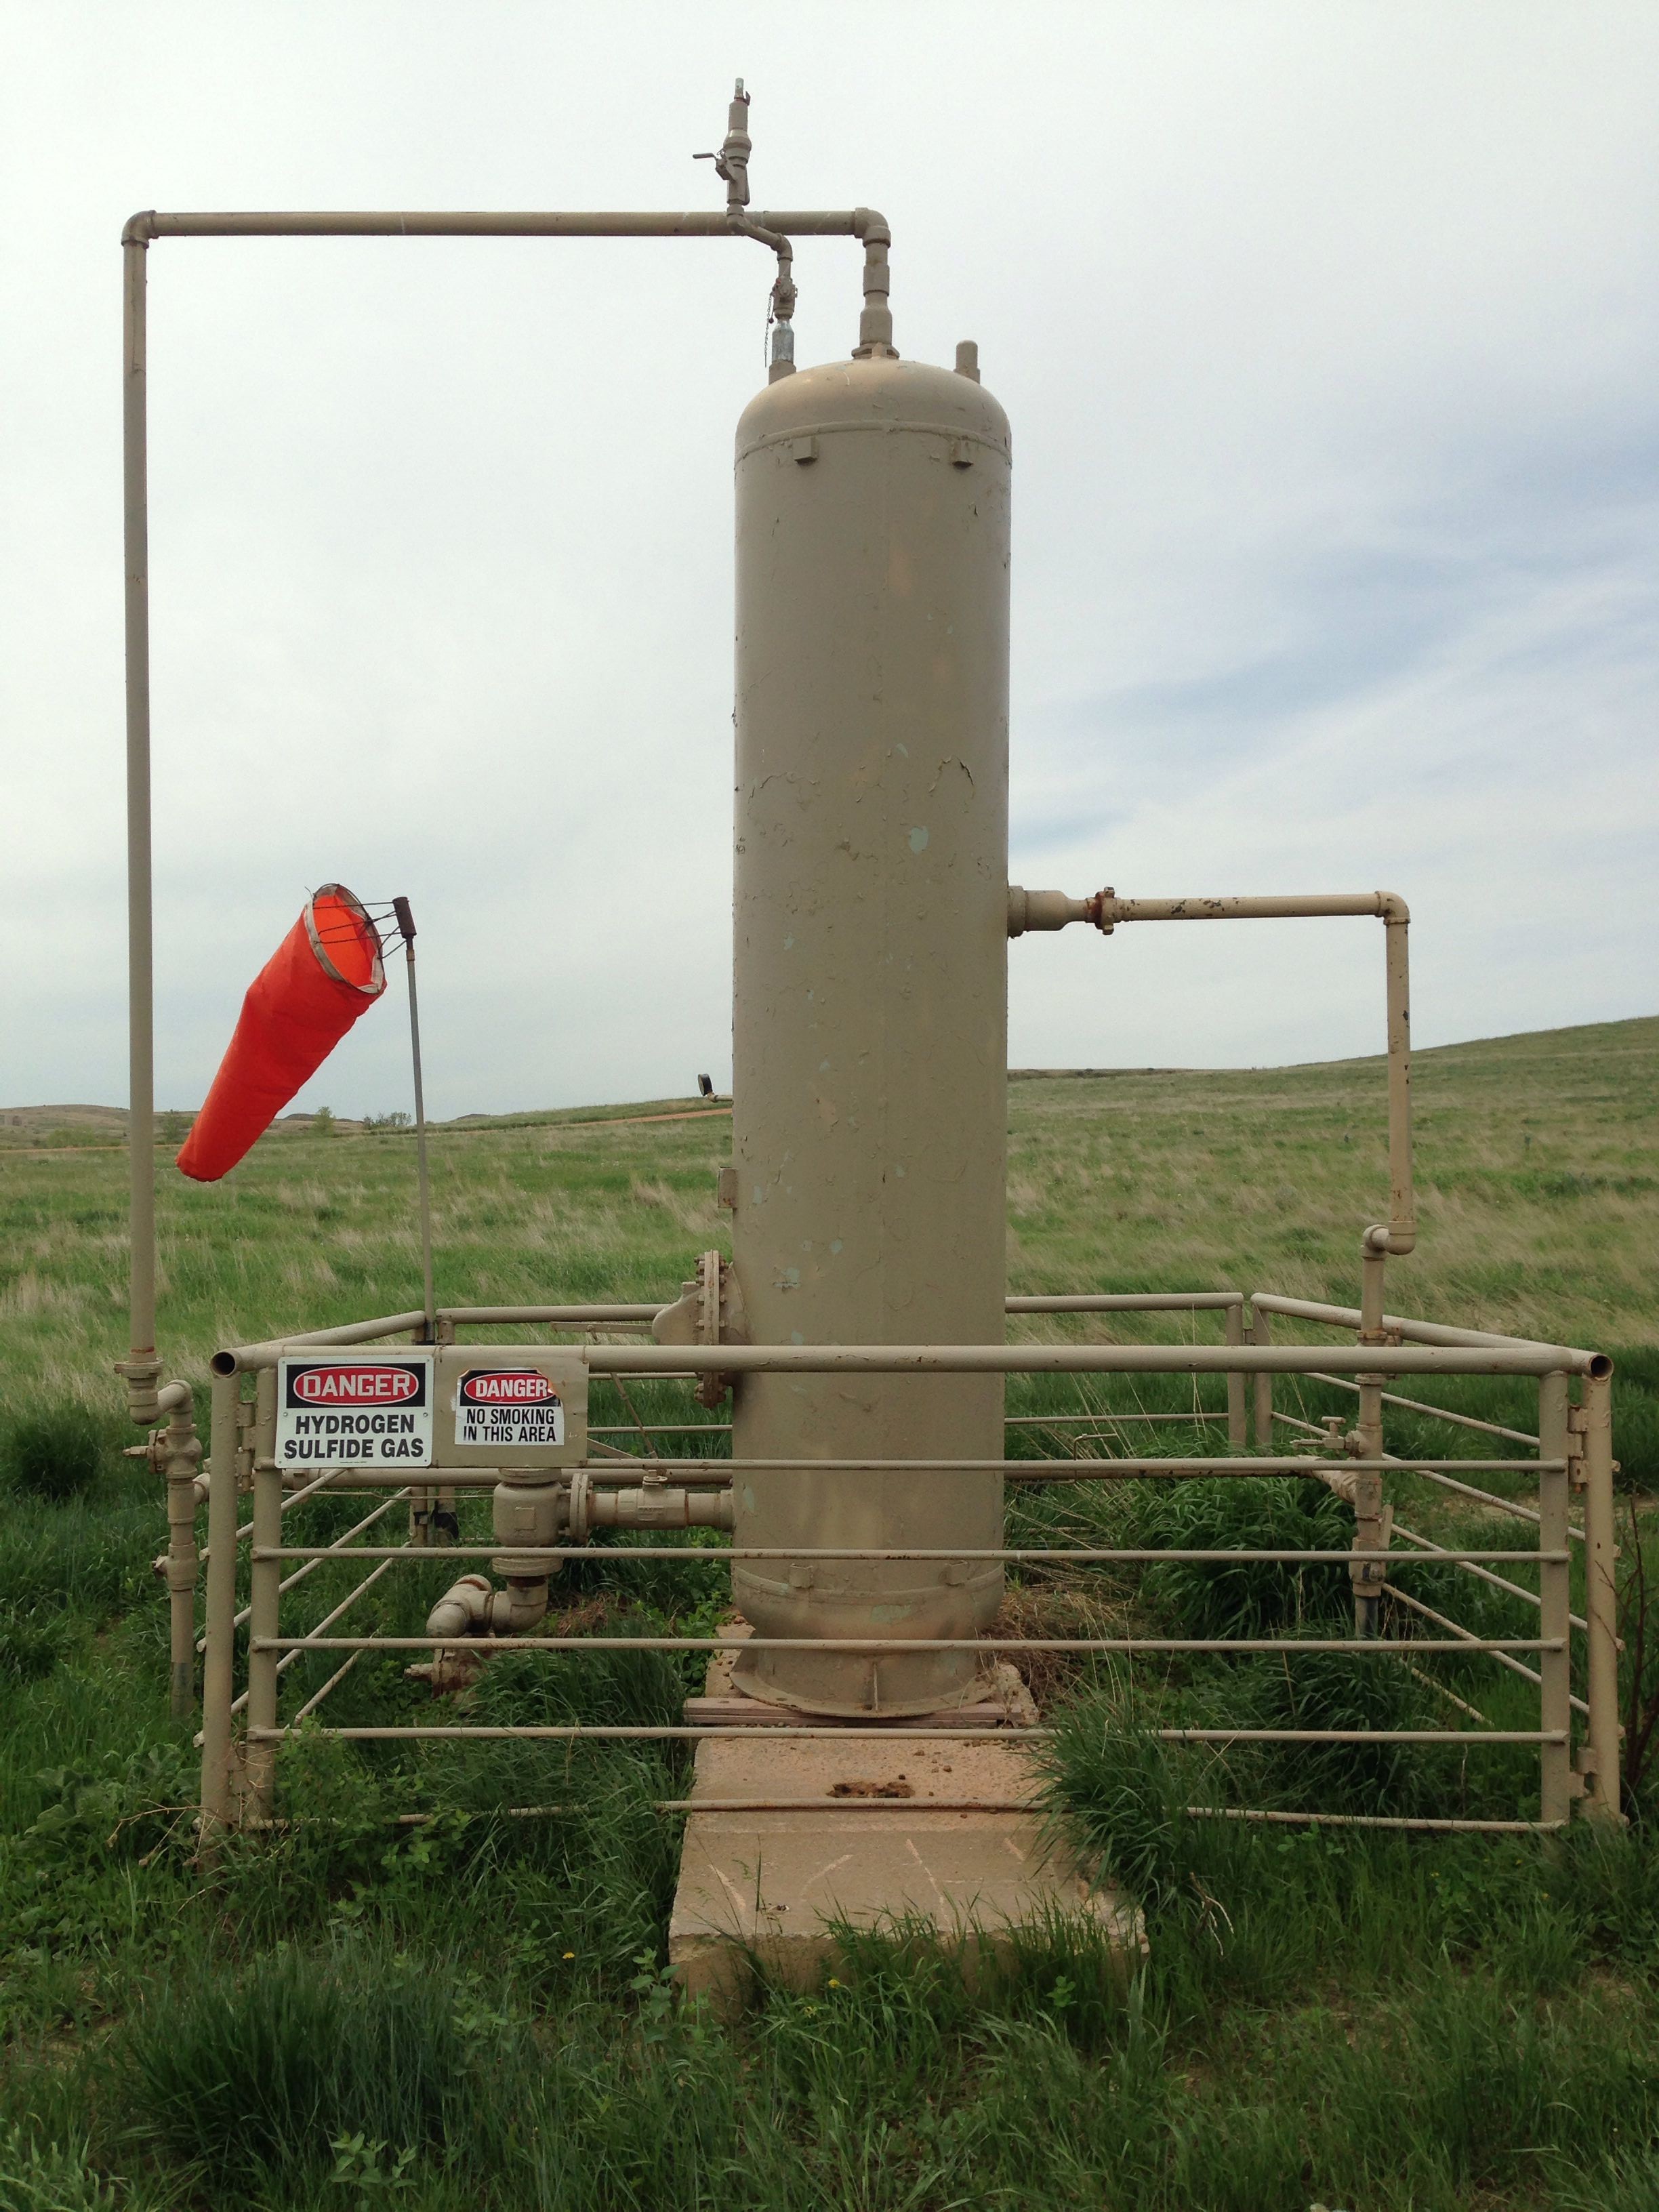
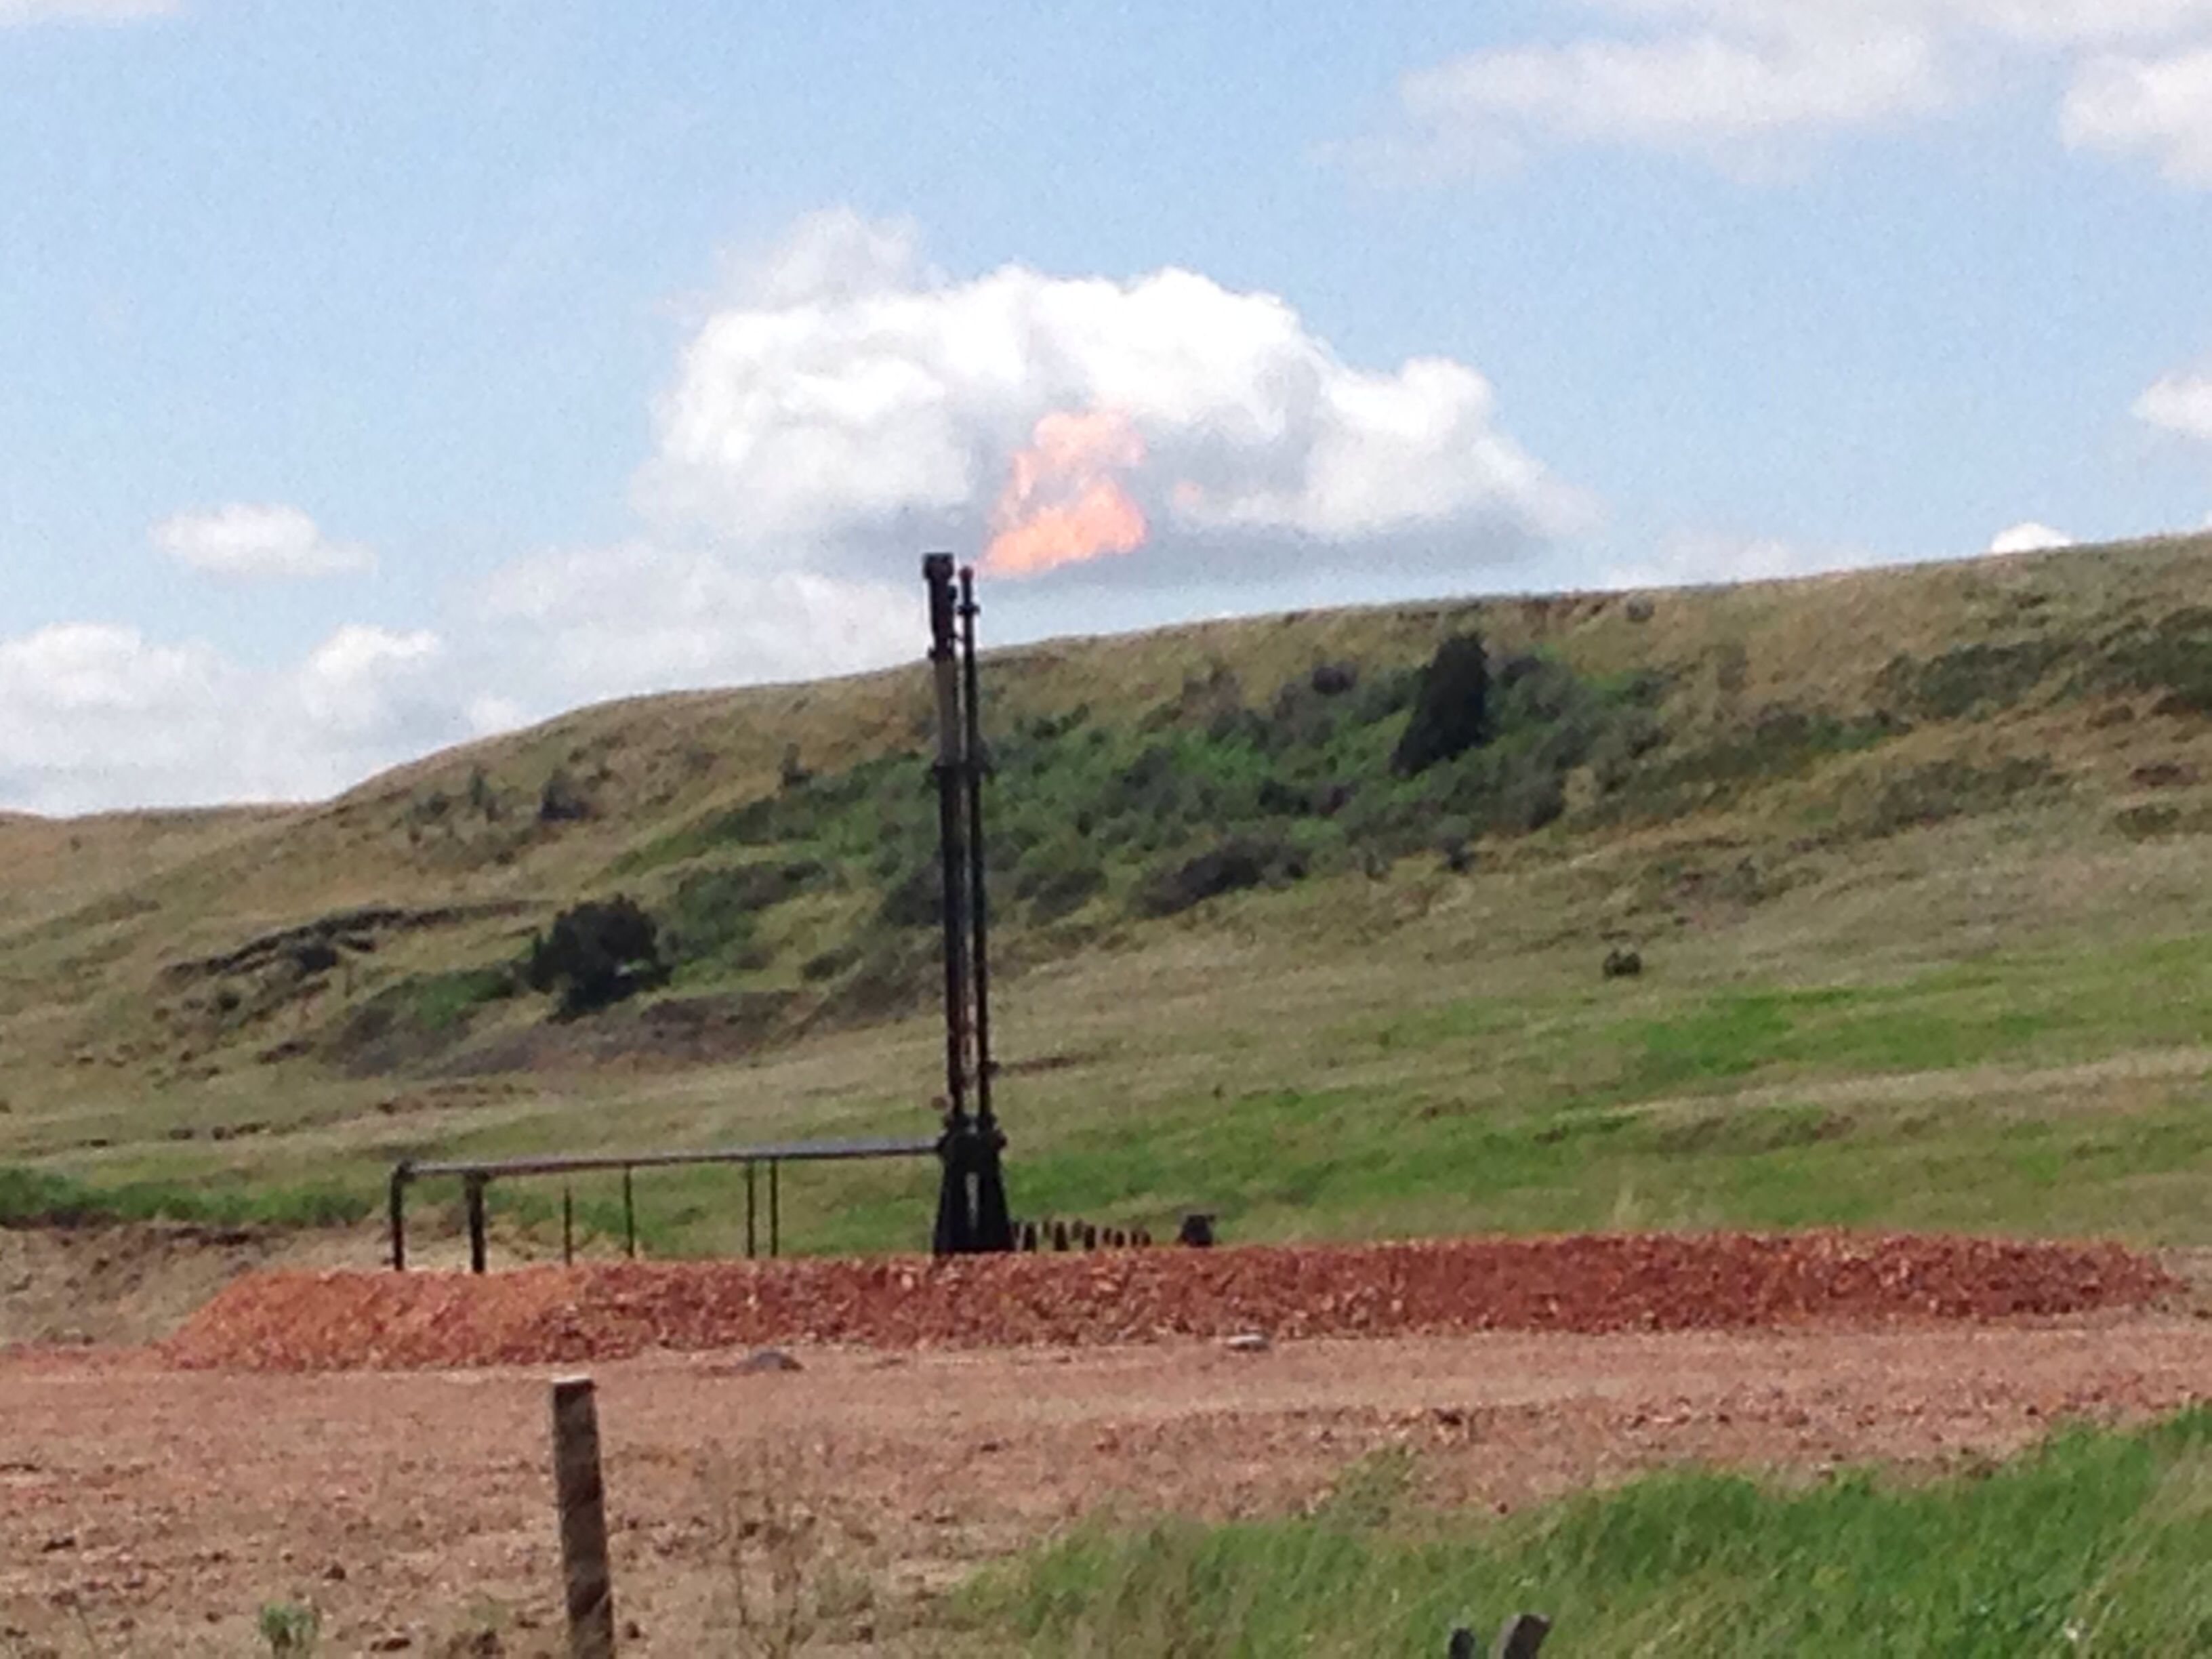
On November 12 and 13, 2014, the National Parks Conservation Association launched their campaign to educate citizens about how oil and gas development may affect America’s national parks. NPCA kicked off their campaign with two events in Pittsburgh and Philadelphia, PA to showcase a crowd-sourced digital map we helped them create with our new mobile app. The map’s photos detail the scale of oil and gas development near North Dakota’s Theodore Roosevelt National Park and is shown below:
And finally… We spent some time with NPCA collecting photos for that map with our app in ND this spring. Below are just a few, the rest of which can be found in our new ND photo album:
https://www.fractracker.org/a5ej20sjfwe/wp-content/uploads/2014/11/ND-Feature1.png400900FracTracker Alliancehttps://www.fractracker.org/a5ej20sjfwe/wp-content/uploads/2025/09/2025-Wordmark-Logo.pngFracTracker Alliance2014-12-01 16:49:212020-07-21 10:34:08Is it getting hot in North Dakota?
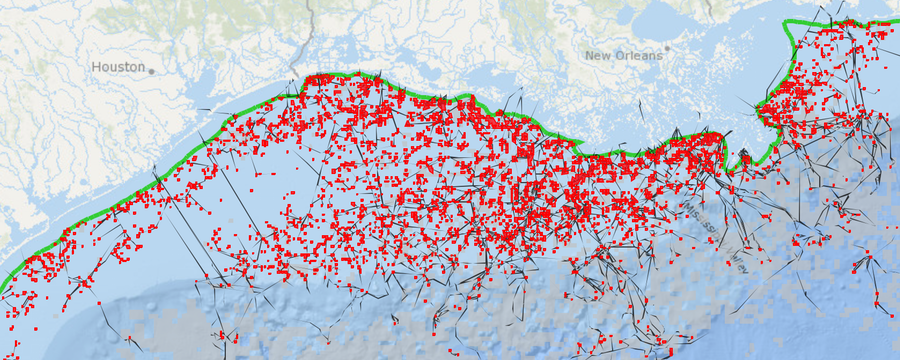
The extent of offshore drilling for oil and gas in the Gulf of Mexico is nothing short of staggering. According to the US National Oceanic and Atmospheric Administration (NOAA), there are more than 3,000 active wells in the federally-regulated waters of the western and central Gulf. Additionally, there are over 25,000 miles of active oil and gas pipelines crisscrossing the Gulf of Mexico sea floor, and more than 18,000 miles of “out of service” pipeline there. To wit, NOAA’s 2012 State of the Coast website boasts, “If placed end to end, the oil and gas pipelines in the Gulf of Mexico could wrap around the Earth’s equator.”
Oil and Gas Infrastructure in the Gulf of Mexico
With such a level of activity, it is difficult to envision how all of this intricate infrastructure fits together, especially in the event of a disaster. There is a dire need to access and visualize such data as more and more wells are drilled unconventionally – both onshore and off. Below is a map of oil and gas drilling platforms both historical and active, pipelines, and active leases in the Gulf of Mexico.
For a full-screen view of this map, with a legend, click here.
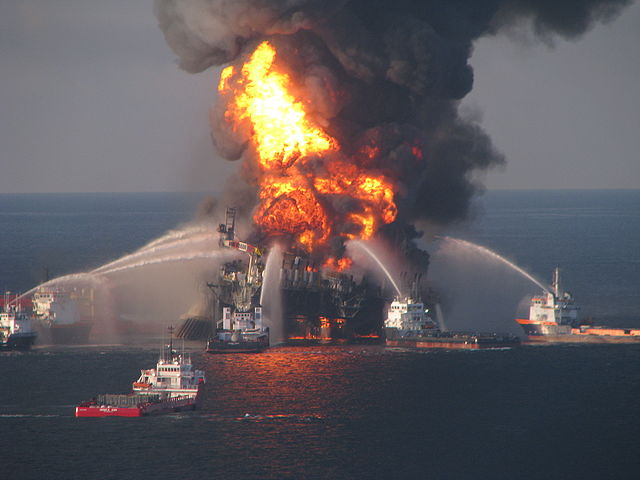
The Worst Environmental Incident in US History
Deepwater Horizon drilling explosion (April 2010)
The April 2010 BP “Deepwater Horizon” blow-out disaster stands out as one of the icons of environmental risks that such intensive oil and gas production can pose to our oceans. The rig was set in over 4,000 feet of water, and close to 6 miles into the sea floor. A blowout occurs when pressurized oil or gas, mud, and water cannot be contained by the well’s blowout preventer. These materials blast through the drill pipe to the surface. There, no longer under pressure, they expand and ignite. Human or mechanical and design errors are at fault the majority of the time. Such was the case with the Macondo Deepwater Horizon disaster, now the worst offshore environmental disaster in US history.
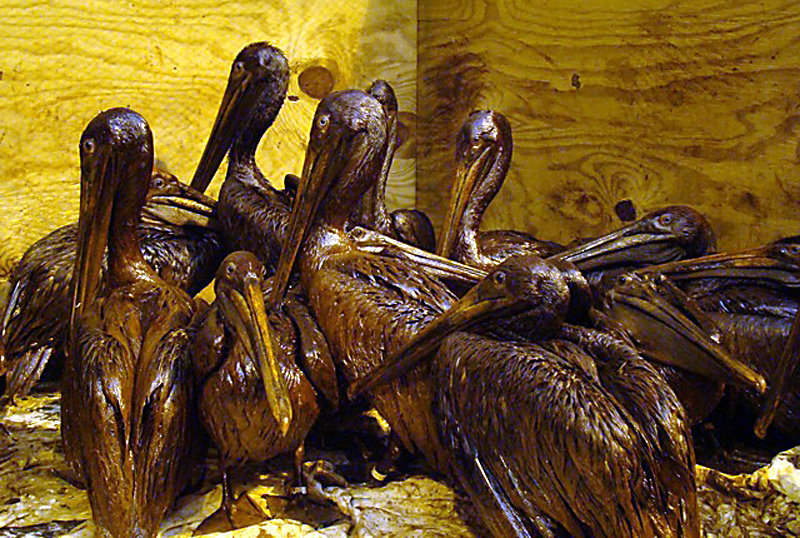
Heavily oiled brown pelicans wait to be cleaned
In all, more than 200 million gallons of oil flowed into the ocean before the Deepwater Horizon well could be plugged. Eleven workers died, and 17 were injured. The Center for Biological Diversity estimates that 82,000 birds, 6000 sea turtles, and nearly 26,000 marine mammals were impacted as a result of this spill.
Penn State University reported actual animal deaths as 6,104 birds, 609 sea turtles, and 100 marine mammals. More than 1,000 miles of shoreline were fouled. Furthermore, as part of the process of breaking up the spill with chemical dispersants, more than 2 million gallons of toxic chemicals were sprayed into the Gulf. The long-term impacts of these dispersants on marine wildlife have yet to be determined.
Other Oil & Gas Exploration Accidents of Note
Natural gas spills also happen with some frequency in the Gulf, but they are considerably different from oil rig blow-outs. Unlike the persistence of oil in the marine environment, gas leaks are dissolved readily into the sea water, and once on the surface, quickly evaporate. Methane-eating bacteria in the water also help in the process. In July 2013, a rig 55 miles offshore, in 154 feet of water in the Gulf off the Louisiana coast, exploded and caught fire. The blaze went out of control and partially destroyed the rig. There was a thin sheen of hydrocarbons on the ocean surface initially, but it dissipated rapidly. A relief well was drilled, and the leak contained. While the effects on marine life may not be tremendous, the release of this amount of carbon to the seawater and atmosphere is yet another stress to global warming, moving us closer by the day to the tipping point of climate disaster.
Unfortunately, these types of leaks and explosions happen with regularity. A maintenance-related explosion happened in September 2011 in the Gulf, 100 miles off the Louisiana coast. All 13 crew on the platform were forced to jump for safety into the water, where they were later rescued. Fortunately, there were no deaths in this case. In September 2014, however, during maintenance at a Chevron natural gas pipeline off the Louisiana coast, one contractor was killed and two injured in another incident.
And Most Recently…
And just last week, on November 20, 2014, there was another report of yet one more Gulf of Mexico oil platform explosion, 12 miles off the coast. This time, one worker was killed and three injured at an explosion at Fieldwood Energy’s Echo Platform. The employees were cleaning a piece of equipment when the blast occurred.
According to news reports, the Bureau of Safety and Environmental Enforcement related, “The Echo Platform was not in production at the time of the incident,” BSEE said in a statement Thursday. “The facility damage was limited to the explosion area and there was no pollution reported.”
Both the September and November incidents are under investigation.
________
GIS datasets for this post originated from the US Bureau of Ocean Energy Management. Learn more
For information on offshore oil and gas exploration in California and the associated danger and regulations, read the October 20, 2013 Fractracker blog entry Hydraulic Fracturing Offshore Wells on the California Coast, by FracTracker’s California staffer Kyle Ferrar.
https://www.fractracker.org/a5ej20sjfwe/wp-content/uploads/2014/11/Pipelines-Feature.png400900Karen Edelsteinhttps://www.fractracker.org/a5ej20sjfwe/wp-content/uploads/2025/09/2025-Wordmark-Logo.pngKaren Edelstein2014-11-26 15:55:532020-03-12 14:22:31Latest Oil and Gas Incident in the Gulf of Mexico
By Kyle Ferrar, CA Program Coordinator, FracTracker Alliance
As my first year in The Bay Area of California comes to a conclusion and the summer once again turns into fall I realize how much more this time of year meant for me living on the east coast. For us lucky ducks living in the Bay Area, fall is perpetual. With the California drought seasons blur together, but back home in Pennsylvania and New York, fall marks a much appreciated relief from 90°F+ days. Regardless of where you live certain fall activities are universal, including hockey, postseason baseball, football, and most importantly for kids – going back to school.
In California alone, almost 6.24 million students from kindergarten to 12th grade are enrolled and attend classes at one of the 10,366 state “campuses.” State-recognized schools range in size from under a dozen students to a maximum 2013/2014 enrollment of 5,229. When so many children are together in one space, they share much more than just the scholarship, social development, and the occasional but inevitable flu virus. They share the same environmental media (air, water, soil) and are therefore exposed to the same environmental contaminants.
To understand who among this vulnerable population is subject to potential health impacts, the FracTracker Alliance has put together a report analyzing the demographic characteristics of schools located near oil and gas extraction activity. An interactive map of the data that was analyzed is shown below, as are the points of the report. The full report can be found here:
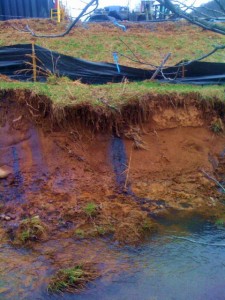
In the background, less than 1,200 feet from the school is
an oil well (API 403043765) that was hydraulically fractured.
Key Findings of School Analysis:
There are 485 active/new oil and gas wells within 1 mile of a school and 177 active/new oil and gas wells within 0.5 miles of a school.
There are 352,784 students who attend school within 1 mile of an oil or gas well, and 121,903 student who attend school within 0.5 miles of an oil or gas well.
There are 78 stimulated wells drilled within 1 mile of a school and 14 stimulated wells drilled within 0.5 miles of a school.
There are 61,612 students who attend school within 1 mile of a stimulated oil or gas well, and 12,362 students who attend school within 0.5 miles of a stimulated oil or gas well.
School Districts with greater Hispanic and non-white student enrollment are more likely to contain more oil and gas drilling and stimulation.
Schools campuses with greater Hispanic and non-white student enrollment are more likely to be closer to more oil and gas drilling and stimulation.
Students attending school within 1 mile of oil and gas wells are predominantly non-white (79.6%), and 60.3% are Hispanic.
The top 11 school districts with the highest well counts are located the San Joaquin Valley with 10 districts in Kern County and the other just north of Kern in Fresno County.
The two districts with the highest well counts are in Kern County; Taft Union High School District, host to 33,155 oil and gas wells, and Kern Union High School District, host to 19,800 oil and gas wells.
Of the schools with the most wells within a 1 mile radius, 8/10 are located in Los Angeles County.
Report Map
The interactive map below allows the user to compare the demographical profiles of school districts with oil and gas drilling and stimulation activity. Non-white enrollment percentages of school districts are displayed in shades of blue. Overlaid with red are the relative counts of stimulated and/or non-stimulated oil and gas wells. The highest counts of wells are hosted in school districts located in the Central (San Joaquin) Valley and along California’s south coast. Geologically, these areas lay above the Monterey Shale – the 50 million year sedimentary basin producing California’s oil reserves.
https://www.fractracker.org/a5ej20sjfwe/wp-content/uploads/2014/11/CA_Schools_WellCts_CoverPhoto.jpg400900Kyle Ferrar, MPHhttps://www.fractracker.org/a5ej20sjfwe/wp-content/uploads/2025/09/2025-Wordmark-Logo.pngKyle Ferrar, MPH2014-11-17 23:17:432020-07-21 10:34:08Hydraulic fracturing, stimulations, & oil & gas drilling unjustly burden Hispanic & non-white students
OH Utica Production, Water Usage, and Waste Disposal by County Part II of a Multi-part Series
By Ted Auch, Great Lakes Program Coordinator, FracTracker Alliance
In this part of our ongoing “Water-Energy Nexus” series focusing on Water and Water Use, we are looking at how counties in Ohio differ between how much oil and gas are produced, as well as the amount of water used and waste produced. This analysis also highlights how the OH DNR’s initial Utica projections differ dramatically from the current state of affairs. In the first article in this series, we conducted an analysis of OH’s water-energy nexus showing that Utica wells are using an ave. of 5 million gallons/well. As lateral well lengths increase, so does water use. In this analysis we demonstrate that:
Drillers have to use more water, at higher pressures, to extract the same unit of oil or gas that they did years ago,
Where production is relatively high, water usage is lower,
As fracking operations move to the perimeter of a marginally productive play – and smaller LLCs and MLPs become a larger component of the landscape – operators are finding minimal returns on $6-8 million in well pad development costs,
Market forces and Muskingum Watershed Conservancy District (MWCD) policy has allowed industry to exploit OH’s freshwater resources at bargain basement prices relative to commonly agreed upon water pricing schemes.
At current prices1, the shale gas industry is allocating < 0.27% of total well pad costs to current – and growing – freshwater requirements. It stands to reason that this multi-part series could be a jumping off point for a more holistic discussion of how we price our “endless” freshwater resources here in OH.
In an effort to better understand the inter-county differences in water usage, waste production, and hydrocarbon productivity across OH’s 19 Utica Shale counties we compiled a data-set for 500+ Utica wells which was previously used to look at differenced in these metrics across the state’s primary industry players. The results from Table 1 below are discussed in detail in the subsequent sections.
Table 1. Hydrocarbon production totals and per day values with top three producers in bold
County
# Wells
Total
Per Day
Oil
Gas
Brine
Production
Days
Oil
Gas
Brine
Ashland
1
0
0
23,598
102
0
0
231
Belmont
32
55,017
39,564,446
450,134
4,667
20
8,578
125
Carroll
256
3,715,771
121,812,758
2,432,022
66,935
67
2,092
58
Columbiana
26
165,316
9,759,353
189,140
6,093
20
2,178
65
Coshocton
1
949
0
23,953
66
14
0
363
Guernsey
29
726,149
7,495,066
275,617
7,060
147
1,413
49
Harrison
74
2,200,863
31,256,851
1,082,239
17,335
136
1,840
118
Jefferson
14
8,396
9,102,302
79,428
2,819
2
2,447
147
Knox
1
0
0
9,078
44
0
0
206
Mahoning
3
2,562
0
4,124
287
9
0
14
Medina
1
0
0
20,217
75
0
0
270
Monroe
12
28,683
13,077,480
165,424
2,045
22
7,348
130
Muskingum
1
18,298
89,689
14,073
455
40
197
31
Noble
39
1,326,326
18,251,742
390,791
7,731
268
3,379
267
Portage
2
2,369
75,749
10,442
245
19
168
228
Stark
1
17,271
166,592
14,285
602
29
277
24
Trumbull
8
48,802
742,164
127,222
1,320
36
566
100
Tuscarawas
1
9,219
77,234
2,117
369
25
209
6
Washington
3
18,976
372,885
67,768
368
59
1,268
192
Production
Total
It will come as no surprise to the reader that OH’s Utica oil and gas production is being led by Carroll County, followed distantly by Harrison, Noble, Belmont, Guernsey and Columbiana counties. Carroll has produced 3.7 million barrels of oil to date, while the latter have combined to produce an additional 4.5 million barrels. Carroll wells have been in production for nearly 67,000 days2, while the aforementioned county wells have been producing for 42,886 days. The remaining counties are home to 49 wells that have been in production for nearly 8,800 days or 7% of total production days in Ohio.
Combined with the state’s remaining 49 producing wells spread across 13 counties, OH’s Utica Shale has produced 8.3 million barrels of oil as well as 251,844,311 Mcf3 of natural gas and 5.4 million barrels of brine. Oil and natural gas together have an estimated value of $2.99 billion ($213 million per quarter)4 assuming average oil and natural gas prices of $96 per barrel and $8.67 per Mcf during the current period of production (2011 to Q2-2014), respectively.
Potential Revenue at Different Severance Tax Rates:
Current production tax, 0.5-0.8%: $19 million ($1.4 Million Per Quarter (MPQ). At this rate it would take the oil and gas industry 35 years to generate the $4.6 billion in tax revenue they proposed would be generated by 2020.
Proposed, 1% gas and 4% oil: At Governor Kasich’s proposed tax rate, $2.99 billion translates into $54 million ($3.9 MPQ). It would still take 21 years to return the aforementioned $4.6 billion to the state’s coffers.
The bottom-line is that a production tax of 11-25% or more ($24-53 MPQ) would be necessary to generate the kind of tax revenue proposed by the end of 2020. This type of O&G taxation regime is employed in the states of Alaska and Oklahoma.
From an outreach and monitoring perspective, effects on air and water quality are two of the biggest gaps in our understanding of shale gas from a socioeconomic, health, and environmental perspective. Pulling out a mere 1% from any of these tax regimes would generate what we’ll call an “Environmental Monitoring Fee.” Available monitoring funds would range between $194,261 and $1.8 million ($16 million at 55%). These monies would be used to purchase 2-21 mobile air quality devices and 10-97 stream quantity/quality gauges to be deployed throughout the state’s primary shale counties to fill in the aforementioned data gaps.
Per-Day Production
On a per-day oil production basis, Belmont and Columbiana (20 barrels per day (BPD)) are overshadowed by Washington (59 BPD) and Muskingum (40 BPD) counties’ four giant Utica wells. Carroll is able to maintain such a high level of production relative to the other 15 counties by shear volume of producing wells; Noble (268 BPD), Guernsey (147 BPD), and Harrison (136 BPD) counties exceed Carroll’s production on a per-day basis. The bottom of the league table includes three oil-free wells in Ashland, Knox, and Medina, as well as seventeen <10 BPD wells in Jefferson and Mahoning counties.
With respect to natural gas, Harrison (1,840 Mcf per day (MPD)) and Guernsey counties are replaced by Monroe (7,348 MPD) and Jefferson (2,447 MPD) counties’ 26 Utica wells. The range of production rates for natural gas is represented by the king of natural gas producers, Belmont County, producing 8,578 MPD on the high end and Mahoning and Coshocton counties in addition to the aforementioned oil dry counties on the low end. Four of the five oil- or gas-dry counties produce the least amount of brine each day (BrPD). Coshocton, Medina, and Noble county Utica wells are currently generating 267-363 barrels of BrPD, with an additional seven counties generating 100-200 BrPD. Only four counties – 1.2% of OH Utica wells – are home to unconventional wells that generate ≤ 30 BrPD.
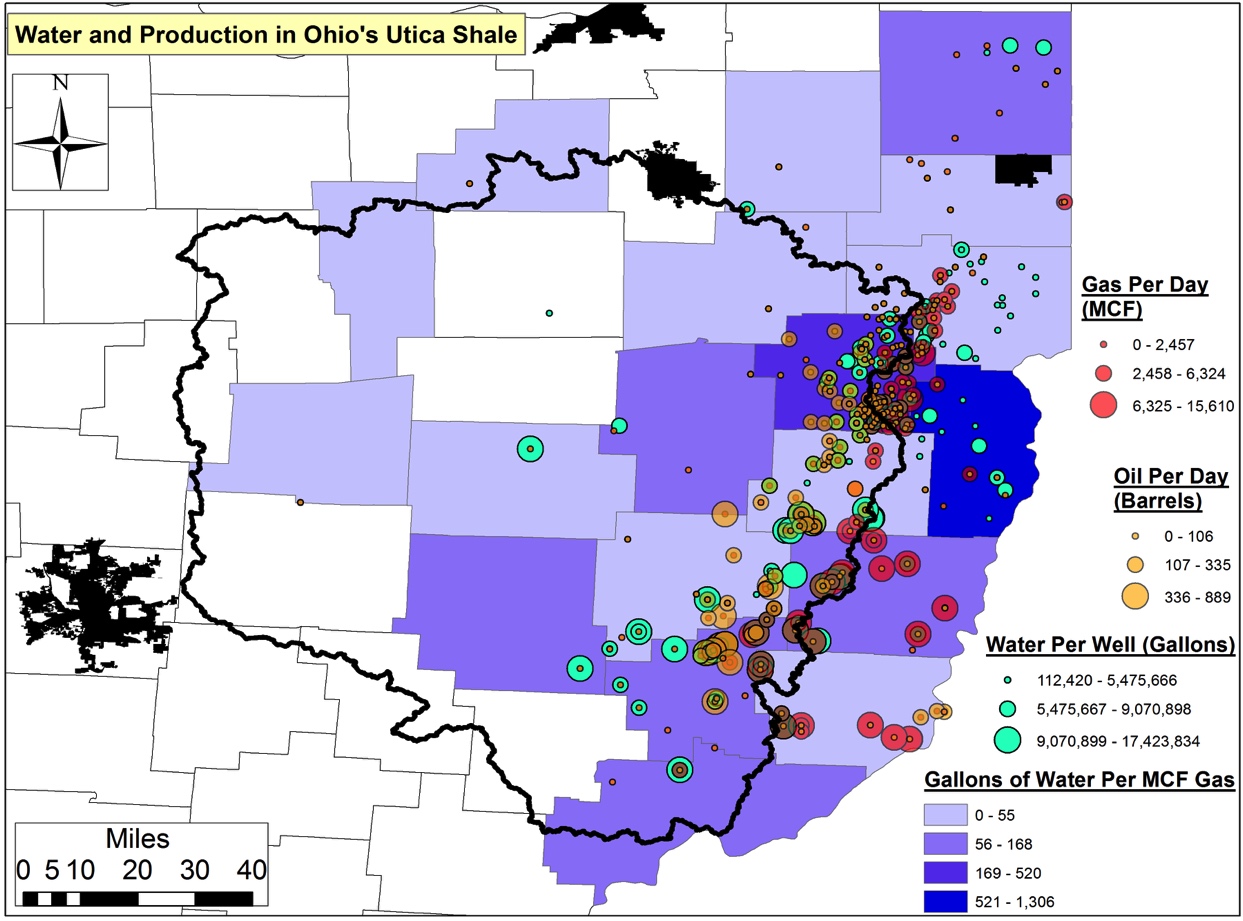
Water Usage
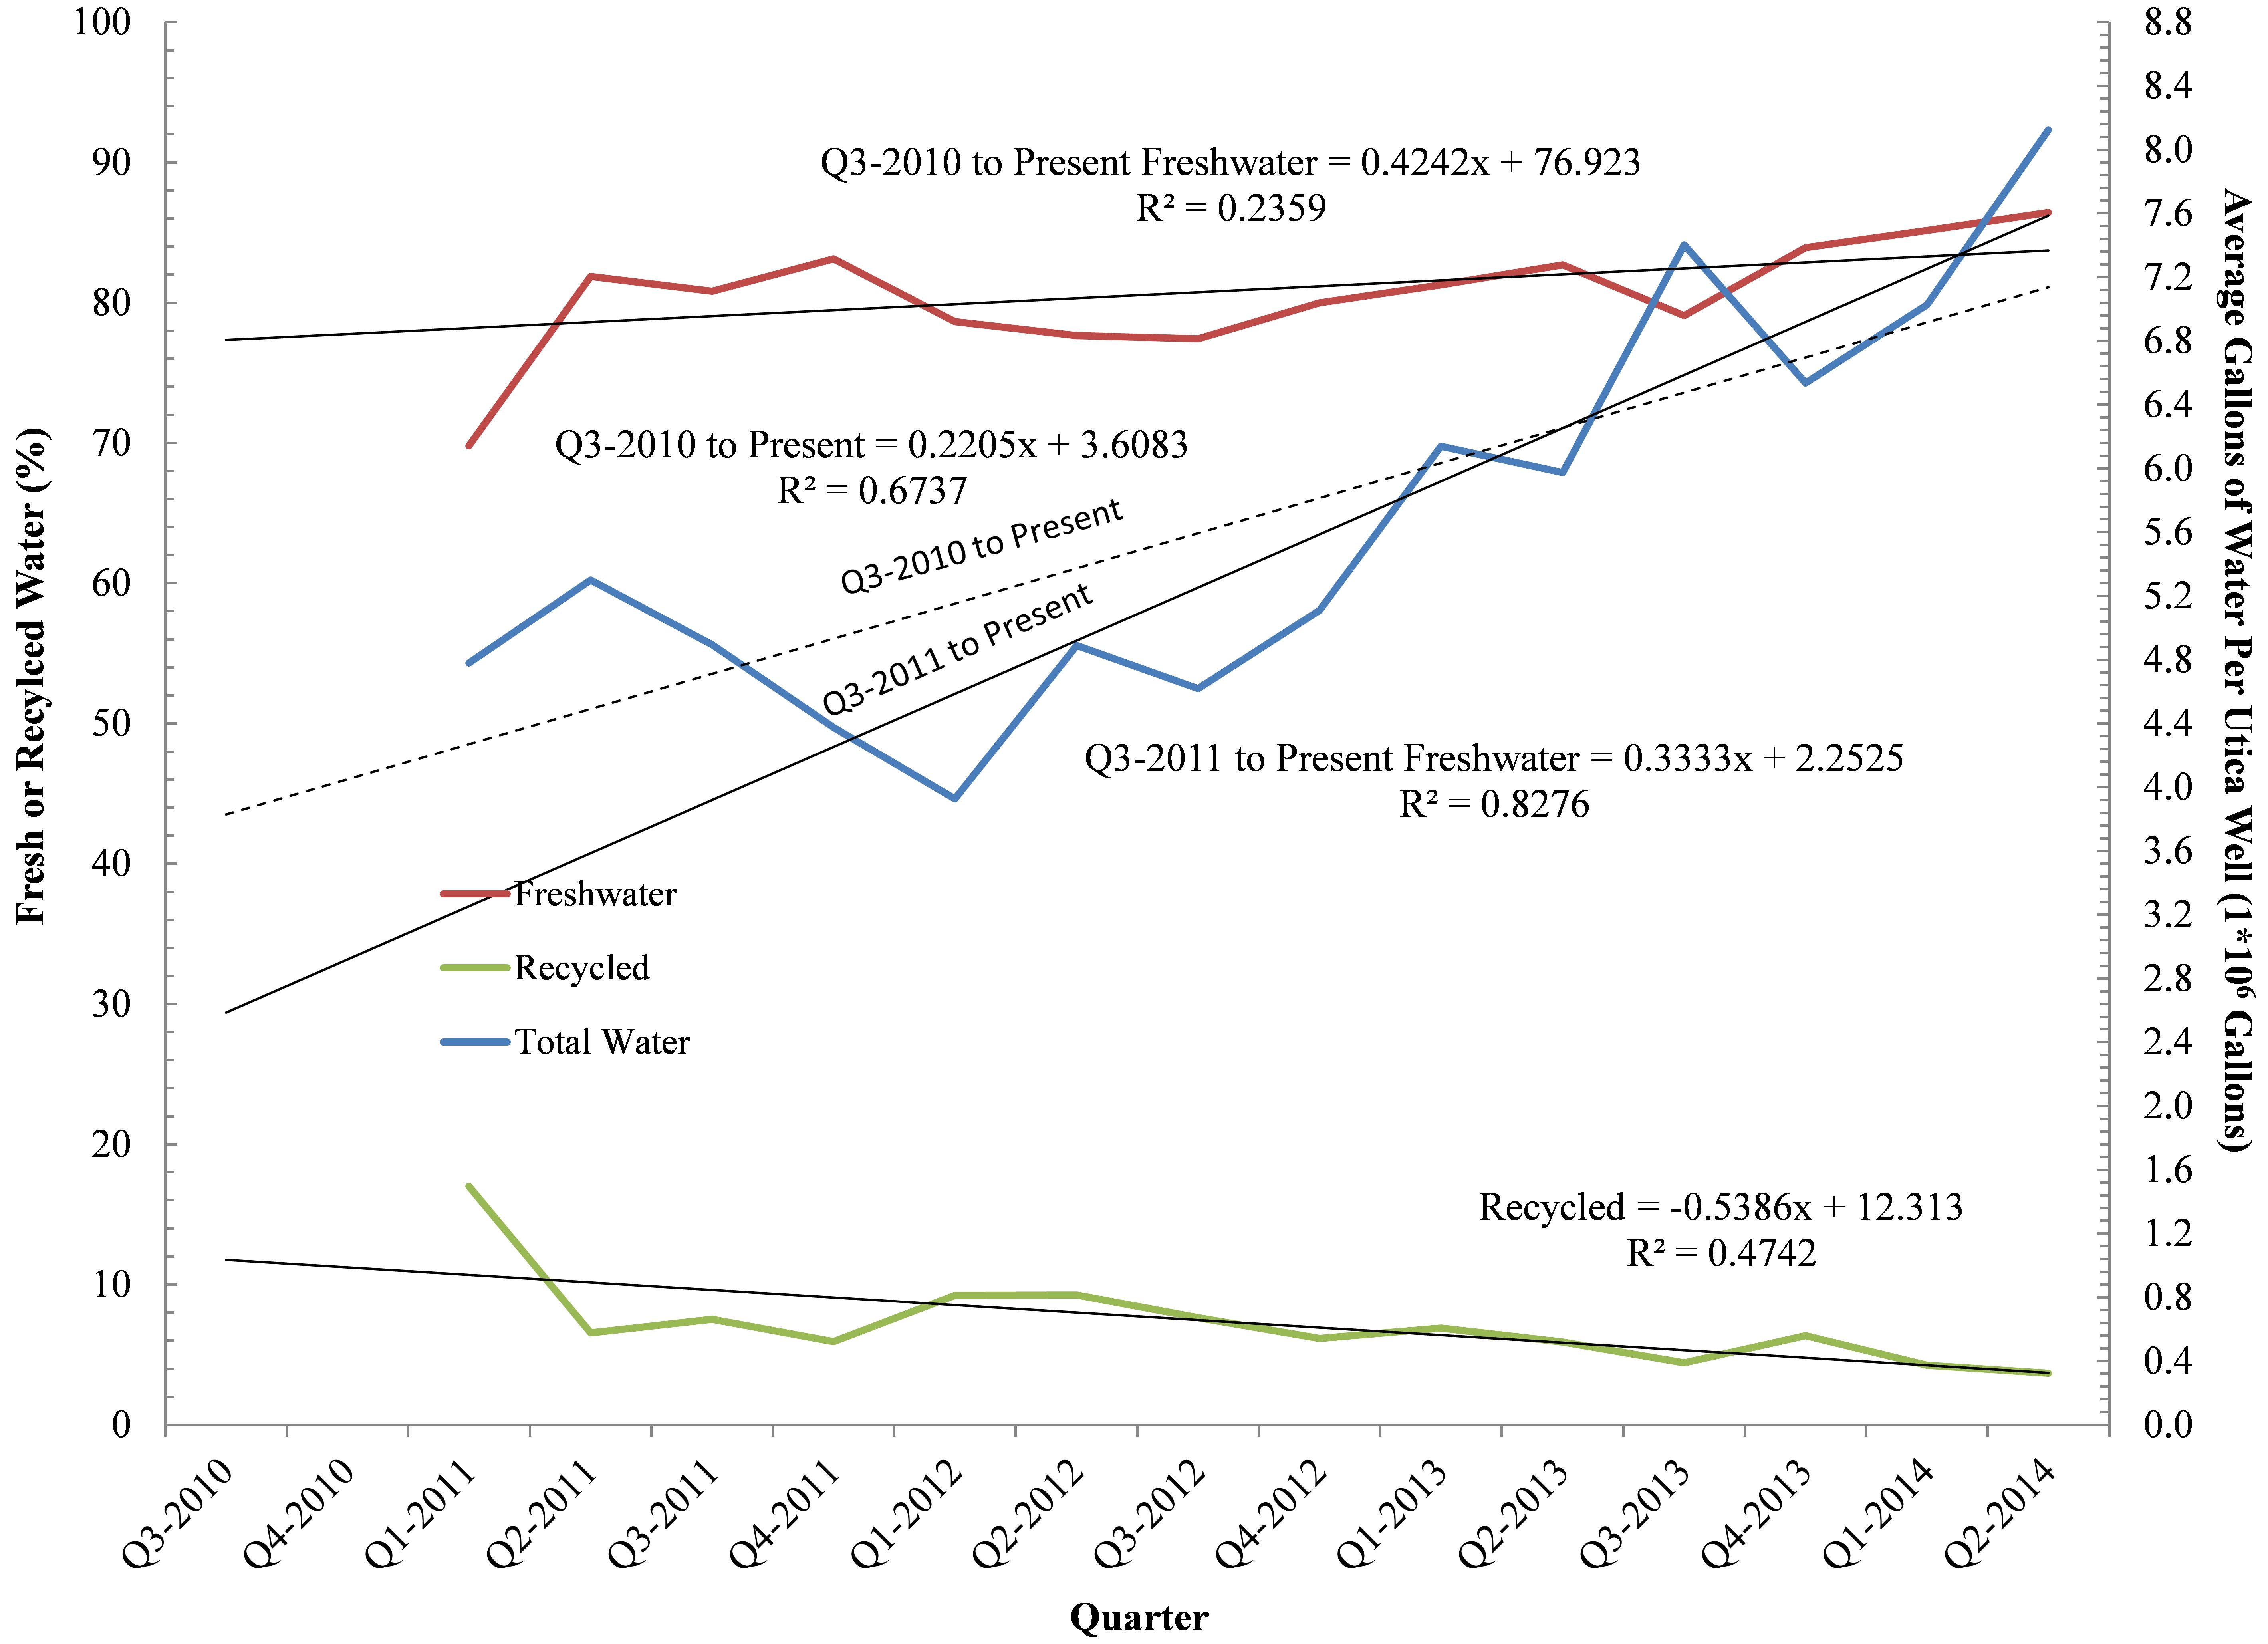
Freshwater is needed for the hydraulic fracturing process during well stimulation. For counties where we had compiled a respectable sample size we found that Monroe and Noble counties are home to the Utica wells requiring the greatest amount of freshwater to obtain acceptable levels of productivity (Figure 1). Monroe and Noble wells are using 10.6 and 8.8 million gallons (MGs) of water per well. Coshocton is home to a well that required 10.8 MGs, while Muskingum and Washington counties are home to wells that have utilized 10.2 and 9.5 MGs, respectively. Belmont, Guernsey, and Harrison reflect the current average state of freshwater usage by the Utica Shale industry in OH, with average requirements of 6.4, 6.9, and 7.2 MGs per well. Wells in eight other counties have used an average of 3.8 (Mahoning) to 5.4 MGs (Tuscarawas). The counties of Ashland, Knox, and Medina are home to wells requiring the least amount of freshwater in the range of 2.2-2.9 MGs. Overall freshwater demand on a per well basis is increasing by 220,500-333,300 gallons per quarter in Ohio with percent recycled water actually declining by 00.54% from an already trivial average of 6-7% in 2011 (Figure 2).
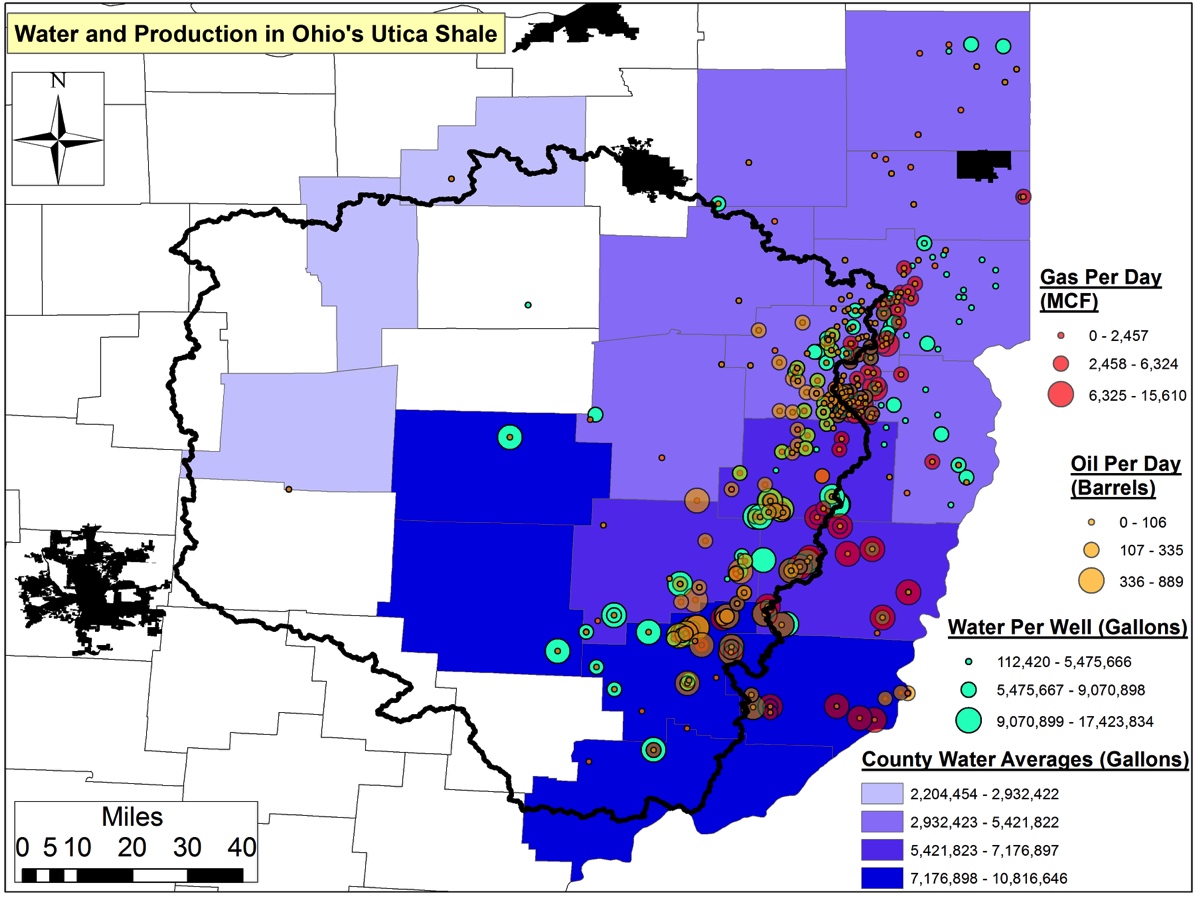
Figure 1. Average water usage (gallons) per Utica well by county
Figure 2. Average water usage (gallons) on per well basis by OH Utica Shale industry, shown quarterly between Q3-2010 & Q2-2014.
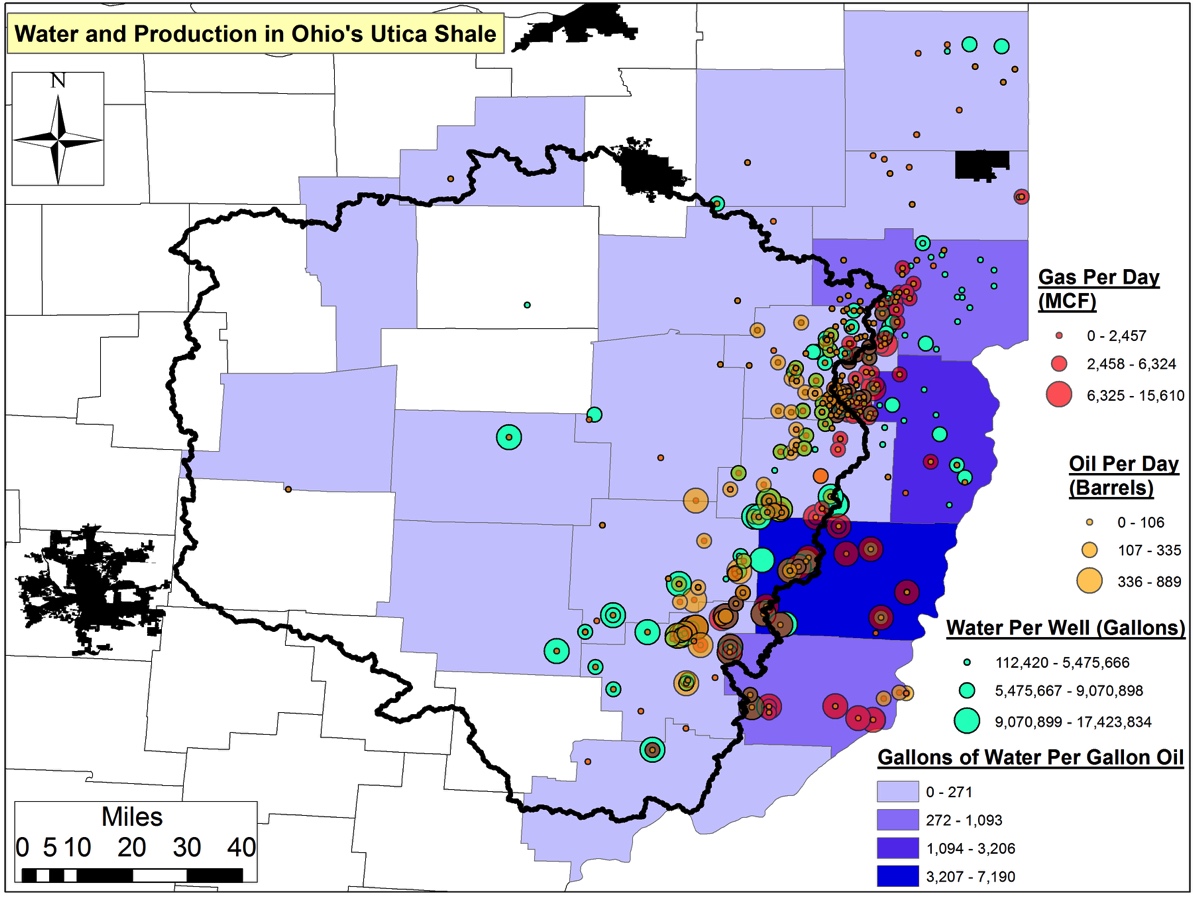
Belmont County’s 30+ Utica wells are the least efficient with respect to oil recovery relative to freshwater requirements, averaging 7,190 gallons of water per gallon of oil (Figure 3). A distant second is Jefferson County’s 14 wells, which have required on average 3,205 gallons of water per gallon of oil. Columbiana’s 26 Utica wells are in third place requiring 1,093 gallons of freshwater. Coshocton, Mahoning, Monroe, and Portage counties are home to wells requiring 146-473 gallons for each gallon of oil produced.
Belmont County’s 14 Utica wells are the least efficient with respect to natural gas recovery relative to freshwater requirements (Figure 4). They average 1,306 gallons of water per Mcf. A distant second is Carroll County’s 250+ wells, which have injected 520 gallons of water 7,000+ feet below the earth’s service to produce a single Mcf of natural gas. Muskingum’s Utica well and Noble County’s 39 wells are the only other wells requiring more than 100 gallons of freshwater per Mcf. The remaining nine counties’ wells require 15-92 gallons of water to produce an Mcf of natural gas.
Figure 3. Average water usage (gallons) per unit of oil (gallons) produced across 19 Ohio Utica counties
Figure 4. Average water usage (gallons) per unit of gas produced (Mcf) across 19 Ohio Utica counties
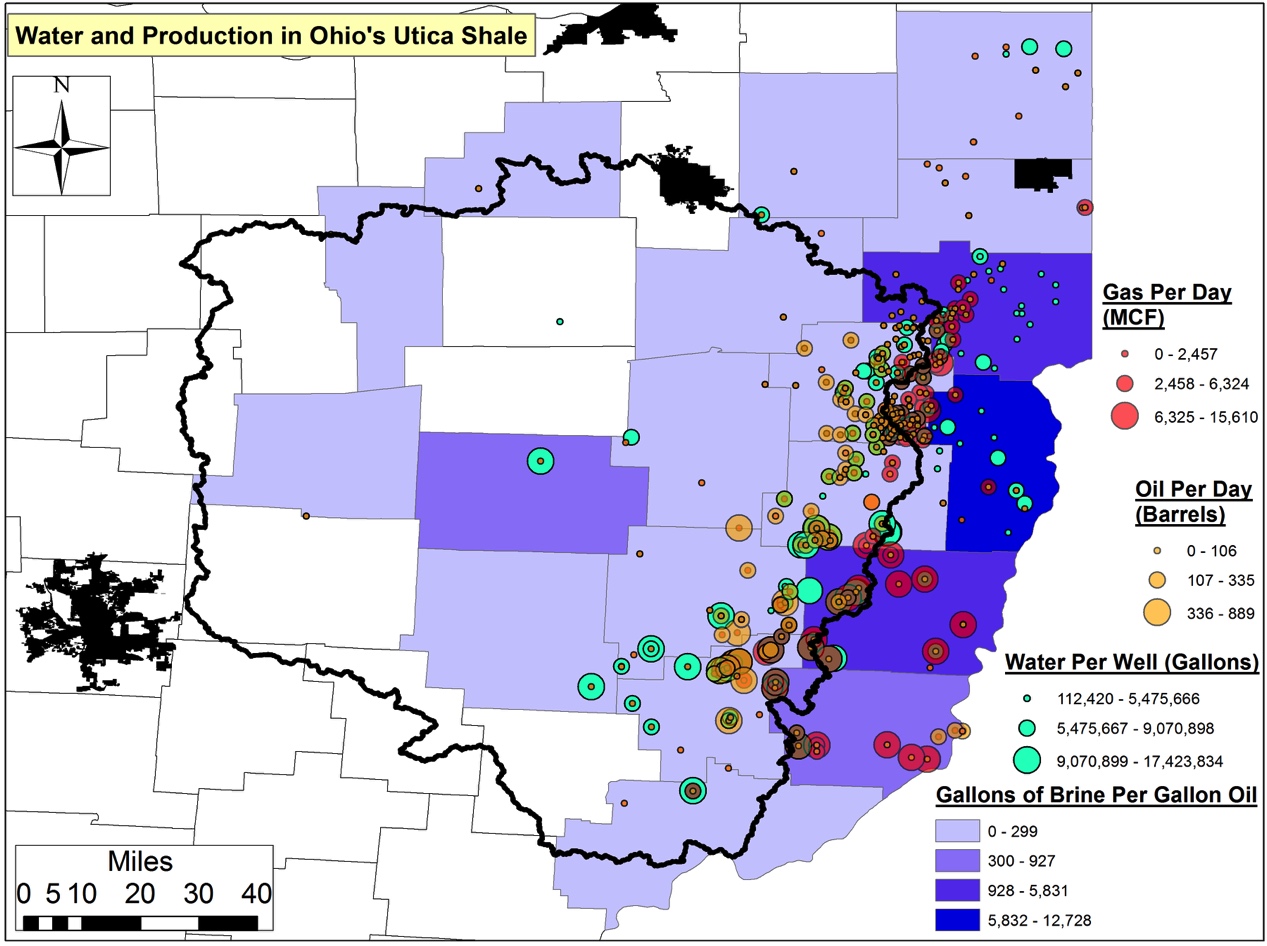
Waste Production
The aforementioned Jefferson wells are the least efficient with respect to waste vs. product produced. Jefferson wells are generating 12,728 gallons of brine per gallon of oil (Figure 5).6 Wells from this county are followed distantly by the 32 Belmont and 26 Columbiana county wells, which are generating 5,830 and 3,976 gallons of brine per unit of oil.5 The remaining counties (for which we have data) are using 8-927 gallons of brine per unit of oil; six counties’ wells are generating <38 gallons of brine per gallon of oil.
Figure 5. Average brine production (gallons) per gallon of oil produced per day across 19 Ohio Utica Counties
The average Utica well in OH is generating 820 gallons of fracking waste per unit of product produced. Across all OH Utica wells, an average of 0.078 gallons of brine is being generated for every gallon of freshwater used. This figure amounts to a current total of 233.9 MGs of brine waste produce statewide. Over the next five years this trend will result in the generation of one billion gallons (BGs) of brine waste and 12.8 BGs of freshwater required in OH. Put another way…
233.9 MGs is equivalent to the annual waste production of 5.2 million Ohioans – or 45% of the state’s current population.
Due to the low costs incurred by industry when they choose to dispose of their fracking waste in OH, drillers will have only to incur $100 million over the next five years to pay for the injection of the above 1.0 BGs of brine. Ohioans, however, will pay at least $1.5 billion in the same time period to dispose of their municipal solid waste. The average fee to dispose of every ton of waste is $32, which means that the $100 million figure is at the very least $33.5 million – and as much as $250.6 million – less than we should expect industry should be paying to offset the costs.
Environmental Accounting
In summary, there are two ways to look at the potential “energy revolution” that is shale gas:
Using the same traditional supply-side economics metrics we have used in the past (e.g., globalization, Efficient Market Hypothesis, Trickle Down Economics, Bubbles Don’t Exist) to socialize long-term externalities and privatize short-term windfall profits, or
We can begin to incorporate into the national dialogue issues pertaining to watershed resilience, ecosystem services, and the more nuanced valuation of our ecosystems via Ecological Economics.
The latter will require a more real-time and granular understanding of water resource utilization and fracking waste production at the watershed and regional scale, especially as it relates to headline production and the often-trumpeted job generating numbers.
We hope to shed further light on this new “environmental accounting” as it relates to more thorough and responsible energy development policy at the state, federal, and global levels. The life cycle costs of shale gas drilling have all too often been ignored and can’t be if we are to generate the types of energy our country demands while also stewarding our ecosystems. As Mark Twain is reported to have said “Whiskey is for drinking; water is for fighting over.” In order to avoid such a battle over the water-energy nexus in the long run it is imperative that we price in the shale gas industry’s water-use footprint in the near term. As we have demonstrated so far with this series this issue is far from settled here in OH and as they say so goes Ohio so goes the nation!
A Moving Target
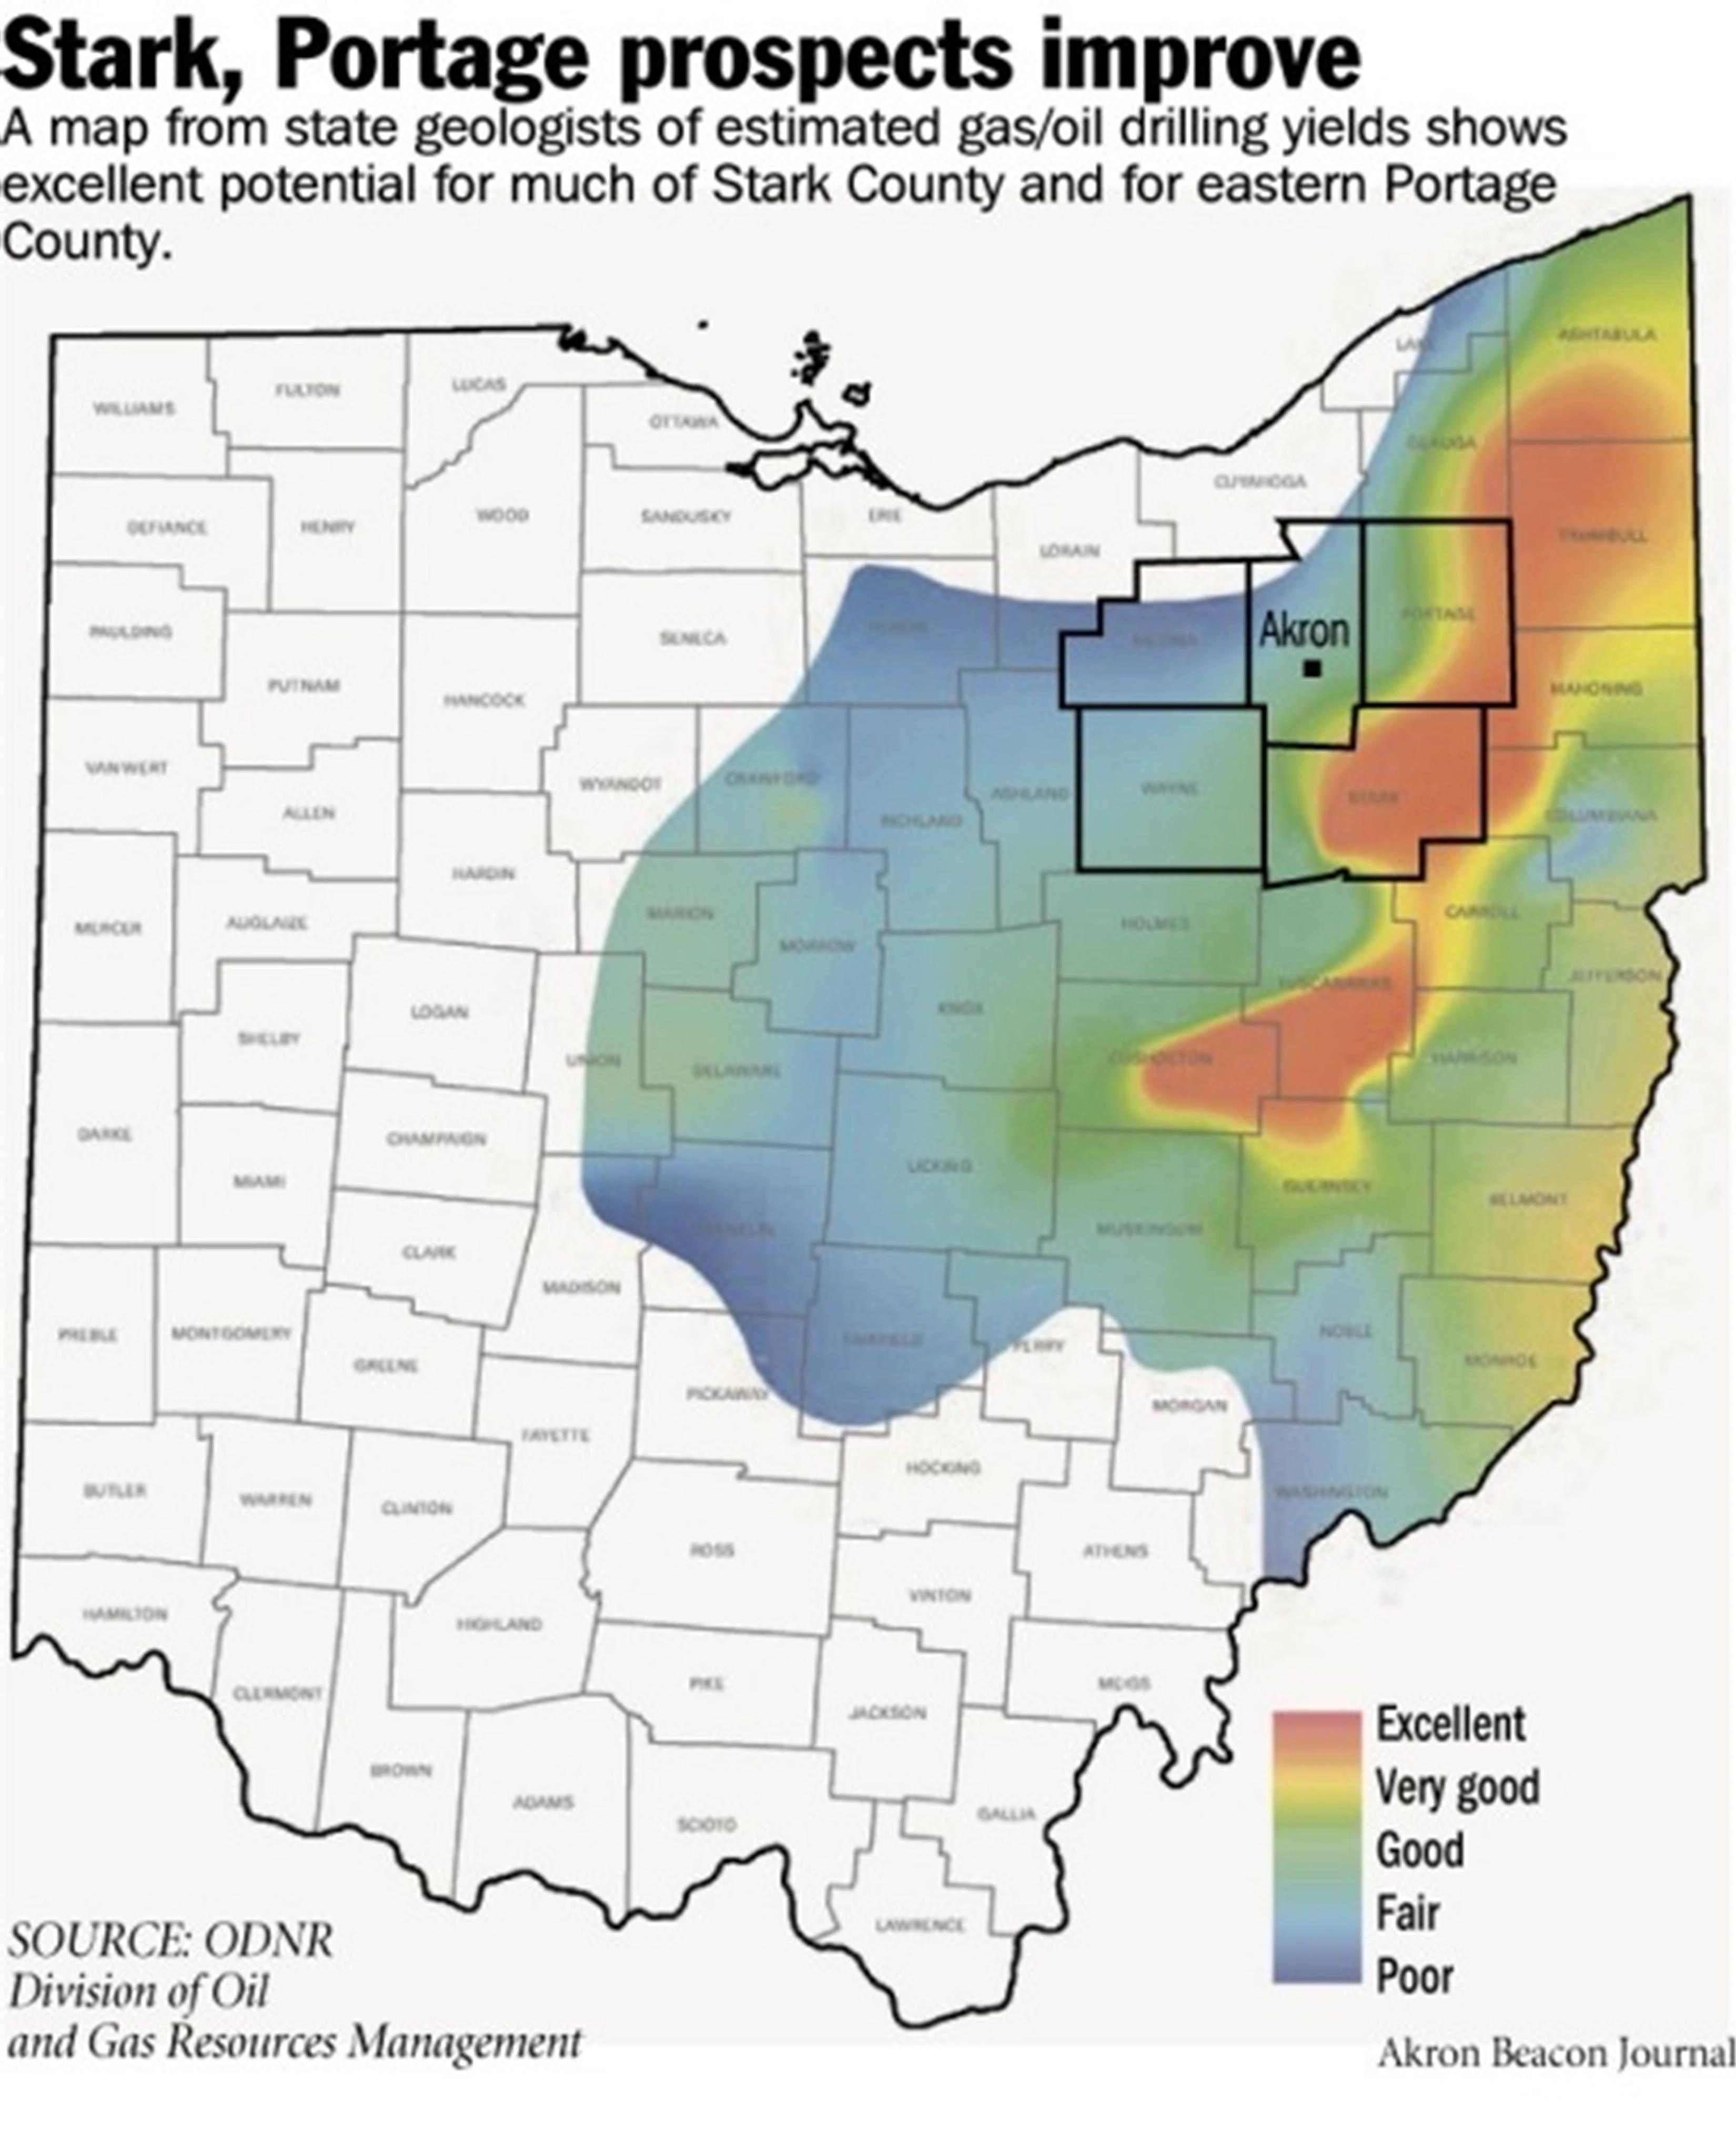
Figure 6. ODNR projection map of potential Utica productivity from spring 2012
OH’s Department of Natural Resources (ODNR) originally claimed a big red – and nearly continuous – blob of Utica productivity existed. The projection originally stretched from Ashtabula and Trumbull counties south-southwest to Tuscarawas, Guernsey, and Coshocton along the Appalachian Plateau (See Figure 6).
However, our analysis demonstrates that (Figures 7 and 8):
This is a rapidly moving target,
The big red blob isn’t as big – or continuous – as once projected, and
It might not even include many of the counties once thought to be the heart of the OH Utica shale play.
This last point is important because counties, families, investors, and outside interests were developing investment and/or savings strategies based on this map and a 30+ year timeframe – neither of which may be even remotely close according to our model.
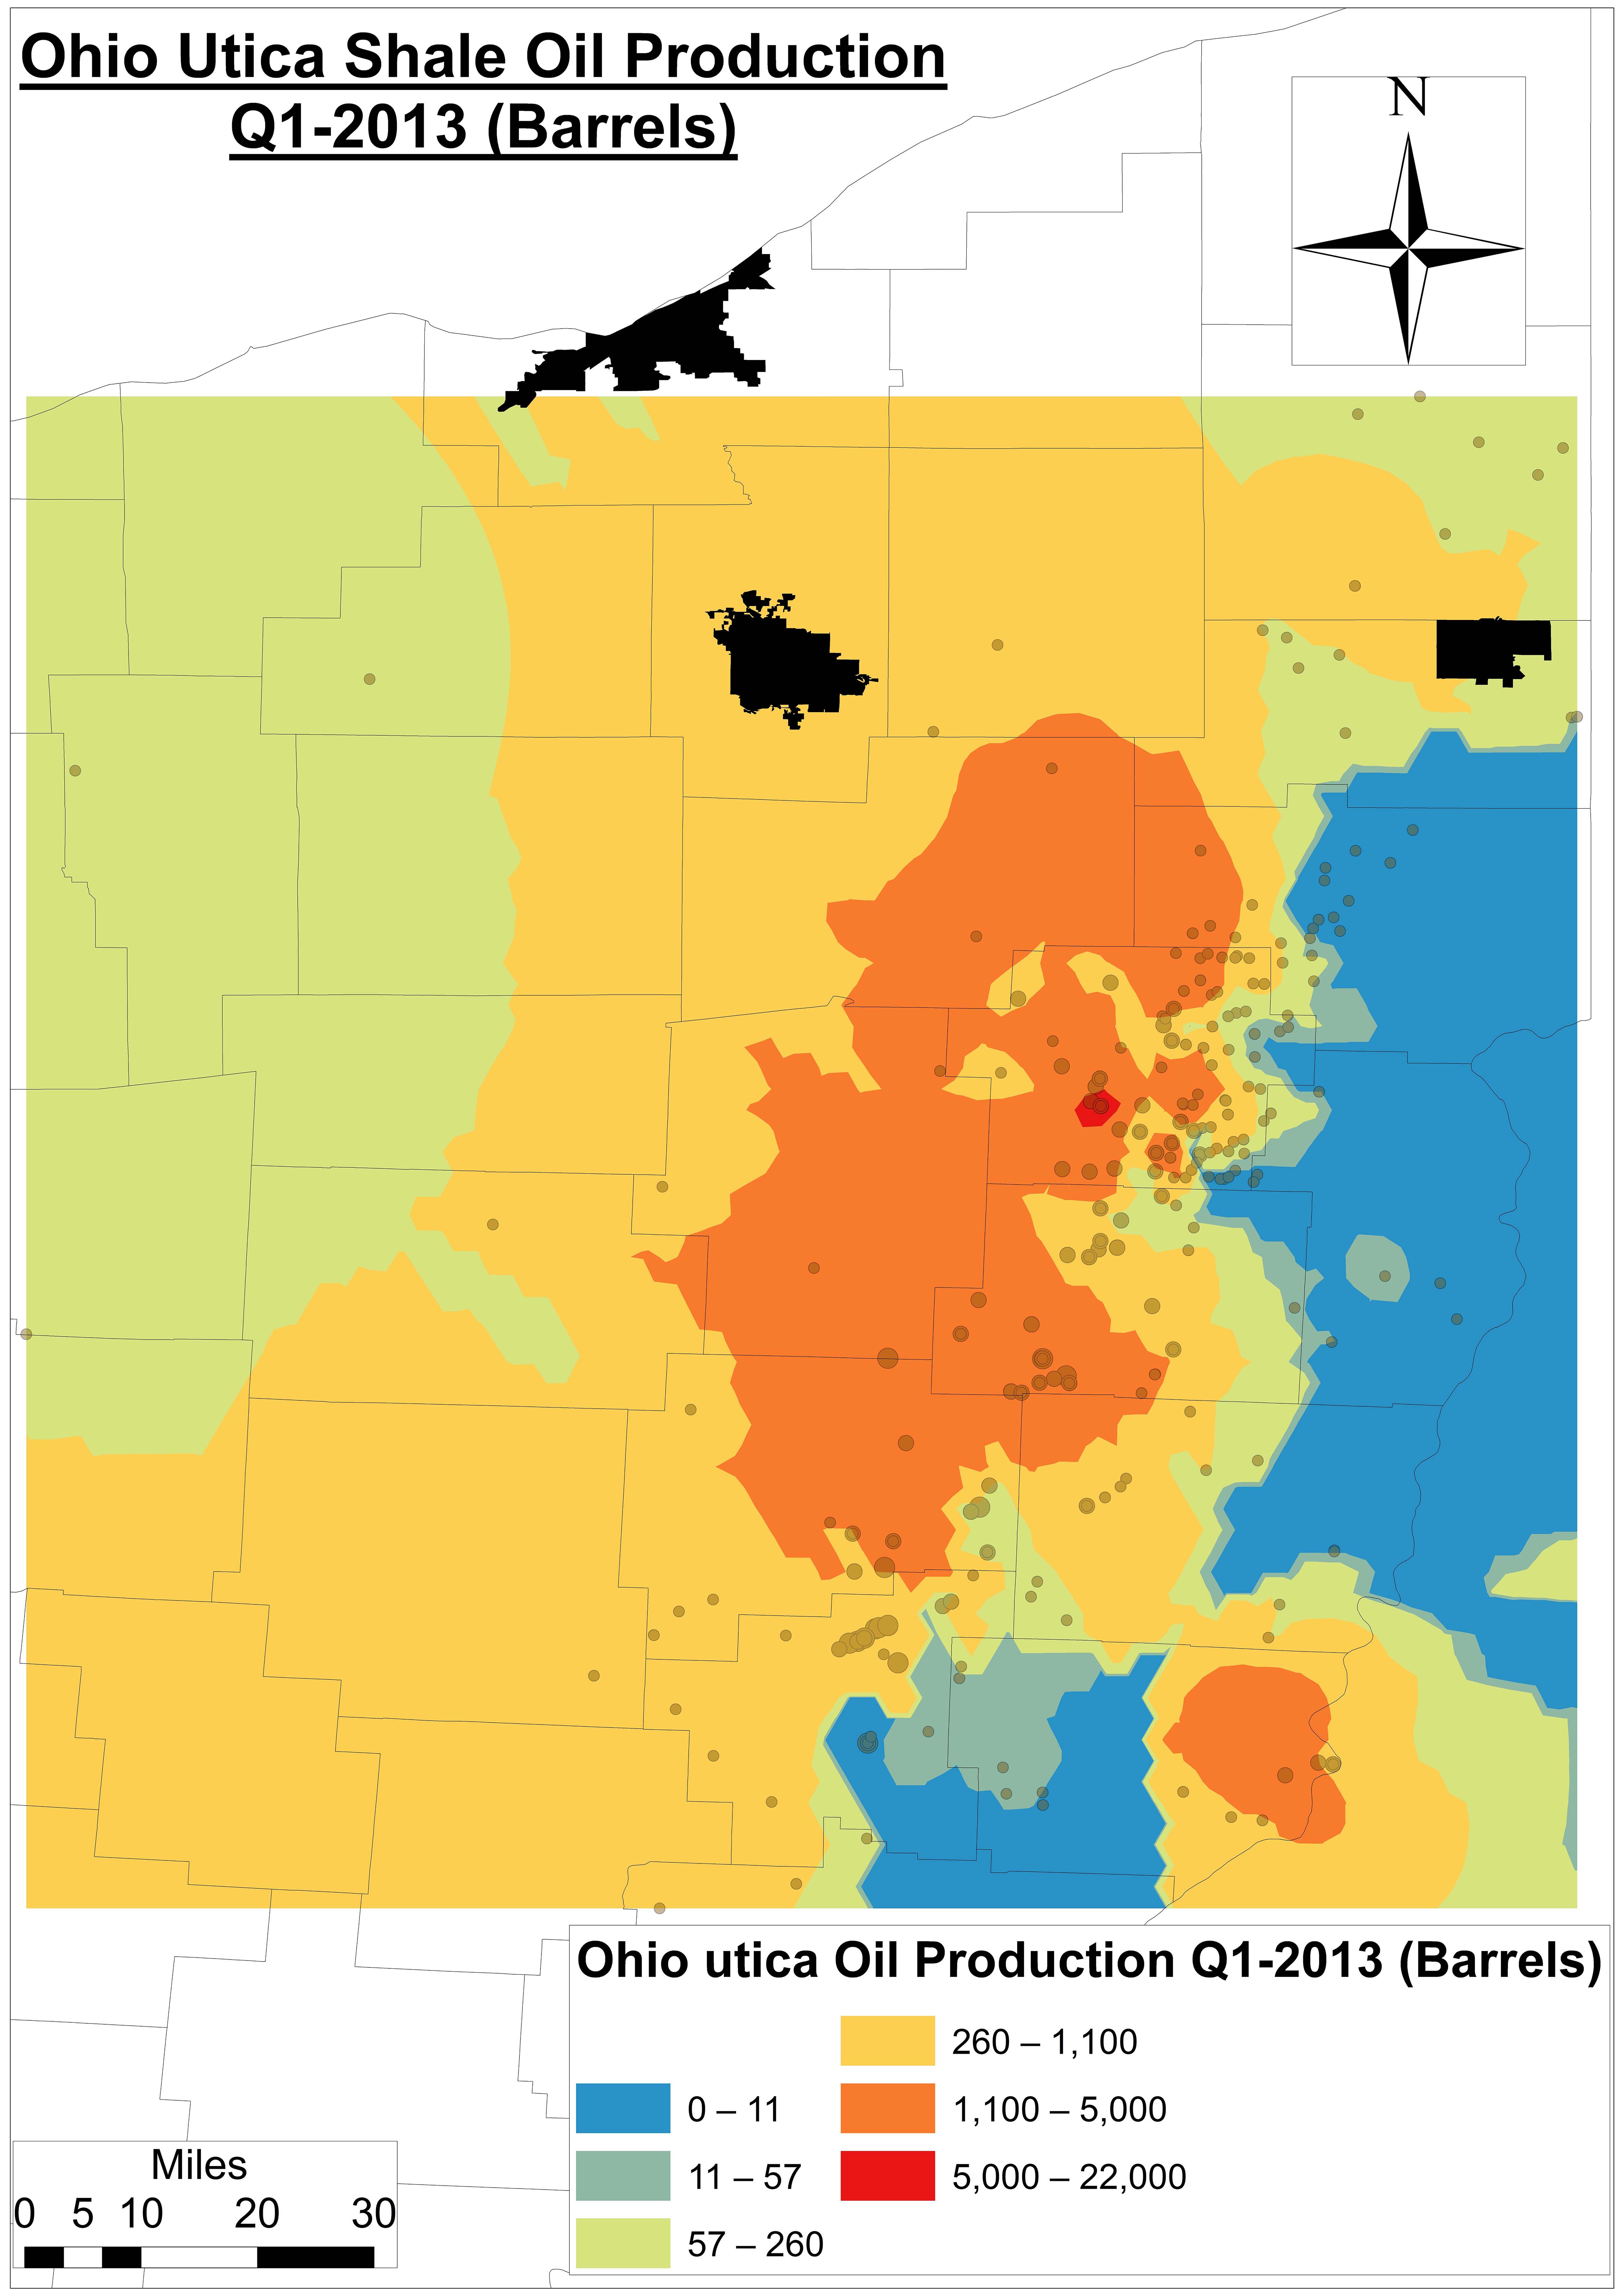
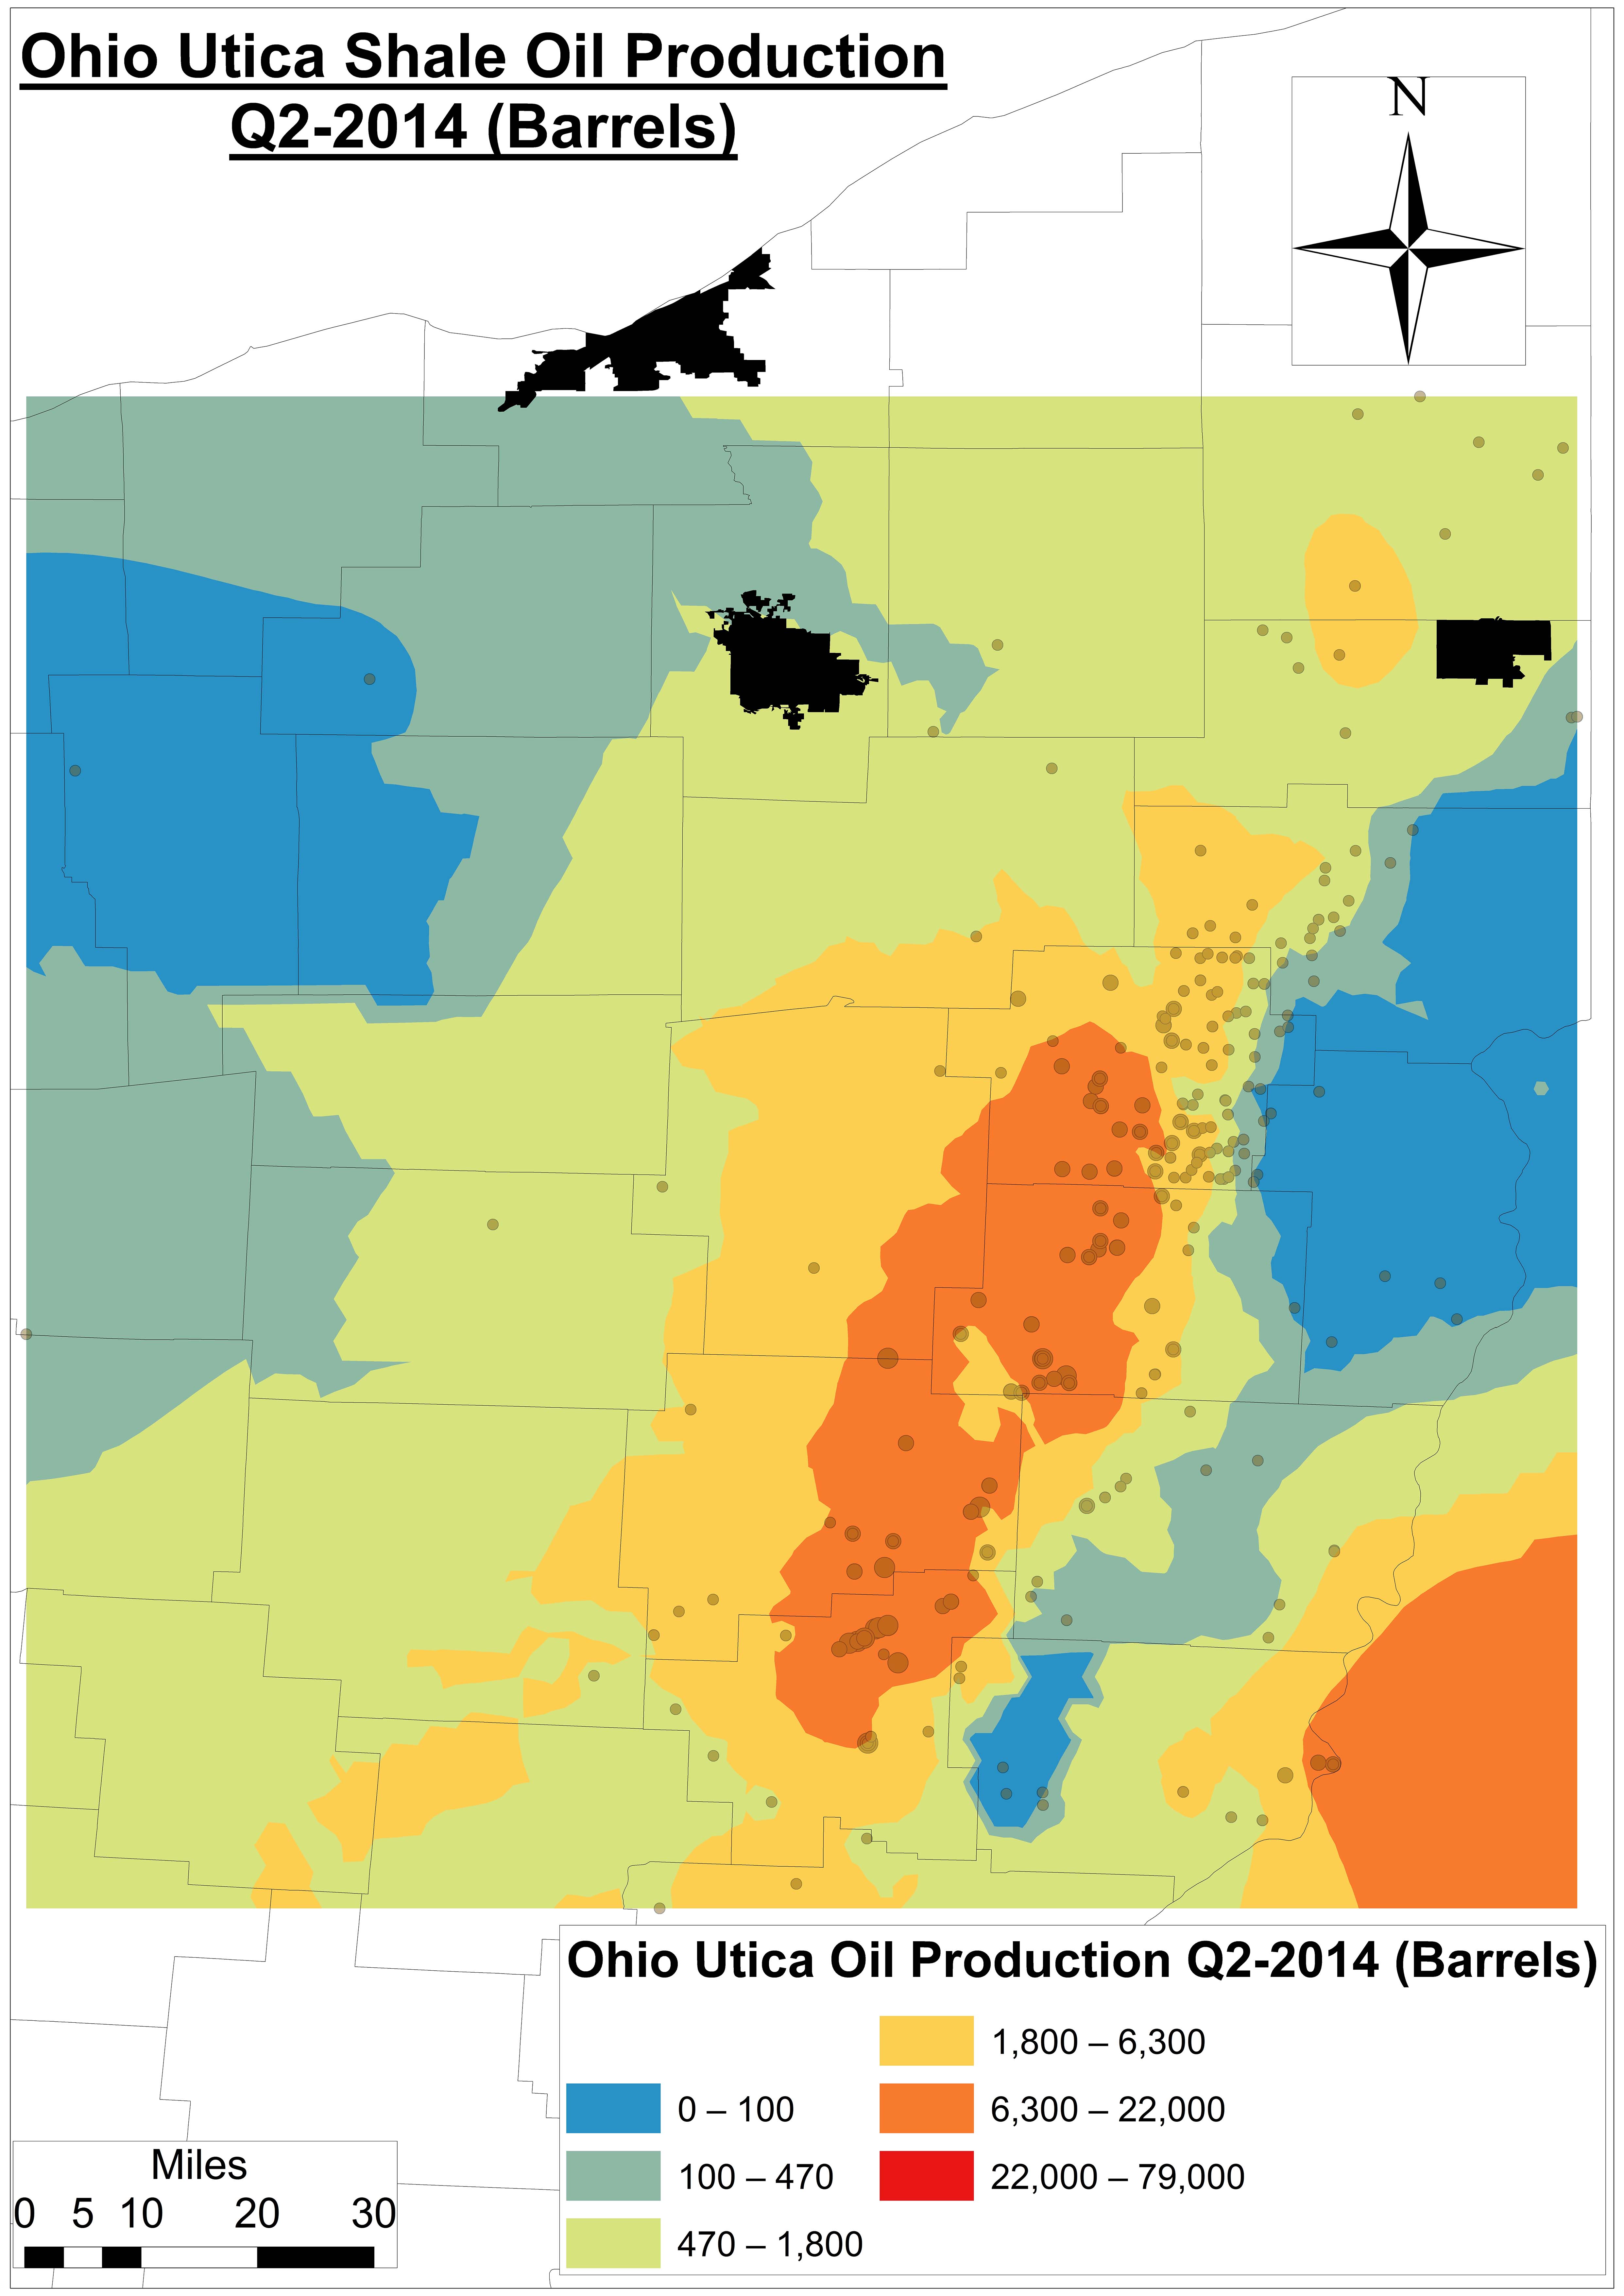
Figure 7a. An Ohio Utica Shale oil production model using Kriging6 for Q1-2013
Figure 7b. An Ohio Utica Shale oil production model using Kriging for Q2-2014
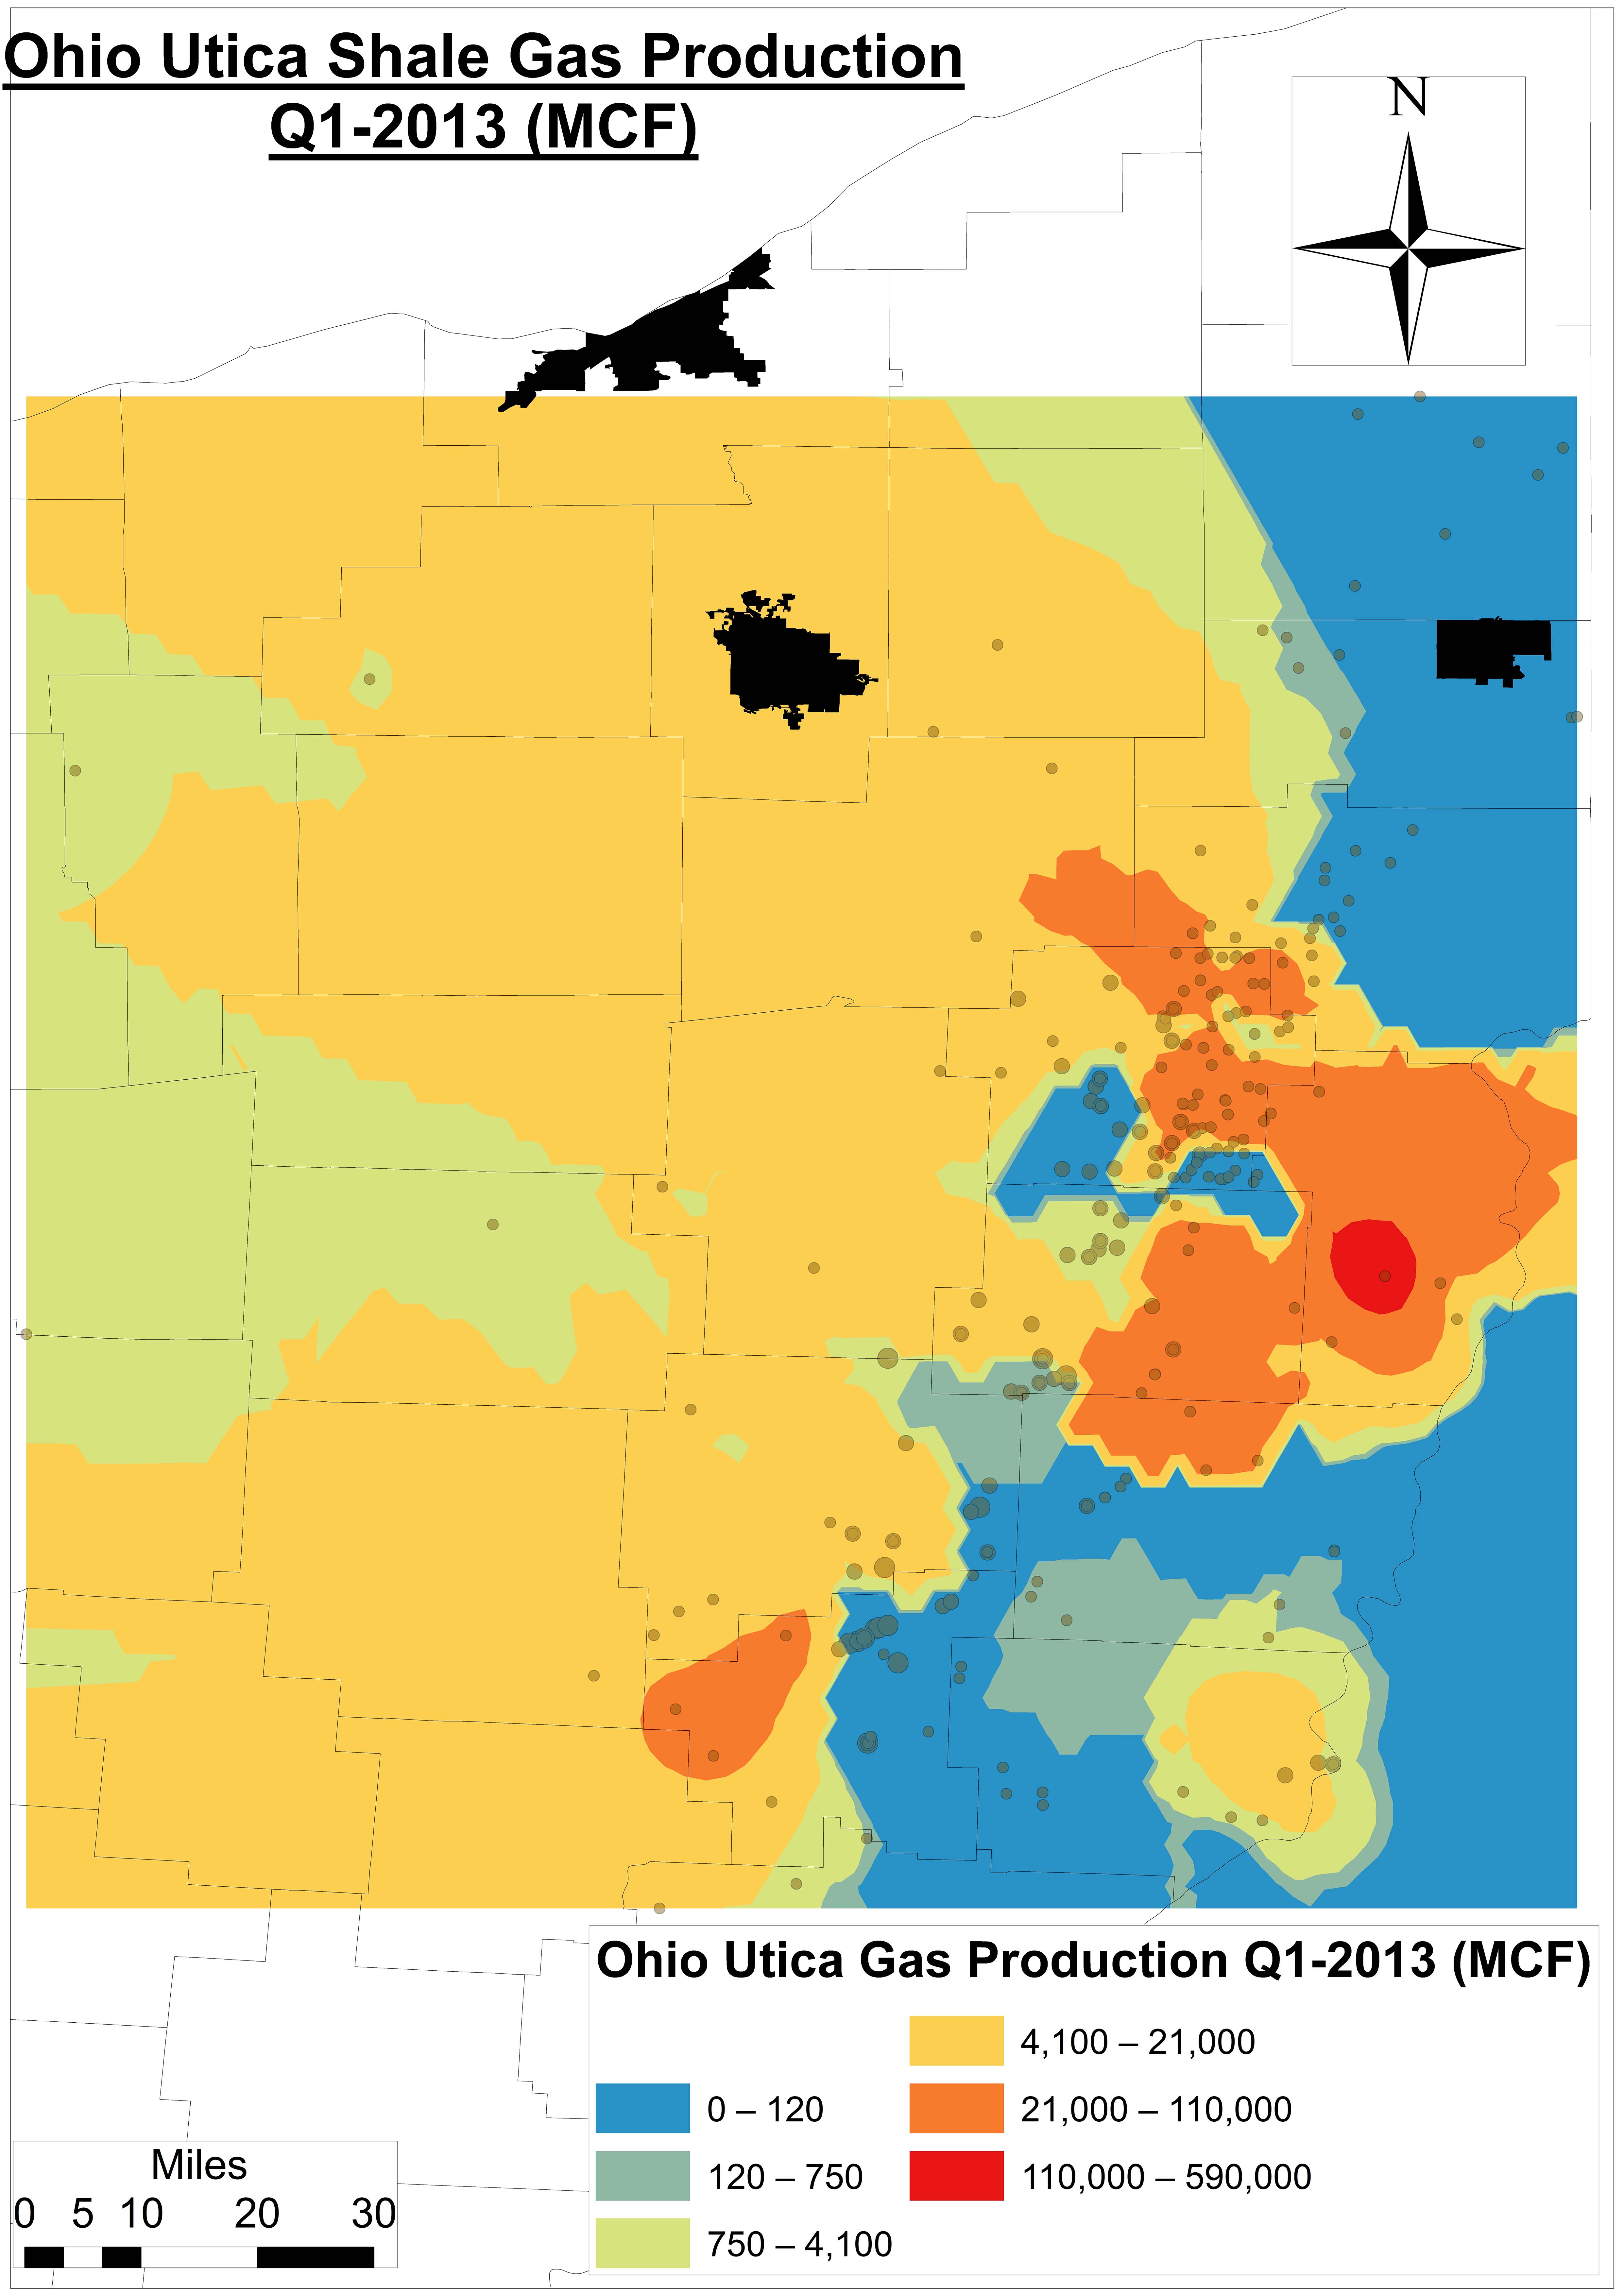
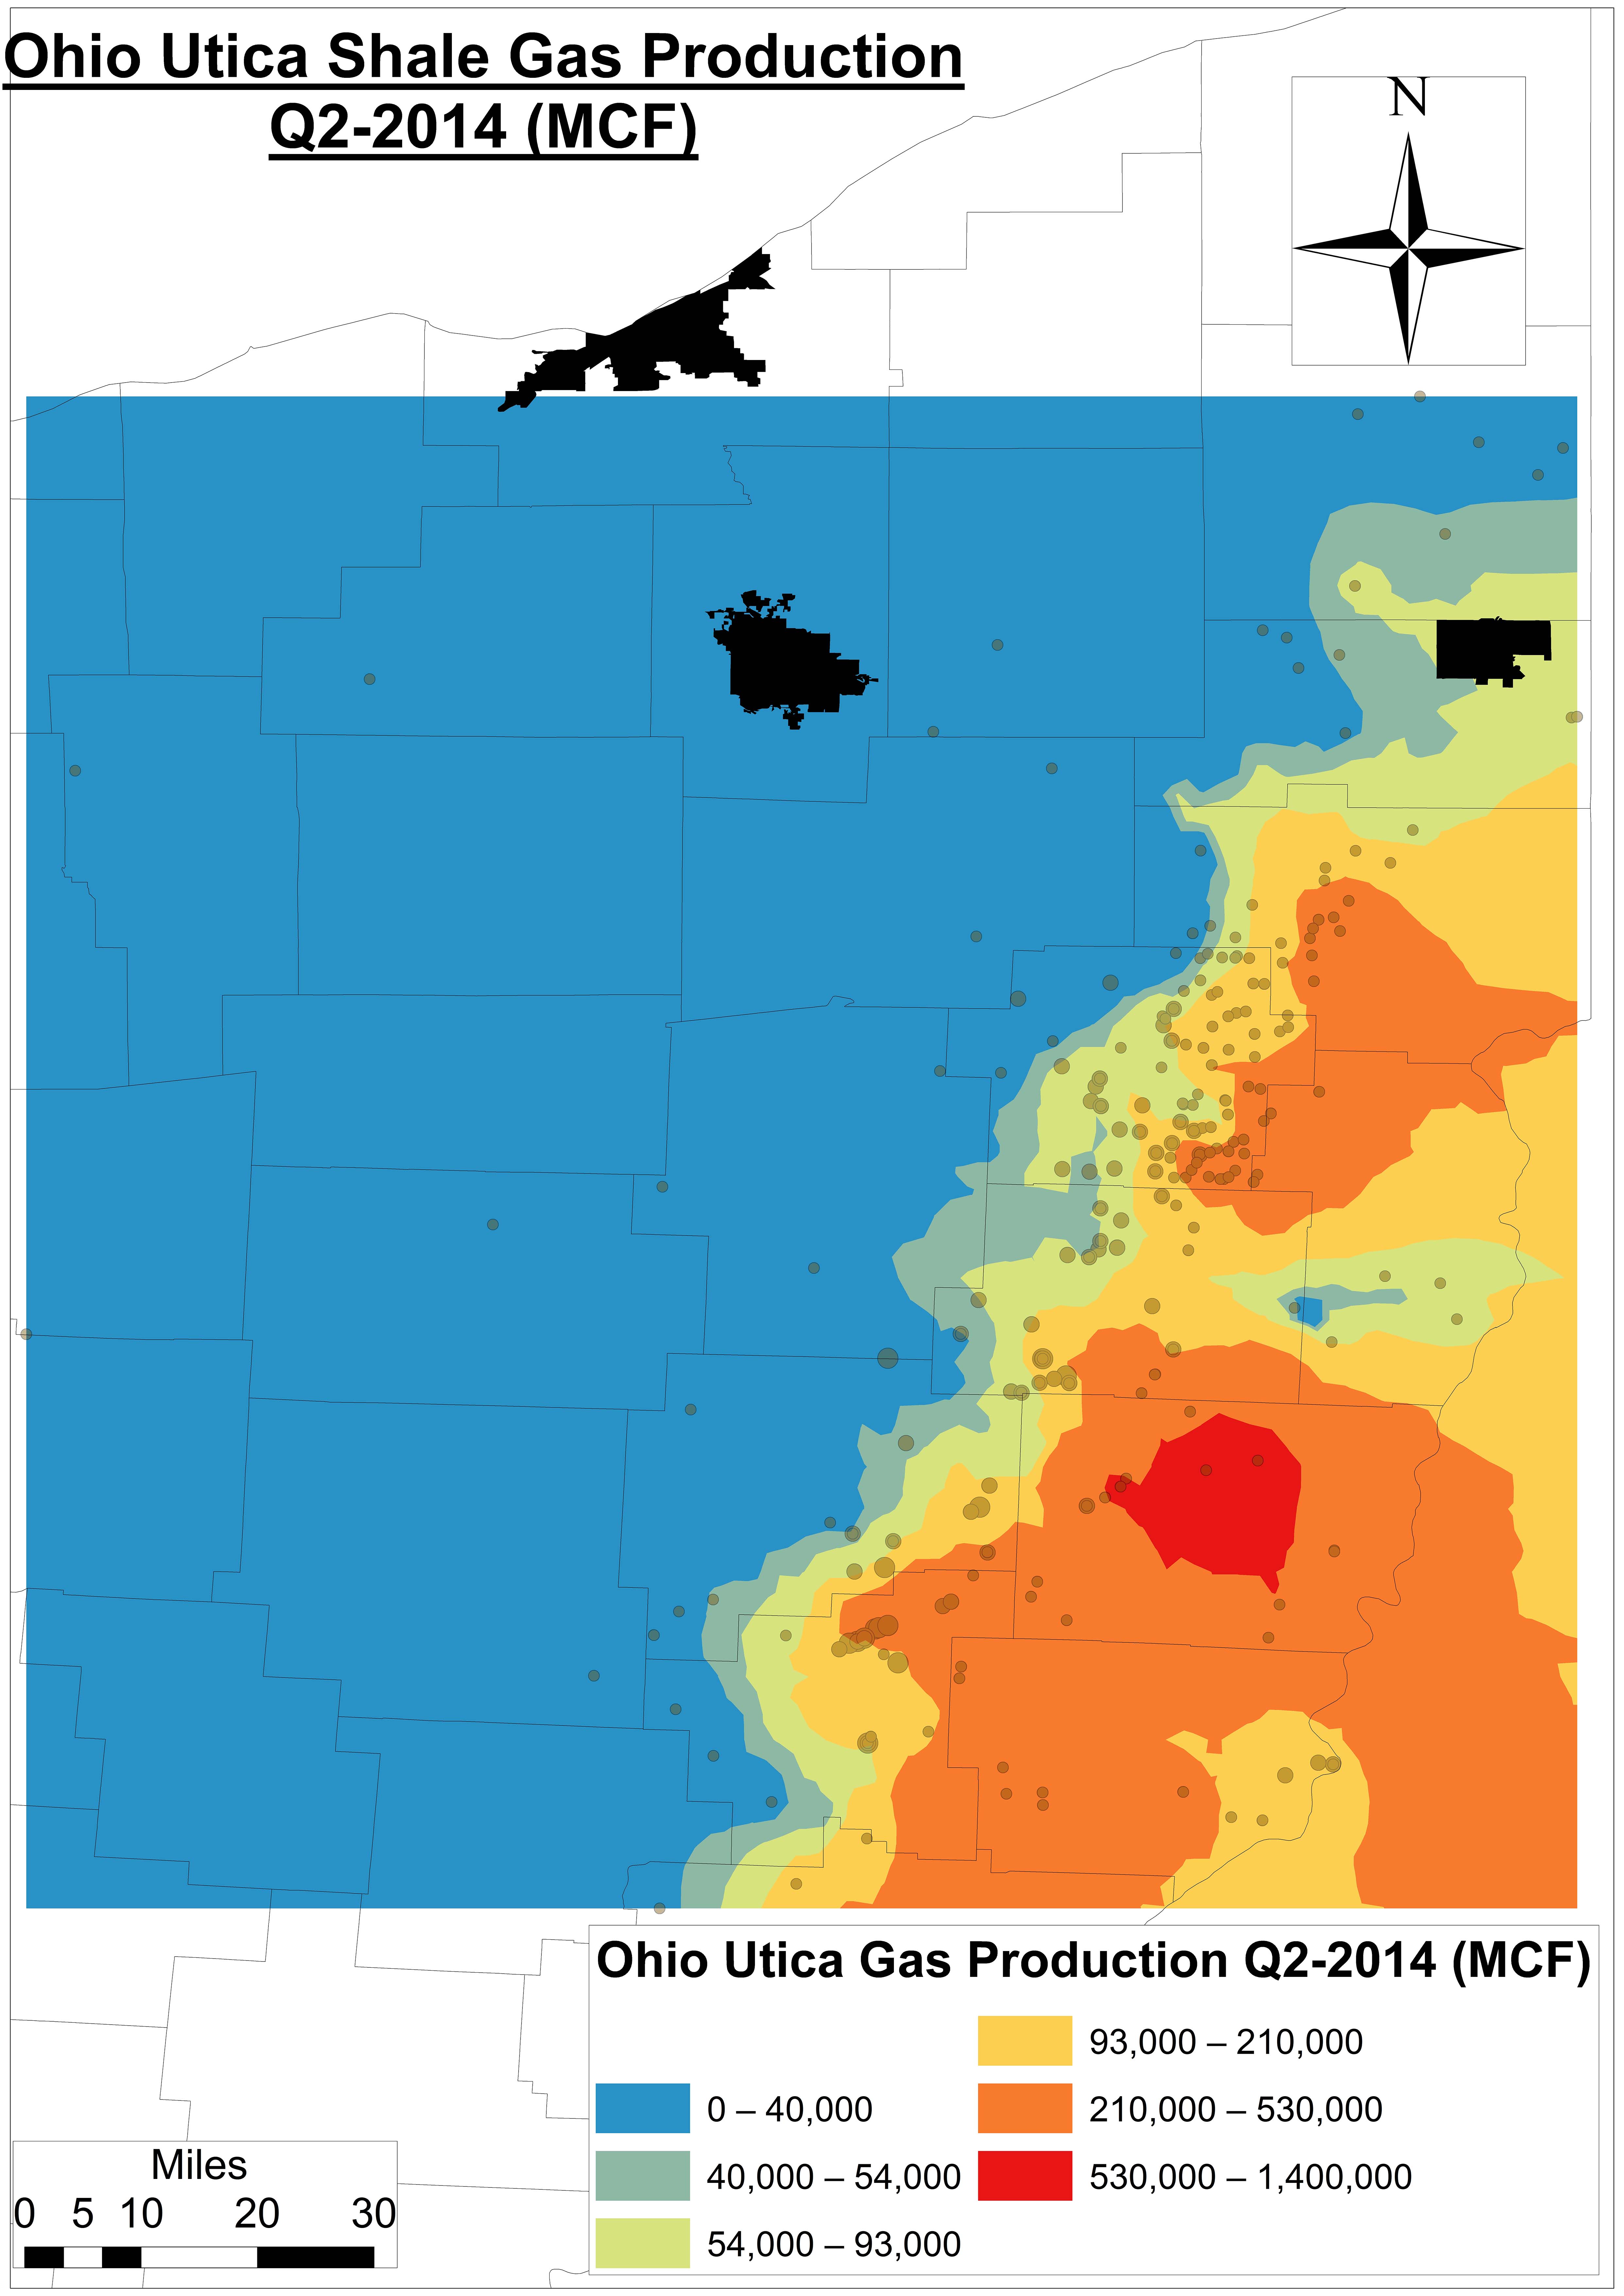
Figure 8a. An Ohio Utica Shale gas production model using Kriging for Q1-2013
Figure 8b. An Ohio Utica Shale gas production model using Kriging for Q2-2014
Footnotes
$4.25 per 1,000 gallons, which is the current going rate for freshwater at OH’s MWCD New Philadelphia headquarters, is 4.7-8.2 times less than residential water costs at the city level according to Global Water Intelligence.
Carroll County wells have seen days in production jump from 36-62 days in 2011-2012 to 68-78 in 2014 across 256 producing wells as of Q2-2014.
One Mcf is a unit of measurement for natural gas referring to 1,000 cubic feet, which is approximately enough gas to run an American household (e.g. heat, water heater, cooking) for four days.
Assuming average oil and natural gas prices of $96 per barrel and $8.67 per Mcf during the current period of production (2011 to Q2-2014), respectively
On a per-API# basis or even regional basis we have not found drilling muds data. We do have it – and are in the process of making sense of it – at the Solid Waste District level.
https://www.fractracker.org/a5ej20sjfwe/wp-content/uploads/2014/11/Nexus2-Feature.png400900Ted Auch, PhDhttps://www.fractracker.org/a5ej20sjfwe/wp-content/uploads/2025/09/2025-Wordmark-Logo.pngTed Auch, PhD2014-11-17 17:00:262020-07-21 10:34:07The Water-Energy Nexus in Ohio, Part II
When the unconventional oil and gas extraction boom hit Pennsylvania in the mid-2000s small, local operators were among the first on the scene. As shale plays continued to develop, many of these smaller companies were bought out by larger, national corporations. Larger oil and gas development companies often maintain that they are better able to handle the expected regulatory requirements, and so FracTracker wanted to determine if there was a change in the compliance record for wells that changed hands. Does having more resources available to them translate into stronger compliance standards for oil and gas drillers, better training for their employees, and a greater burden to get things right? Investigating these questions by looking into compliance data and the sale of wells, however, was no easy task.
Analysis Methods
There are no indications in either the drilled wells or permits datasets available from the DEP that a well has changed hands; in both of these sources, one operator’s name is simply substituted for the other. It is possible to comb through old news stories, and find that East Resources sold its assets to Shell in 2010, for example. However, this approach is piecemeal, and would not lead to satisfactory results on an industry-wide analysis.
Major obstacles to our analysis included:
Lack of information on the transfer of oil and gas wells from one operator to another
There is often a lag time between the time violations occur and when they are reported
Errors in compliance reporting. For example, one API Number was found to have the operator listed as “Not Assigned” (It was later discovered that this well was never sold).
Results
Unlike wells and permits, any items on the compliance dataset are attributed to whichever company was operating the well at the time the violation was issued. So while FracTracker could not do the analysis that we wanted to because of the limitations of available data, we were able to isolate 30 wells that have changed hands between January 1, 2000 and November 4, 2014 (Table 1). One well has been bought and sold twice, with each of the three operators being issued violations.
In some instances the original well owner was reported to be out of compliance more times than the second owner. For example, API Number 013-20012 had 11 violations reported under its first owner and only 1 since it has been sold. The contrary also occurred, however, such as in the case of API Number 065-26481, which had 4 violations reported under its first owner and 14 under its second owner. There are not enough data points to determine which scenario is the trend in the data – if in fact there is one.
Due to limitations in the data, we cannot currently evaluate whether the notion that larger companies can improve the track record of problematic wells. In fact, many of the wells that were issued violations for multiple operators really just changed hands from one big operator who wanted to get out of the Marcellus to another big operator who wanted to get in. Our small sample doesn’t include any of the wells that were issued violations to only one company, of all the wells that changed hands over the years. To accurately assess the scenario, more data would have to be released, specifically the date when wells changed hands from one company to another.
Table 1. Wells with violations by API number that have changed ownership
API Number
First Owner
Last Known Date Of Ownership
Second Owner
First Known Date Of Ownership
Third Owner
First Known Date Of Ownership
013-20012
Chief Oil & Gas LLC
5/24/10
Chevron Appalachia LLC
2/5/13
015-20033
Belden & Blake Corp
4/10/09
Chesapeake Appalachia LLC
12/7/11
015-20051
Consol Gas Co
6/16/04
Range Resources Appalachia LLC
8/9/05
Talisman Energy USA Inc
11/16/11
019-21494
Phillips Exploration Inc
6/10/08
XTO Energy Inc
7/24/13
019-21680
Phillips Exploration Inc
4/6/10
XTO Energy Inc
3/13/13
065-26481
Dannic Energy Corp
5/11/11
Mieka LLC
11/10/11
065-26832
Dannic Energy Corp
3/2/11
Mieka LLC
4/11/12
081-20062
Chief Oil & Gas LLC
1/6/09
Exco Resources Pa LLC
8/16/11
081-20069
Chief Oil & Gas LLC
5/21/08
Exco Resources Pa LLC
3/28/11
081-20128
Chief Oil & Gas LLC
11/15/10
Exco Resources Pa LLC
6/27/11
081-20144
Chief Oil & Gas LLC
7/21/10
Exco Resources Pa LLC
3/15/12
081-20149
Chief Oil & Gas LLC
1/10/11
Exco Resources Pa LLC
2/21/12
081-20244
Chief Oil & Gas LLC
5/20/10
Exco Resources Pa LLC
11/15/12
081-20255
Chief Oil & Gas LLC
11/15/10
Exco Resources Pa LLC
11/29/11
081-20279
Chief Oil & Gas LLC
12/3/10
Exco Resources Pa LLC
4/20/12
081-20298
Chief Oil & Gas LLC
5/26/10
Exco Resources Pa LLC
6/27/11
083-53843
Anschutz Exploration Corp
4/7/09
Chesapeake Appalachia LLC
3/20/13
113-20025
Chief Oil & Gas LLC
2/15/11
Exco Resources Pa LLC
3/16/11
113-20049
Chief Oil & Gas LLC
11/30/10
Exco Resources Pa LLC
4/13/11
115-20052
Turm Oil Inc
9/24/08
Chesapeake Appalachia LLC
8/21/14
115-20169
Alta Opr Co LLC
11/24/09
WPX Energy Appalachia LLC
4/13/11
115-20174
Alta Opr Co LLC
4/16/10
Wpx Energy Appalachia LLC
4/29/11
115-20191
Alta Opr Co LLC
12/1/09
Wpx Energy Appalachia LLC
6/1/11
115-20214
Alta Opr Co LLC
7/19/10
Wpx Energy Appalachia LLC
8/16/10
115-20231
Alta Opr Co LLC
4/8/10
Wpx Energy Appalachia LLC
6/1/11
117-20197
East Resources Inc
4/8/08
Talisman Energy USA Inc
1/26/11
117-20280
East Resources Inc
5/19/10
Swepi LP
8/28/14
117-20330
East Resources Inc
12/18/09
Talisman Energy USA Inc
2/20/13
117-20394
East Resources Inc
12/14/09
Swepi LP
10/25/11
117-20538
East Resources Inc
12/18/10
Swepi LP
5/27/10
https://www.fractracker.org/a5ej20sjfwe/wp-content/uploads/2014/11/Comparison-Feature.png400900FracTracker Alliancehttps://www.fractracker.org/a5ej20sjfwe/wp-content/uploads/2025/09/2025-Wordmark-Logo.pngFracTracker Alliance2014-11-12 14:47:302025-05-02 14:46:09Comparison of Oil and Gas Violations and the Sale of Wells
New Report from FracTracker and the Natural Resources Defense Council By Kyle Ferrar, CA Program Coordinator, FracTracker Alliance
The FracTracker Alliance recently contributed to a report released by the Natural Resources Defense Council (NRDC), titled Drilling in California: Who’s at Risk?. In the report, we find that many communities disproportionally burdened by environmental and public health degradation also live in the areas most impacted by oil and gas (O&G) development, including hydraulic fracturing and acidizing. Additionally, the communities most impacted by such oil and gas activity are disproportionately non-white. Key points of the report are listed below, as outlined by the NRDC:
Key Points of “Drilling in California” Report
Expanding oil production in California, in areas already heavily drilled or in new areas, can threaten the health of communities.
New analysis shows that, already, approximately 5.4 million Californians live within a mile of one, or more, of the more than 84,000 existing oil and gas wells.
More than a third of the communities living with oil and gas wells are also burdened with the worst environmental pollution, as measured by CalEPA’s CalEnviroScreen 2.0. These communities, with heightened risks, are 92 percent people of color.
To prevent further environmental damage and public health threats, major improvements are required before hydraulic fracturing, acidizing, and other stimulation techniques are allowed to continue in California.
The analysis used the California Environmental Protection Agency (CalEPA) Office of Health Hazard and Assessment’s (OEHHA) impact screening tool CalEnviroScreen 2.0, which ranks all the census tracts in CA based on various indicators of environmental and public health degradation due to pollution sources. Stimulated and non-stimulated O&G well-site data came from multiple sources including the Division of Oil, Gas and Geothermal Resources; the South Coast Air Quality Management District; and FracFocus.
Visualizing the Data
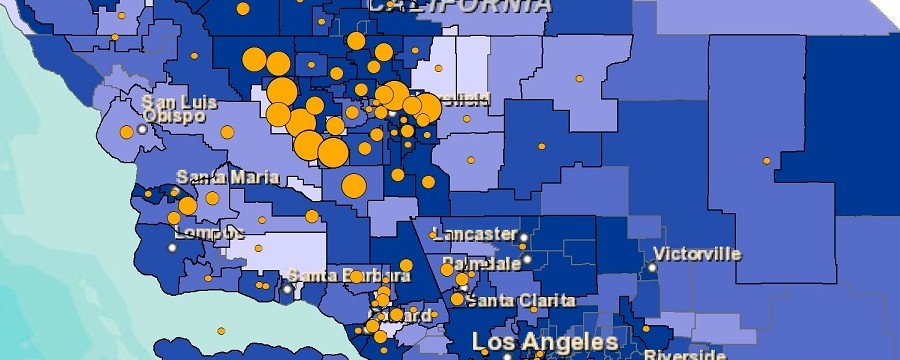
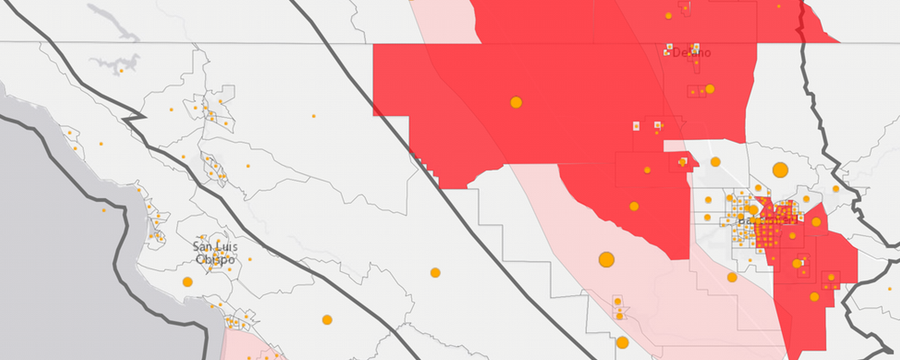
The interactive web map below (Figure 1) provides a visual understanding of how these areas may be additionally burdened by California’s industrial oil and gas extraction activities. The CalEnviroscreen 2.0 dataset of census tract scores was mapped spatially to show the areas in CA disproportionately burdened by existing environmental stressors and health impacts. The locations of CA’s O&G production wells were overlaid on these maps since the CalEnviroscreen ranks did not specifically take into account the role of O&G extraction activity in communities. The top 20th percentile of total scores are shown in the map’s default view, and more CalEnviroscreen scores are displayable under the “Layers” tab (top right).
Figure 1. The top 20th percentile of highest CalEnviroscreen 2.0 total scores are shown in the map above along with well counts by census tract. Increasing well counts are portrayed with orange circles that increase in size with the number of wells. Click here to explore.
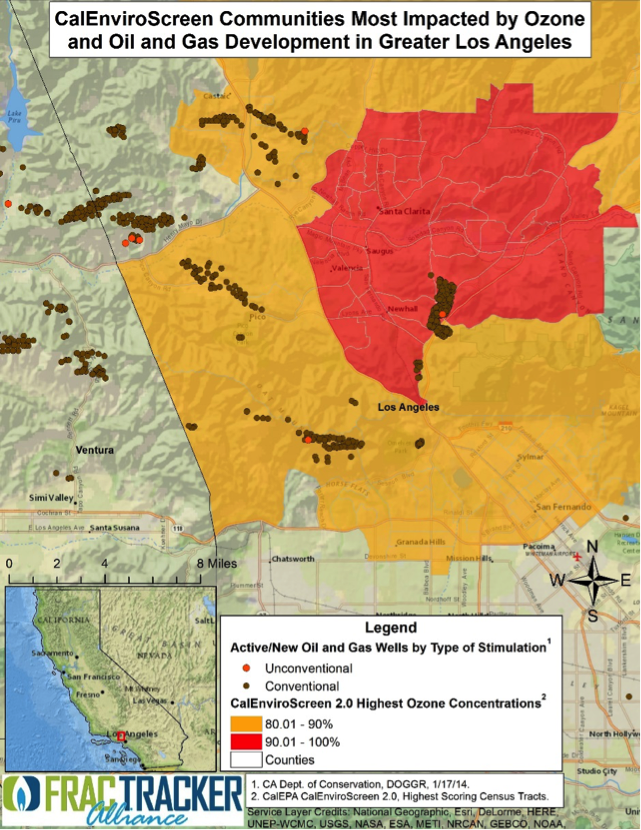
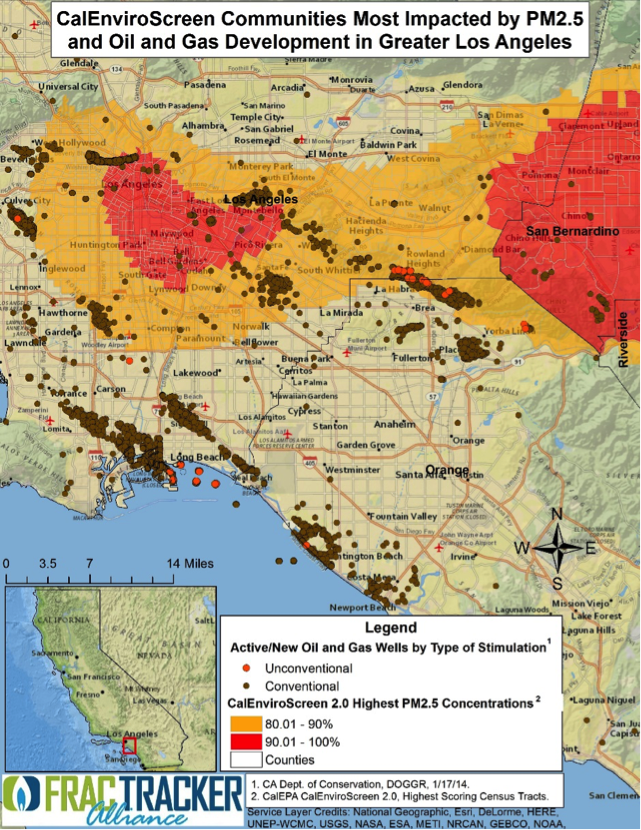
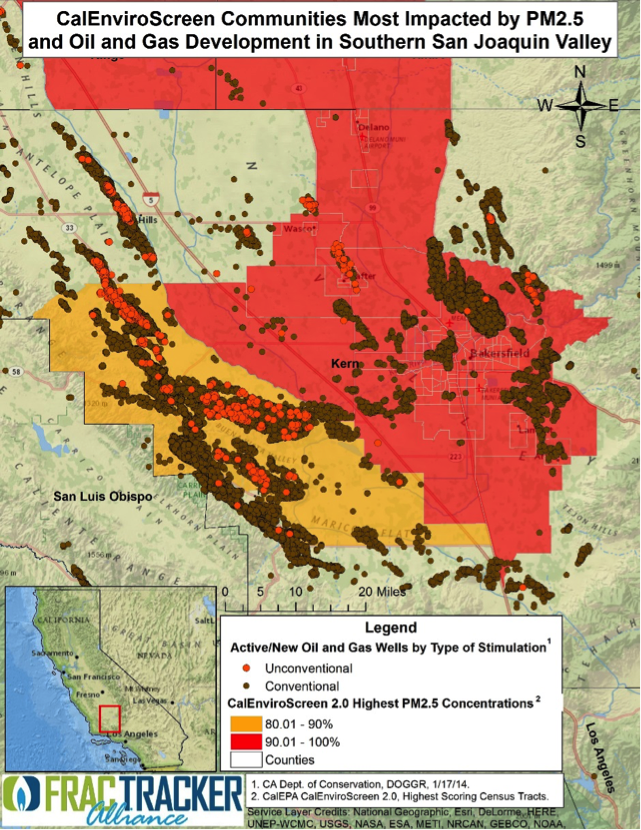
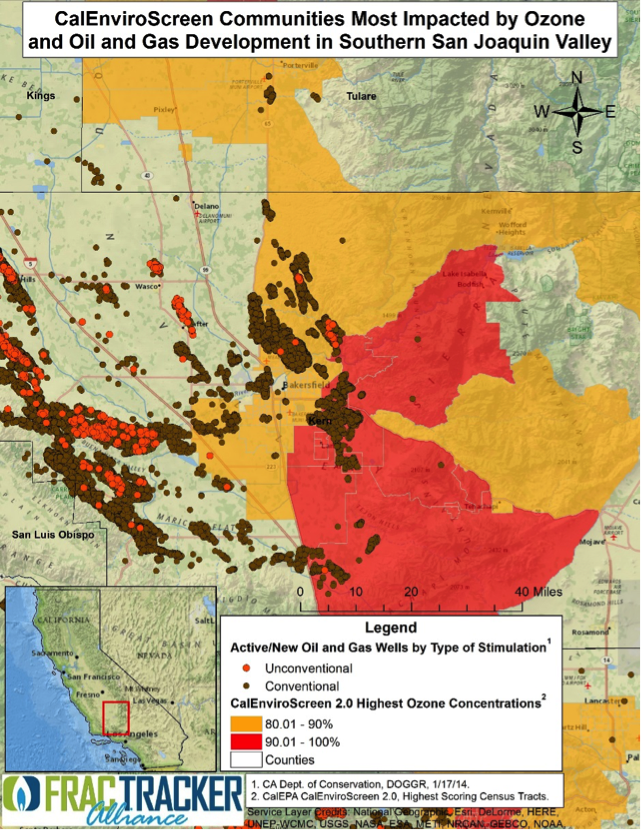
Figures 2-7 below are provide printable examples of several of CalEnviroscreen’s 2.0’s most important rankings when considering O&G extraction activity.
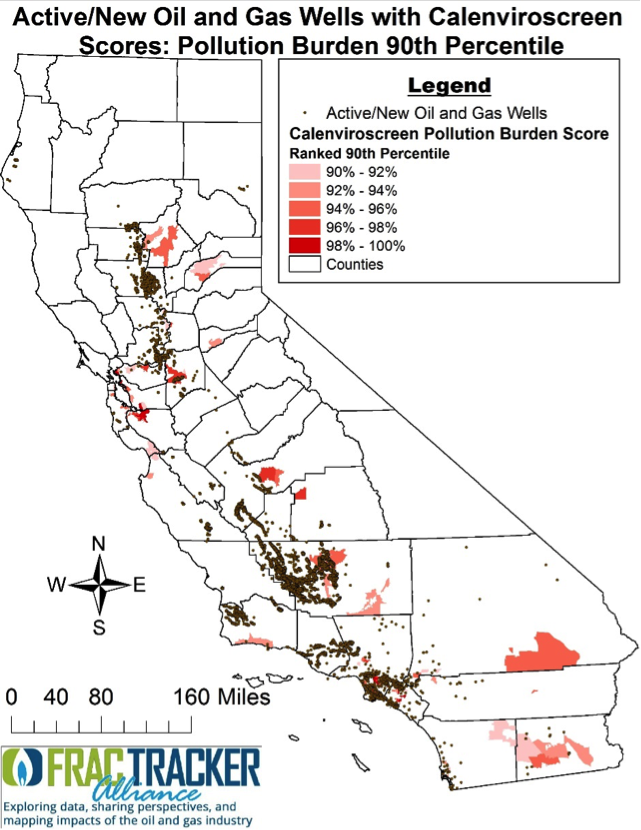
Figure 2. CalEnviroscreen 2.0 highest 20th percentile of census tracts with the most pollution burden from various sources in all of California. The census tract scores are overlaid with active oil and gas (O&G) wells.
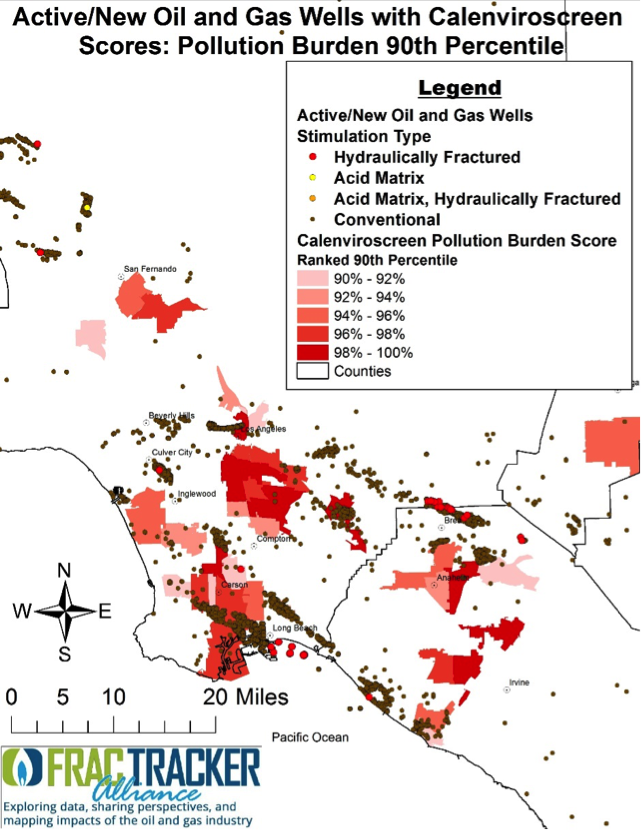
Figure 3. Focus on the Greater Los Angeles Basin. Shows the CalEnviroscreen 2.0 highest 20th percentile of census tracts with the most pollution burden from various sources. Census tract scores are overlaid with active O&G wells. Many of the areas most impacted by existing pollution also host much of the O&G extraction activity.
Figure 4. Focus on Los Angeles County, with some of the highest ranking scores for Ozone pollution. These areas also host and are surrounded by many oil/gas wells.
Figure 5. Focus on the Greater Los Angeles Basin. Shows the CalEnviroscreen 2.0 highest 20th percentile of census tracts with the worst air quality impacts resulting from particulate matter (PM2.5) pollution. Census tract scores are overlaid with active O&G wells. Many of the areas most impacted by PM2.5 also host much of the O&G extraction activity.
Figure 6. Focus on Kern County in the Central San Joaquin Valley. Shows the CalEnviroscreen 2.0 highest 20th percentile of census tracts with the worst air quality impacts resulting from particulate matter (PM2.5) pollution. Census tract scores are overlaid with active oil and gas wells. Many of the areas most impacted by PM2.5 also host much of the O&G extraction activity.
Figure 7. Focuses on the areas of Kern County with the CalEnviroscreen 2.0 highest 20th percentile of census tracts with the worst air quality impacts resulting from ambient ozone pollution. Census tract scores are overlaid with active oil and gas wells. Many of the areas most impacted by ozone also host much of the O&G extraction activity.
https://www.fractracker.org/a5ej20sjfwe/wp-content/uploads/2014/10/NRDCFeature.png400900Kyle Ferrar, MPHhttps://www.fractracker.org/a5ej20sjfwe/wp-content/uploads/2025/09/2025-Wordmark-Logo.pngKyle Ferrar, MPH2014-10-31 10:12:112020-07-21 10:34:06Disproportionate Drilling and Stimulations in California
One of the potentially troubling aspects of oil and gas development is that there are usually people who live in the vicinity of the wells. Pennsylvania now has over 8,000 active unconventional wells; there are any number of issues that can occur with these modern, industrial-scale sites, including road degradation, contaminated water, and health impacts, among others. In addition, there are over 93,000 of the smaller, conventional wells in operation throughout the Commonwealth. While these garner far less attention than their unconventional counterparts, they are also prone to producing similar impacts, not to mention that since many of them are older wells, they not only have potentially been subject to deterioration and occasional neglect, but were constructed during a period with less stringent requirements than are currently expected.
Petroleum engineers are now capable of drilling horizontally for tens of thousands of feet. For the most part, however, this technology is employed to maximize production, rather than to ameliorate impacts on people who live near the product. But who are these people? To help to answer this question, the FracTracker Alliance calculated the number of people living in a half-mile radius around active wells in the state.
More than 1.2 million Pennsylvanians live within the impact area.
Of the 93,754 wells that have been drilled in the state since 1950 that have not yet been plugged, the Pennsylvania DEP only has location data for 79,118 of them. All but one of the 14,636 missing locations are for wells that are categorized as Conventional. While one must presume that there is some overlap in coverage within the half-mile zone, the extent of this region – and therefore the population that lives within it – cannot be determined.
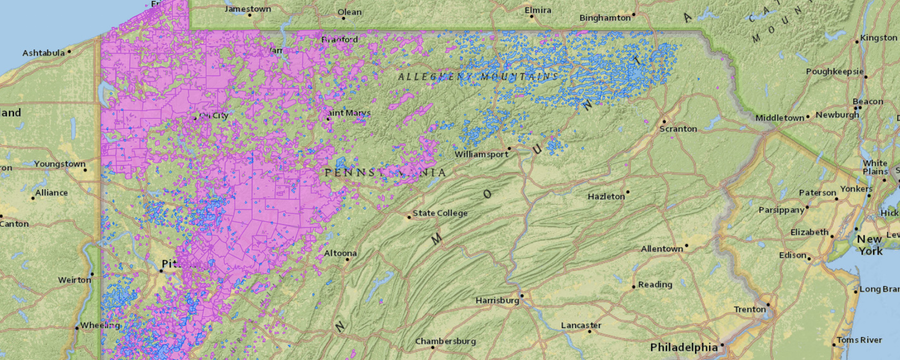
Fig. 1. PA Populations Near Oil and Gas Wells. Click here to access written description and additional map tools.
To maximize the reliability of our calculations, this map was created using a custom Albers equal-area projection centered on Pennsylvania. A half-mile buffer around each well type was created, and the resulting layer was clipped to Census tract data. The ratio of the smaller clipped area to the full Census tract area was calculated, and that ratio was then multiplied by the population totals from the 2010 Census to obtain our population estimates of the half-mile zone. The area in the study area is larger than six states, while the calculated population is larger than that of eight states.
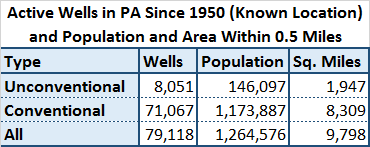
Fig. 2. Number of people in PA near oil and gas wells (79,118 active wells for which location data are available). Note that some regions are with a half-mile of both conventional and unconventional wells.
The county most impacted, in terms of area, for unconventional wells is Bradford, with 353 square miles (See Figure 2). Washington County had the most people living in the zone, however, with 20,566. For conventional wells, the drilling landscape is the largest in Indiana County, affecting 761 square miles, while Erie County has the most people in the half-mile zone, with 212,900. When considering all wells together, the numbers are almost identical to conventional wells. Indiana County leads with 762 square miles, while the drill zone in Erie County represents 211,903 people, or 76% of the county’s population in 2010.
https://www.fractracker.org/a5ej20sjfwe/wp-content/uploads/2014/10/PA-Wells-Feature.png400900Matt Kelso, BAhttps://www.fractracker.org/a5ej20sjfwe/wp-content/uploads/2025/09/2025-Wordmark-Logo.pngMatt Kelso, BA2014-10-30 11:23:432020-07-21 10:34:06Over 1.2 Million Pennsylvanians Within 1/2 Mile of a Well