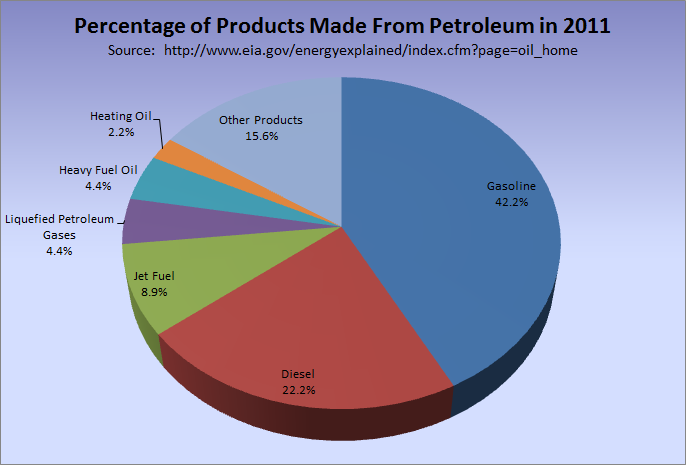
Unconventional Permits Declining Sharply in PA
Following shale gas trends in the media can be a confusing task. One article, entitled Shale gas boom lifts W.Va. construction industry, discusses the positive impact that the gas industry has had on the construction industry in recent years. But it also includes the following quote:
“In 2011, there was so much demand and so much work and we participated in that. Now that demand has been somewhat faded and we need to move on,” said John Strickland, president of Maynard C. Smith Construction of Charleston. “Last year it just seemed like there was a lot of work to bid … the double edge sword was the work dried up.”
That makes it seem like the headline is more appropriate for 2011 than 2012.
And in a recent AP article titled Marcellus Shale becoming top US natural gas field, the authors discuss the explosion of the Marcellus Shale in recent years in comparison to declines in other prominent shale gas plays, such as the Haynesville. They note:
For now, it looks like the Marcellus region will be in the top production spot for several years, analysts say. While drilling has slowed, there were still 288 new well permits issued in May, and over 1,200 for the first five months of the year, according to data from LCI Energy Insight, an El Paso firm that tracks national energy trends.
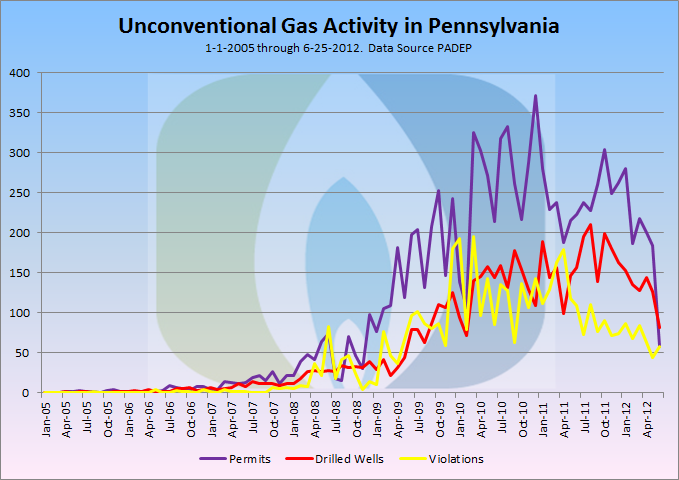
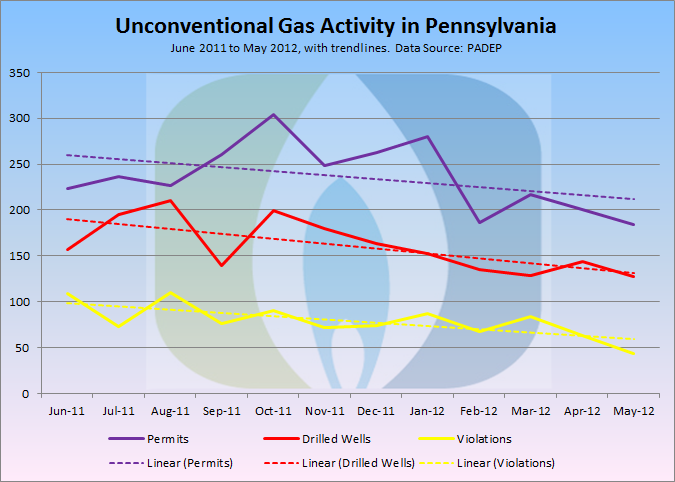
I found this curious for two reasons. First of all, the PADEP only issues production reports twice a year, and the report for the first half of 2012 has not yet been released, making the timing of claim for the top spot in production somewhat dubious. On the other hand, permit data is issued nightly, and yet, the August 5 article chose to cite permit data from May. Knowing that unconventional activity has declined in recent months, that got me wanting to take a closer look. Here are the total number of permits issued for unconventional wells in Pennsylvania for the first seven months of 2012 (including permits for new wells as well as re-drills):
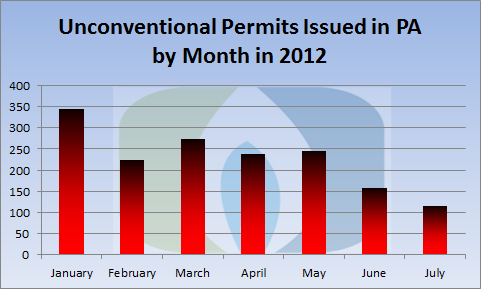
There were 229 fewer unconventional permits issued in Pennsylvania during July than there were in January, a difference of almost twice the number of July permits. In May, the month used in the quote above, there were 246 permits issued in Pennsylvania (the other 42 were presumably from West Virginia). Two months later, there were 130 fewer permits issued.
Here is what the data look like county by county. For any of the following maps, you can hide the overlaying menus by clicking on the gray compass rose and the double carat (^) tabs, and find out more information about each county by clicking on the blue “i” tool then the county of interest.
Unconventional permits issued in PA by county: January, 2012
Unconventional permits issued in PA by county: July, 2012
These first two maps are drawn with the same numeric scheme, even though no county reached either of the highest two categories in July.
Difference in unconventional permits issued in PA by county: July 2012 totals minus January 2012 totals
The color scheme here is designed to represent symmetry from zero, however the actual distribution is quite skewed. The biggest loss in permits from January to July was Bradford County with 62, while the biggest gain was 5 permits, seen in both Greene and Somerset Counties.