The Falcon Public Monitoring Project
Part of the Falcon Public EIA Project
In March of 2019, two and a half years after Shell Pipeline Co. announced plans for the Falcon Ethane Pipeline System, the imported pipes arrived at the Port of Philadelphia. As tree clearing and construction begins, we share frustration with residents that the project is underway while many of our concerns remain unaddressed.
Between 2010 and 2018, over 280 pipeline incidents were reported in Ohio, West Virginia, and Pennsylvania (the three states the Falcon crosses). Of those incidents, 70 were fires and/or explosions. As regulatory agencies and operators fail to protect the public, communities are taking the reins.
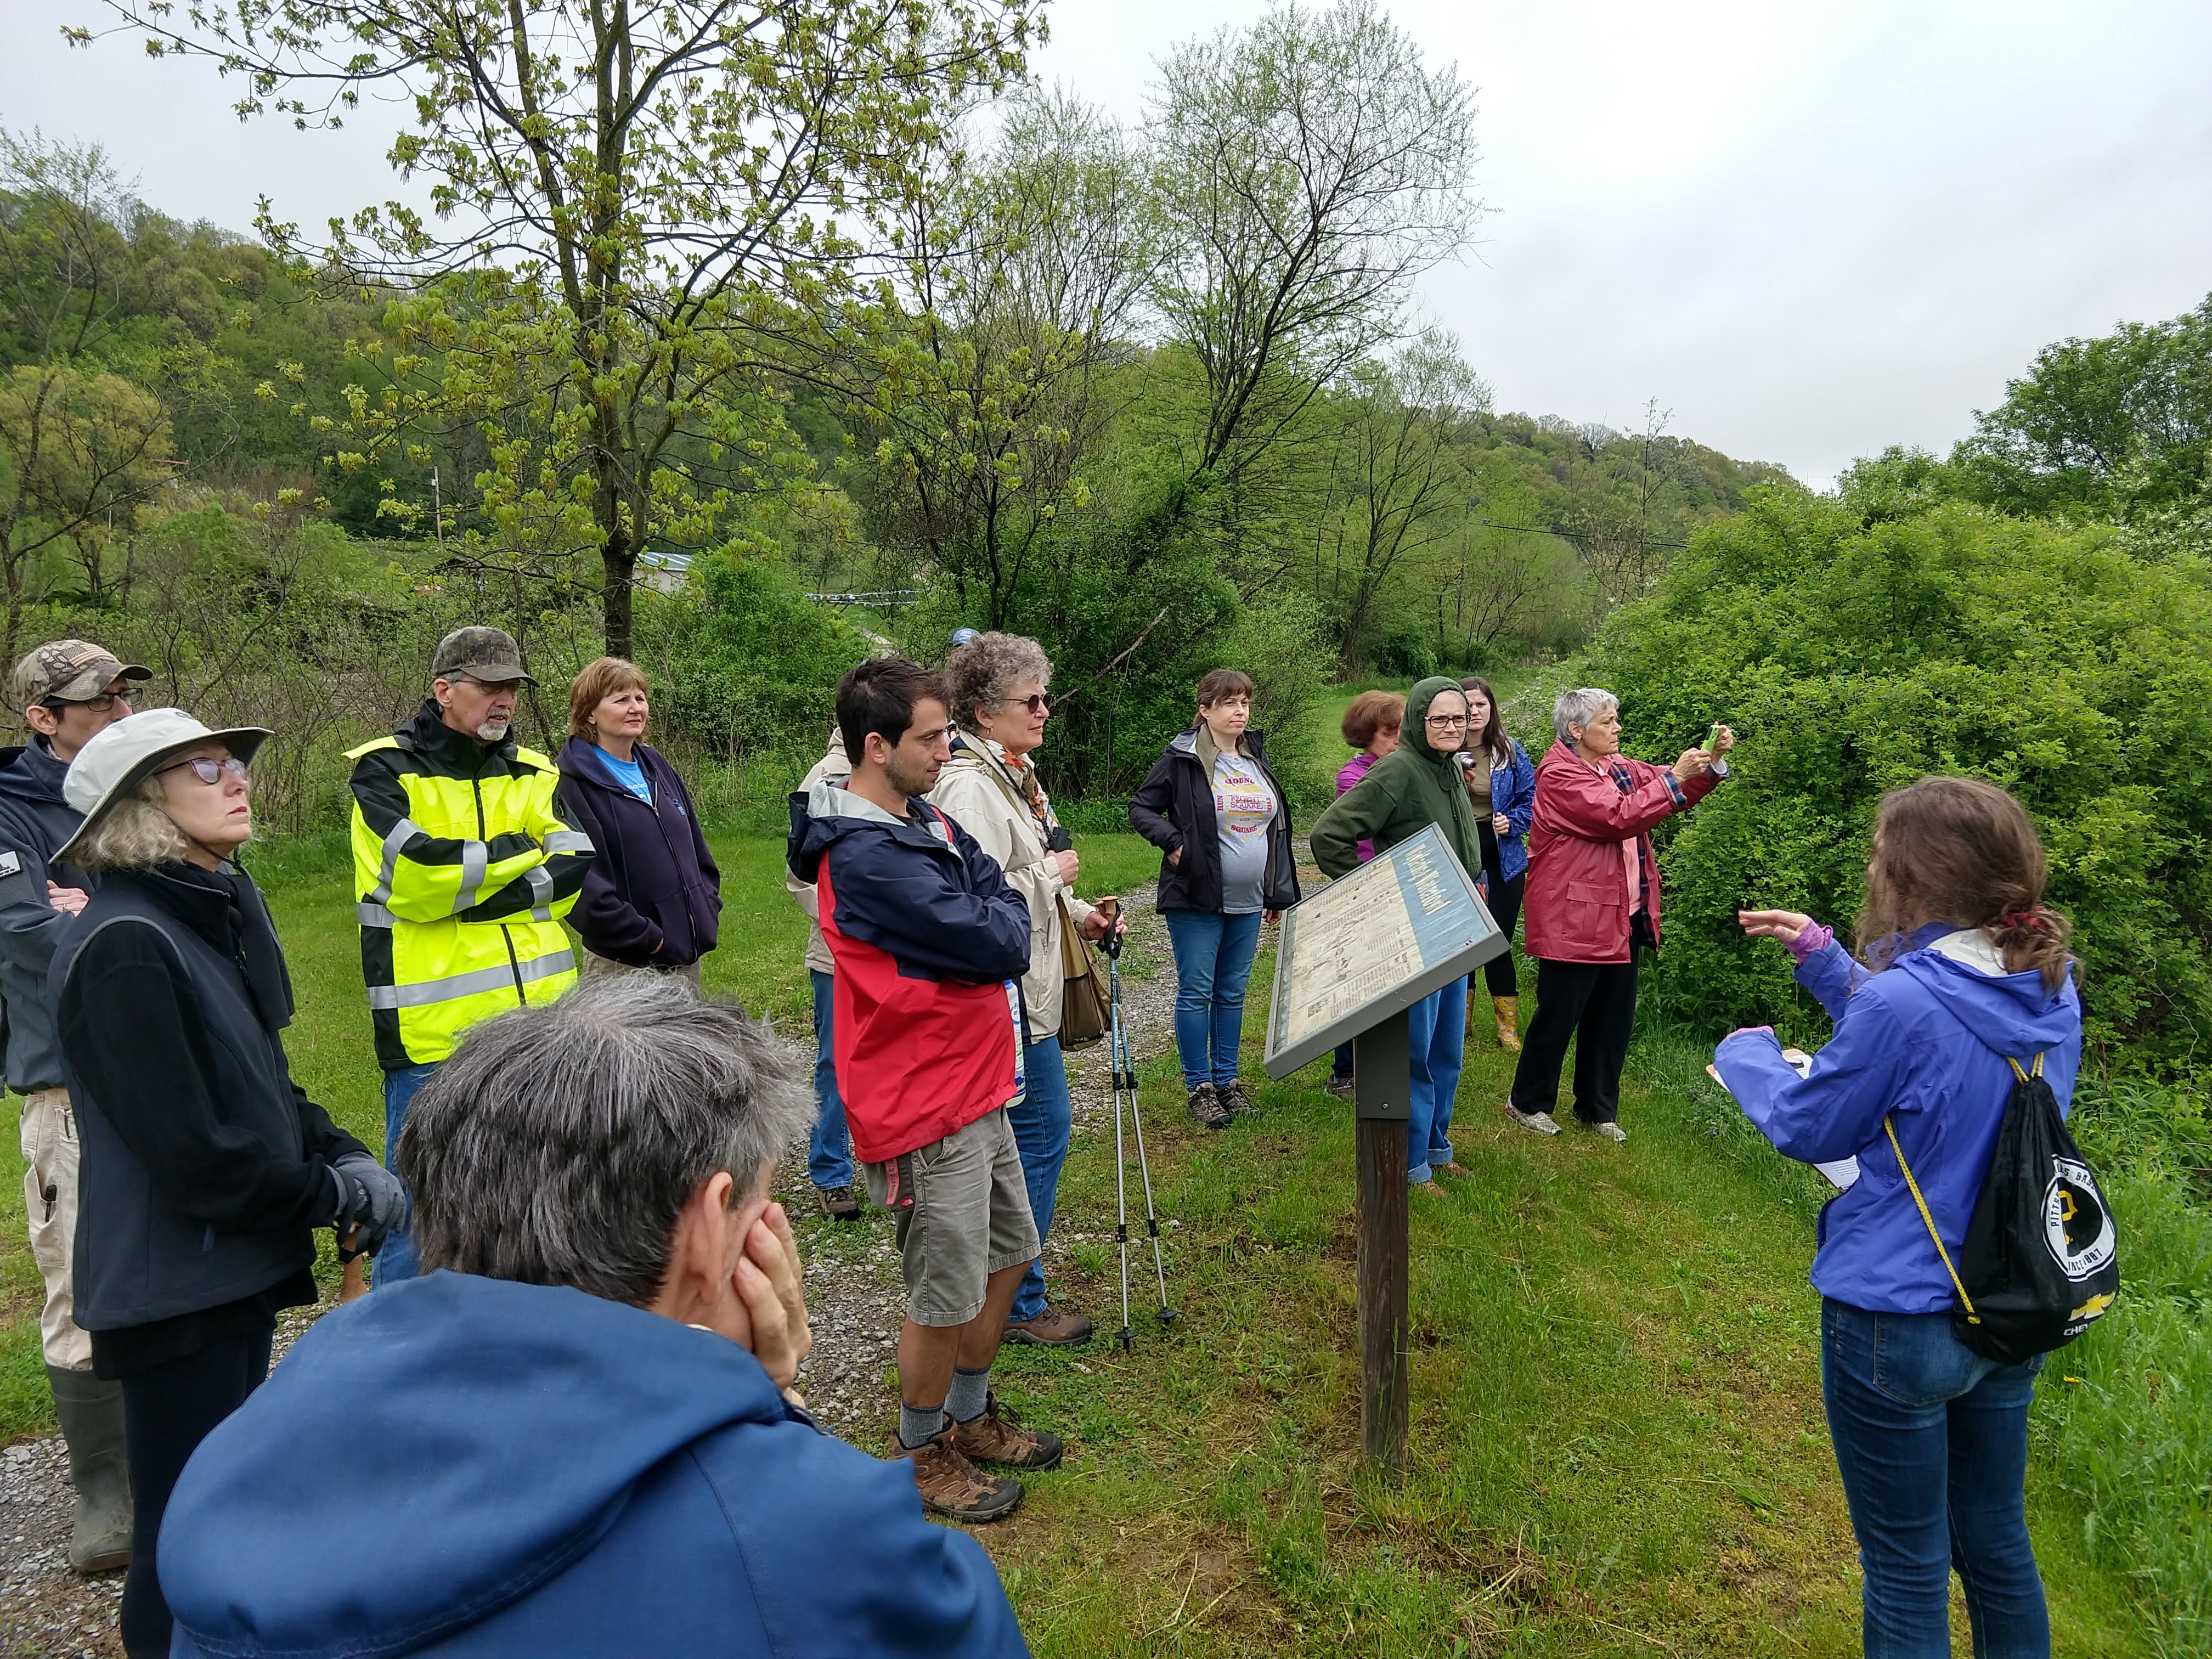
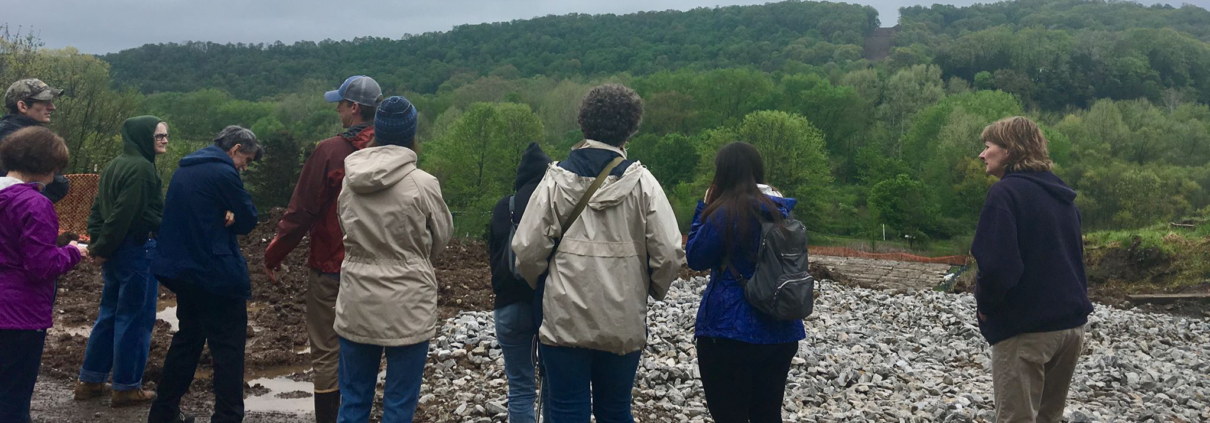
Residents of southwest PA gather along the Falcon route
Environmental organizations are training the public to spot construction violations and appealing inadequate pipeline permits. Impacted residents are running for office, testifying in court, and even spending time in prison to protect their communities.
These grassroots efforts are contributing to a shift in public perception about the safety and need of pipelines. In some cases, including with the Northeast Energy Direct Pipeline and the Constitution Pipeline, organizing efforts are helping stop projects before they begin.
We invite all residents along the Falcon route to get involved in ongoing efforts to monitor construction. Below, you’ll find a guide to reporting violations as well as high-risk areas along the Falcon route that require close monitoring.
Be a citizen watchdog
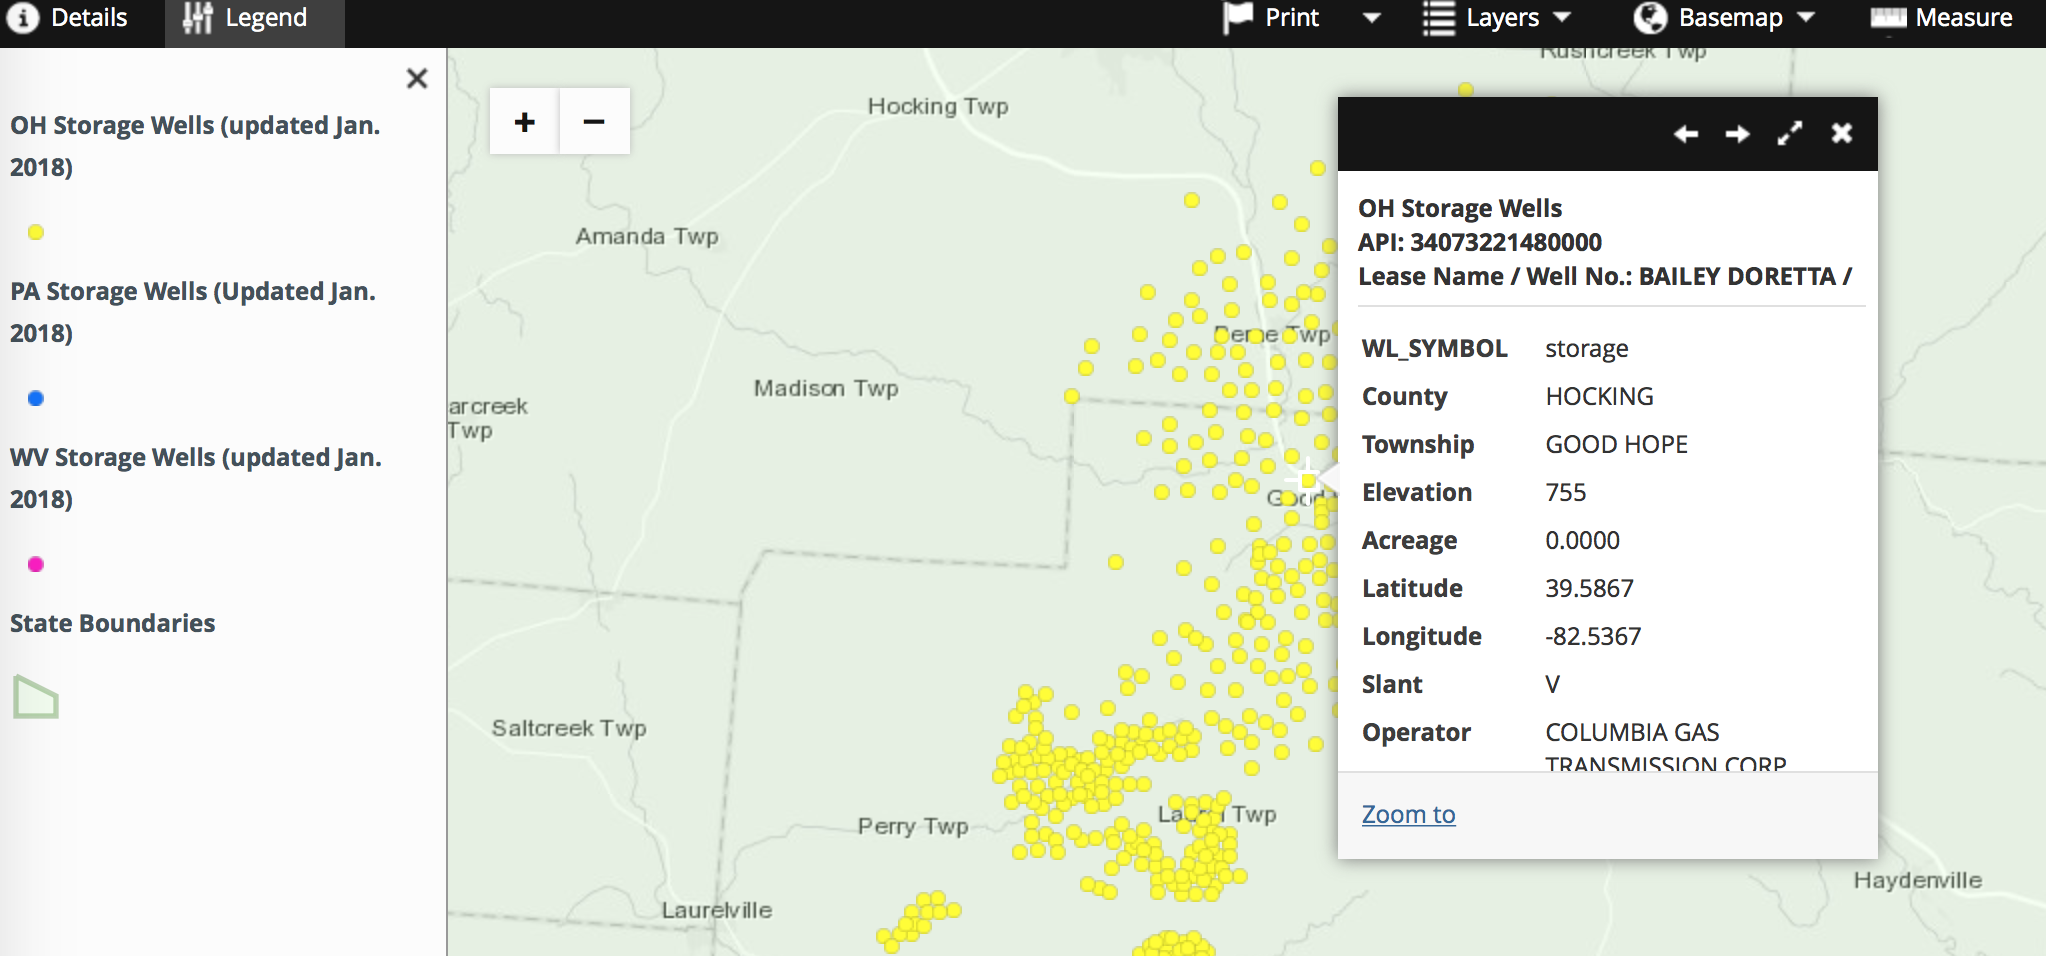
![]() Taking photos of pipeline development and recording your observations is a great way to monitor impacts. One tool to use while monitoring is the FracTracker mobile app (search “FracTracker” in the App Store or Google Play to download for free). The app allows the public to submit geolocated photos and descriptions of development, such as pipelines and wells, and concerns, such as spills and noise pollution. These reports help FracTracker crowdsource data and alert us to concerns that need follow up action. The app also contains a map of wells, pipelines, and compressor stations, including the Falcon pipeline route for reference in the field.
Taking photos of pipeline development and recording your observations is a great way to monitor impacts. One tool to use while monitoring is the FracTracker mobile app (search “FracTracker” in the App Store or Google Play to download for free). The app allows the public to submit geolocated photos and descriptions of development, such as pipelines and wells, and concerns, such as spills and noise pollution. These reports help FracTracker crowdsource data and alert us to concerns that need follow up action. The app also contains a map of wells, pipelines, and compressor stations, including the Falcon pipeline route for reference in the field.
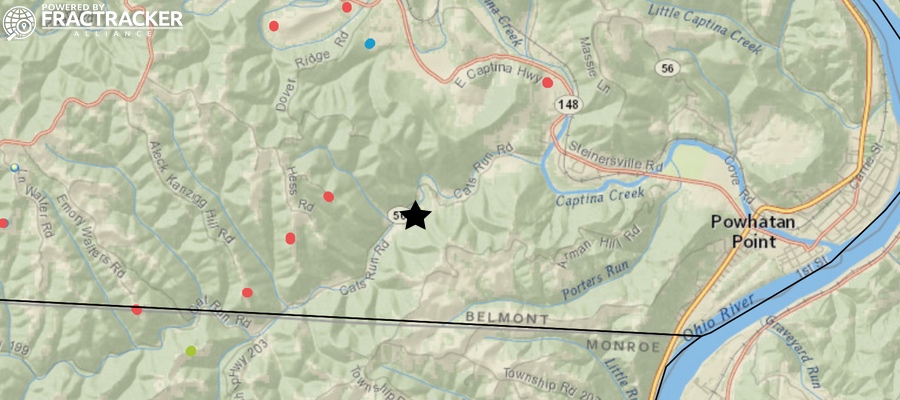
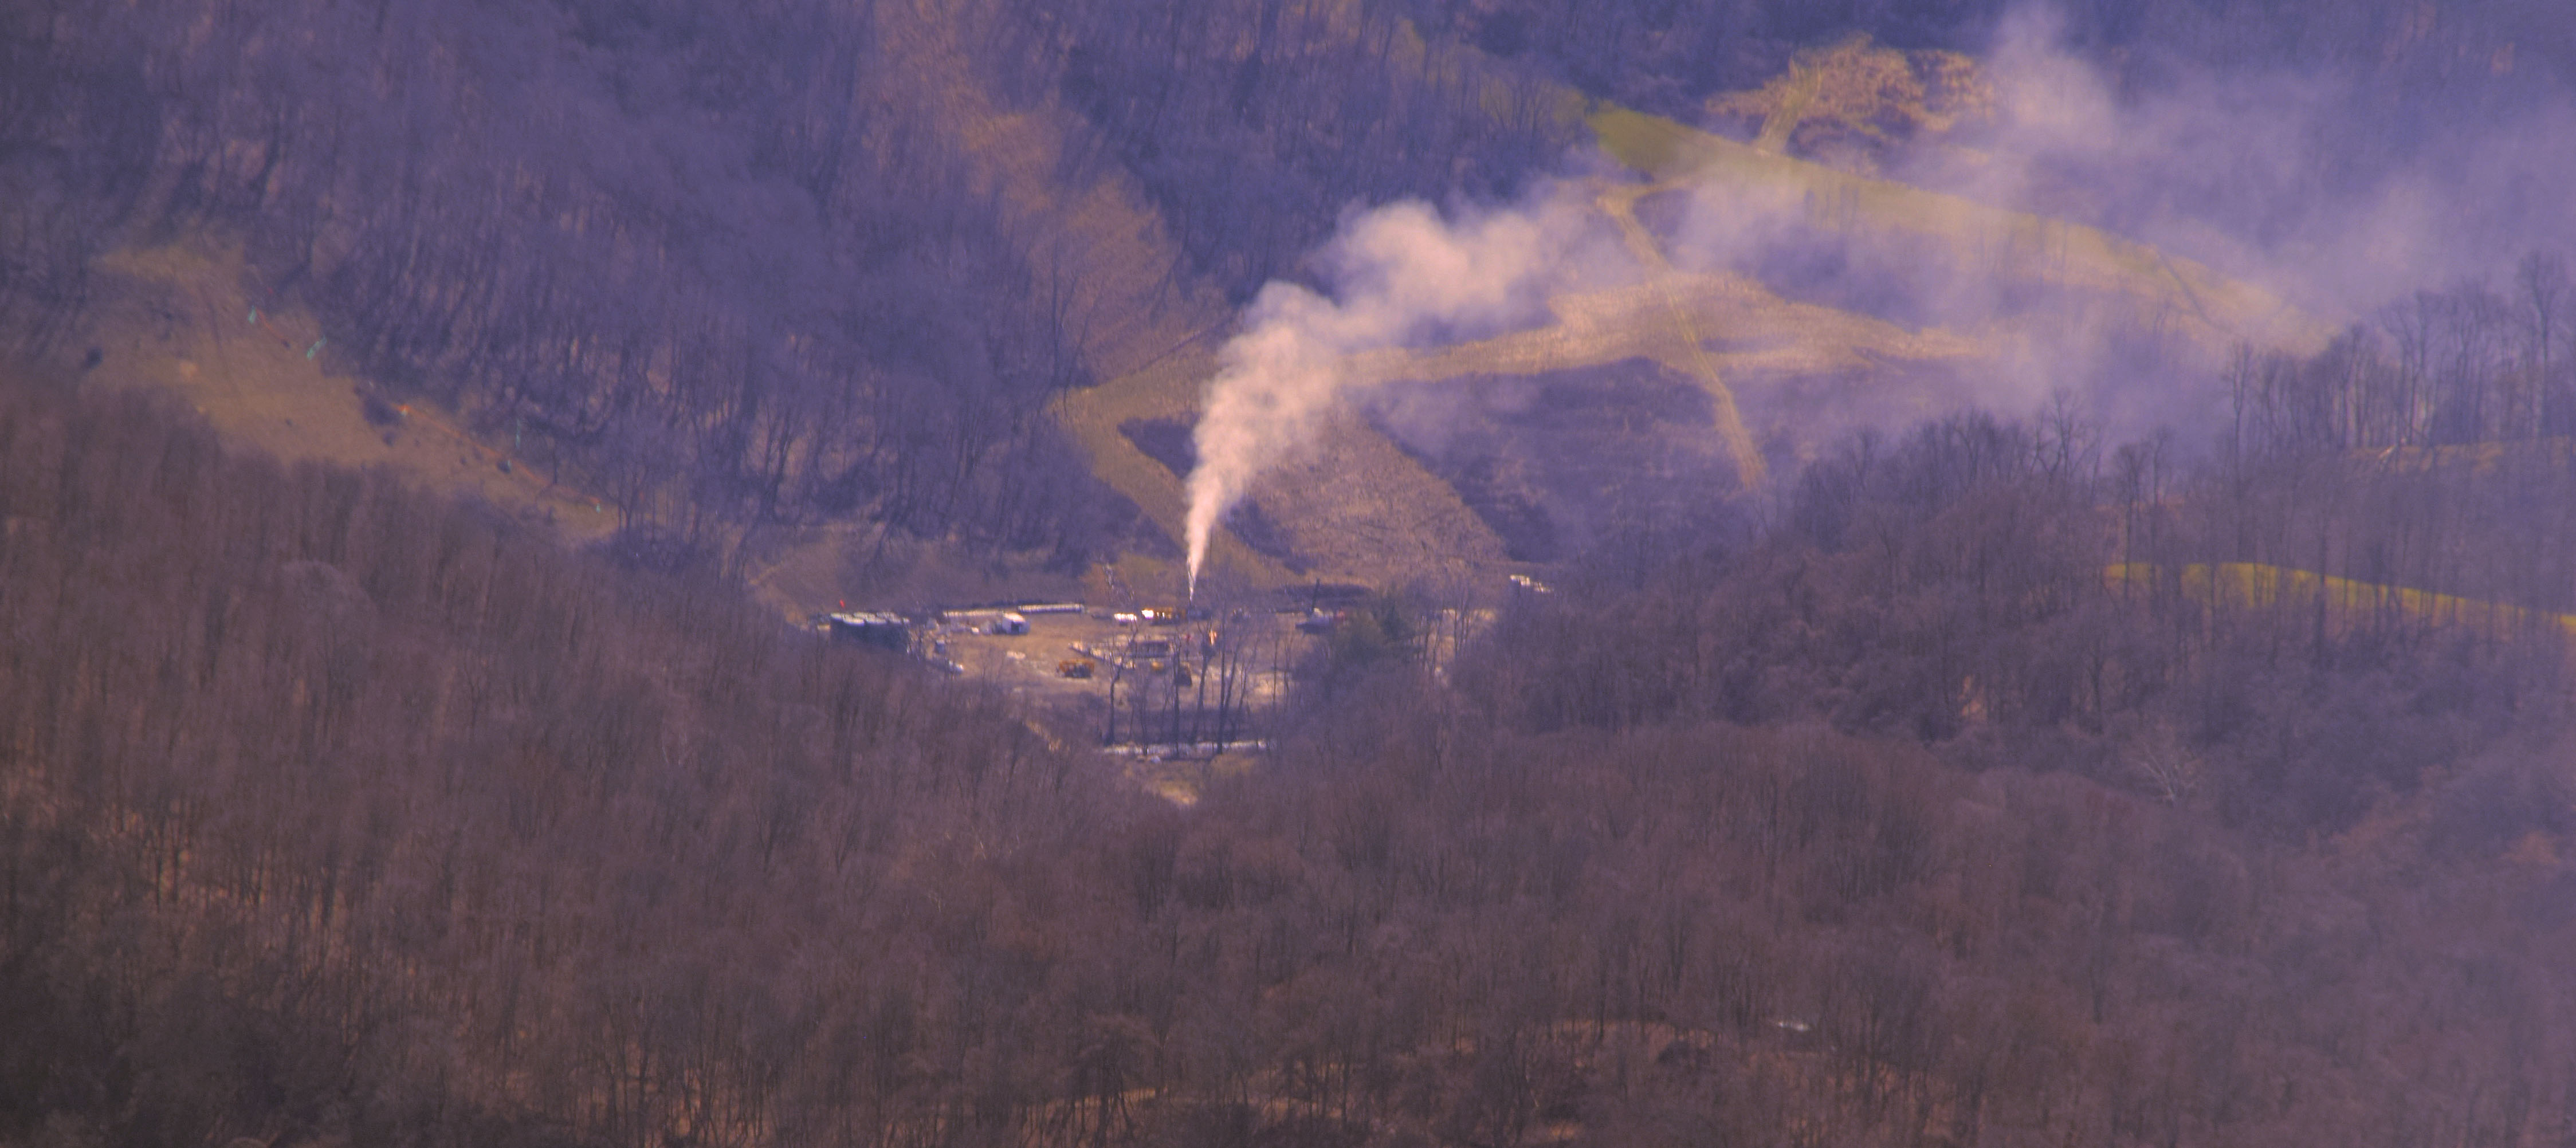
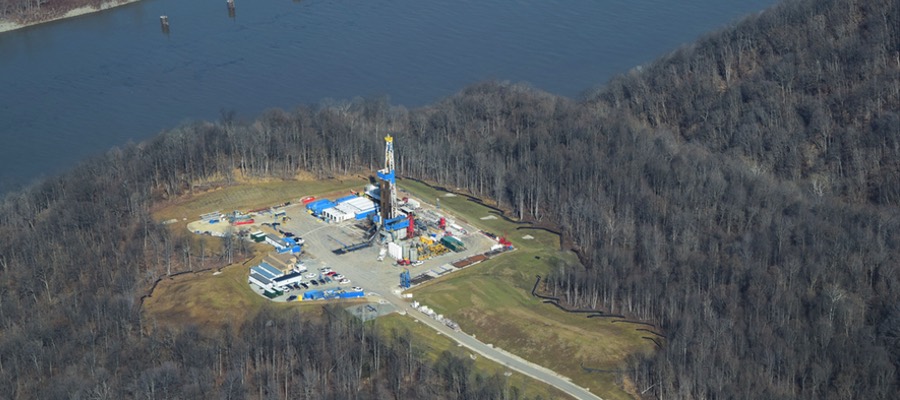
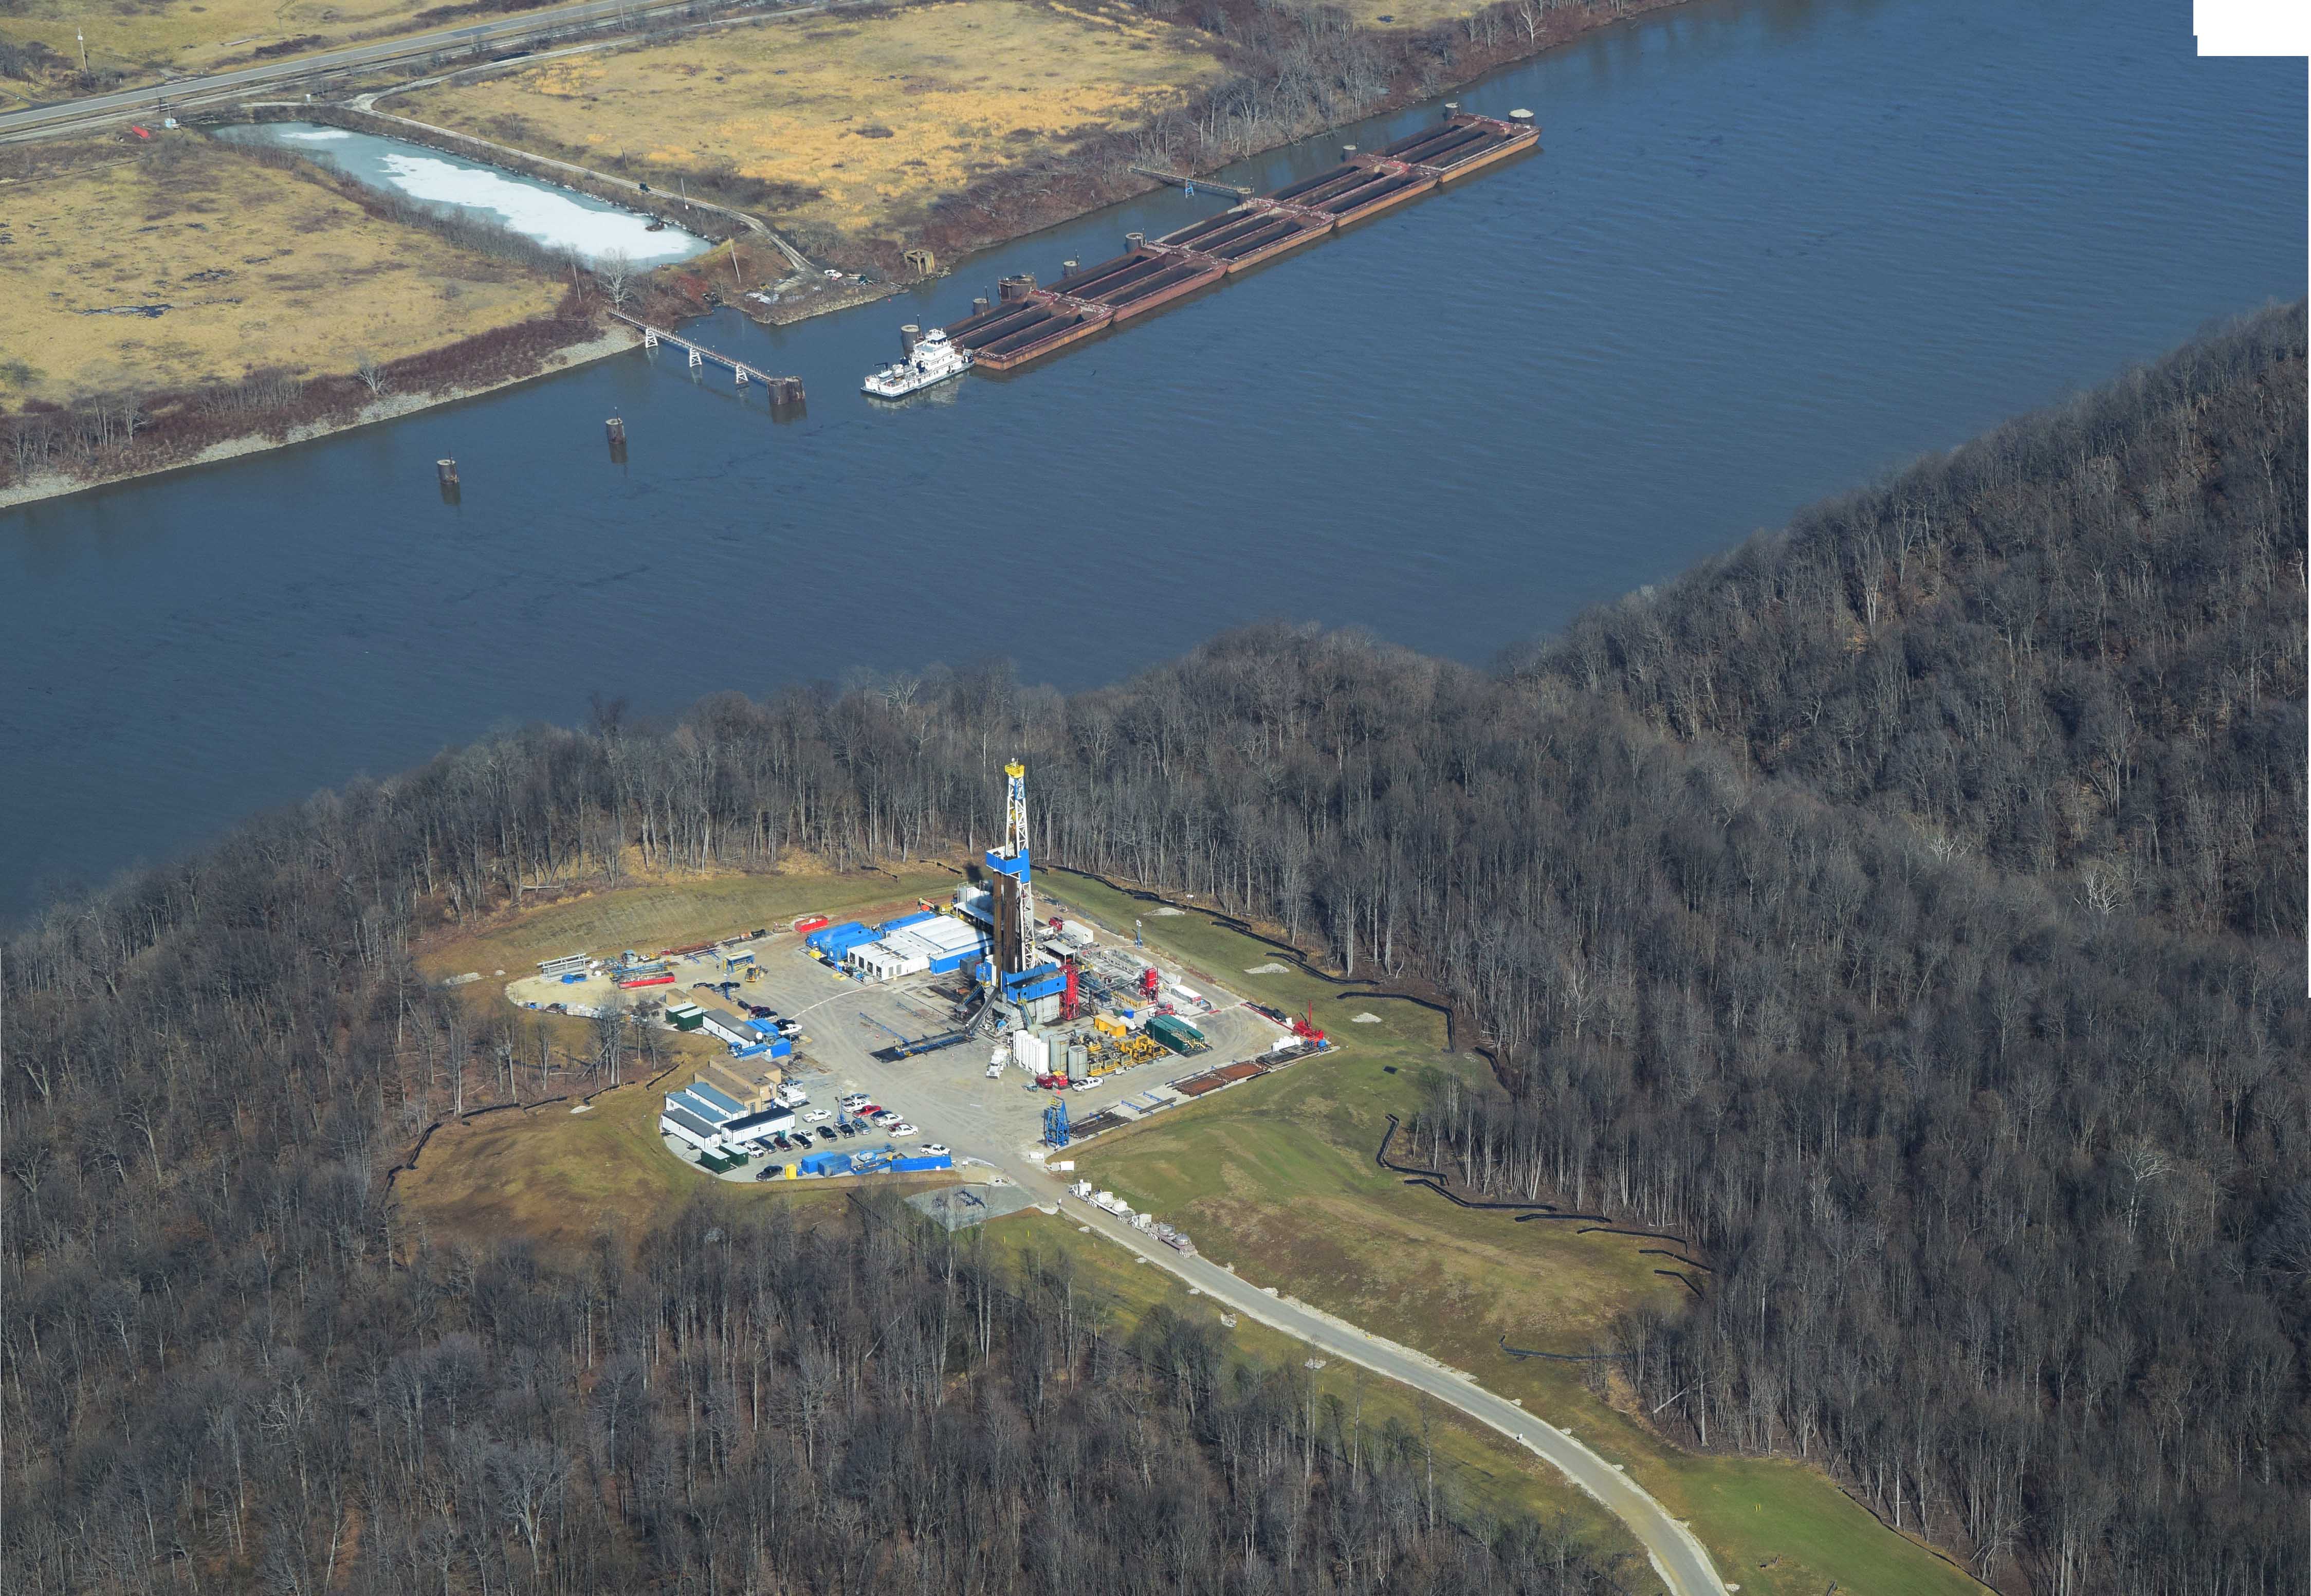
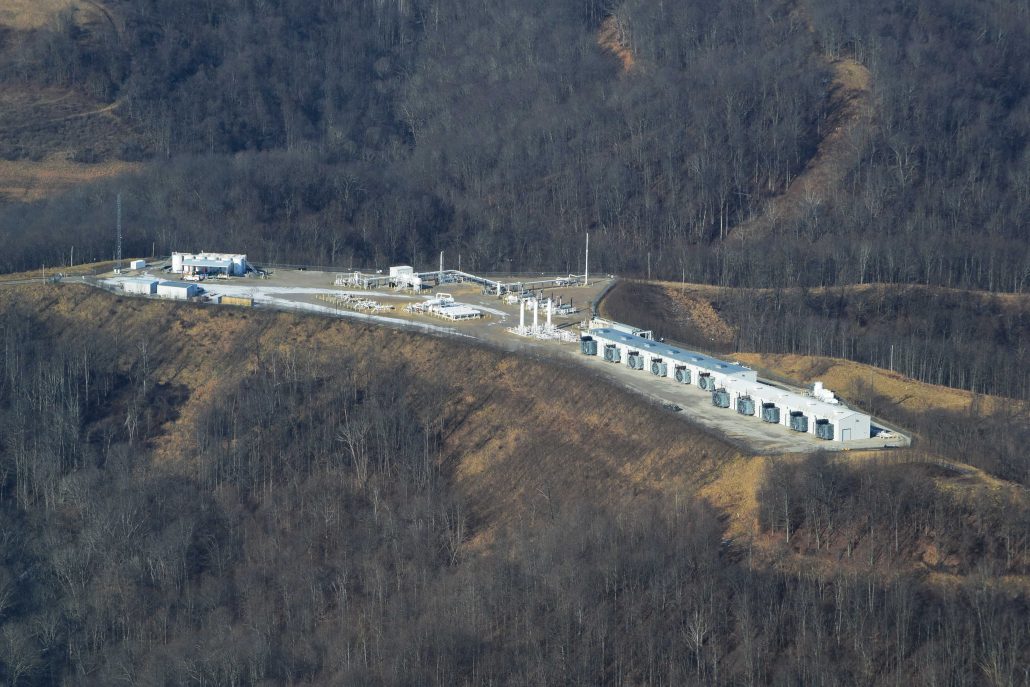
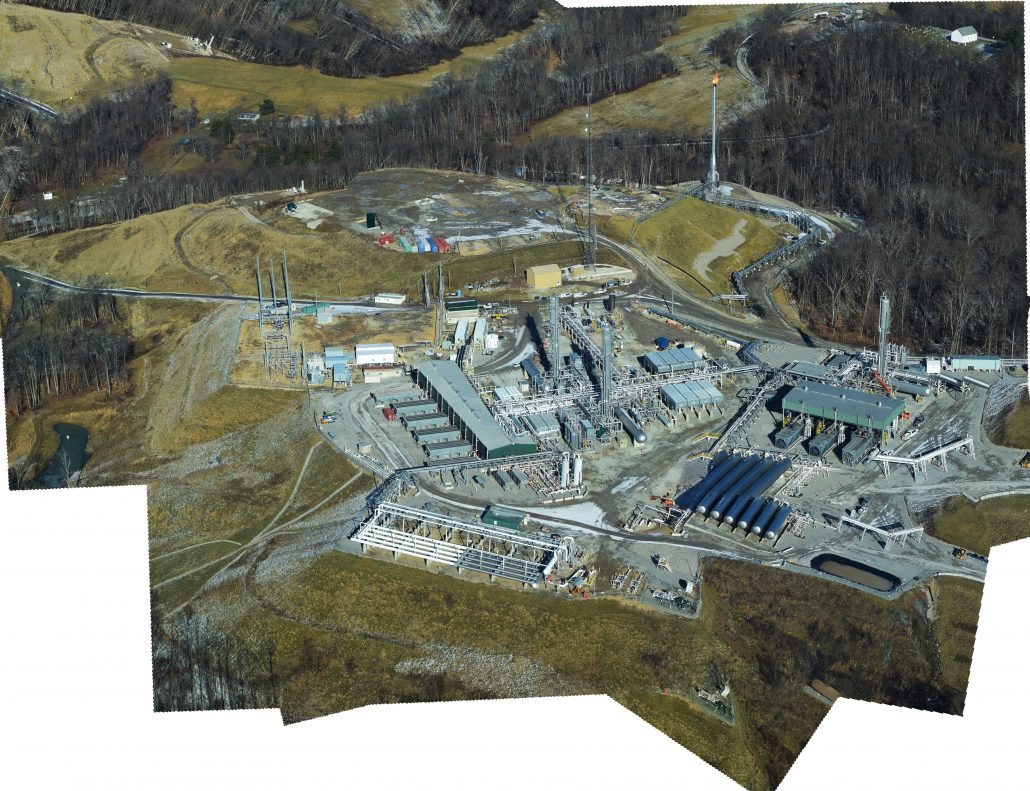
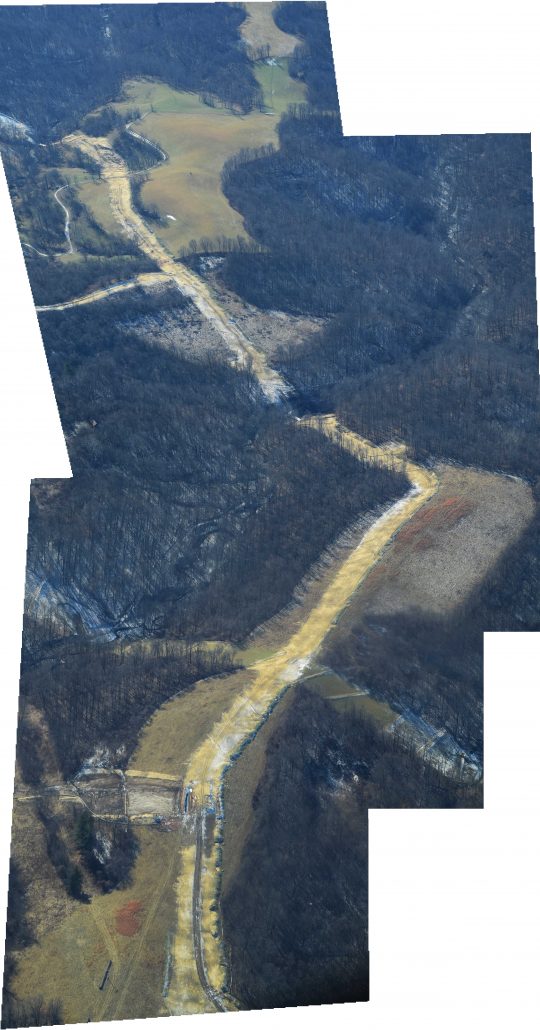
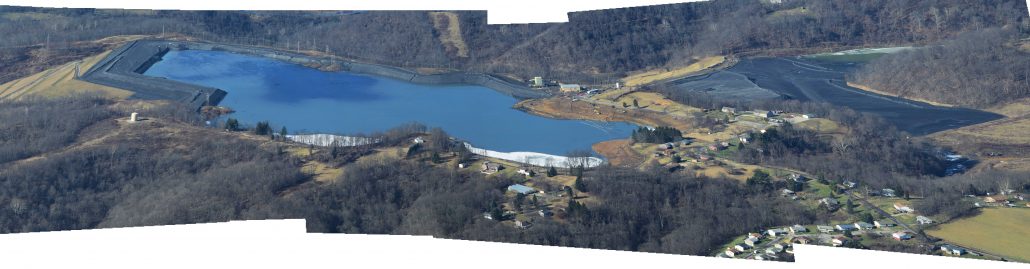
Click on the images below to view app reports of Falcon construction.


Documenting violations
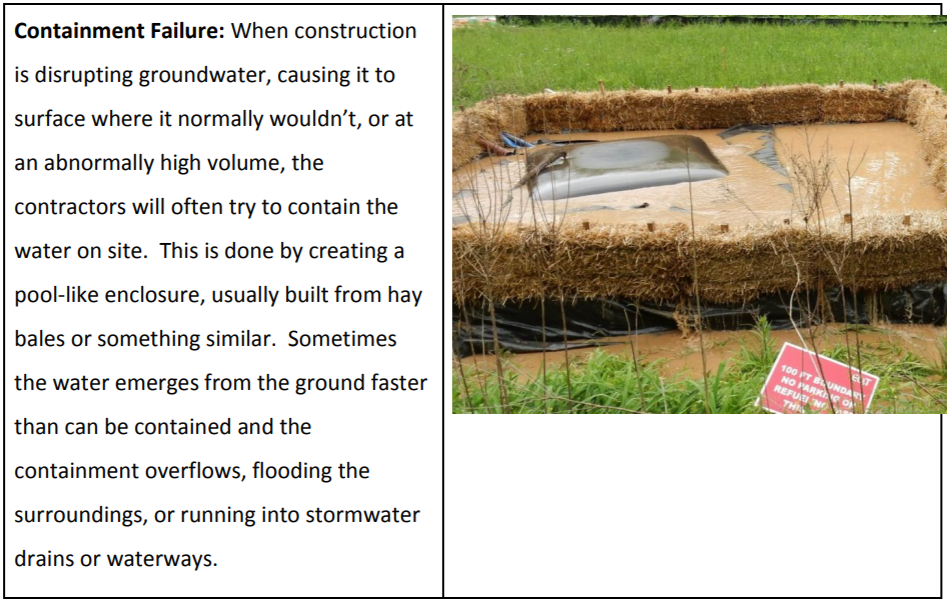
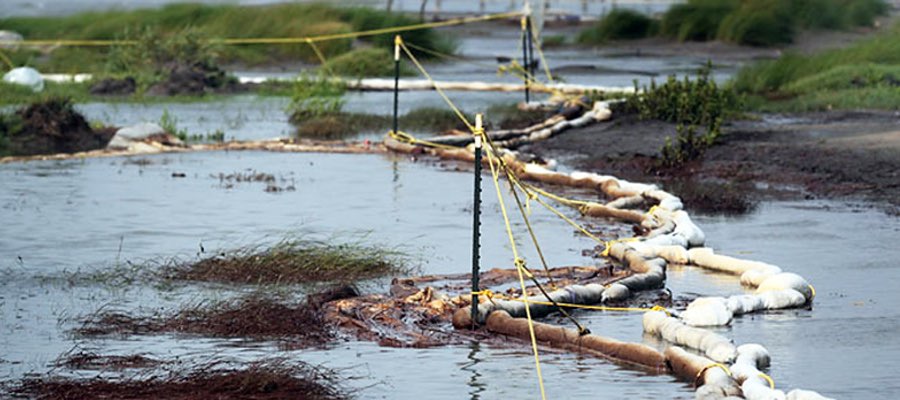
During the construction phase, incidents often occur when companies cause erosion of the ground and release sediment, equipment, or discharge into waterways. Mountain Watershed Association and Clean Air Council have provided the following information on the process of looking for and documenting violations.
Step 1) Document baseline conditions. Documenting the pre-construction status of an area is crucial for understanding how it’s been impacted down the road. Document baseline conditions by taking photos, videos, and notes at different sites, and include the location and date on these materials (the Fractracker app does this for you automatically). Observing sites at different times and in different weather (such as during or after a storm) will give you the best data.
Step 2) Know what to look for. Below are images and descriptions of common construction violations.
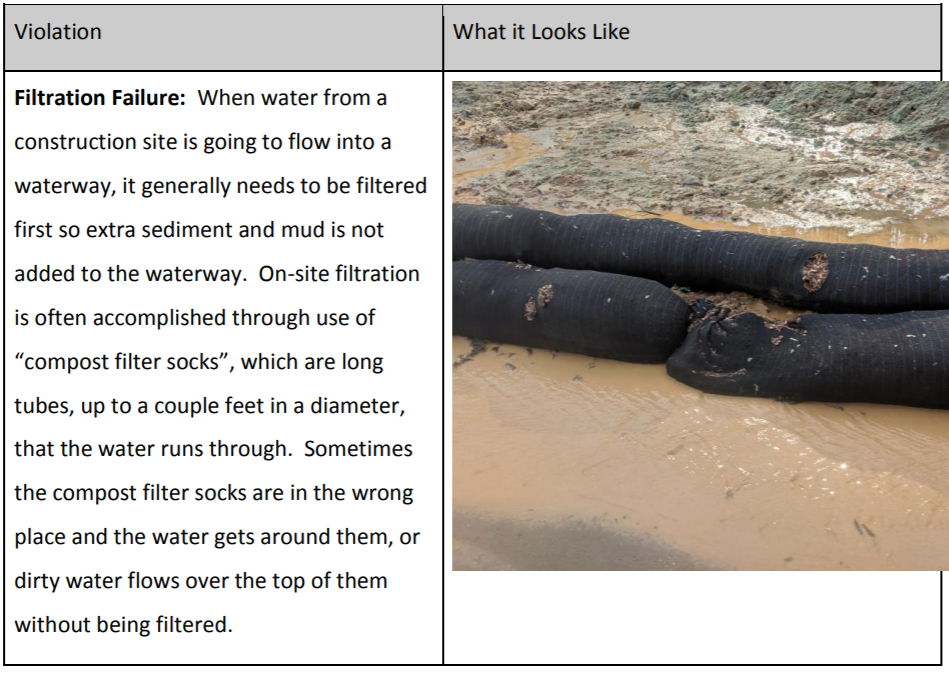
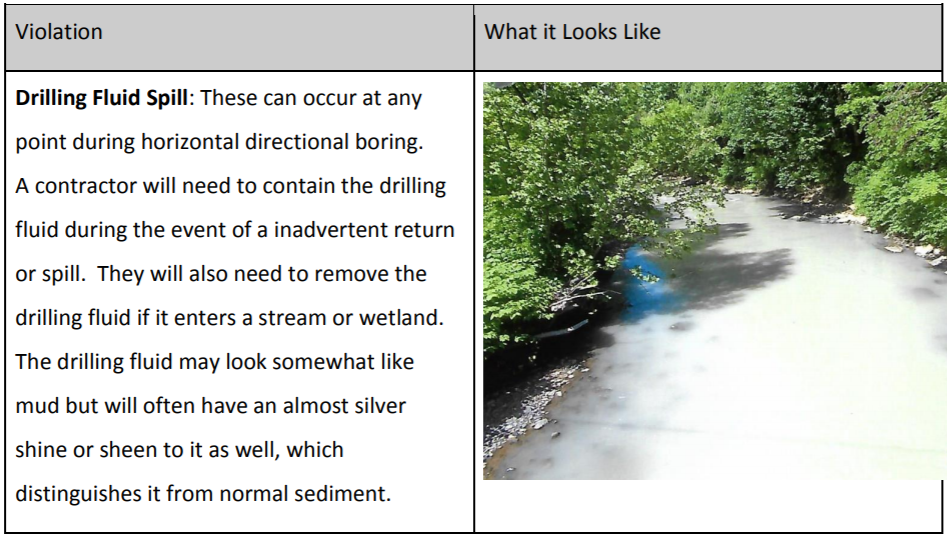
For more violations, checkout Pipeline CSI’s list of Top Ten Observable Non-Compliance Issues.
3) File a Report. File an official complaint to your state environmental regulatory agency.
Your concerns can be sent to regulatory agencies using the following contact information:
- Pennsylvania Department of Environmental Protection Environmental Complaint Form (or call the number listed here)
- Ohio Environmental Protection Agency
- West Virginia Department of Environmental Protection Complaint Form or email: dep.eewebcomplaint@wv.gov
4) Contact support organizations. There are several organizations ready to take action once violations have been confirmed. For confirmed violations in Beaver County, PA, contact Alex Bomstein, at the Clean Air Council (215-567-4004 x118) and for confirmed violations in Allegheny or Washington Counties, PA, contact Melissa Marshall at the Mountain Watershed Association (724-455-4200 x7#). For violations in Ohio or West Virginia, reach out to FracTracker (412-802-0273).
Reports made on the FracTracker App are shared with any app user and the FracTracker team, who look through the reports and contact users for any required follow up. App reports can also be submitted to regulatory agencies electronically. Simply visit the web version of the app, click on your report, and copy the URL (web address) of your report. Then “paste” it into the body of an email or online complaint form. The receiver will see the exact location, date, and any notes or photos you included in the report.
Where should you be monitoring?
Monitoring efforts must be limited to publicly accessible land. In general, areas that are most at-risk for environmental impact include stream and wetland crossings, steep slopes (particularly those near water crossings), flood-prone zones, and areas where storm water runoff will reach waterways. View a map of the Falcon’s water crossings here, and continue reading for more vulnerable locations to monitor.
The information below identifies high-risk areas along the pipeline route where monitoring efforts are extra necessary due to their impacts on drinking water, wetlands, undermined areas, and vulnerable species.
Drinking Water
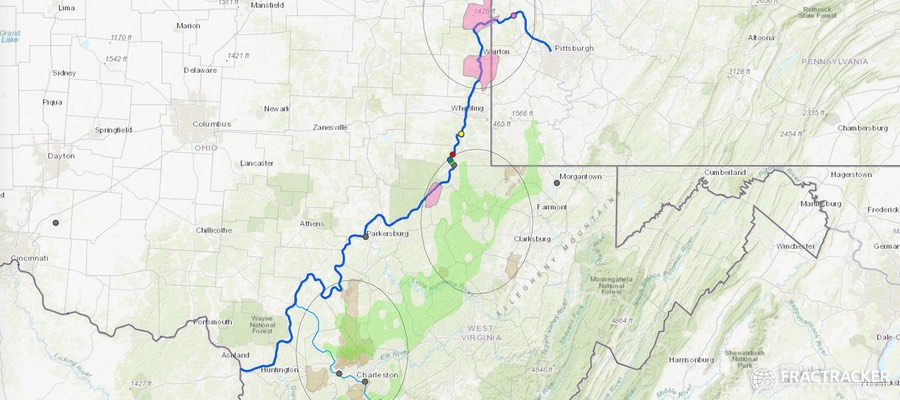
![]() We found 240 private water wells within 1/4 mile of the Falcon.
We found 240 private water wells within 1/4 mile of the Falcon.
While all of these wells should be assessed for their level of risk with pipeline construction, the subset of wells nearest to horizontal directional drilling (HDD) sites deserve particular attention. HDD is a way of constructing a pipeline that doesn’t involve digging a trench. Instead, a directional drilling machine is used to drill horizontally underground and the pipe is pulled through.
While an HDD is designed to avoid surface impacts, if rushed or poorly executed, it can damage surface water, groundwater, and private property. The Mariner East 2 pipeline construction left several families without water after construction crews punctured an aquifer at an HDD site.
Shell’s data highlights 24 wells that are within 1,000 feet of a proposed HDD site.
We’ve isolated the groundwater wells and HDDs in a standalone map for closer inspection below. The 24 most at-risk wells are circled in blue.
View Map Fullscreen | How FracTracker Maps Work
Testing your groundwater quality before construction begins is crucial for determining impacts later on. Two upcoming workshops in Washington County, PA and another in Beaver County, PA will discuss how to protect your water and property.
The Falcon’s HDD locations offer disturbing similarities to what caused the Mariner East pipeline spills. Many of Sunoco’s failures were due to inadequately conducted (or absent) geophysical surveys that failed to identify shallow groundwater tables, which then led to drilling mud entering streams and groundwater.
Figure 1 below shows Greene Township, Beaver County, just south of Hookstown, where the “water table depth” is shown. The groundwater at this HDD site averages 20ft on its western side and only 8ft deep on the eastern side.
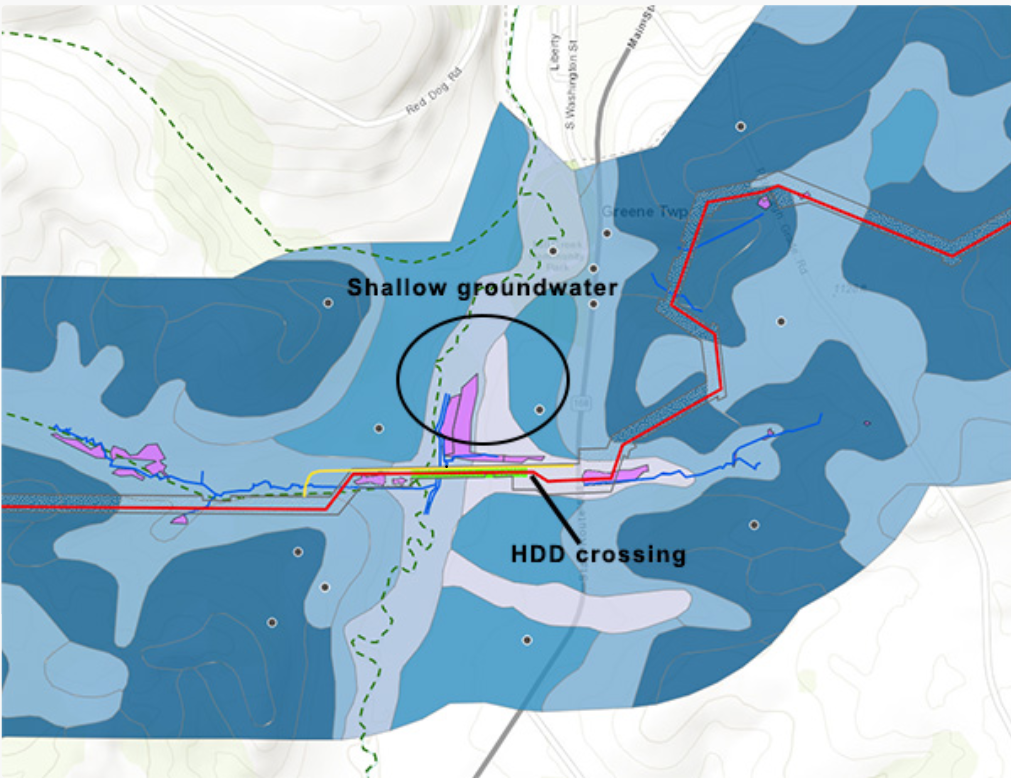
Figure 1. Water table depth in Greene Township
Water Reservoirs
The Falcon also crosses the headwaters of two drinking water reservoirs: the Tappan Reservoir in Harrison County, OH (Figure 2) and the Ambridge Reservoir in Beaver County, PA (Figure 3). The Falcon will also cross the raw water line leading out of the Ambridge Reservoir.
The Ambridge Reservoir supplies water to five townships in Beaver County (Ambridge, Baden, Economy, Harmony, and New Sewickley) and four townships in Allegheny County (Leet, Leetsdale, Bell Acres & Edgeworth). The Tappan Reservoir is the primary drinking water source for residents in Scio.
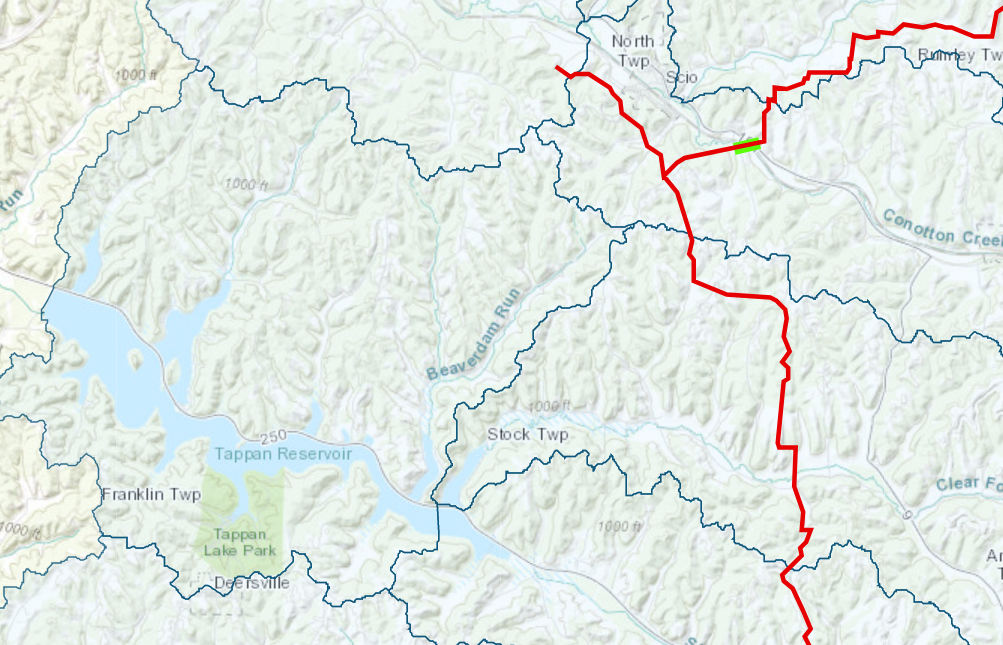
Figure 2. Tappan Reservoir and the Falcon route in Harrison County, Ohio
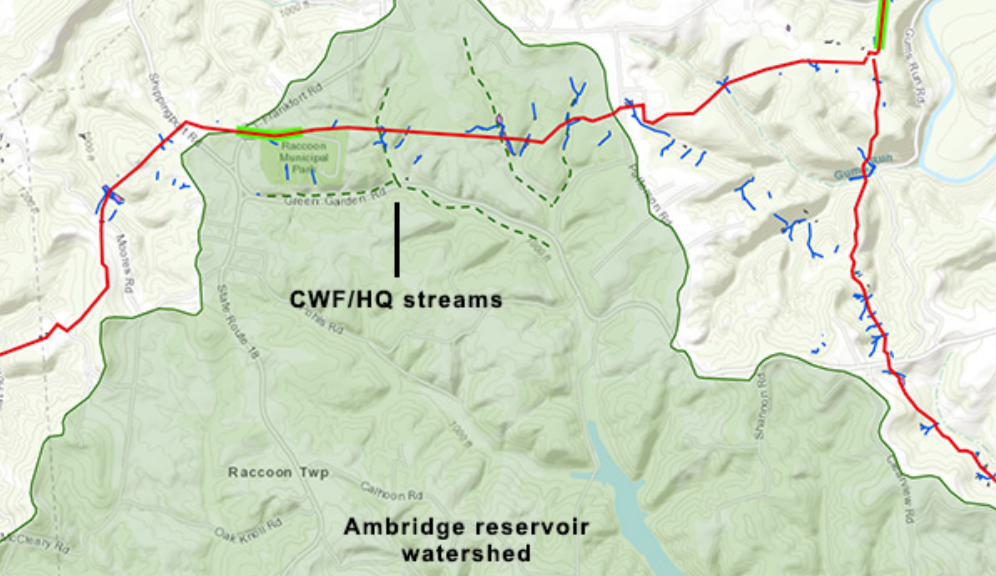
Figure 3. Ambridge Reservoir and the Falcon route in Beaver County, Pennsylvania
Wetlands
Wetlands that drain into Raccoon Creek in Beaver County, PA will be particularly vulnerable in 2 locations. The first is in Potter Township, off of Raccoon Creek Rd just south of Frankfort Rd, where the Falcon will run along a wooded ridge populated by half a dozen perennial and intermittent streams that lead directly to a wetland, seen in Figure 4. Complicating erosion control further, Shell’s survey data shows that this ridge is susceptible to landslides. This area is also characterized by the USGS as having a “high hazard” area for soil erosion.
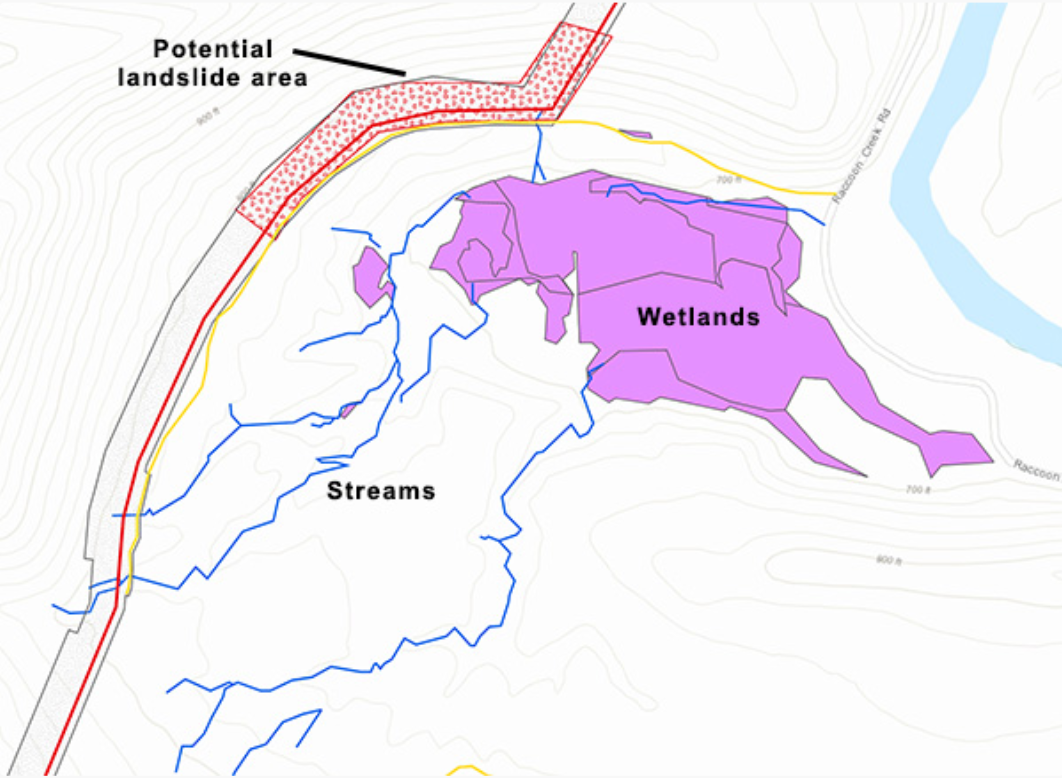
Figure 4. Wetlands and streams in Potter Township, PA
The other wetland area of concern along Raccoon Creek is found in Independence Township at the Beaver County Conservation District (Figure 5). Here, the Falcon will go under the Creek using HDD (highlighted in bright green). Nevertheless, the workspace needed to execute the crossing is within the designated wetland itself. An additional 15 acres of wetland lie only 300ft east of the crossing but are not accounted for in Shell’s data. This unidentified wetland is called Independence Marsh, considered the crown jewel of the Independence Conservancy’s watershed stewardship program.
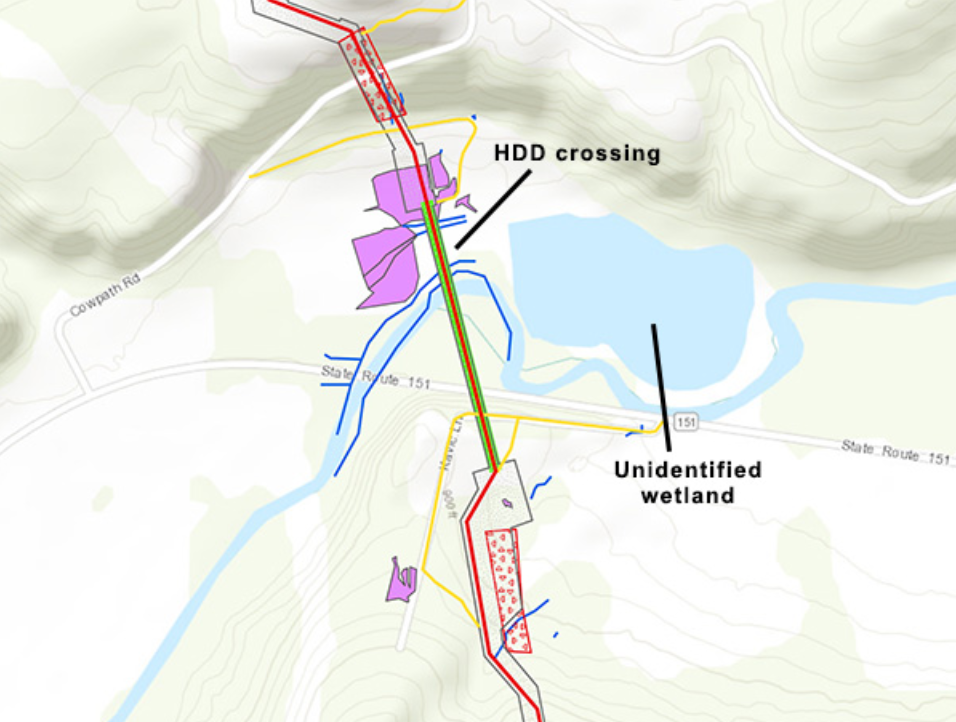
Figure 5. Wetlands and Raccoon Creek in Independence Township, PA
Subsurface concerns
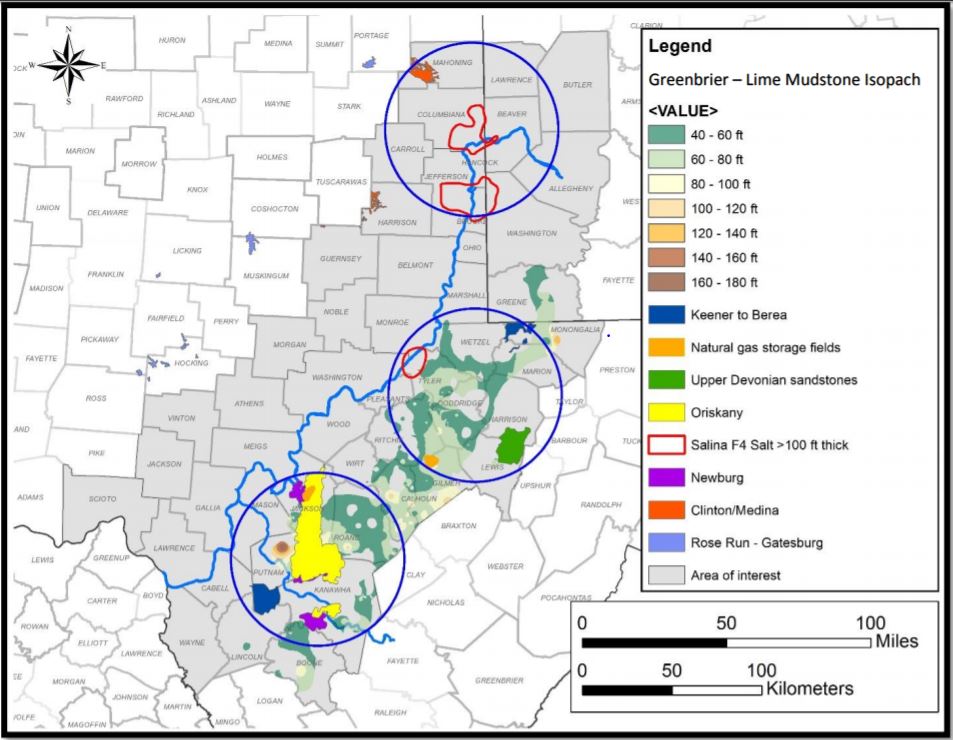
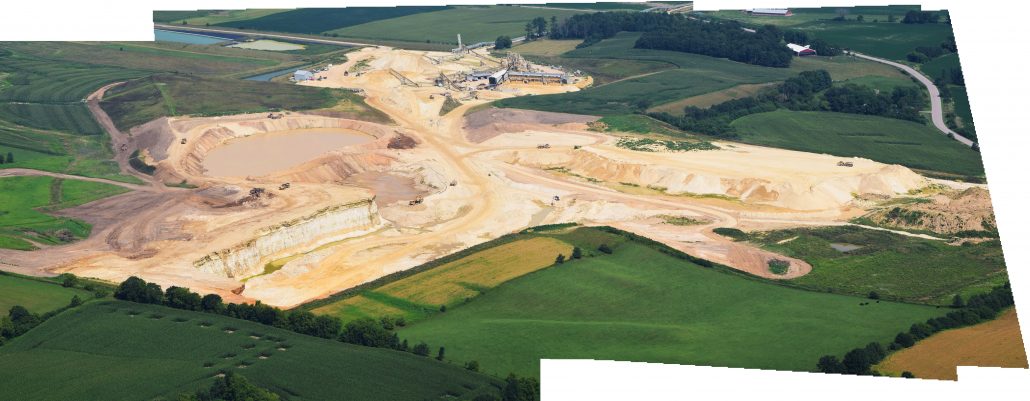
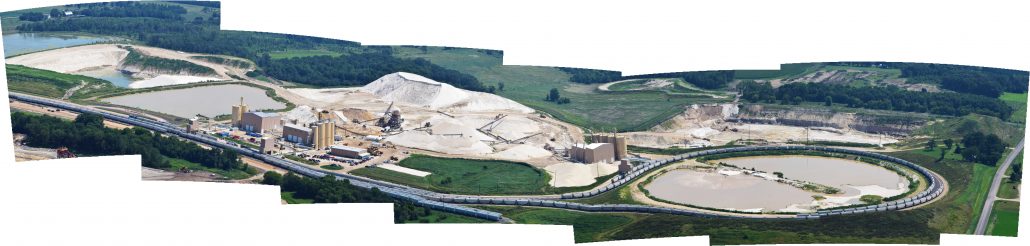
Shell’s analysis shows that 16.8 miles of the Falcon pipeline travel through land that historically has or currently contains coal mines. Our analysis using the same dataset suggests the figure is closer to 20 miles. Construction through undermined areas poses a risk for ground and surface water contamination and subsidence.
Of these 20 miles of undermined pipeline, 5.6 miles run through active coal mines and are located in Cadiz Township, OH (Harrison Mining Co. Nelms Mine, seen in Figure 6); Ross Township, OH (Rosebud Mining Co. Deep Mine 10); and in Greene Township, PA (Rosebud Mining Co. Beaver Valley Mine).
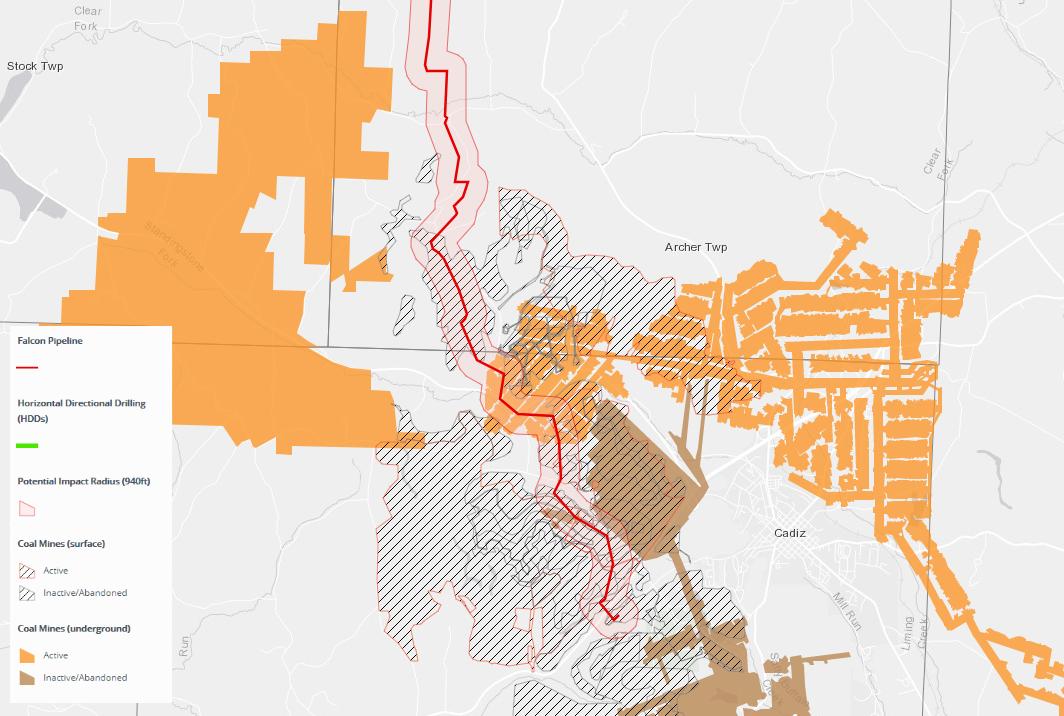
Figure 6. Coal mines and are located in Cadiz Township, OH
For a complete map of mined areas, click here.
More than 25 of the Falcon’s 97 pipeline miles will be laid within karst landscapes, including 9 HDD sites. Karst is characterized by soluble rocks such as limestone prone to sinkholes and underground caves. A cluster of these are located in Allegheny and Washington counties, PA, with extensive historical surface mining operations.
The combination of karst and coal mines along Potato Garden Run, in Figure 7, make this portion of the pipeline route particularly risky. At this HDD site, the Falcon will cross a coal waste site identified in the permits as “Imperial Land Coal Slurry” along with a large wetland.
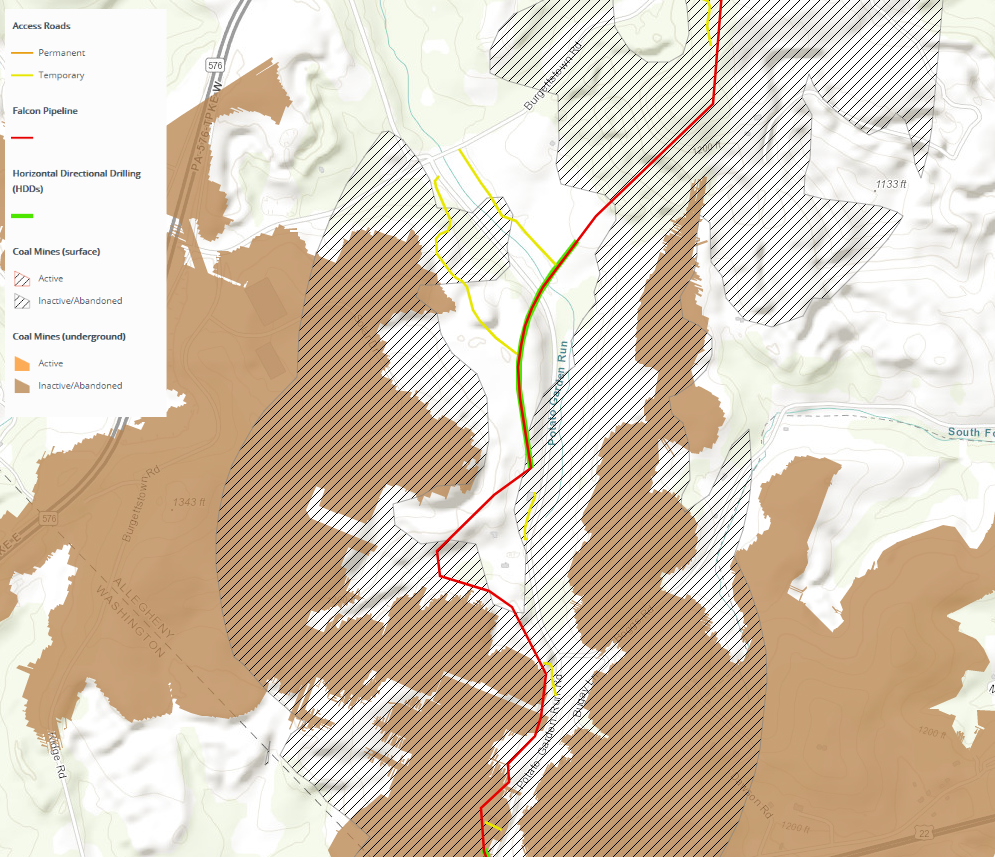
Figure 7. Coal mines in Imperial, Pennsylvania
Vulnerable species
Southern Redbelly Dace
The Southern Redbelly Dace, a threatened species, is especially vulnerable to physical and chemical (turbidity, temperature) changes to their environment. PA Fish and Boat Commission explicitly notes in their correspondence with Shell that “we are concerned about potential impacts to the fish, eggs and the hatching fry from any in-stream work.” Of note is that these sites of concern are located in designated “High Quality/Cold Water Fishes” streams of the Service Creek watershed (Figure 8). PFBC stated that that no in-stream work in these locations should be done between May 1 and July 31.
Figure 8. “High Quality/Cold Water Fishes” streams identified as habitat for the Southern Redbelly Dace
Northern Harriers & Short-Eared Owls
Portions of the Falcon’s workspace are located near 6 areas with known occurrences of Short-eared Owls (PA endangered species) and Northern Harriers (PA threatened species). Pennsylvania Game Commission requested a study of these areas to identify breeding and nesting locations, which were executed from April-July 2016 within a 1,000-foot buffer of the pipeline’s workspace (limited to land cover areas consisting of meadows and pasture). One Short-eared Owl observation and 67 Northern Harrier observations were recorded during the study. PGC’s determined that, “based on the unusually high number of observations at these locations” work should not be done in these areas during harrier breeding season, April 15 through August 31.
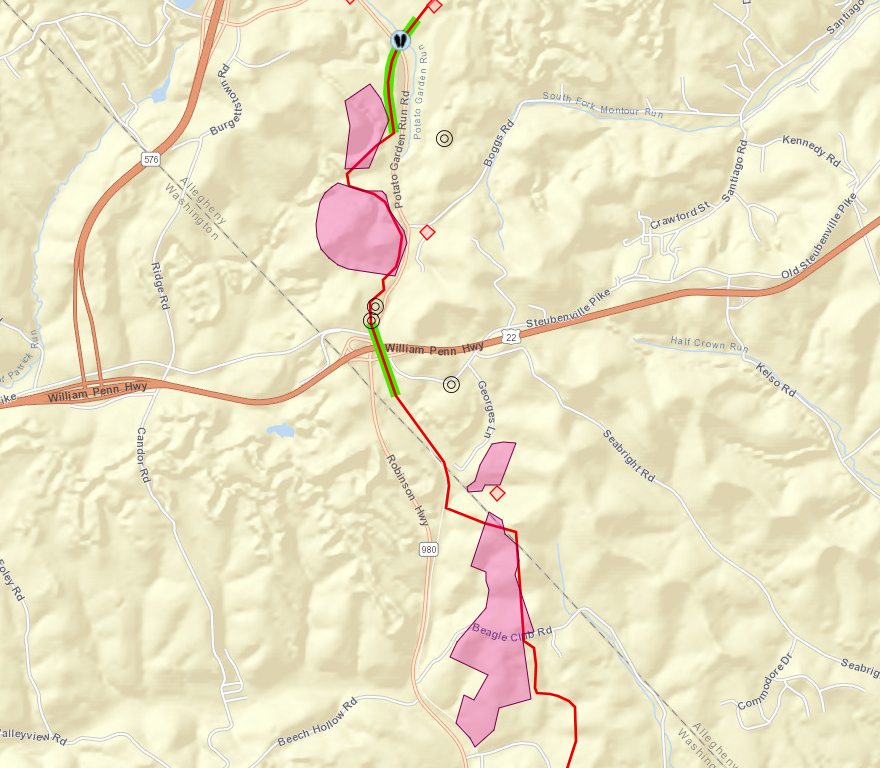
Figure 9. Surveyed areas for Short-eared Owls (PA endangered species) and Northern Harriers (PA threatened species)
Bald Eagles
A known Bald Eagle nest is located in Beaver County. Two potential “alternate nests” are located where the Falcon crosses the Ohio River. National Bald Eagle Management Guidelines bar habitat disturbances that may interfere with the ability of eagles to breed, nest, roost, and forage. The 1 active nest in close proximity to the Falcon, called the Montgomery Dam Nest, is located just west of the pipeline’s terminus at Shell’s ethane cracker facility.
U.S. Fish and Wildlife Service requested that Shell only implement setback buffers for the one active nest at Montgomery Dam (Figure 10). These include no tree clearing within 330 feet, no visible disturbances with 660 feet, and no excessive noise with 1,000 feet of an active nest. Furthermore, Shell must avoid all activities within 660ft of the nest from January 1st to July 31st that may disturb the eagles, including but not limited to “construction, excavation, use of heavy equipment, use of loud equipment or machinery, vegetation clearing, earth disturbance, planting, and landscaping.
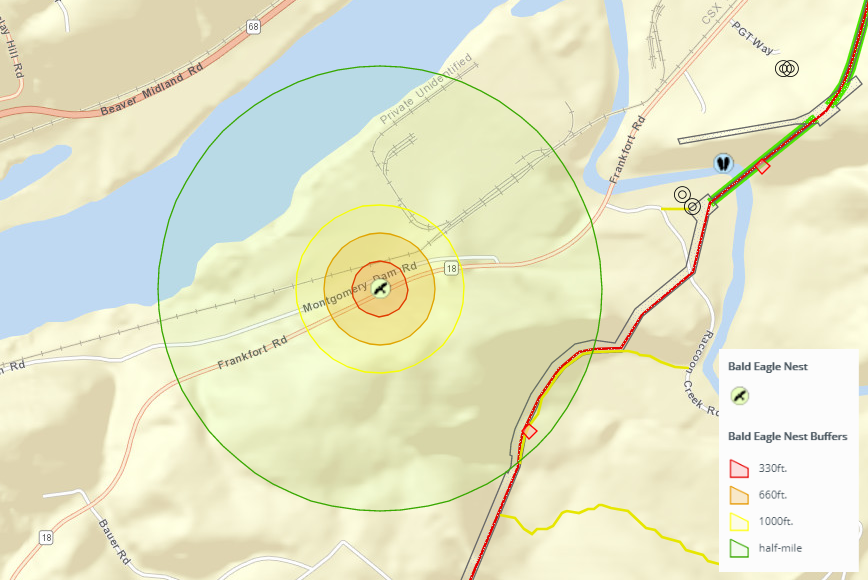
Figure 10. Bald Eagle nest in Potter Township, Pennsylvania
Bats
The Falcon is located within the range of federally protected Indiana Bats and Northern Long-eared Bats in Pennsylvania and West Virginia. In pre-construction surveys, 17 Northern Long-eared Bats were found at 13 of the survey sites, but no Indiana Bats were captured.
A total of 9 Northern Long-eared Bat roost trees were located, with the nearest roost tree located 318 feet from the pipeline’s workspace. Figure 11 below shows a cluster of roost trees in Raccoon Township, PA. For a map of all the roost trees, click here. The U.S. Fish and Wildlife Service stated that “Due to the presence of several Northern Long-eared Bat roost trees within the vicinity of the project footprint (although outside of the 150-foot buffer), we recommend the following voluntary conservation measure: No tree removal between June 1 and July 31.”
The Pennsylvania Game Commission noted in early correspondences that Silver-haired Bats may be in the region (a PA species of special concern). PGC did not require a further study for the species, but did request a more restrictive conservation of no tree clearing between April 1 and October 31.
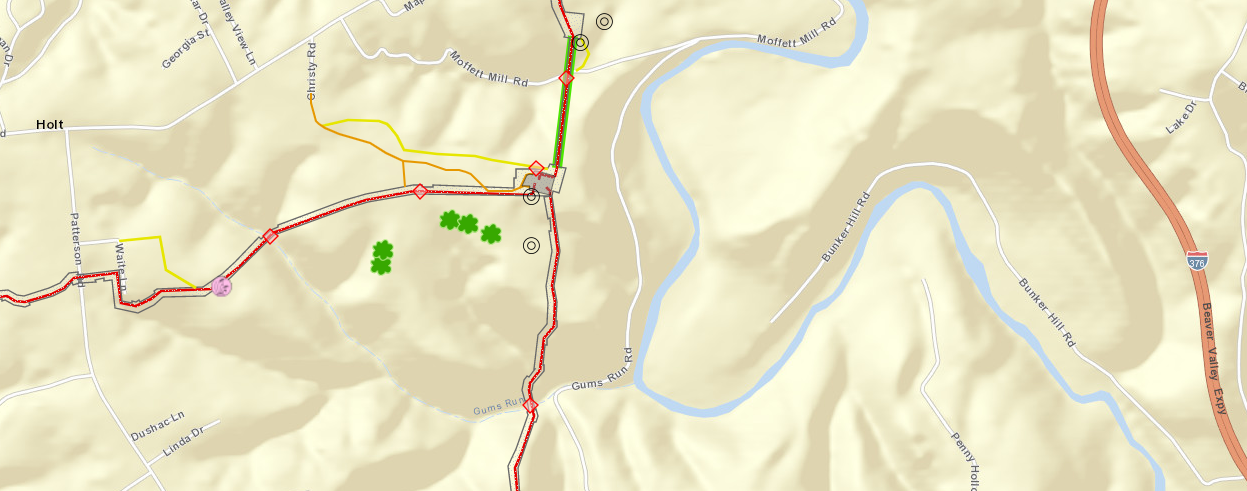
Figure 11. Northern long-eared bat roost trees in Raccoon Township, Pennsylvania
For more information on the wildlife impacts of the Falcon Pipeline, click here.
***
To continue reading about this pipeline, visit the Falcon Public EIA Project.
By documenting the impacts of the Falcon Pipeline, you’re contributing to a growing body of work that shows the risks of fossil fuel pipelines. Not only does this evidence protect drinking water and vulnerable species, it serves as evidence against an inherently dangerous project that will contribute to climate change and the global plastics crisis.
We hope you’re inspired to take action and add your voice to a growing team in the region committed to safer and healthier environments. Thank YOU for your dedication to the cause!
By Erica Jackson, Community Outreach and Communications Specialist, FracTracker Alliance.
Portions of this article were adapted from previous posts in the Falcon Public EIA Project, written by Kirk Jalbert.


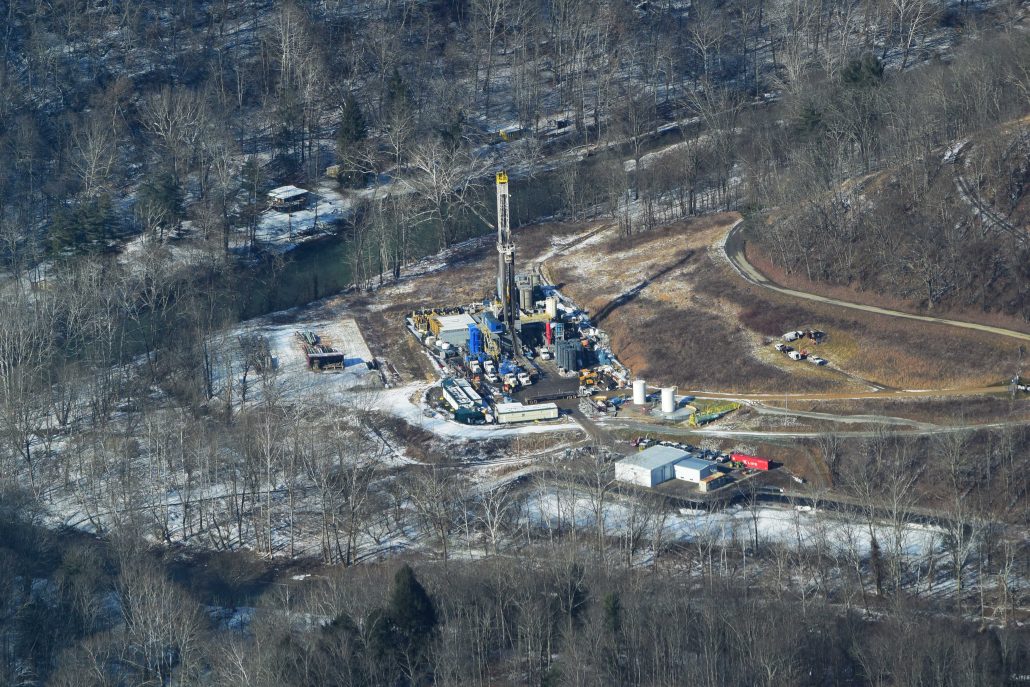
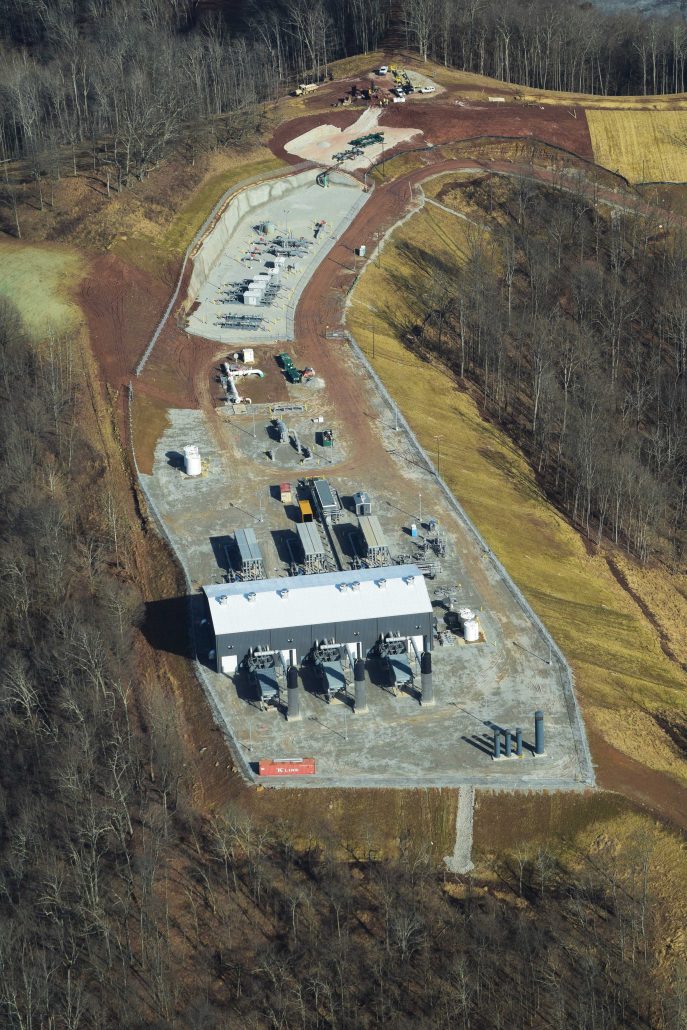
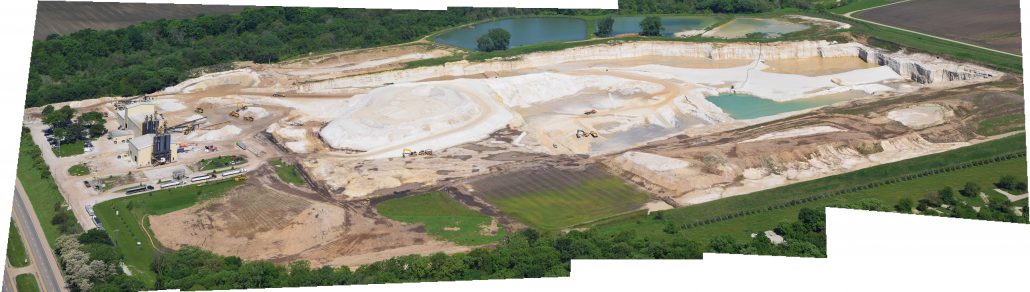
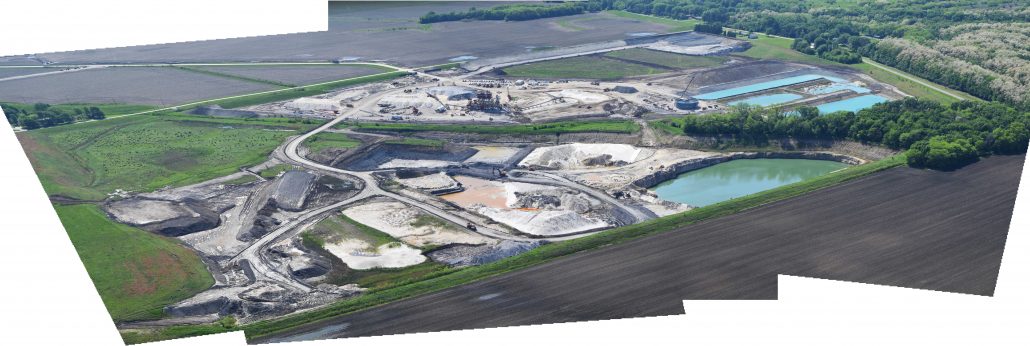
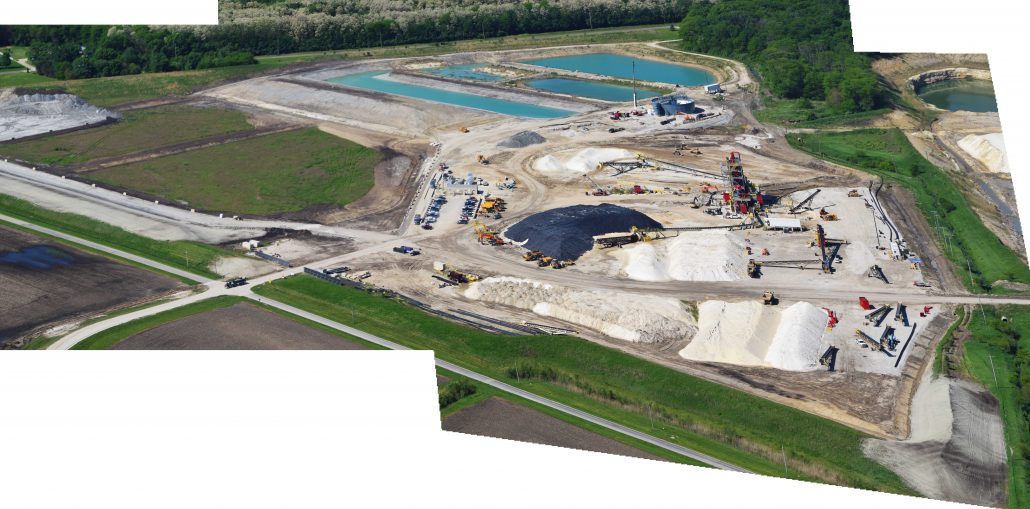
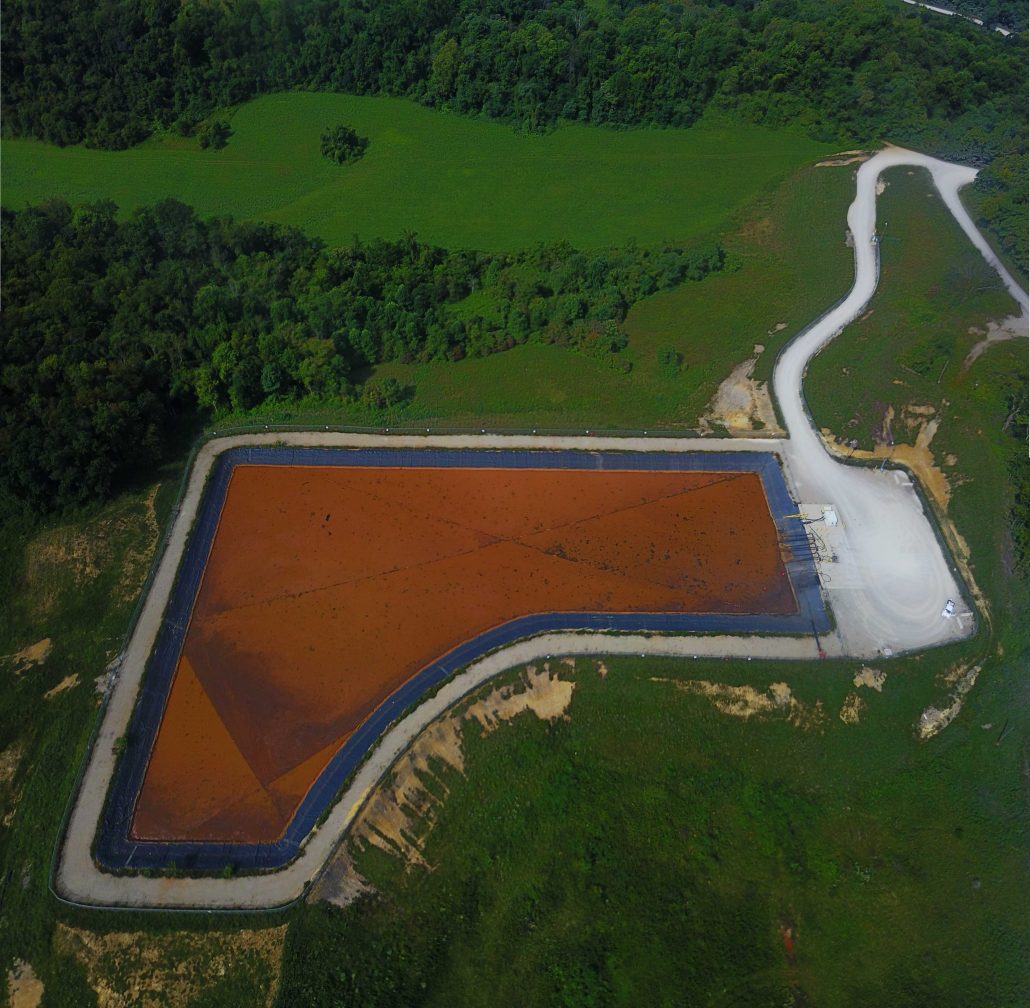
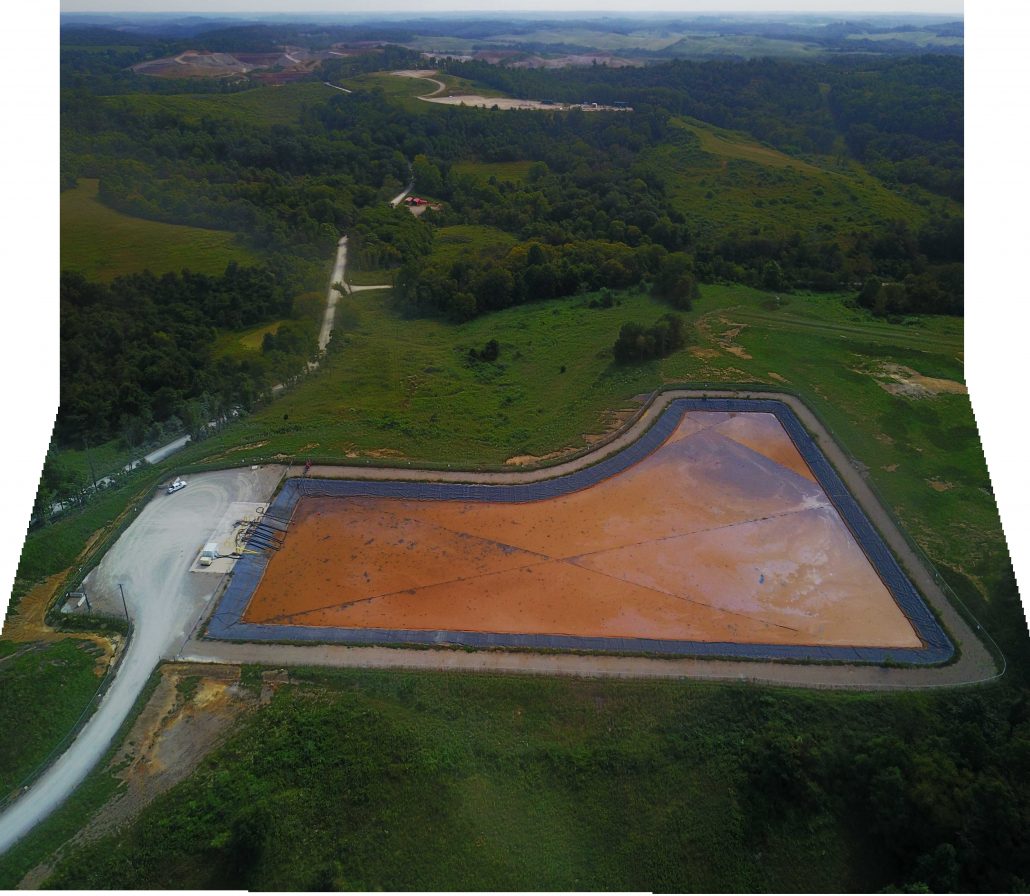
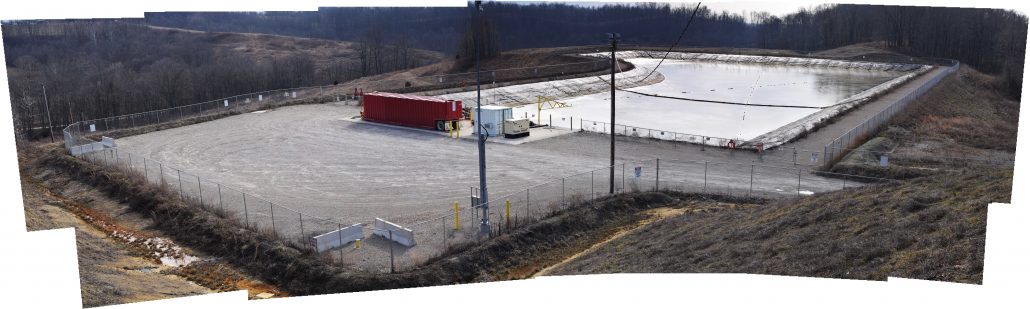
 Injection Well under construction, Brookfield, Ohio")
 Injection Well construction entrance, Brookfield, Ohio")
 Injection Well under construction, Brookfield, Ohio")


 Injection Well under construction, Brookfield, Ohio")
 Injection Well under construction, Brookfield, Ohio")


