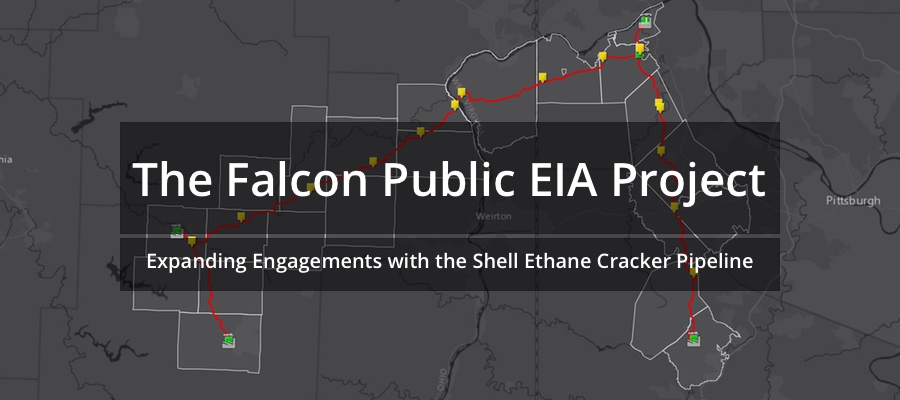
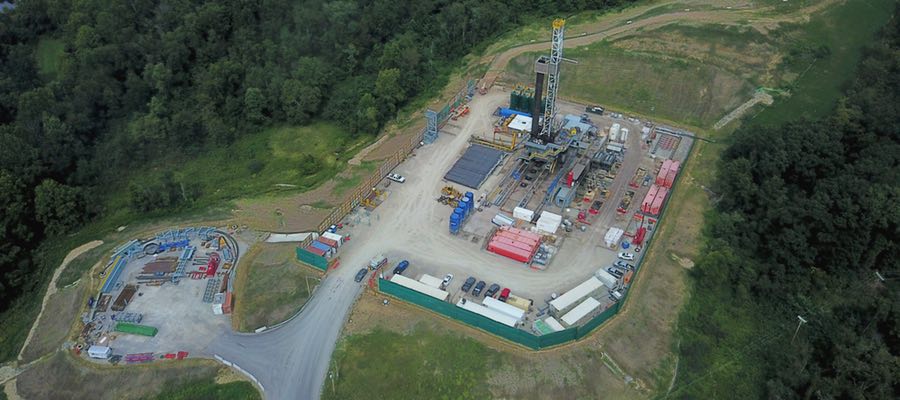
Pittsburgh, Pennsylvania – Jan. 29 – FracTracker Alliance has released a detailed environmental impact assessment (EIA), including digital maps, of the Falcon Ethane Pipeline being built to feed Shell Appalachia’s ethylene cracker plant in Beaver County, PA.
FracTracker’s Falcon Public EIA Project offers a rich series of interactive maps and articles detailing the Falcon’s proposed route through PA, WV, and OH, likely impacts to waterways, potential blast zones, ecological footprint, proximity to hazardous industrial areas, and more.
Given the issues associated with Mariner East 2 – a PA-based natural gas liquids pipeline whose history has been fraught with citations, public scrutiny is a crucial facet of pipeline construction. The Falcon Public EIA Project represents the first time that public stakeholders have been given such a significant amount of time and detail to investigate a proposed pipeline, including access to specific location information. Public comments are being accepted by the PA Department of Environmental Protection on the Falcon’s permit until February 20th.
“Companies are generally not required to publicly disclose GIS data when applying for permits,” remarked Kirk Jalbert, project lead and Manager of Community Based Research and Engagement at FracTracker. “While concerned citizens can stitch together paper maps provided by companies in their applications, that process can be complex and very labor intensive.”
Early access to what is being proposed for the Falcon pipeline will enable nearby communities to better understand how its construction and the associated ethane cracker facility, which will produce 1 million tons of ethylene annually for making plastics, will affect their lives. Upon analyzing the data, FracTracker uncovered a number of particularly noteworthy statistics, for example:
There are 97.5 miles of pipeline proposed to be built through 22 townships in 3 states.
2,000 properties have been surveyed; 765 easements executed.
Falcon will intersect 319 streams and 174 wetlands, with hundreds more proximate to work areas.
550 family residences, 20 businesses, 240 groundwater wells, 12 public parks, 5 schools, 6 daycare centers, and 16 emergency response centers are within potential risk areas.
“Extreme levels of risk and injustice are commonplace in petrochemical pipeline siting, as well as in where their contents come from and how they get used. This project provides context for the importance of reducing these impacts, both for curtailing environmentally unfriendly plastics as well as for moving away from fossil fuel dependencies,” said Brook Lenker, Executive Director of FracTracker.
The Falcon Public EIA Project is meant to expand public dialogue about what should be included in EIAs and how they should apply to petrochemical pipelines. The project also serves as a model for how regulatory agencies can be more transparent with data when engaging the public. This is especially important in the case of the Falcon pipeline, which will be exempt from Federal Energy Regulatory Commission (FERC) scrutiny and, therefore, not be subject to a full environmental impact assessment.
https://www.fractracker.org/a5ej20sjfwe/wp-content/uploads/2018/01/Falcon-Public-EIA-Project-Feature-1.jpg400900FracTracker Alliancehttps://www.fractracker.org/a5ej20sjfwe/wp-content/uploads/2025/09/2025-Wordmark-Logo.pngFracTracker Alliance2018-01-29 07:45:292021-04-15 15:01:56Wingspan of the Falcon Pipeline
In this segment of the Falcon Public EIA Project, we first focus on the route of the pipeline and prior routes that were considered. We take a closer look at the properties along the route that required easement agreements from landowners. Finally, we locate facilities that will be built as part of the project, such as metering stations and shut-off valves, as well as the pipeline’s construction areas and access roads.
Quick Falcon Facts
97.5 miles of proposed pipeline (an additional 200+ miles surveyed during the process)
2,000 parcels of land surveyed; 765 easements executed; 469 will be needed to execute the route
1,273 acres required for construction space; 650 acres for the permanent right-of-way
Map of Falcon pipeline routes, properties, and facilities
The following map will serve as our guide in breaking down these first components. Expand the map full-screen to explore its contents in greater depth. Some layers only become visible at closer zoom levels. Click the “details” tab in full-screen mode to read how the different layers were created.
Pipeline operators must consider a variety of factors when searching for a viable right of way (ROW) for their project—the continuous stretch of land needed to construct, maintain, and operate the pipeline. This process begins with reviewing data and maps made available by federal, state, and local agencies in order to identify features that would complicate the project. These might include such things as protected wetlands, drinking water sources, abandoned mines, or heavily populated areas.
A second step is to conduct manual field surveys along their planned route. During this stage, engineers do precise measurements to determine how the pipeline will cross individual properties as well as locate site-specific concerns that need to be accounted for, such as the presence of endangered species or archeological sites. FracTracker previously produced a guide to pipeline surveying, which can be found here.
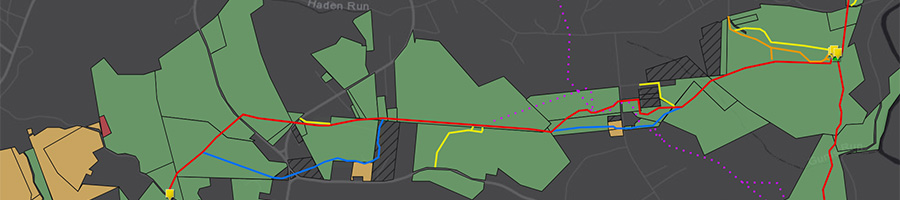
The process of finding a viable pipeline route can undergo dozens of revisions and take months or years to complete. The example image seen below, taken from our interactive map at the top of the page, shows a few of the many different 50ft. ROWs considered by Shell. These were documented every few months as the data changed.
A section of the Falcon route with prior routes considered
The most recent route is highlighted in red, totaling 97.5 miles (Shell’s original press releases stated 94 miles). Segments that represent alternative routes considered in certain places are shown in blue (these earlier divergences total 19 miles). Other areas surveyed at some point in the process are shown in dotted purple (totaling 91.3 miles). Given that the route has changed very little in recent months, as well as the fact that Shell has submitted their permit applications for project, we believe that the route in red is likely the route proposed to regulatory agencies.
Note that, in the interactive map, there is an additional “Air Liquide” pipeline (this is the name of a gas products company) proposed by Shell that will run from the ethane cracker south for about .5 miles. Based on comments made by Shell at public hearings, we assume this will be a nitrogen pipeline feeding the plant from an unknown source.
Acquiring Easements
Perhaps the most significant factor that can determine a pipeline route is finding landowners amenable to having their land surveyed and, ultimately, willing to sign easements to allow the pipeline on their property. In some instances, pipeline companies can be granted eminent domain as a “public utility” to take land by force (ME2). However, Shell has stated publicly that eminent domain in not an option for Falcon, due to the fact that the pipeline services a private facility. FracTracker previously produced a guide for landowners who might be approached by pipeline operators seeking to survey their properties.
The Falcon pipeline will have a permanent ROW of 50ft that will cross 10 municipalities in Pennsylvania, 12 townships in Ohio, as well as northern Hancock County, West Virginia. More than 2,000 individual parcels of land were surveyed across this region. Of those 2,000, Shell approached landowners for 765 unique parcels at some point in the process to obtain easements, either for the pipeline ROW itself or for access roads.
To date, Shell has executed 572 easements. Of these, 469 will be needed to execute the current proposed route. However, as of this time, 14 parcels along the proposed route are still listed as “landowner contacted,” meaning that the easement has not yet been executed. The image below is a page from Shell’s permit applications to the PA DEP listing properties pending in Pennsylvania.
Pending PA easements from Shell’s permit applications
Media sources have reported on some of the details of Shell’s Pipeline easement agreements. In some instances, contracts stated a transactional price of $10 per linear foot as a “placeholder” to get the process started. In other cases, Shell has paid landowners as much as $75 per linear foot of pipeline. These agreements also state that Shell reserved the right to “lay, construct, test, maintain, inspect, operate, repair, renew, relocate, replace, substitute, change the size of, upgrade, alter, mark, protect and remove or abandon in place” any pipelines on the property. Below is an example of how our interactive map represents these parcels and their status. For instance, executed easements are in green and pending or stalled agreements in yellow.
Parcels along the Falcon route and their easement status
Valves & Metering Stations
Pipelines require a number of facilities to properly manage the flow and pressure of gas from one end of the line to another. For instance, metering stations are installed to measure how much gas is in the pipeline system at given points. Falcon has five “pads” where metering stations will be located. Three of these are co-located at the origin points of the pipeline (the MarkWest separator facilities) and a fourth at the ethane cracker end-point. However, the fifth meter stations will be located where the two legs of the pipeline meet in northeast Raccoon Township, Beaver County, PA. This site is called the “Junction” meter pad.
Shut-off valves will also placed along the route—18 in all for Falcon—in order to section off lengths of the pipeline that can be turned off as needed. These valves will be located at fairly regular intervals of 8-10 miles in most places, but are also found just before and after sensitive locations, such as the Oho River crossing and areas and where the lines juncture.
The Risks of Proximity
Metering stations and shut-off valves bring particular risks. For instance, when valves are closed at a section of pipeline for maintenance, or in the event of an emergency, excess gasses must vented to relieve pressure. This is one reason why communities have become concerned about the location of these facilities, such as with a Mariner East 2 pipeline valve in West Goshen Township, PA. Similarly, the Falcon pipelines’ valve in New Somerset, OH, is especially close to residential areas, seen below.
A proposed Falcon shut-off valve site in New Somerset, Ohio
Workspaces & Access Roads
Finally, pipeline operators must identify in their permit applications the “workspace” needed for construction. Shell’s temporary ROW for workspace is approximately 100ft in most stretches along the Falcon’s route, similar to what is shown in the image below. Site-specific conditions, such as road, railroad crossings, and buildings make the workspace narrower in some instances, but much larger workspaces will be needed around sites like metering stations and shut-off valves.
A typical pipeline workspace; this one from the Mariner East 2
The locations of access roads must also be identified in permit applications. Access roads come in two categories and typically require a 25ft ROW. Temporary access roads are used during the construction process and often utilize existing private driveways, farm roads, or are built after clearing land acquired in the easement process. Permanent roads allow long-term access to facilities, such as valves and pumping stations, as well as for bringing in equipment to maintain the pipeline’s ROW. Shell’s plan proposes 111 temporary access roads (28 miles) and 21 permanent access roads (2.3 miles).
Shell’s permit applications state that the total disturbed workspace needed for construction and access roads is approximately 1,273 acres. About half of this will remain cleared for the permanent right-of-way and permanent access roads.
A Closer Look
When a pipeline project is subject to regulatory review, alternative routes are typically offered up by the operator for consideration in weighing different costs and benefits. Major reroutes typically deviate from the proposed route for significant distances in order to avoid significant impediments such as large cities or protected lands. Minor alternatives are shorter in length and used to avoid specific areas of concern, such as a protected wetland. An alternative route might also be selected in order to utilize an existing ROW from other pipelines.
Ohio River Crossing
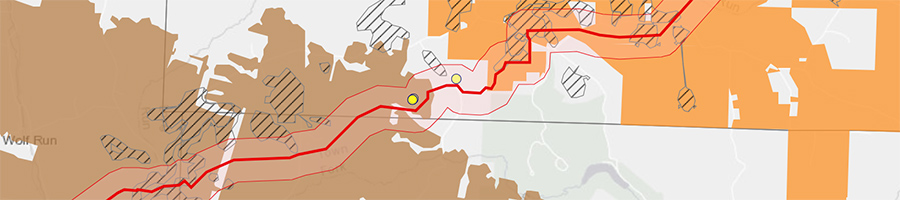
As noted, there are a number of places along the Falcon route where we see examples of major route changes. Many of these reroutes appear to be due to landowners along the preferred path not signing easements for one reason or another. One of the more significant change occurred at the location where the Falcon crosses the Ohio River in Hancock County, West Virginia, seen below. For many months, Shell’s maps showed a planned crossing south of the current proposed route, but later took a dramatic diversion to the north, apparently due to an easement not having been executed for a single property. What is notable about the new route is that it utilizes property owned by the popular Mountaineer Casino, Racetrack, and Resort.
The current and former Falcon route crossing the Ohio River
Fort Cherry Golf Course Reroute
In another instance, we see a reroute near the Fort Cherry Golf Course in McDonald, Washington County, PA. An earlier route took the Falcon straight through the course, whereas the current proposed route goes further east, disrupting a smaller number of fairways. Notice in the image below that a temporary access road for the pipeline’s construction will also still utilize Fort Cherry Golf Course’s driveway.
The current and former Falcon routes crossing the Ft. Cherry Golf Course
Montour Trail Intersections
Finally, we bring attention to what appears to be some of the few remaining properties with easements not yet settled in order to begin construction. As noted in the excerpt from Shell’s permit application at the top of this page, a number of parcels owned by the Montour Trail Council have a status of: “in negotiation and depended on submitted crossing permit applications,” presumably meaning they would agree to the easement if PA DEP approved Shell’s permits.
Falcon intersections with the Montour Trail
The Montour Trail is a 46-mile long multi-use non-motorized recreational rail-trail located in Washington and Allegheny County, PA, used by more than 400,000 people annually. It also makes up part of the Great Allegheny Passage (GAP), a trail system that stretches over 335 miles from Pittsburgh to Washington, DC. The trail is managed by the nonprofit Montour Trail Council with support from state agencies such as the Pennsylvania Department of Conservation and Natural Resources (DCNR).
We were surprised to find that the Montour Trail will be crossed by the Falcon in 9 locations: 5 by the pipeline itself, 3 by temporary access roads, and 1 by a permanent access road, as illustrated in the image above. Two of the pipeline intersections will be executed using HDD boring. The trail and its intersection with the Falcon can be seen by activating these layers on FracTracker’s interactive map, as illustrated in the image above.
In this final section of the Falcon Public EIA Project, we explore the Falcon pipeline’s entanglements with a region already impacted by a long history of energy development. Featured in this article are where the Falcon pipeline intersects underground mining facilities, strip mines, other hazardous pipelines, active oil and gas wells, as well as a very large compressor station. We utilize this information to locate spaces where cumulative development also has the potential for compounded risk.
Quick Falcon Facts
20 miles of the Falcon run through under-mined areas; 5.6 miles through active mines
18 miles of the Falcon run through surface-mined areas; also coal slurry waste site
Shares a right-of-way with Mariner West pipeline for 4 miles in Beaver County
11 well pads, as well as a compressor station, are within the potential impact radius
Map of Falcon relative to mined areas and other energy-related development
The following map will serve as our guide in breaking down where the Falcon intersects areas that have experienced other forms of energy development. Expand the map full-screen to explore its contents in greater depth. Some layers only become visible as you zoom in. A number of additional features of the map are not shown by default, but can be turned on in the “layers” tab. These include information on geological features, water tables, soil erosion characteristics, as well as drinking reservoir boundaries. Click the “details” tab in full-screen mode to read how the different layers were created.
The Falcon pipeline intersects a surprising number of active and inactive/abandoned mine lands. While the location of active mines is fairly easy to obtain from mine operators, finding data on abandoned mines is notoriously difficult. State agencies, such as the Pennsylvania Department of Environmental Protection (DEP), have digitized many legacy maps, but these resources are known to be incomplete and inaccurate in many locations.
AECOM’s engineers used data layers on active and abandoned mine lands maintained by state agencies in OH, WV, and PA. FracTracker obtained this data, as well, as shown on the interactive map. Shell states in their permits that AECOM’s engineers also went through a process of obtaining and digitizing paper maps in areas with questionable mine maps.
Shell states that their analysis shows that 16.8 miles of the Falcon pipeline travel through under-mined areas. Our analysis using the same dataset suggests the figure is closer to 20 miles. Of these 20 miles of pipeline:
5.6 miles run through active coal mines and are located in Cadiz Township, OH (Harrison Mining Co. Nelms Mine); Ross Township, OH (Rosebud Mining Co. Deep Mine 10); and in Greene Township, PA (Rosebud Mining Co. Beaver Valley Mine).
More than 18 miles run through areas that have been historically surface-mined (some overlapping under-mined areas).
Of those 18 miles, 1.5 miles run through an active surface mine located in Cadiz Township, OH, managed by Oxford Mining Company.
Beaver Valley Mine
The Beaver Valley Mine in Greene Township, PA, appeared to be of particular importance in Shell’s analysis. Of the three active mines, Shell maintained an active data layer with the mine’s underground cell map for reference in selecting routes, seen in the image below. Note how the current route changed since the map was originally digitized, indicating that a shift was made to accommodate areas around the mine. The FracTracker interactive map shows the mine based on PA DEP data, which is not as precise as the mine map AECOM obtained from Rosebud Mining.
Digitized map of Beaver Valley Mine
Rosebud Mining idled its Beaver Valley Mine in 2016 due to declining demand for coal. However, Rosebud appears to be expanding its workforce at other mines in the area due to changing economic and political circumstances. We don’t know exactly why this particular mine was highlighted in Shell’s analysis, or why the route shifted, as it is not directly addressed in Shell’s permit applications. Possibilities include needing to plan around areas that are known to be unfit for the pipeline, but also perhaps areas that may be mined in the future if the Beaver Valley Mine were to restart operations.
Coal Slurry Site, Imperial PA
As discussed in other segments of the Falcon Public EIA Project, Shell intends to execute 19 horizontal directional drilling (HDD) operations at different sites along the pipeline. A cluster of these are located in Allegheny and Washington counties, PA, with extensive historical surface mining operations. A 2003 DEP report commented on this region, stating:
All of the coal has been underground mined. Most of the coal ribs and stumps (remnants from the abandoned underground mine) have been surface mined… The extensive deep mining, which took place from the 1920’s through the 1950’s, has had a severe effect on groundwater and surface water in this watershed.
Shell’s applications note that AECOM did geotechnical survey work in this and other surface-mined areas co-located with proposed HDD operations, concluding that the ”majority of rock encountered was shale, sandstone, limestone, and claystone.” However, at one proposed HDD (called “HOU-06”) the Falcon will cross a coal waste site identified in the permits as “Imperial Land Coal Slurry” along with a large Palustrine Emergent (PEM) wetland along Potato Garden Run, seen below.
A Falcon HDD crossing under a wetland and coal slurry site
Foreign Pipelines
In addition to its entanglements with legacy coal mining, the Falcon will be built in a region heavily traveled by oil and gas pipelines. More than 260 “foreign pipelines” carrying oil, natural gas, and natural gas liquids, were identified by AECOM engineers when selecting the Falcon’s right-of-way (note that not all of these are directly crossed by the Falcon).
Owners of these pipelines run the gamut, including companies such as Williams, MarkWest, Columbia, Kinder Morgan, Energy Transfer Partners, Momentum, Peoples Gas, Chesapeake, and Range Resources. Their purposes are also varied. Some are gathering lines that move oil and gas from well pads, others are midstream lines connecting things like compressor stations to processing plants, others still are distribution lines that eventually bring gas to homes and businesses. FracTracker took note of these numbers and their significance, but did not have the capacity to document all of them for our interactive map.
Shared Rights-of-Way
However, we did include one pipeline, the Mariner West, because of its importance in the Falcon’s construction plans. Mariner West was built in 2011-2013 as part of an expanding network of pipelines initially owned by Sunoco Pipeline but now operated by Energy Transfer Partners. The 10-inch pipeline transports 50,000 barrels of ethane per day from the Separator plant in Houston, PA, to processing facilities in Canada. Another spur in this network is the controversial Mariner East 2.
Mariner West is pertinent to the Falcon because the two pipelines will share the same right-of-way through a 4-mile stretch of Beaver County, PA, as shown below.
The Falcon and Mariner West sharing a right-of-way
Reuse of existing rights-of-way is generally considered advantageous by pipeline operators and regulatory agencies. The logistics of sharing pipelines can be complicated, however. As noted in Shell’s permit applications:
Construction coordination will be essential on the project due to the numerous parties involved and the close proximity to other utilities. Accurate line location was completed; however, verification will also be key, along with obtaining proper crossing design techniques from the foreign utilities. A meeting with all of pipeline companies will be held to make sure that all of the restrictions are understood prior to starting construction, and that they are documented on the construction alignment sheets/bid documents for the contractor(s). This will save a potential delay in the project. It will also make working around the existing pipelines safe.
Shell’s attention to coordinating with other utility companies is no doubt important, as is their recognition of working near existing pipelines as a safety issue. There are elevated risks with co-located pipelines when they come into operation. This was seen in a major pipeline accident in Salem Township, PA, in 2016. One natural gas line exploded, destroying nearby homes, and damaged three adjacent pipelines that took more than a year to come back online. These findings raise the question of whether or not Class Location and High Consequence Area assessments for the Falcon should factor for the exponential risks of sharing a right-of-way with Mariner West.
Oil & Gas Extraction
The remaining features included on our map relate to oil and gas extraction activities. The Falcon will carry ethane from the three cryogenic separator plants at the pipeline’s source points. But the wet, fracked gas that supplies those plants also comes from someplace, and these are the many thousands of unconventional gas wells spread across the Marcellus and Utica shale.
We found 11 unconventional oil and gas pads, hosting a combined 48 well heads, within the Falcon’s 940-foot PIR. We also found a large compressor station operated by Range Resources, located in Robinson Township, PA. This is shown below, along with a nearby gas pad.
A well pad and compressor station in Falcon’s PIR
We noted these well pads and the compressor station because Class Location and HCA risk analysis may account for proximity to occupied businesses and homes, but does not always consider a pipeline’s proximity to other high-risk industrial sites. Nevertheless, serious incidents have occurred at well pads and processing facilities that could implicate nearby hazardous liquid pipelines. By the same measure, an accident with the Falcon could implicate one of these facilities, given they are all within the Falcon’s blast zone.
FracTracker began monitoring Falcon’s construction plans in December 2016, when we discovered a significant cache of publicly visible GIS data related to the pipeline. At that time, FracTracker was looking at ways to get involved in the public discussion about Shell’s ethane cracker and felt we could contribute our expertise with mapping pipelines. Below we describe the methods we used to access and worked with this project’s data.
Finding the Data
Finding GIS data for pipeline projects is notoriously difficult but, as most research goes these days, we started with a simple Google search to see what was out there, using basic keywords, such as “Falcon” (the name of the pipeline), “ethane” (the substance being transported), “pipeline” (the topic under discussion), and “ArcGIS” (a commonly used mapping software).
In addition to news stories on the pipeline’s development, Google returned search results that included links to GIS data that included “Shell” and “Falcon” in their names. The data was located in folders labeled “HOUGEO,” presumably the project code name, as seen in the screenshot below. All of these links were accessed via Google and did not require a password or any other authentication to view their contents.
Shell’s data on the Falcon remained publicly available at this link up to the time of the Falcon Public EIA Project‘s release. However, this data is now password protected by AECOM.
Google search results related to Falcon pipeline data
Viewing the Data
The HOUGEO folder is part of a larger database maintained by AECOM, an engineering firm presumably contracted to prepare the Falcon pipeline construction plan. Data on a few other projects were also visible, such as maps of the Honolulu highway system and a sewer works in Greenville, NC. While these projects were not of interest to us, our assessment is that this publicly accessible server is used to share GIS projects with entities outside the company.
Within the HOUGEO folder is a set of 28 ArcGIS map folders, under which are hundreds of different GIS data layers pertaining to the Falcon pipeline. These maps could all be opened simply by clicking on the “ArcGIS Online map viewer” link at the top of each page. Alternatively, one can click on the “View in: Google Earth” link to view the data in Google Earth or click on the “View in: ArcMap” link to view the data in the desktop version of the ArcGIS software application. No passwords or credentials are required to access any of these folders or files.
As seen in the screenshot below, the maps were organized topically, roughly corresponding to the various components that would need to be addressed in an EIA. The “Pipeline” folder showed the route of the Falcon, its pumping stations, and work areas. “Environmental” contained data on things like water crossings and species of concern. “ClassLocations” maps the locations of building structures in proximity to the Falcon.
The HOUGEO GIS folders organized by topic
Archiving the Data
After viewing the Falcon GIS files and assessing them for relevancy, FracTracker went about archiving the data we felt was most useful for our assessing the project. The HOUGEO maps are hosted on a web server meant for viewing GIS maps and their data, either on ArcOnline, Google Earth, or ArcMap. The GIS data could not be edited in these formats. However, viewing the data allowed us to manually recreate most of the data.
For lines (e.g. the pipeline route and access roads), points (e.g. shutoff valves and shut-off valves), and certain polygons (e.g. areas of landslide risk and construction workspaces), we archived the data by manually recreating new maps. Using ArcGIS Desktop software, we created a new blank layer and manually inputted the relevant data points from the Falcon maps. This new layer was then saved locally so we could do more analysis and make our own independent maps incorporating the Falcon data. In some cases, we also archived layers by manually extracting data from data tables underlying the map features. These tables are made visible on the HOUGEO maps simply by clicking the “data table” link provided with each map layer.
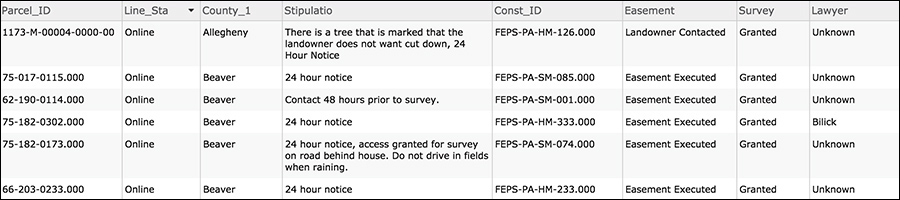
Other layers were archived using screen captures of the data tables visible in the HOEGEO ArcOnline maps. For instance, the table below shows which parcels along the route had executed easements. We filtered the table in ArcGIS Online to only show the parcel ID, survey status, and easement status. Screen captures of these tables were saved as PDFs on our desktop, then converted to text using optical character recognition (OCR), and the data brought into Microsoft Excel. We then recreated the map layer by matching the parcel IDs in our newly archived spreadsheet to parcel IDs obtained from property GIS shapefiles that FracTracker purchased from county deeds offices.
Transparency & Caveats
FracTracker strives to maintain transparency in all of its work so the public understands how we obtain, analyze, and map data. A good deal of the data found in the HOUGEO folders are available through other sources, such as the U.S. Geological Survey, the Department of Transportation, and the U.S. Census, as well as numerous state and county level agencies. When possible, we opted to go to these original sources in order to minimize our reliance on the HOUGEO data. We also felt it was important to ensure that the data we used was as accurate and up-to-date as possible.
For instance, instead of manually retracing all the boundaries for properties with executed easements for the Falcon’s right-of-way, we simply purchased parcel shapefiles from county deeds and records offices and manually identified properties of interest. To read more on how each data layer was made, open any of our Falcon maps in full-screen mode and click the “Details” tab in the top left corner of the page.
Finally, some caveats. While we attempted to be as accurate as possible in our methods, there are aspects of our maps where a line, point, or polygon may deviate slightly in shape or location from the HOUGEO maps. This is the inherent downside of having to manually recreate GIS data. In other cases, we spent many hours correcting errors found in the HOUGEO datasets (such as incorrect parcel IDs) in order to get different datasets to properly match up.
FracTracker also obtained copies of Shell’s permit applications in January by conducting a file review at the PA DEP offices. While these applications — consisting of thousands of pages — only pertain to the areas in Pennsylvania where the Falcon will be built, we were surprised by the accuracy of our analysis when compared with these documents. However, it is important to note that the maps and analysis presented in the Falcon Public EIA Project should be viewed with potential errors in mind.
Report Calculates Impacts from PA’s Planned Natural Gas Infrastructure
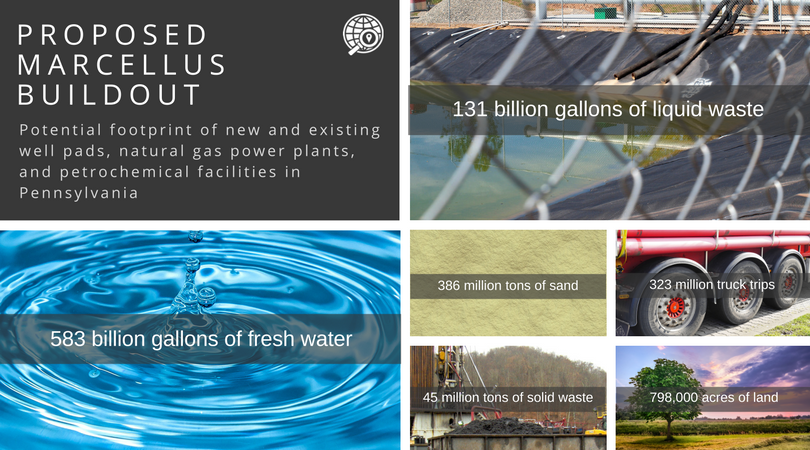
FracTracker Alliance released the report: A Hazy Future: Pennsylvania’s Energy Landscape in 2045 today, which details the potential future impacts of a massive buildout of Marcellus Shale wells and associated natural gas infrastructure.
Industry analysts forecast 47,600 new unconventional oil and gas wells may be drilled in Pennsylvania by 2045, fueling new natural gas power plants and petrochemical facilities in PA and beyond. Based on industry projections and current rates of consumption, FracTracker – a national data-driven non-profit – estimates the buildout would require 583 billion gallons of fresh water, 386 million tons of sand, 798,000 acres of land, 131 billion gallons of liquid waste, 45 million tons of solid waste, and more than 323 million truck trips to drilling sites.
“Only 1,801 of the 10,851 unconventional wells already drilled count as a part of this projection, meaning we could see an additional 45,799 such wells in the coming decades,” commented Matt Kelso, Manager of Data and Technology for FracTracker and lead author on the report.
Why the push for so much more drilling? Out of state – and out of country – transport is the outlet for surplus production.
“The oil and gas industry overstates the need for more hydrocarbons,” asserted FracTracker Alliance’s Executive Director, Brook Lenker. “While other countries and states are focusing more on renewables, PA seems resolute to increase its fossil fuel portfolio.”
The report determined that the projected cleared land for well pads and pipelines into the year 2045 could support solar power generation for 285 million homes, more than double the number that exist in the U.S.
“A Hazy Future shows that a fossil fuel-based future for Pennsylvania would come at the expense of its communities’ health, clean air, water and land. It makes clear that a dirty energy future is unnecessary,” said Earthworks’ Pennsylvania Field Advocate, Leann Leiter. Earthworks endorsed FracTracker’s report. She continued, “I hope Governor Wolf reads this and makes the right choices for all Pennsylvanians present and future.”
A Hazy Future reviews the current state of energy demand and use in Pennsylvania, calculates the footprint of industry projections of the proposed buildout, and assesses what that would look like for residents of the Commonwealth.
Started in 2010 as a southwestern Pennsylvania area website, FracTracker Alliance is a national organization with regional offices across the United States in Pennsylvania, the District of Columbia, New York, Ohio, and California. The organization’s mission is to study, map, and communicate the risks of oil and gas development to protect our planet and support the renewable energy transformation. Its goal is to support advocacy groups at the local, regional, and national level, informing their actions to positively shape our nation’s energy future.
Decisions to drill or mine on public lands, however, are often extremely complicated.
By Allison M. Rohrs, Saint Francis University, Institute for Energy
The Commonwealth of Pennsylvania has historically been, and continues to be, home to an abundant array of energy resources like oil, gas, coal, timber, and windy ridgetops. Expectedly, these natural resources are found both on publicly and privately held land.
In Pennsylvania, the bulk of public lands are managed by two separate state agencies: The Department of Conservation and Natural Resources (DCNR), which manages the state’s forest and park system, and the Pennsylvania Game Commission (PGC), which manages the state’s game lands. Both of these state agencies manage oil, gas, and coal extraction as well as timbering on state property. Interestingly, neither of the agencies have utility-scale renewable energy generation on their land.
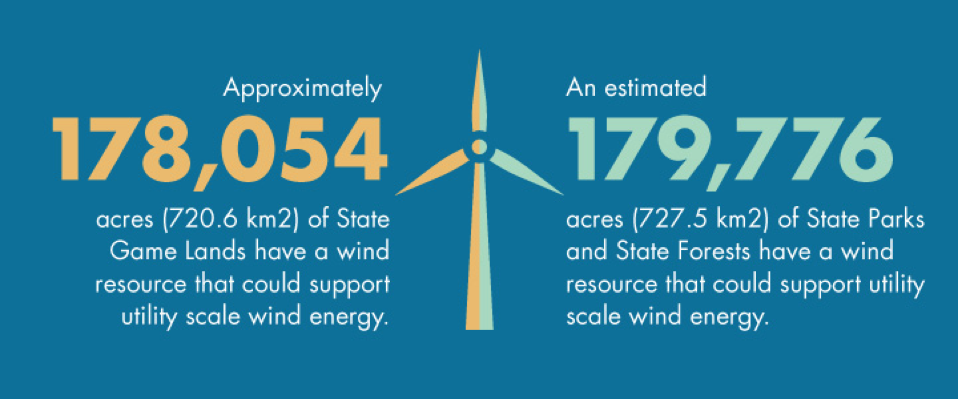
Some of Pennsylvania’s best wind resources can be found on the mountain ridges in the Commonwealth’s state forests and game lands, however, all proposals to build utility-scale wind farms have been denied by state agencies.
(Note: there are other state and federal agencies managing lands in PA, however, we focused our research on these two agencies specifically.)
Surprised to see that state lands have been greatly developed for different fossil industries but denied for wind energy, The Institute for Energy set out on a yearlong endeavor to collect as much information as we could about energy development on PA public lands. Using formal PA Right to Know requests, we worked with both DCNR and PGC to examine development procedures and management practices. We reviewed hundreds of available state agency reports, scientific documents, and Pennsylvania energy laws and regulations. We also worked with FracTracker Alliance to develop interactive maps that depict where energy development has occurred on state lands.
After a comprehensive review, we realized, like so much in life, the details are much more complicated than a simple yes or no decision to develop an energy project on state lands. Below is a brief summary of our findings, organized by energy extraction method:
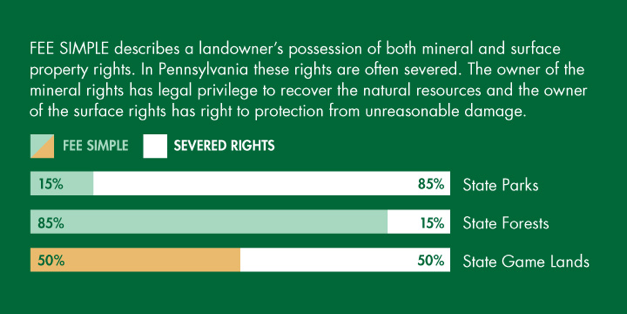
Land/Mineral Ownership in Pennsylvania
One of the most significant issues to understand when discussing energy resources on state lands is the complexity of land ownership in Pennsylvania. In many instances, the development of an energy resource on publicly owned land is not a decision, but instead an obligation. In Pennsylvania, property rights are often severed between surface and subsurface ownership. In many cases, surface owners do not own the mineral rights beneath them, and, by PA law, are obligated to allow reasonable extraction of such resource, whether it be coal, oil, or gas. In Pennsylvania, approximately 85% of state park mineral rights are owned by someone other than the Commonwealth (severed rights).
Legal Authority to Lease
It is critical to note that DCNR and PGC are two entirely separate agencies with different missions, legal structures, and funding sources. This plays a significant role in decisions to allow oil, gas, and coal development on their properties. Both agencies have explicit legal authority under their individual statutes that allow them to lease the lands for mineral extraction. This becomes more of an issue when we discuss wind development, where legal authority is less clear, particularly for DCNR.
Oil and Gas Extraction
Oil and gas wells have been spudded on state parks, state forests, and state game lands. The decision to do so is multifaceted and ultimately decided by three major factors:
Mineral ownership of the land,
Legal authority to lease the land, and
Potential impacts to the individual agency.
There is currently a moratorium on new surface leases of DCNR Lands. Moratoriums of such nature have been enacted and removed by different governors since 2010. Although there are no new lease agreements, extraction and production is still occurring on DCNR land from previously executed lease agreements and where the state does not own the mineral rights.
The Game Commission is still actively signing surface and non-surface use agreements for oil and gas extraction when they determine the action is beneficial to achieving their overall mission.
Revenues from the oil and gas industry play a significant role in the decision to drill or not. Both agencies have experienced increasing costs and decreasing revenues, overall, and have used oil and gas development as a way to bridge the gap.
Funds raised from DCNR’s oil and gas activities go back to the agency’s conservation efforts, although from 2009 to 2017, the State Legislature had directed much of this income to the state’s general fund to offset major budget deficits. Just this year, the PA Supreme Court ruled against this process and has restored the funds back to DCNR for conservations purposes.
All revenues generated from oil and gas development on state game lands stays within the Game Commission’s authority.
Along with positive economic benefits, there remains potential health and environmental risks unique to development on these public lands. Some studies indicate that users of these public lands could have potential exposure to pollution both in the air and in the water from active oil and gas infrastructure. The ease of public access to abandoned and active oil and gas infrastructure is a potential risk, as well. On the environmental side, many have argued that habitat fragmentation from oil and gas development is contradictory to the missions of the agencies. Both agencies have independent water monitoring groups specific to oil and gas activities as well as state regulated DEP monitoring. The potential negative effects on ground and surface water quality is an issue, however, mainly due the vast size of public lands and limited dwellings on these properties.
Use the map below to explore the PA state parks, forests, and game lands that have active oil and gas infrastructure.
Thousands of acres of state forests and game lands have been mined for coal. Like oil and gas, this mineral is subject to similar fee simple ownership issues and is governed by the same laws that allow oil and gas extraction. DCNR, has not signed any virgin coal mining leases since the 1990s, but instead focuses on reclamation projects. There are coal mining operations, however, on forest land where DCNR does not own the mineral rights. The Game Commission still enters into surface and non-surface use agreements for mining.
In many circumstances, mining activity and abandoned mines were inherited by the state agencies and left to them to reclaim. Environmental and health impacts of mining specific to state land are generally attributed more to legacy mining and not to new mining operations.
Acid mine drainage and land subsidence has destroyed rivers and riparian habitats on these lands purposed for conservation.
The ease of public access and limited surveillance of public lands also makes abandoned mines and pits a dangerous health risk. Although threats to humans and water quality exist, abandoned mines have been noted for actually creating new bat habitat for endangered and threatened bat species.
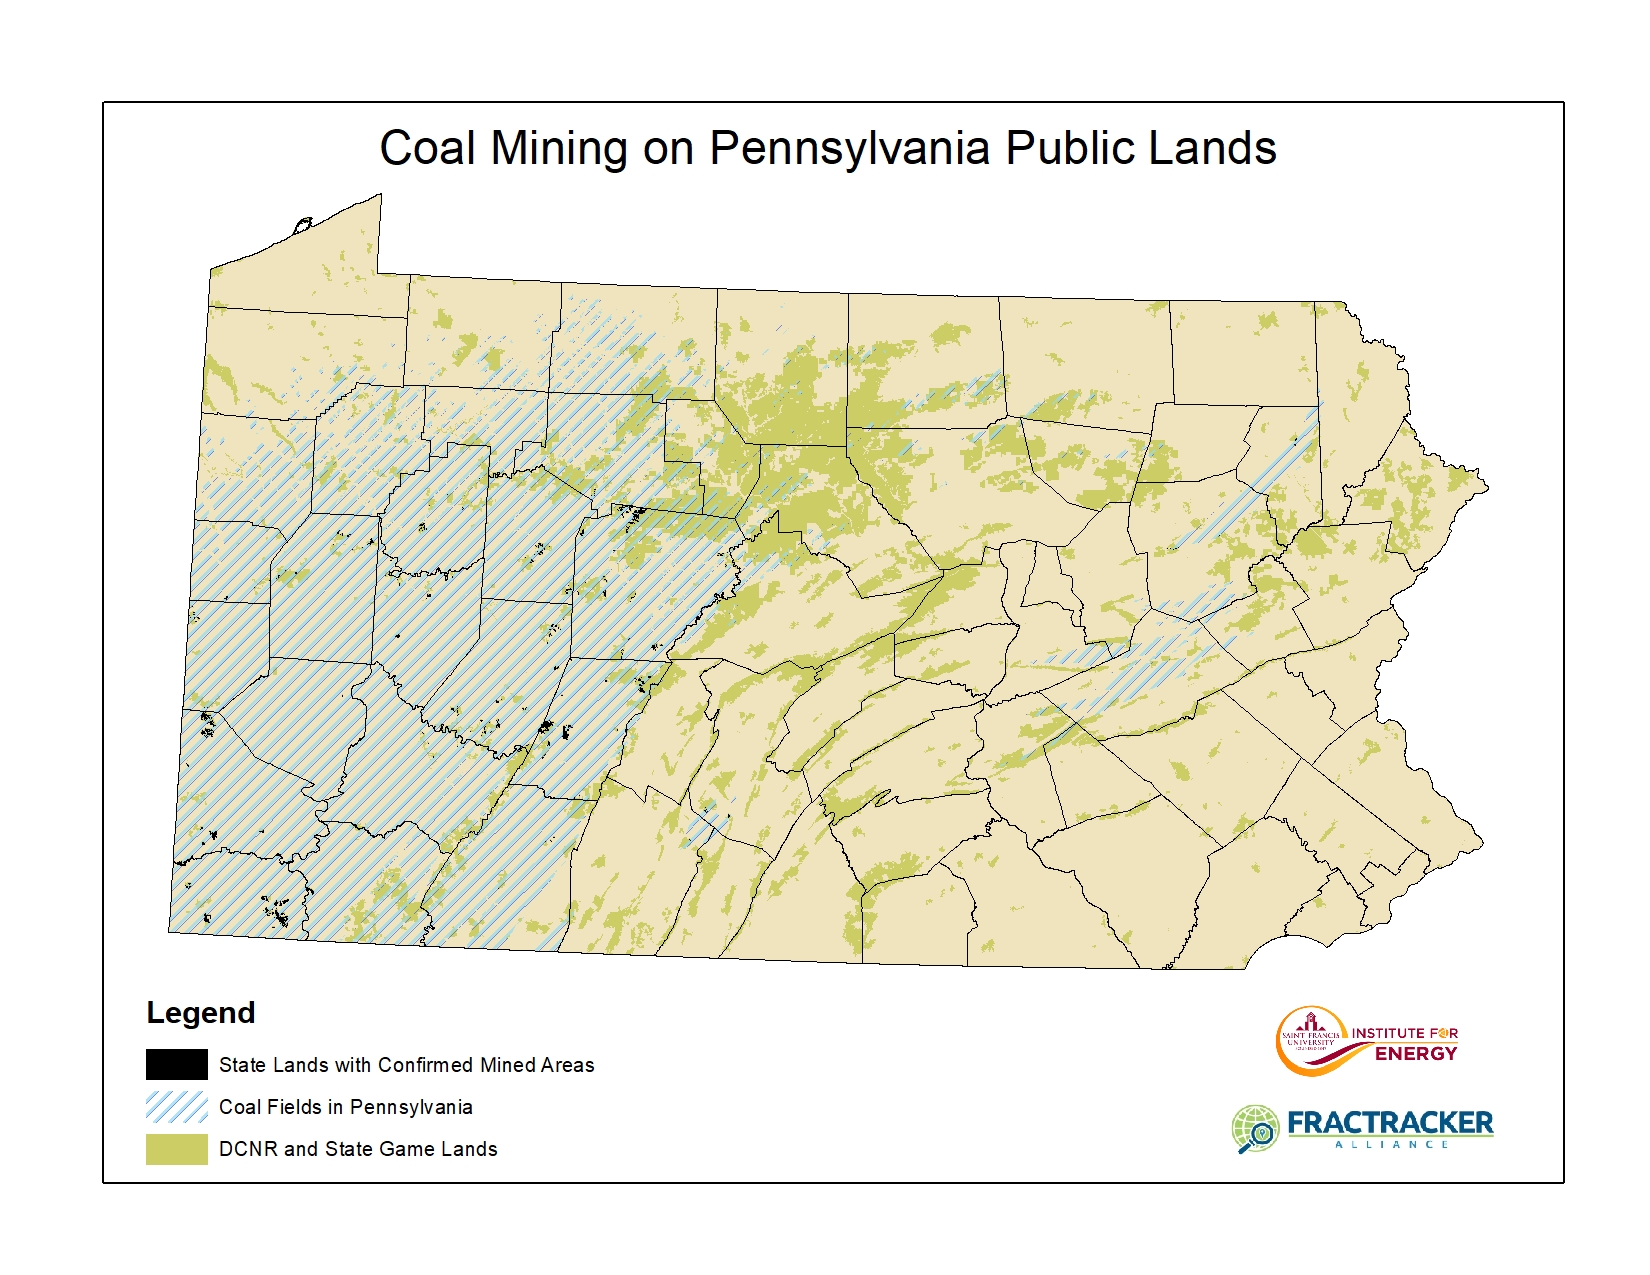
Originally, we sought to quantify the total acreage of public lands affected by coal mining and abandoned mines; however, the dataset required to do so is not yet complete.
The Pennsylvania Department of Environmental Protection is currently in the process of digitizing over 84,000 hand drawn maps of mined coal seams in PA, an expected 15-year project.
Today, they have digitized approximately 30,000. The static map below demonstrates the areas with confirmed coal mining co-located on state lands:
Renewables
The discussion about renewable energy development in PA is almost as complex as the fossil industries. There are no utility-scale renewables on state owned land. Both DCNR and the Game Commission have been approached by developers to lease state land for wind development, however all proposals have been denied.
Even when DCNR owns the surface rights, they still cite the lack of legal authority to lease the land for wind, as their statute does not explicitly state “wind turbines” as a lawful lease option.
The Game Commission does have the legal authority to lease its land for wind development, but has denied 19 out of 19 requests by developers to do so, citing many environmental and surface disturbances as the primary reason.
The development of wind projects in PA has slowed in the past five years, with only one new commercial wind farm being built. This is due to a variety of reasons, including the fact that many of windiest locations on private lands have been developed.
We estimate that 35% of the state’s best wind resource is undevelopable simply because it is on public land.
Like all energy development, wind energy has potential environmental and health impacts, too. Wind could cause habitat fragmentation issues on land purposed for conservation. The wind energy industry also has realized negative effects on bird and bat species, most notably, the endangered Indiana bat. Health impacts unique to public lands and wind development include an increased risk of injury to hunters and recreators related to potential mechanical failure or ice throw off the blades. Unlike fossil energies, however, wind energy has potential to offset air emissions.
We estimate that wind development on PA public lands could offset and estimated 14,480,000 tons of CO2 annually if fully developed.
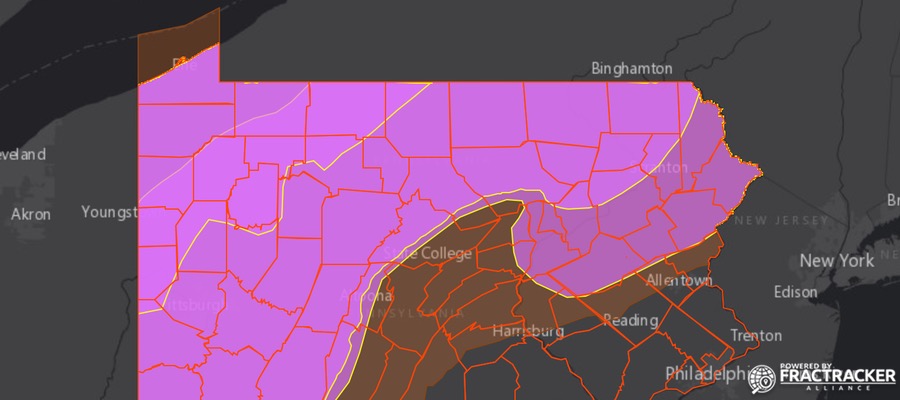
Commercial wind turbines are currently being installed at hub heights of 80-100 meters where the annual average wind resource is 6.5 m/s or greater. The following map demonstrates areas of Pennsylvania where the wind speeds are 6.5 m/s or greater at 100 meters, including areas overlapping state lands, where no utility scale development has occurred.
Biomass is organic material, such as wood, that is considered renewable because of its ability to be replenished. The harvesting of such wood (timber) occurs on both DCNR and PGC lands and provides funding for these agencies.
Small-scale wind, solar, hydro, geothermal, and biomass projects do exist on PA public lands for onsite consumption, however no renewables exist on a commercial or utility scale.
Both the fossil and renewable energy industries are forecasted to grow in Pennsylvania in the years to come. The complex decisions and obligations to develop energy resources on PA public lands should include thoughtful management and fair use of these public lands for all energy resources.
For more information and details, check out the entire comprehensive report on our website: www.francis.edu/energy.
This work was supported by The Heinz Endowments.
https://www.fractracker.org/a5ej20sjfwe/wp-content/uploads/2017/12/PA-State-Lands-Drilling-Lenker.jpg400900Guest Authorhttps://www.fractracker.org/a5ej20sjfwe/wp-content/uploads/2025/09/2025-Wordmark-Logo.pngGuest Author2017-12-19 11:42:542021-04-15 15:02:04Energy development is happening on your state lands, Pennsylvania
In October, Al Gore’s Climate Reality Project invigorated Pittsburgh like an autumn breeze. Never before had 1,400 people assembled in the region for the shared purpose of solving the climate crisis. The ground almost shook from the positive energy. It was induced seismicity of a better kind.
About the Climate Reality Project
The event occupied the David Lawrence Convention Center, a LEED Platinum facility providing the ultimate venue for a training session about saving our planet. The Nobel Laureate and former Vice President, joined by notable scientists, dignitaries, and communication experts, peppered three-days with passion and insight. The participants – who had to complete a rigorous application to attend – came from Pennsylvania, other states, and other countries. Their backgrounds were as diverse as their geographic origins. Seasoned activists were joined by faith leaders, students, educators, researchers, philanthropists, public health professionals, and business persons. A deep concern about humanity’s future was the common bond.
Together, we comprised the largest Climate Leadership Corps class ever. There are now more than 13,000 well-prepared voices speaking truth to power around the world to accelerate clean energy and foster sustainability. The ranks will continue to rise.
Unequivocal facts and figures affirmed that time is running out unless we expedite our energy transition. Most people don’t question gravity, but some question climate change despite scientific certainty about both. Jumping off a cliff is deadly and so is leaping off the metaphorical cliff of denial. When it comes to these issues, we were taught to find and focus on shared values. Everyone, even the cynic, cares about a person, place, or thing that will be irrevocably affected by man-made climate chaos.
Good for the planet, people, and jobs
Everyone needs a job, and embracing renewables and building smart, efficient energy systems creates a lot of them. In the U.S., solar energy jobs are growing 17 times faster than the overall economy.[1] Today, there are over 2.6 million Americans employed in the solar, wind, and energy efficiency sectors.[2] These safe, well-paying positions will continue to grow over time, but they’ll grow faster if government at every scale accelerates the new economy with supportive policies, programs, decisions and resources. In the process, we’ll build wealth and opportunity. If we don’t do what’s needed and its fossil fuel business as usual, we’ll have polluted air, sickened landscapes, and an economy in decline.
Hope – a bridge to somewhere better
On the afternoon that training ends, the weather is unusually warm and has been for days, another reminder that normal is long gone. Hope fills the void. I walk the Rachel Carson Bridge, named for the conservation giant who warned of the dangers of putting unfettered profit before the good of people and nature. Atop her bridge, wind turbines whirl, whispering intelligent tidings to all who will listen.
If you’d like to schedule a hope-filled climate reality project presentation in your community, please contact us at info@fractracker.org
How long will unconventional oil and gas production from PA’s Marcellus Shale continue? The number of active wells may give us a clue.
We have recently updated the PA Shale Viewer, our map of unconventional wells in Pennsylvania. As I updated the statistics to reflect the updated data, I noticed that the number of wells with an active status ticked downward, just as it had for the previous update.
Wells on this map are shown in purple when zoomed out, but are organized by status as you continue to zoom in. The various statuses are shown below, as defined by the Pennsylvania Department of Environmental Protection (DEP).
Active – permit has been issued and well may or may not have been drilled or producing, but has not been plugged.
Proposed but Never Materialized – permit was issued, but expired prior to the commencement of drilling.
Plugged OG Well – permit issued and well has been plugged by well operator.
Operator Reported Not Drilled – permit issued, but operator reported to DEP that they never drilled the well.
DEP Abandoned List – an abandoned well that has been inspected by DEP.
DEP Orphan List – A well abandoned prior to April 18, 1985, that has not been affected or operated by the present owner or operator and from which the present owner, operator or lessee has received no economic benefit other than as a land.
DEP Plugged – a DEP Abandoned or DEP Orphan well that has been plugged by DEP,
Regulatory Inactive Status – a well status that is requested by well operator and has been granted by DEP. Well is capable of producing, but is temporarily shut in. Granted for initial 5 years and must be renewed yearly after first 5 years.
Abandoned – a well that has not been used to produce, extract or inject any gas, petroleum or other liquid within the preceding 12 months; for which equipment necessary for production, extraction or injection has been removed; or considered dry and not equipped for production.
Life Expectancy Stats
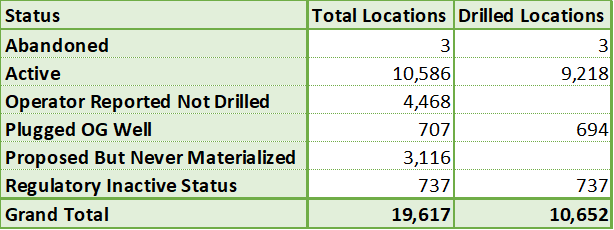
Table 1: Unconventional well locations in Pennsylvania by status. The determination of drilled locations was made by the presence of a spud date in the DEP dataset.
Currently, there are 10,586 well locations with an active status, 9,218 of which have been drilled. There 19,617 unconventional well locations in Pennsylvania when considering all status types, 10,652 of which have been drilled. The drill status was determined by whether or not there was an associated spud date in the dataset. The 13 plugged wells that lack spud dates likely represent some minor data entry errors of one sort or another, as a well would logically need to be drilled prior to being plugged.
Using the available data, we can see that 6.5% of drilled unconventional wells have been plugged, and an additional 6.9% have a regulatory inactive status, more commonly known as “shut-in” wells, leaving 86.5% of the drilled wells with an active status. Three wells are classified as abandoned, including two in Washington County attributed to Atlas Resources, LLC, and one operated by EQT Production Co. in Jefferson County. EQT submitted a request to convert the status of this latter well to inactive status in February 2016, but DEP has not made a decision on the application as of yet.
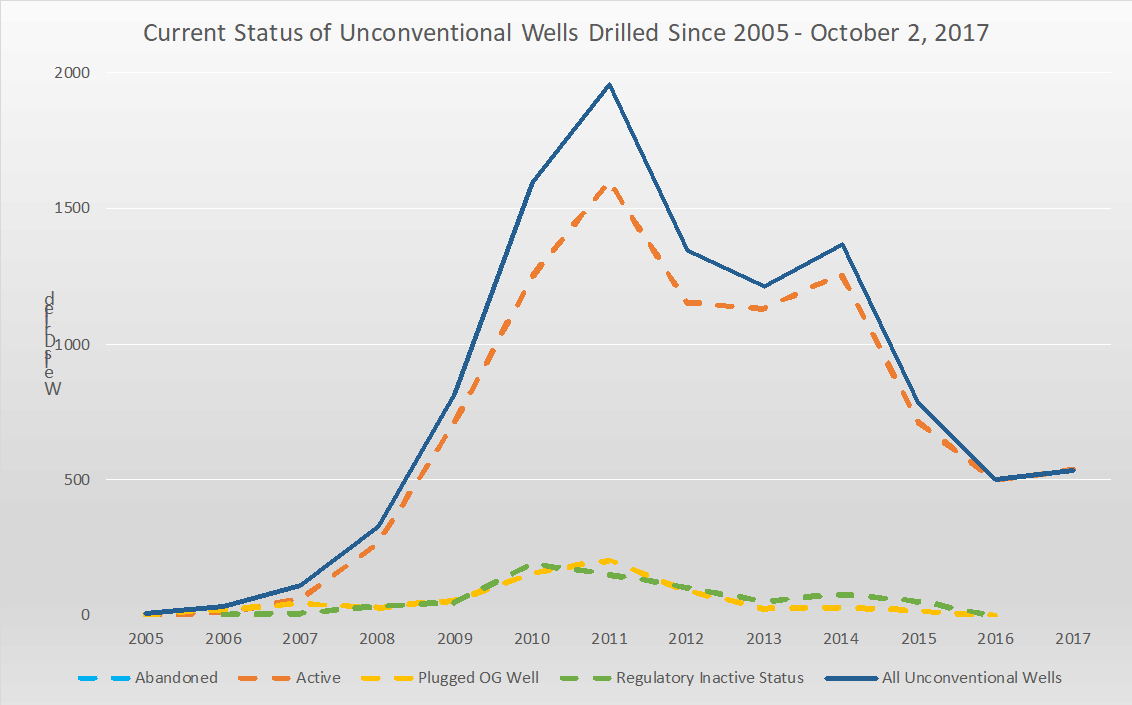
Chart 1: This chart shows the current status of unconventional wells in Pennsylvania, arranged by the year the well was drilled. Note that there are two abandoned wells in 2009 and one more in 2014, although those totals are not visible at this scale.
The top, solid blue line in Chart 1 shows the total number of unconventional wells drilled in Pennsylvania, which is based on the available spud date in the dataset. Focusing on this line for a moment, we can see a huge spike in the number of wells drilled in the early part of this decade. In fact, over 46% of the unconventional wells in the state were drilled between 2010 and 2012, and over 70% were drilled between 2010 and 2014. The 504 unconventional wells drilled in 2016 represents just over one quarter the total from 2011, when 1,959 wells were drilled. The 2017 totals are already slightly higher than 2016, with two months left to go in the year, but will not approach the totals from 2010 to 2014.
This drop-off in drilling since the 2011 peak is usually attributed to the glut of natural gas that these wells produced, and the Marcellus remains a highly productive formation, despite the considerable decline in new wells. Eventually, however, the entire formation will go into decline, which is already happening to the Barnett Shale in Texas and Haynesville Shale, among others, where peak production was several years ago in each case.
While all of three of these formations still produce significant quantities of gas, it is worth remembering that production is only half of the equation. In the Marcellus region, average costs were $6.6 million in 2014, which was projected to decrease to $6.1 million per well in 2015 according to a 2016 EIA document.
With the supply in the northeast outpacing demand, the gas prices stay low, and therefore production per well needs to be considerable to make a given well worthwhile.
Plugging Trends
Chart 2: Average days between spud date and plug date for unconventional wells in PA. Regulatory Inactive wells also include a plug date, and are included here.
Chart 2 shows the average number of days between the spud date and the plug date for wells that currently have either a plugged (n=694) or regulatory inactive (n=737) status. The regulatory inactive wells are relatively consistent in the days between when the well is drilled and temporarily plugged, which makes sense, as the operators of these wells typically intend for these wells to be shut-in upon completion.
However, it is interesting to note that wells are being plugged much more rapidly than they had been in the early part of the Marcellus boom.
Plugged unconventional wells that were drilled in 2005 (n=6) had an average of 3,081 days between these dates, while those drilled in 2016 (n=2) had and average span of 213 days.
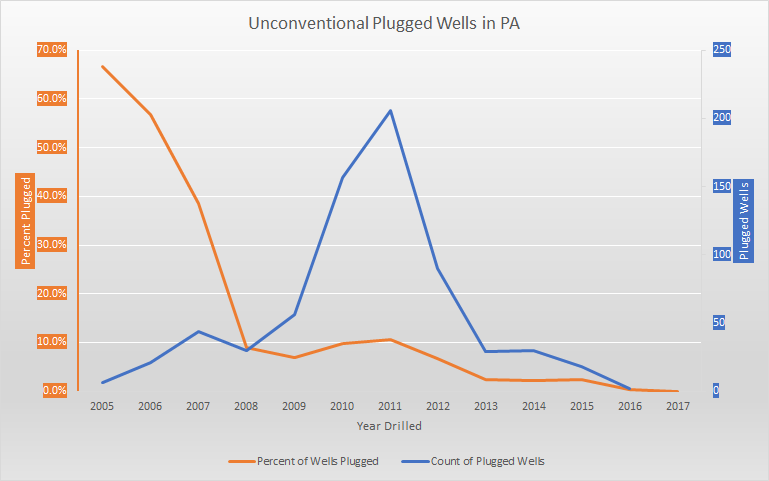
The left (orange) axis represents the percentage of wells drilled in each year that are currently drilled. The right (blue) axis marks the total number of wells drilled in each year that are currently drilled.
Obviously there would be no way for a well drilled in 2016 to have been online for 3,081 days before being plugged. However, each of the six plugged wells drilled in 2005 were active for at least 1,899 days before being sealed, which is over five years of activity. In contrast, 99 of the 4,966 unconventional wells drilled in the previous 1,899 days have already been plugged, representing 5.2% of the total wells drilled during that time. This means that we are seeing more “misses” at this point in the formation’s history, where the amount of gas being produced doesn’t justify keeping the well open and offsetting the $6 million or more that it cost to drill the well.
We can also see that the rate of plugged wells increases dramatically after about ten years in operation. Forty-four out of 114 (39%) of unconventional wells that were drilled in 2007 are now plugged. That ratio grows two thirds of the nine wells drilled in 2005. In the industry’s boom period of 2010 to 2010, the raw number of plugged wells are elevated, peaking at 206 in 2011, but the percentage of plugged wells during those years remains proportional to the rest of the trend. The overall trend shows that an unconventional well in Pennsylvania that lasts 11 or more years is unusual.
The data show that older Marcellus wells in Pennsylvania are certainly in a state of decline, and are rapidly being plugged. While the overall production of the field remains high, it remains to be seen what will happen as the boom cycle wells drilled from 2010 to 2012 start to go offline in considerable numbers. Given that more and more wells are being drilled with very short production lives, will it continue to make sense for the industry to drill expensive wells in a formation where a return on investment is increasingly questionable? This course is difficult to predict, but economic models that take plentiful natural gas supplies for granted should consider taking a second look.
PA Shale Viewer Data Sources
Unconventional Violations
Source: PADEP
Date Range: 1-1-2000 through 10-2-2017
Notes: For the original data, follow link above to “Oil and Gas Compliance Report”. Latitude and longitude data obtained by matching with permits data (see below). There are 7,655 rows of violations data, including 6,576 distinct Violation IDs issued to 2,253 distinct unconventional wells. Due to the large number of records, this layer isn’t visible until users zoom in to 1:500,000, or about the size of a small county.
Unconventional Wells and Permits
Source: PADEP Open Data Portal
Date Range: 1-1-2000 through 10-2-2017
Notes: This data layer contains unconventional well data in Pennsylvania. However, not all of these wells have been drilled yet. This layer is categorized by well status, which includes Abandoned, Active, Operator Reported Not Drilled, Plugged OG Well, Proposed but Never Materialized, and Regulatory Inactive Status. To determine whether the well has been permitted, drilled, or plugged, look for the presence of an entry in the Permit Date, Spud Date, and Plug Date field, respectively. Altogether, there are 19,617 wells in this inventory, of which 10,586 currently have an active status. Due to the large number of records, this layer isn’t visible until users zoom in to 1:500,000, or about the size of a small county.
SkyTruth Pits (2013)
Source: SkyTruth
Date Range: 2013
Notes: Prior to December 2014, this map contained a layer of pits that were contained in Oil and Gas Locations file available on PASDA. However, that layer was far from complete – for example, it included only one pit in Washington County at a time which news reports mentioned that seven pits in the county were scheduled to be closed. Therefore, we have opted to include this crowdsourced layer developed by SkyTruth, where volunteers analyzed state aerial imagery data from 2013. SkyTruth’s methodology for developing the dataset is detailed in the link above. 529 pits have been identified through this effort.
Compressors and Processors (2016)
Source: EDF, CATF, Earthworks, FracTracker Alliance, EPA, PADEP, EIA
Date: 2016
Notes: This layer is based off of publicly available data, but is not published by any agency as a dataset. It is the result of a collaborative effort, and the data first appeared in map format on the Oil and Gas Threat Map (oilandgasthreatmap.com). Original sources include PADEP, US EPA, and US EIA. Compiling, processing, and geocoding by Environmental Defense Fund, Clean Air Task Force, Earthworks, and FracTracker Alliance. Contact Matt Kelso for more information: kelso [at] fractracker.org.
Environmental Justice Areas
Source: PADEP, via PASDA
Date: 2015
Notes: Environmental Justice (EJ) areas are Census Tracts where over 20 percent of the population is in poverty, or over 30 percent of the population is non-white. The program is designed to monitor whether there is a fair distribution of environmental benefits and burdens. In Pennsylvania, EJ areas tend to be clustered in urbanized areas, particularly near Philadelphia and Pittsburgh.
Counties
Source: US Census Bureau, FracTracker Alliance
Date Range: 2011
Notes: This file was created by dissolving the Municipalities layer (below) to the county level. This method allows for greater detail than selecting the Pennsylvania counties from a national file.
Municipalities
Source: US Census Bureau
Date Published: 2011
Notes: Viewer must be zoomed into scales of 1:1,500,000 (several counties) or larger to access.
Watersheds – Large
Source: USDA/USGS
Date Published: 2008
Notes: Clipped to outline of Pennsylvania.
Watersheds – Small
Source: USDA/USGS
Date Published: 2008
Notes: Clipped to outline of Pennsylvania. Viewer must be zoomed into scales of 1:1,500,000 (several counties) or larger to access.
By Matt Kelso, Manager of Data and Technology, FracTracker Alliance
https://www.fractracker.org/a5ej20sjfwe/wp-content/uploads/2017/10/Marcellus-PA-Feature.jpg400900Matt Kelso, BAhttps://www.fractracker.org/a5ej20sjfwe/wp-content/uploads/2025/09/2025-Wordmark-Logo.pngMatt Kelso, BA2017-10-11 09:56:342021-04-15 15:02:31What is the Life Expectancy of the Marcellus Shale?
Award to be presented to three environmental stewards addressing oil and gas impacts at reception held in Pittsburgh, PA, November 18th
WASHINGTON, DC – October 5, 2017 – Three community advocates were recently selected by a panel of judges to receive the 2017 Community Sentinel Award for Environmental Stewardship, presented this year by Americans Against Fracking, Earthworks, FracTracker Alliance, Halt the Harm Network, and Stop the Frack Attack – sponsored by the 11th Hour Project. Award recipients were chosen because of their steadfast determination to highlight and address the impacts of the oil and gas industry in communities across the United States. The 2017 Community Sentinel Award winners are:
Ranjana Bhandari – Arlington, Texas
Frank Finan – Hop Bottom, Pennsylvania
Ray Kemble – Montrose, Pennsylvania
This year’s recipients, nominated by their peers, have lead campaigns to prevent wastewater injection wells from being permitted near drinking water reservoirs; documented fugitive air emissions using their own personal FLIR cameras; and fought cancer and legal attacks from oil and gas companies simultaneously.
These awardees truly represent the heart of local heroes working tirelessly to safeguard their communities from fracking and its collateral impacts, while at the same time encouraging a national transition to safer, renewable forms of energy…
… remarked Brook Lenker, Executive Director of FracTracker Alliance, the organizer of the award partnership.
Recipients were selected by a committee of community defense leaders: Bill Hughes of Wetzel County Action Group, West Virginia; Pat Popple of Save the Hills Alliance, Wisconsin; Sierra Shamer of Shalefield Organizing Committee, Pennsylvania; Dante Swinton of Energy Justice, Maryland; and Niki Wong of Redeemer Community Partnership, California.
The three recipients will each be awarded $1,000 for their efforts and recognized at an evening reception at the Omni William Penn Hotel in Pittsburgh, Pennsylvania on Saturday, November 18, 2017 during the People vs. Oil and Gas Infrastructure Summit.
Learn more about the third annual Community Sentinel Award for Environmental Stewardship, or purchase tickets to the reception for $40 (includes award ceremony and reception, heavy hors d’oeuvres, and a drink).
# # #
About FracTracker Alliance
FracTracker Alliance is a national organization with regional offices in Pennsylvania, New York, Ohio, Washington DC, and California. The organization’s mission is to study, map, and communicate the risks of oil and gas development to protect our planet and support the renewable energy transformation. Learn more at fractracker.org.
https://www.fractracker.org/a5ej20sjfwe/wp-content/uploads/2016/06/SentinelAward-Feature.jpg400900FracTracker Alliancehttps://www.fractracker.org/a5ej20sjfwe/wp-content/uploads/2025/09/2025-Wordmark-Logo.pngFracTracker Alliance2017-10-05 12:30:152021-04-15 15:02:332017 Community Sentinel Award for Environmental Stewardship Recipients
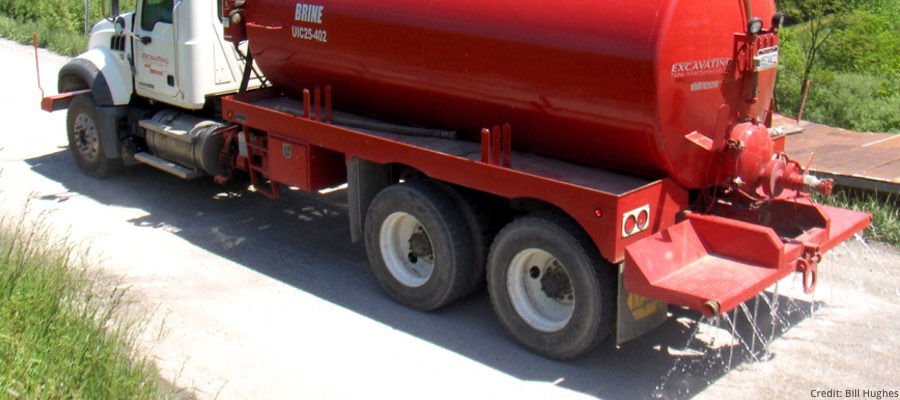
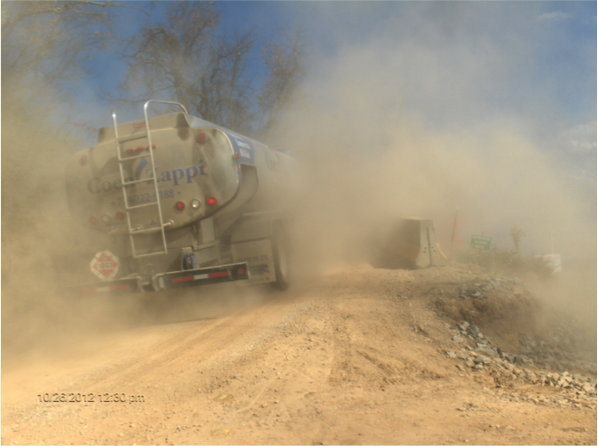
This 2015 photo from West Virginia illustrates that large trucks on dirt roads create a legitimate dust problem, which impacts both air and water quality.
The application of liquid oil and gas waste from conventional wells onto roadways for dust control and road stabilization is permitted in Pennsylvania, provided that operators adhere to plans approved by the Department of Environmental Protection (DEP). There are brine spreading guidelines that operators are required to follow, but overall, DEP considers roadspreading to be a beneficial use of the liquid oil and gas waste products.
Dust suppression is a legitimate concern, particularly in areas that see a lot of heavy truck traffic on dirt roads, such rural oil and gas fields. Prolonged exposure to airborne dust contributes to a number of different health problems, ranging from temporary irritation to debilitating diseases of the heart, lungs, and kidneys. This road dust can also impact aquatic life, from plants to aquatic insects to fish.
While applying liquid waste from the oil and gas industry undoubtedly seems like a convenient solution to dusty roads, is roadspreading really advisable?
In the map above, the areas in green are municipalities where liquid waste from Pennsylvania’s conventional wells were applied to roadways in 2016. The purple areas are counties where additional quantities of the liquid waste were applied in cases where the exact municipality was not specified on the 2016 waste report. The majority of the state’s oil and gas roadspreading remains in Pennsylvania, but some of the brine is spread on roads in New York, as well.
What’s in the brine?
In Pennsylvania, the large-scale extraction efforts from deep carbon-rich shales like the Marcellus and Utica formations are classified as unconventional oil and gas, whereas the shallower formations requiring smaller amounts of hydraulic fracturing stimulation to bring the wells into production are considered to be conventional.
While the chemical components of these brines vary from formation to formation, in general they are known for containing high-salinity toxic metals, such as barium and strontium, as well as volatile organic compounds including benzene. Bromide in the brine can interact with purification processes at treatment plants to create carcinogenic compounds called trihalomethanes. These compounds actually created a problem in the early parts of the Marcellus boom in Western Pennsylvania, when large enough quantities of bromide were added to the region’s rivers and streams. And of particular concern is naturally occurring radioactive materials (NORMs), which sometimes occur at very high concentrations, even in brines from conventional wells.
The Pennsylvania Geological Survey commissioned Evan Dresel and Arthur Rose from Penn State to investigate oil and gas brine from a sample of 40 wells in 1985, although the accompanying paper wasn’t published until 2010. Their samples included dissolved solids of 343,000 milligrams per liter, and radium occurring at up to 5,300 picocuries per liter. As a point of comparison, the US Environmental Protection Agency mandates that drinking water not exceed 5 picocuries per liter, and the authors of this report express concern about the high levels shown in these brines.
Based on the six samples analyzed, radium shows a general correlation with barium and strontium and an inverse correlation with [sulfate], though the correlation is not perfect. The radium values are high enough that a possible radiation hazard exists, especially where radium could be adsorbed on iron oxides and accumulate in brine tanks.
The article’s preface, written in 2010, echoes the concern, stating, ” the very high radium contents indicate that caution should be used in handling these brines.” One imagines that the radium content might also be a concern for people walking their dogs along dirt roads where these brines are spread.
Testing for radiological contamination appears to be insufficient for liquid oil and gas waste. Ben Stout, PhD, a professor of Biology at Wheeling Jesuit University (and a FracTracker Alliance board member) sampled liquid waste from Marcellus Shale wells in 2009. Here is what he found:
In terms of radiation, 9 of the 13 samples exceeded the drinking water standard for radium. Furthermore, 7 of the 13 samples exceeded the drinking water standard for gross alpha particles, which are a strong indicator of radioactivity. Most notably, one sample from a frac pit at the Phillips #20 site in Westmoreland County, PA yielded a gross alpha reading of 4846 +/‐ 994 picocuries per liter (pCi/L), though the drinking water standard is 15 pCi/L. In fact, the same sample had combined radium readings well over 1,000 pCi/L, a multiple in excess of 200 times the (5 pCi/L) standard. It should be noted that none of the samples triggered a response from radiation meters.
What to do?
From environmental concerns of high salinity to health concerns about the toxic and radiological content of oil and gas brines, intentionally introducing this waste product to public spaces is a dubious practice. It is understandable that township supervisors would want to use readily available materials for dealing with dust control on dirt roads, but if you are concerned about the practice and your area is indicated on the map above, you may wish to contact them to find out where this waste is being spread in greater detail.
By Matt Kelso, Manager of Data and Technology, FracTracker Alliance
https://www.fractracker.org/a5ej20sjfwe/wp-content/uploads/2017/08/Roadspreading-Hughes-Feature.jpg400900Matt Kelso, BAhttps://www.fractracker.org/a5ej20sjfwe/wp-content/uploads/2025/09/2025-Wordmark-Logo.pngMatt Kelso, BA2017-08-30 11:16:492021-04-15 15:02:34Does roadspreading of brine equate to oil and gas waste dumping?