The majority of FracTracker’s posts are generally considered articles. These may include analysis around data, embedded maps, summaries of partner collaborations, highlights of a publication or project, guest posts, etc.
Recently, the Pennsylvania Department of Environmental Protection (DEP) started to offer additional data resources with the introduction of the Open Data Portal. This development, along with the continued evolution of the ArcGIS Online mapping platform that we utilize has enabled some recent enhancements in our mapping of Pennsylvania oil and gas infrastructure. We’ve made changes to the existing Pennsylvania Shale Viewer for unconventional wells, and created a Conventional and Historical Wells in Pennsylvania map.
Unconventional Wells
Rather than defining the newer, industrial-scaled oil and gas wells by specific geological formations, configuration of the well, or the amount of fluid injected into the ground during the hydraulic fracturing process, Pennsylvania’s primary classification is based on whether or not they are considered to be unconventional.
Unconventional Wells – An unconventional gas well is a bore hole drilled or being drilled for the purpose of or to be used for the production of natural gas from an unconventional formation. An unconventional formation is defined as a geologic shale formation below the base of the Elk Sandstone or its geologic equivalent where natural gas generally cannot be produced except by horizontal or vertical well bores stimulated by hydraulic fracturing.
The previous structure of the PA Shale Viewer had separate layers for permits, drilled wells, and violations. This version replaces the first two layers with a single layer of unconventional locations, which we have called “Unconventional Wells and Permits” for the sake of clarity. The violations layer appears in the same format as before. When users are zoomed out, they will see generalized layers showing the overall location of O&G infrastructure and violations in the state, which were formed by creating a one mile buffer around these features. As users zoom in, the generalized layers are then replaced with point data showing the specific wells and violations. At this point, users can click on individual points and learn more about the features they see on the map.
Figure 1. PA Shale Viewer zoomed in to see individual wells by status
O&G locations are displayed by their well status, as of the time that FracTracker processed the data, including: Abandoned, Active, Operator Reported Not Drilled, Plugged OG Well, Proposed but Never Materialized, and Regulatory Inactive Status. Note that just because a well is classified as Active does not mean that it has been drilled, or even necessarily permitted. These milestones, along with whether or not it has been plugged, can be determined by looking for entries in the permit issue date, spud date, and plug date entries in the well’s popup box.
Conventional and Historical Wells
The map below shows known conventional wells in Pennsylvania along with additional well locations that were digitized from historical mining maps.
Although there are over 19,000 unconventional oil and gas locations in Pennsylvania, this figure amounts to just 11% of the total number of wells in the state that the DEP has location data for, the rest being classified as conventional wells. Furthermore, in a state that has been drilling for oil and gas since before the Civil War, there could be up to 750,000 abandoned wells statewide.
The DEP has been able to find the location of over 30,000 of these historical wells by digitizing records from old paper mining maps. This layer has records for 16 different counties, but well over half of these wells are in just three counties – Allegheny, Butler, and Washington. It looks like it would take a lot more work to digitize these historical wells throughout the rest of the state, but even when that happens, we will probably still not know where the majority of the old oil and gas wells in the state are located.
An Ohio family took joy in raising their kids and cattle at their farmhouse, built in 1853 with crooked walls and no indoor bathrooms. When they leased land to fracking activity, however, the “beep, beep, beep” of heavy truck traffic kept them up all night, and a cow died after drinking a strange fluid flowing on the land during the cold of winter. They dedicated their retirement savings to moving and building a new home, only to soon after receive a compressor station as their neighbor – close enough to hear the engines at all hours and loud enough to make them dread even walking out to their mailbox.
During the upswing of a boom-and-bust cycle of the gas industry in Greene County, the influx of outside workers and the high demand on rental housing resulted in one particular family being unable to secure an apartment. Without adequate housing, their children were temporarily taken from their custody.
In Huntingdon, a young woman resisted a pipeline being forced through her property by stationing herself in a tree, while workers with chainsaws felled those around her. Eminent domain enabled the gas company to claim this privately-owned land under a weak guise of “public good.”
These unsettling but true stories hint at the countless ways fracking plays out in individual households. A healthy home environment – with clean air, potable drinking water, and safety from outside elements – is essential to human life and functioning. Yet, the industrial processes involved in unconventional oil and gas development (UOGD), often summed up with the term “fracking,” may interfere with or even take away the ability to maintain a healthy home.
This article aims to put these household impacts, and the right to a healthy home, at the center of the fracking debate.
Framing the issue
The way we understand just about anything depends on our frame of reference. A frame, like the frame around a picture, brings its contents into focus. At the same time, it excludes the information outside its borders. A frame declares that what’s inside is what matters. When it comes to the human effects of fracking, various conflicting frames exist, each dictating their own picture of what fracking actually does and means.
The frame we use to look at the fracking debate is so important, because it dictates how we talk about and think about the problem. Likewise, if we can identify the frame others are using when they talk about fracking, we can see more clearly what they have prioritized and what they are leaving out of the conversation.
Two researchers who conducted surveys, interviews, and focus groups in five Pennsylvania counties in 2014 and 2015 argue for the need for a new frame.1 Some of the common ways of talking about fracking not only favor shale gas development for reasons like those included in the frame on the left above, they also work against those trying to make a stand against the negative effects fracking. These researchers suggest that, rather than arguing within the existing, dominant frames, activists should consider proactively “reframing the debate around other core values.” The right to a healthy home is a widely-shared value. I propose we adopt a frame that puts that right at the center of the picture.
What is a “healthy home”?
The term healthy home isn’t new. The federal agencies Housing and Urban Development (HUD) and the Centers for Disease Control (CDC) both use this phrase in defining the importance of a home environment free from hazards and contaminants, like lead and radon. Simply put, a healthy home is one that supports health.
Why Now?
We sit poised at a unique moment to take on the task of reframing fracking. While new drilling in some places appears to be on the decline, countless large-scale petrochemical projects, like a growing crop of plastic-producing ethane crackers in the northeast US, are ramping up. These facilities will demand massive supplies of natural gas and byproducts, perpetuating and likely increasing drilling.
Engagement is urgent and timely,2 and the entire country has a role to play. This moment in our energy history is a chance for all of us – those affected by, in favor of, concerned about, eager to welcome, or otherwise learning about UOGD – to get clear on our frame of understanding fracking.
A pipeline right-of-way, about 200 yards behind this house and children’s swingset, shows how close fracking infrastructure comes to homes. Photo credit: Leann Leiter
Why a “Healthy Homes” Frame?
Proponents of frames that endorse fracking often live at a considerable distance from the processes involved,3 buffering them and their families from its impacts. According to researchers4 who listened to the testimonies of residents at a community hearing, the distance they lived from the industrial activities shows up in how they talk about fracking. Those in favor tend to use a depersonalized, “birds-eye view” in describing the impacts. People for whom the negative impacts are or will be a part of their lives rely on more descriptive, specific, and place-based language.
Similarly, a frame that focuses on household impacts emphasizes the on-the-ground, lived experience of living near fracking infrastructure. This frame approaches the debate on fracking by continually asking, what is this like for the people who live with the process? What are the impacts to their home environment? Such a frame does not ignore large-scale issues of jobs and energy supply, but grounds these bigger questions with the real and urgent consequences to the people who are suffering.
Household impacts
Despite rulings that define UOGD as an industrial process, drilling companies locate all manner of infrastructure – wells, pipelines, compressor stations, among others – in areas formerly residential or agricultural. Rules dictating distances from UOGD facilities to structures like houses vary by municipality and state. Yet, these new and often imposing facilities repeatedly occupy the immediate view of homes, or are within close proximity that defy medical and safety warnings.
Video: Glaring light of burning flares and noises both droning and sudden, along with major truck traffic and other changes to the immediate landscape around the household, produce high levels of stress, leading to its own health problems, creating an environment where water may become unsafe to drink and breathing the air becomes a hazard.
The Oil & Gas Threat Map (by Earthworks and FracTracker) shows the populations within a half-mile “threat radius” of infrastructure that includes fracking – close enough for residents to be exposed to contaminated air emissions, and possibly smell disturbing odors, hear loud sounds and feel vibrations, and see bright lights and the fire of emergency flares. As confirmed by the EPA, in some cases, UOGD results in contamination of drinking water, as well.
Researchers at The Environmental Health Project (EHP) offer individual health assessments to residents living in the shadow of fracking operations. In a physician’s thorough review of over 61 assessments, they identified the following symptoms to be temporally related to gas activity:
Table 1. Symptoms temporally related to UOGD
SYMPTOM CATEGORY
n
%
Symptom
n
%
UPPER RESPIRATORY SYMPTOMS
39
64%
Nose or throat irritation
25
41%
Sinus pain or infections
17
28%
Nose bleeds
8
13%
CONSTITUTIONAL SYMPTOMS
33
54%
Sleep disruption
26
43%
Fatigue
13
21%
Weak or Drowsy
9
15%
NEUROLOGICAL SYMPTOMS
32
52%
Headache
25
41%
Dizziness
11
18%
Numbness
9
15%
Memory loss
8
13%
PSYCHOLOGICAL SYMPTOMS
32
52%
Stress or anxiety
23
38%
Irritable or moody
12
20%
Worry
6
10%
LOWER RESPIRATORY SYMPTOMS
30
49%
Cough
21
34%
Shortness of breath
19
31%
Weezing
14
23%
GASTRO-INTESTINAL SYMPTOMS
27
44%
Nausea
13
21%
Abdominal pain
12
20%
EYE SYMPTOMS
23
38%
Itchy eyes
11
18%
Painful or dry
10
16%
DERMATOLOGICAL SYMPTOMS
19
31%
Rash
10
16%
Itching
7
11%
Lesions or blisters
6
10%
CARDIAC SYMPTOMS
17
28%
Palpitations
9
15%
Chest pain
6
10%
Other cardiac symptoms
6
10%
HEARING CHANGES OR TINNITUS
10
16%
Hearing loss
3
5%
Tinnitus (ringing in the ear)
10
16%
MUSCULOSKELETAL
10
16%
Painful joints
9
15%
Aches
7
11%
ENDOCRINE
7
11%
Hair loss
7
11%
n = Number of patients reporting symptom, out of 61 patients assessed
% = Percentage of patients reporting symptom, out of 61 patients assessed
Mental and emotional stress can exacerbate and create physical health symptoms. For households close to fracking, the fear of a disaster, like a well pad fire, or concern for the long term health effects of exposures through air and water can create serious stress. These developments change communities, sometimes in divisive, negative ways, potentially adding to the stress.
Fracking, a disruptive, landscape-altering process can also produce what’s called solastalgia, whereby negatively-perceived changes to the land alter a person’s sense of belonging. In the case of fracking in residential areas, people may lose not only their relationship to the land, but their homes as they once knew them.5 Solastalgia, considered by some researchers to be a new psycho-social condition, is “the lived experience of the physical desolation of home.”6
When Home is Unsafe, Where to Get Help
Click to expand and explore the tri-fold. Click here to access and print this free resource, and many others by EHP.
EHP offers a new resource for protecting your health at a household level, called: “Protecting Your Health from Unconventional Oil and Gas Development.” We created this free informational resource in collaboration with residents and health care providers in four different shale gas counties.
The final product is the direct result of input and knowledge from 15 focus groups and project meetings in these affected communities with over 100 participants, including residents and healthcare providers. EHP has packed this resource with practical steps for households amid shale gas development to limit their exposure to air and water contamination that may be associated with fracking.
For follow-up questions, or for free personalized health services for those experiencing fracking-related exposures, you can contact EHP directly at 724-260-5504 or by email at info@environmentalhealthproject.org.
Re-Centering Home in the Fracking Debate
Putting affected households at the center of the fracking debate better reflects the experiences of people on the front lines. This powerful frame could help counter the power of those who speak positively about fracking, but lack direct experience of the process.
For those at the frontlines of fracking, the intent is that these resources and tools will help you protect your health and your homes.
For those not yet directly affected by fracking, you can lend a hand. Show support for health protective measures by signing up at EHP for updates on events, education, and opportunities to make your voice heard. And, whenever and wherever you can weigh in on the debate, put a frame around fracking that puts impacted households at the center.
References
Cooley, R., & Casagrande, D. (2017). Marcellus Shale as Golden Goose. ExtrACTION: Impacts, Engagements, and Alternative Futures.
Short, D., Elliot, J., Norder, K., Lloyd-Davies, E., & Morley, J. (2015). Extreme energy, ‘fracking’ and human rights: a new field for human rights impact assessments?, The International Journal of Human Rights, 19:6, 697-736, DOI:10.1080/13642987.2015.1019219
Cooley, R., & Casagrande, D. (2017). Marcellus Shale as Golden Goose. ExtrACTION: Impacts, Engagements, and Alternative Futures.
Mando, J. (2016). Constructing the vicarious experience of proximity in a Marcellus Shale public hearing. Environmental Communication, 10(3), 352-364.
Resick, L. K. (2016). Gender, protest, and the health impacts of unconventional natural gas development. In Y. Beebeejaum (Ed.), The participatory city (pp. 167-175). Berlin: Jovis Verlag GmgH.
Albrecht et al (2007). Solastalgia: the distress caused by environmental change, Australasian Psychiatry . Vol 15 Supplement.
By Leann Leiter, Environmental Health Fellow for the SW-PA Environmental Health Project and FracTracker Alliance
Feature photograph: A compressor station sits above a beautiful farm in Washington County, Pennsylvania. Photo credit: Leann Leiter
In this series of articles on the Susquehanna River Basin, FracTracker has explored the relationship between oil and gas extraction and the overall health of the watershed relative to oil and gas extraction impacts. We began with a basic overview of likely relationships, followed by an analysis of oil and gas violations relative to resources available for monitoring water quality changes. In the most recent article we assessed the corresponding effects of extraction on deforestation and habitat loss. With the rapid expansion of oil and gas drilling over the past decade, many have also formed legitimate concerns about threats to public and private water supplies. In the final article of the series we look closely at this issue, at the complexities of assessing risks to water supplies, while also highlighting recent research shedding new light on the nature of these risks.
Pennsylvania’s Hydrological System
The Susquehanna River is home to more than 3.3 million people who depend on the river and its tributaries for drinking water. The basin also feeds thousands of businesses that require water for their operations, such as manufacturing facilities, farms, golf courses, and more. In some instances, water supplies are fed by groundwater wells, which are in turn fed by underground aquifers of different depths. In other cases, water supplies are drawn from intake points in nearby lakes, rivers, and streams.
Figure 1: Map of PA’s groundwater aquifer system.
While many believe underground and surface water systems are somehow discrete, this is far from the case. Groundwater is a major contributor to rivers, lakes, and wetlands – as they are all connected through the hydrological cycle. Some precipitation runs directly into streams. But much of it filters through soil and rock into shallow and deep aquifers. Aquifers then carry water over the course of months, years, and even centuries, into larger water bodies. The most common discharge points are from springs and from low-lying wetlands. The figures above (figure 1) and below (figure 2) illustrate Pennsylvania’s four major aquifer types, compiled by Penn State Extension.
Figure 2: Types of groundwater aquifers in PA.
Assessing Groundwater Supply Risks
Managing the overall health of the hydrological cycle is of critical importance to the 3.3 million people who live in the Susquehanna River Basin. However, oil and gas extraction poses significant risks to the state’s water sources. As we have detailed in prior articles in this series, accidents and spills can cause chemicals and hydraulic fracturing fluids to run off into nearby watersheds. Growing evidence also suggests that groundwater can be contaminated by migrating hydraulic fracturing fluids.
Figure 3: Number of household and public water supply groundwater wells by state (DCNR).
In one study, conducted by Columbia University in 2016, researchers found elevated levels of dissolved calcium, chlorine, sulfates and iron in lowland drinking wells within one kilometer of a drilling site compared to baseline averages. In lowland wells more than a kilometer away, they found elevated levels of methane, sodium, and manganese. Elevated levels dropped off in wells on higher ground, which suggests the hydraulic fracturing process affects shallow and deep groundwater sources along different timelines.
According to the PA Department of Conservation and Natural Resources (DCNR), Pennsylvania ranks second in the nation for total number of groundwater wells, second for number of private drinking wells, and third for number of public water supplies dependent on groundwater wells (figure 4). However, determining how many groundwater wells may be at risk to oil and gas extraction is complicated for a variety of reasons. First, DCNR acknowledges that only about half (480,000) of the 1 million groundwater wells in the state are documented. Registration of groundwater wells only began in 1955, and detailed information including latitude and longitudinal coordinates only came into being in the 1980s. These records are now maintained in the PA Groundwater Inventory System (PAGWIS). It is worth noting that the PA Department of Environmental Protection (DEP) does not regulate private drinking water wells. They are only required to respond to pollution complaints.
Correlating O&G Wells to Complaints Data
Despite these data gaps, we can still learn a lot from the wells that are documented in PAGWIS. For instance, we compared the location of groundwater wells to oil and gas related complaints and found some interesting correlations. The below map can be used to explore these relationships.
Map of at-risk groundwater wells, public water supplies, and citizen complaints
The first stage our analysis involved narrowing the PGWIS registered groundwater wells in the Susquehanna Basin to those that are actively used for drinking water, agriculture, and irrigation (66,306 total). We then limited to those within 1 kilometer of an oil and gas well, essentially mirroring the distances used by the Columbia University study. We found 2,551 groundwater wells within this “risk zone” of 1 kilometer.
For our second stage, we utilized research conducted by Public Herald, an investigative reporting team that spent three years reviewing oil and gas related complaints submitted to the DEP from 2004-2016. They found 9,442 total complaints, of which 43% were water related (surface and groundwater), and that the frequency of complaints track with the rise and fall of unconventional oil and gas development (figure 5).
Figure 4: Relationship of complaints to O&G development (Public Herald).
From the Public Herald dataset, we found 1,573 total complaints were in the Susquehanna River Basin, of which 65% were water related complaints — a much higher percentage than the larger dataset’s average. We then compare the location of these complaints to our “risk zone” groundwater wells and found a statistically significant correlation between the number of groundwater wells within 1km of oil and gas activity and higher numbers of complaints by residents. What do these findings tell us?
In short, where we see more groundwater wells in proximity to an oil and gas well, we also see more water related complaints to the DEP.
The below graph illustrates this relationship (figure 6).
Figure 5: Relationship of complaints to at-risk groundwater wells.
Groundwater to Surface Water Risks
DCNR estimates that Pennsylvania’s streams and wetlands get about 2/3 of their flow from groundwater sources. Meanwhile, there are 786 public water suppliers in the Susquehanna River Basin that are fed by different arrangements of groundwater and surface water sources. These suppliers are included in the interactive map for reference.
Assessing risks to public water supply systems is equally complicated to that of groundwater wells. The DEP regulates public water suppliers under the Safe Drinking Water Act, but the general public is not permitted to know the location of actual water sources or intake points due to security risks. This restriction poses a problem for nongovernmental organizations when doing analyses that would benefit from knowing the locations of these source points. Nevertheless, like our breakdown of risk zone groundwater wells, we can still learn a great deal from what we do know of public water supplies.
Figure 6: Wellsboro, PA, public water supply with O&G wells and citizen complaints in the supply’s watershed.
For instance, the town of Wellsboro, in Tioga County, is home to an estimated 3,300 people. The Wellsboro Municipal Authority supplies water to Wellsboro residents as well as to 1,000 people in surrounding Charleston and Delmar Townships. According to DEP records, groundwater and surface water sources for this system come from Hamilton Lake and tributaries of the Charleston Creek Watershed, much of which is designated as high-quality coldwater fisheries. Nevertheless, there are seven unconventional oil and gas wells in this watershed, one of which is only 400ft from Charleston Creek, just upstream from Hamilton Lake.
The area is also one of the brightest hot-spots for complaints to the DEP in the Public Herald dataset, with 40 water related complaints in Charleston and Delmar townships.
These relationships should be of particular concern to residents who believe their water is protected from extraction industry activities. In addition, while recent research suggests homes values can be negatively affected in neighborhoods dependent on private well water near drilling activity, correlations between potential groundwater and surface water pollution suggest that any changes in home value are more a matter of perceived rather than actual risk—homes on public water supplies should also be considered at risk in communities experiencing extraction.
Conclusion
Returning to the hydrological cycle, we can assume that pollutants from oil and gas extraction, like precipitation, will eventually find their way into larger water bodies, either directly through runoff into watershed tributaries or through groundwater migrations. While this article has primarily focused on the Pennsylvania headwaters of the Susquehanna, home to 570,000 residents, and risks to their water sources, groundwater complaints are not the exclusive problem of residents who are dependent on private drinking water wells. “We all live downstream” as the saying goes, and those who rely on the watershed for their drinking water and other water resource needs throughout the watershed should be concerned by the correlations illustrated in our analysis.
By Kirk Jalbert, Manager of Community based Research & Engagement, FracTracker Alliance
https://www.fractracker.org/a5ej20sjfwe/wp-content/uploads/2017/06/water-cycle-featured.jpg400900FracTracker Alliancehttps://www.fractracker.org/a5ej20sjfwe/wp-content/uploads/2025/09/2025-Wordmark-Logo.pngFracTracker Alliance2017-06-20 10:17:232021-04-15 15:02:41Risks to Water Supplies in PA’s Susquehanna Basin
Over 50% of land in the United States is dedicated to agriculture. Oil and gas development, particularly hydraulic fracturing or “fracking,” is taking place near many of these farms.
Farms feed us, and unfortunately they are not protected from the impacts of fracking. Even if drilling can be done responsibly, accidents happen. In Colorado, for example, two spills occur on average per day, 15% of which result in water contamination. [1] Risking our food supply is not only a risk to our health – it’s a risk to national security.
Food Independence
Rocky Mountain apple orchard. Photo by Celia Roberts
Domestic oil and gas production has been promoted by the industry as a means to provide the U.S. with energy independence. The argument goes something like this: “We need to be a net exporter of energy so as to reduce our reliance on foreign countries for these resources, especially countries in the Middle East.” This ignores the point that for energy security we might want to keep rather than export fossil fuels.
However, energy independence and food independence are inextricably linked.
Considering that the basic human needs are clean water, food, shelter, and safety — along with energy — we need to think about self-reliance; we can’t be dependent on foreign countries for our food. The U.S. is currently a net exporter of agricultural products, and California produces 50% of the food consumed in the U.S. But what would happen if our foodsheds became contaminated?
Drilling Proximity – Why the concern?
Front Range, Colorado working landscape at risk of unconventional oil & gas drilling. Photo by Rita Clagget
Over 58% of US agricultural market value and 74% of US farms – both conventional and organic – operate within shale basins, active shale plays, and the primary frac sand geologies.
Why is this so important? Why be concerned? Here are just a few reasons:
People can be exposed to the compounds involved with oil and gas extraction through spills, emissions, and other processes. The top five health impacts associated with these chemicals are: respiratory, nervous system, birth defects, and reproductive problems, blood disorders, and cancer.[2]
Rural gas gathering pipelines are unregulated; operators have no obligation to publicly report about incremental failures along the pipeline that may contaminate soil and water as long as they don’t require evacuations.[3]
Oil and gas operators are exempt from certain provisions of several environmental laws designed to protect public health and safety, including the Safe Water Drinking Act, The Resource Conservation and Recovery Act, The Emergency Planning and Community Right-to-Know Act, The Clean Water Act, The Clean Air Act, and The Comprehensive Environmental Response, Compensation, and Liability Act. These exemptions, in a way, permit oil and gas operators to contaminate water supplies with chemicals from their operations, in particular hydraulic fracturing fluids and produced wastewater.[4]
The gold standard of clean, chemical-free food is the USDA National Organic Program Standards, as governed by the Organic Foods Production Act. Unfortunately, organic certification does not require testing for oil and gas chemicals in water being used in organic production. The organic standard is satisfied as long as state, water, and food safety agencies deem the water safe. To our knowledge these agencies do not test for oil and gas chemicals.[5]
Based on available data spills occur regularly. Recent research has identified that the mixture of chemicals from fracking fluid and produced wastewater interact in a way that can lead to soil accumulation of these chemicals. Potentially, then, the chemicals may be absorbed by plants.[6] Fifteen chemicals often used in fracking have been identified as toxic, persistent and fast-traveling.[7] Some farms – such as those in Southern California – are being irrigated with produced water from oil and gas operations. Additionally, every single farm in the San Jaoquin Valley is within eight miles of oil and gas operations.[8]
There is significant Competition for water between natural gas production and agriculture. This includes growing commodity crops for energy, such as ethanol. Natural gas operations result in removing water quantity available for agriculture, and changing the water quality, which affects the agricultural product. In drought stricken areas, water scarcity is already an issue. In addition, extreme heat as a result of climate change is putting more stress on farmers operating in already depleted watersheds. Layered on all of this is the growing realization that precipitation regimes are gradually – and in many places dramatically – transitioning from many smaller and more predictable events to fewer, more intense, and less predictable rain and snow events which is are harder for the landscape to capture, process, and store for agricultural and/or other uses.
Operating costs: Farmers are already operating under razor- thin margins, with the cost of inputs continually increasing and the resilience of the soils and watersheds they rely upon coming into question with unconventional oil and gas’ expansion across the Midwest and Great Plains.
Public Lands
Over 45% of lands in the Western United States are owned by the federal government. Opening up public lands—by the Bureau of Land Management, United State Forest Service in particular—is controversial on multiple levels. As it relates to food security and independence, the issue often missed is that many headwaters to prime farmland reside on federal lands, along with the majority of cattle grazing.
There isn’t enough private land in the West for oil and gas operators to reach their production goals. They have to drill on public lands in order to scale up production and develop an export market for domestic natural gas. This means that public lands, taxpayer funded public lands, could potentially be used to irreparably harm prime agricultural and grazing lands (foodsheds). More alarming, is that the Trump Administration is focused on unfettered development, extraction and distribution of natural gas resources, including opening up public lands to oil and gas leasing and gutting regulations that protect us from pollution and public health risks.
The map we have developed shows that many of the largest farms in the West are surrounded by public lands. Sixty-percent of Colorado farms are surrounded by public lands, which are within shale basins or active shale plays. Four of the top natural gas producing counties in Colorado are also four of the top agricultural producing counties: Weld, Mesa, Montezuma, and LaPlata counties. The third, fifth, sixth, eighth and tenth agricultural producing counties in the State are surrounded by public lands within shale basins, respectively,: Larimer, Delta, El Paso, Montrose and Douglas counties. The 6,325 farms in these counties represent 17% of all Colorado farms, and 29% (nearly half) of Colorado at-risk farms for being surrounded by public lands and within shale basins.
Colorado: Public lands surround majority of farms.
Colorado: Map zoomed into 3 of top agricultural producing and natural gas producing counties in Colorado, illustrating how they are surrounded by public lands.
These farms, headwaters, and public lands need to be protected if we are to maintain food independence and security. Producing potentially contaminated food is neither food independence, nor food security.
Policy Implications
Why should policy makers and health insurers care? Chronic and terminal illnesses are on the rise. Healthcare costs have nowhere to go but up as long as the environment we live in, the food we eat, the water we drink, and the air we breathe continue to be polluted at such a large scale. Attempts to reduce healthcare costs by insuring all Americans will have no impact if they are all sick. The insurance model only works when there are more healthy people in the pool than unhealthy people.
Mapping Conventional & Organic U.S. Farms
Below is an interactive map showing agricultural production in the U.S. You can use the map to zoom in at the county level to understand better the type of agricultural production taking place, as well as the value of the agricultural products at the county level.
U.S. Conventional and Organic Farms and Their Productivity Near Shale Plays and Basins
This map excludes Alaska for a variety of reasons[9]. We include over 180 unique data points for each county across five categories: 1) Crops and Plants, 2) Economics, 3) Farms, 4) Livestock and Animals, and 5) Operators. We then break these major categories into 20 subcategories.
Table 1. Subcategories Utilized in the “US Shale Plays and Basins Along with Agricultural Productivity By County” map above
Categories
Subcategories
Crops and Plants
Field Crops Harvested
Fruits, Tree Nuts, Berries, Nursery and Greenhouse
Hay and Forage Crops Harvested
Seed Crops Harvested
Vegetables and Melons Harvested
Economics
Buildings, Machinery and Equipment on Operation
Farm Production Expenses
Farm-Related Income and Direct Sales
Farms by Value of Sales
Market Value of Agricultural Products Sold
Farms
Agricultural Chemicals Used
Farms
Farms by Size
Farms by Type of Organization
Land in Farms and Land Use
Livestock and Animals
Livestock, Poultry, and Other Animals
Operators
Characteristics of Farm Operators
Hired Farm Labor
Primary Occupation of Operator
Tenure of Farm Operators and Farm Operations
Analysis Results
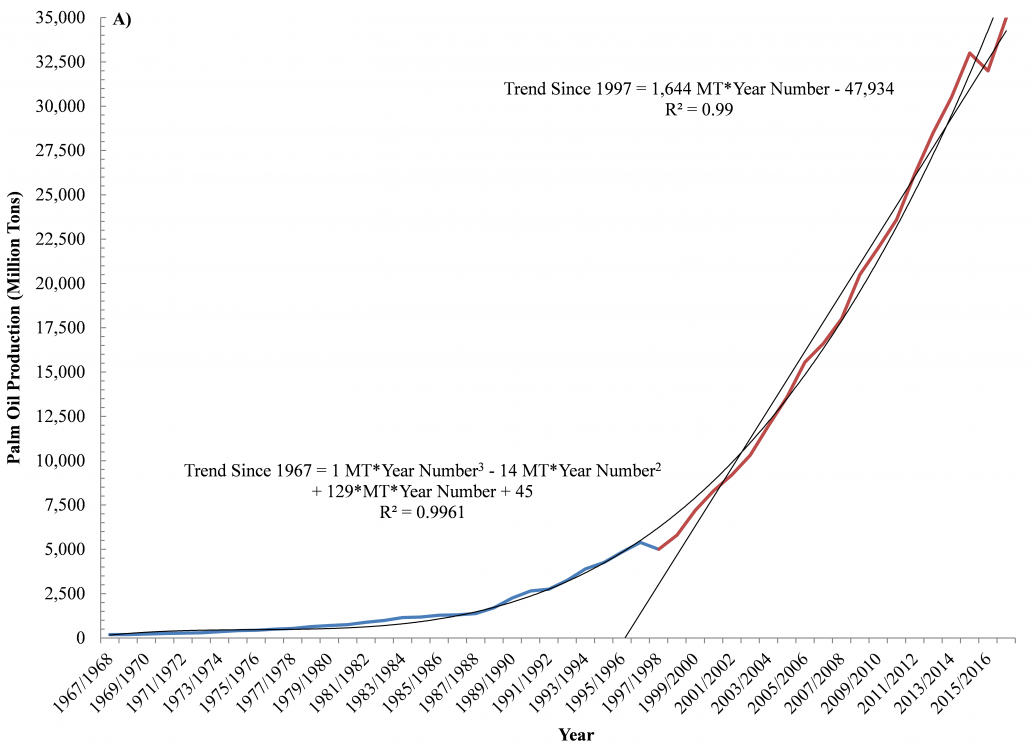
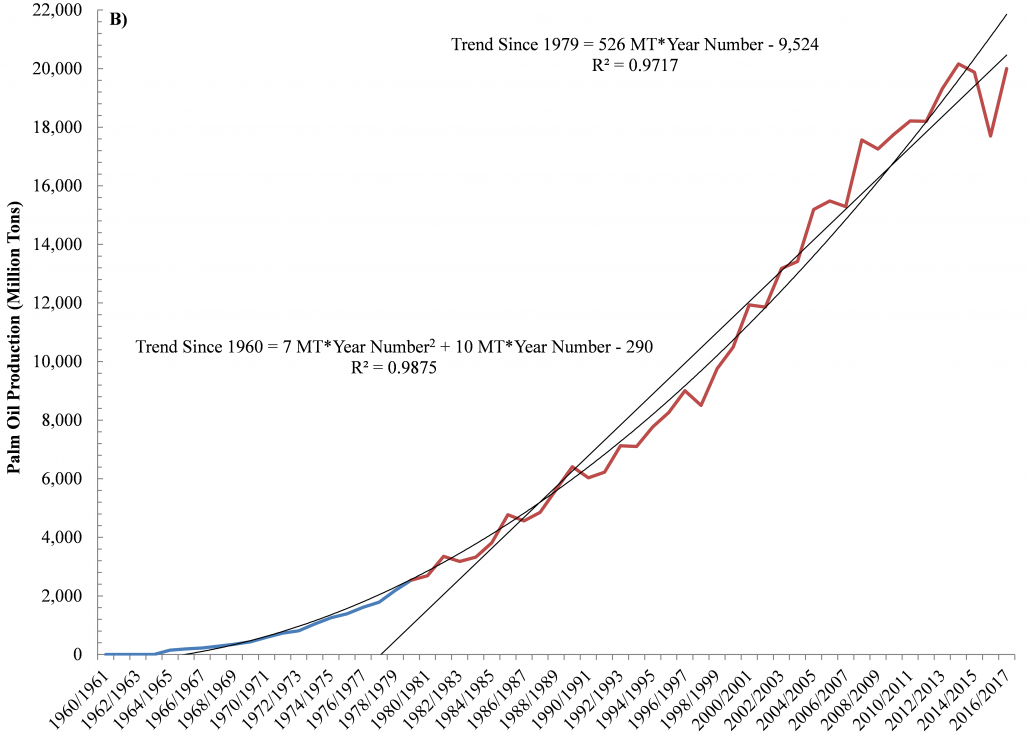
In total, there are 589,922 and 1,369,961 farms in US Shale Plays and Basins, respectively, averaging between 589 and 646 acres in size and spread across 2,146 counties (Figure 1). These farm counties produce roughly $87.31- 218.32 billion in agricultural products each year with the highest value per-acre being the Monterey and Monterey-Temblor Formations of Southern California, the Niobrara Formation in North Central Colorado, Eastern Barnett in North Central Texas, the Antrim in Michigan, and the Northern Appalachian Shale Basins of Pennsylvania, New York, and Ohio (Figures 2a/2b). Roughly 52% of all agricultural revenue generated in US Shale Play counties comes from livestock, poultry, and derivative products vs. a national average of 44% (Figure 3).
Put another way, the value of US Shale Basin agricultural infrastructure would rank as the 9th largest economy worldwide, between Italy and Brazil.
Family-owned farms are at the greatest risk. While corporations tend to own larger acreage farms, only 8.2% of US farms are owned by corporations. This figure is nearly halved in US Shale Plays, with 4.5% of farms owned by corporations, or 95% owned by families or individuals.
Figures 1, 2a, 2b, and 3 above show the number of farms near drilling, as well as variations in the value of agricultural products produced in those regions.
Risk vs. Benefits in CO
Oil and gas activity is regulated on a somewhat patchwork basis, but generally it is overseen at the state level subject to federal laws. New York and Maryland are the only two states that ban fracking, while communities around the country have invoked zoning laws to ban fracking or impose moratoriums on a smaller scale. However, in Colorado, the Colorado Oil and Gas Conservation Commission has exclusive jurisdiction over oil and gas regulation in the State. There, fracking bans imposed by local communities, with a large number of farms, have been found to be unconstitutional by the Colorado Supreme Court.
Weld County is Colorado’s leading producer of cattle, grain, and sugar beets. Weld is the richest agricultural county in the U.S. east of the Rocky Mountains, the fourth richest overall nationally, and the largest natural gas producer in CO. Compare this to the North Fork Valley on the Western Slope of CO, which is home to the largest concentration of organic farms in the state, one of two viticultural (wine making) areas in the state, and has a reputation for being a farm-to-table hub. Delta County, in which the North Fork Valley is located, is known for its sustainable agriculture initiatives. Uniquely, Delta County is one of the few agricultural areas in the country so far untouched by the fracking boom – but that could all change. The Bureau of Land Management is considering opening 95% of BLM lands and minerals within and surrounding Delta County to oil and gas leasing.
Protecting Food Supplies
Oil and gas extraction is taking place on both private and public lands across the country. Prime and unique agricultural lands need to be protected from these industrial activities if we are to maintain food independence and ensure a healthy food supply. As demonstrated by the map above, agricultural communities in active shale plays may already in trouble. To prevent further damages on day-to-day food staples, it is imperative to increase awareness about this consequential issue.
How can people trust that the food they eat is safe to consume? Families trust farmers, food brands, school and office cafeterias, and restaurants to the extent that the food supply chain is regulated and maintained. If most of the food produced in the U.S. is within active shale plays, and the water/soil is not being tested for oil and gas chemicals, that supply chain is at risk. The secure production of our food – via clean air, water, and soil – is tantamount to lasting food independence.
Farming Testimonials
I am the leader of Slow Food Western Slope, which functions as a chapter of Slow Food USA. We envision a world in which all people can eat food that is good for them, good for the people who grow it and good for the planet: good, clean and fair food for all. Our chapter promotes and supports over 70 farmers, orchardists, ranchers, agricultural businesses and winemakers of the North Fork Valley – all of which depend on good and clean water, air and soil. With its industrial footprint and potential damage to landscape, air, water, soil and human health, extraction industries have no place in the future of the North Fork Valley. We can build a new economy around clean food, outdoor recreation, healthy lifestyle and small nonthreatening businesses.
Jim BrettSlow Food Western Slope
Agricultural land is much more valuable in the long-run than the short-term gains promised from oil and gas extraction… As farmers we are attuned to crop, soil, and water conditions especially as a result of weather. If it’s too hot, too dry, too wet, too cold then there is no food. Natural gas extraction is an undeniable factor in changing climate and is incompatible with the practice of sustainable agriculture.
Mark WaltermireOwner of Thistle Whistle Farm in Hotchkiss, CO
References and More Information
FracTracker Alliance raised awareness of this issue in 2015 when it mapped the proximity of organic farms to oil and gas wells. In that mapping analysis, it was discovered that 11% of organic farms are within ½ mile of oil and gas development. Did you know that less than 1% of agricultural lands in the United States are used to grow crops without chemicals, and that 42% of those organic farms produce food for human consumption?
This research prompted the question of what about the other 99% of agricultural lands used to grow crops and raise livestock utilizing chemicals and other conventional methods in the United States. The majority of dairy, grains, beef, poultry, fruits, vegetables, and animal feed for livestock are produced on conventional farms. Where are they located, and do we know how they are being impacted by oil and gas development?
The majority of the US population lives in urban centers and is disconnected from the American farm, including how and where food is produced. People trust their farmer, food brands, school and office cafeterias, and restaurants to the extent that they trust their supply chain, and to the extent that the farmers trust their water supply and soils. If the majority of the food produced in the U.S. is within active shale plays, and the water and soil are not being tested for oil and gas chemicals, this research questions how people can trust that their food is safe to consume. If we are to maintain our food independence and health, not only do consumers need to understand that the food supply is at risk in order to exercise their rights to protect it at the local, state, and federal levels, but policymakers need to be informed with this data to make better decisions around oil and gas development regulations and development proposals that impact our foodsheds.
Issues with Alaskan agricultural data include incomplete reporting and large degrees of uncertainty in the data relative to the Lower 48.
By Natasha Léger, Interim Executive Director, Citizens for a Healthy Community and Ted Auch, Great Lakes Program Director, FracTracker Alliance
https://www.fractracker.org/a5ej20sjfwe/wp-content/uploads/2017/02/Agriculture-Feature-Feb2017.jpg400900Ted Auch, PhDhttps://www.fractracker.org/a5ej20sjfwe/wp-content/uploads/2025/09/2025-Wordmark-Logo.pngTed Auch, PhD2017-06-07 01:35:232021-04-15 15:02:42Health vs. Power – Risking America’s Food for Energy
In this forest fragmentation analysis, FracTracker looked at existing vegetation height in the northern portion of Pennsylvania’s Susquehanna River Basin. The vegetation height data is available from LANDFIRE, a resource used by multiple federal agencies to assess wildfire potential by categorizing the vegetation growth in 30 by 30 meter pixels into different categories. In the portion of Pennsylvania’s Susquehanna Basin where we looked, there were 29 total categories based on vegetation height. For ease of analysis, we have consolidated those into eight categories, including roads, developed land, forest, herbs, shrubs, crops, mines and quarries, and open water.
Methods
We compared the ratio of the total number of each pixel type to the type that was found at vertical and horizontal wells in the region. In this experiment, we hypothesized that we would see evidence of deforestation in the areas where oil and gas development is present. Per our correspondence with LANDFIRE staff, the vegetation height data represents a timeframe of about 2014, so in this analysis, we focused on active wells that were drilled prior to that date. We found that the pixels on which the horizontal wells were located had a significantly different profile type than the overall pixel distribution, whereas conventional wells had a more modest departure from the general characteristics of the region.
Figure 1 – Vegetation profile of the northern portion of Pennsylvania’s Susquehanna River Basin. The area is highly impacted by O&G development, a trend that is likely to continue in the coming years.
In Figure 1, we see that the land cover profile where vertical wells (n=6,198) are present is largely similar to the overall distribution of pixels for the entire study area (n=40,897,818). While these wells are more than six times more likely to be on areas classified as mines, quarries, or barren, it is surprising that the impact is not even more pronounced. In terms of forested land, there is essentially no change from the background, with both at about 73%. However, the profile for horizontal wells (n=3,787) is only 51% forested, as well as being four times more likely than the background to be categorized as herbs, which are defined in this dataset as having a vegetation height of around one meter.
Why Aren’t the Impacts Even More Pronounced?
While the impacts are significant, particularly for horizontal wells, it is a bit surprising that evidence of deforestation isn’t even more striking. We know, for example, that unconventional wells are usually drilled in multi-well pads that frequently exceed five acres of cleared land, so why aren’t these always classified as mines, quarries, and barren land, for example? There are several factors that can help to explain this discrepancy.
First, it must be noted that at 900 square meters, each pixel represents almost a quarter of acre, so the extent of these pixels will not always match with the area of disturbance. And in many cases, the infrastructure for older vertical wells is completely covered by the forest canopy, so that neither well pad nor access road is visible from satellite imagery.
The map above shows horizontal and vertical wells in a portion of Centre County, Pennsylvania, an area within our study region. Note that many of the vertical wells, represented by purple dots, appear to be in areas that are heavily forested, whereas all of the horizontal wells (yellow dots) are on a defined well pad in the lower right part of the frame. Panning around to other portions of Centre County, we find that vertical wells are often in a visible clearing, but are frequently near the edge, so that the chances of the 30 by 30 meter pixel that they fall into is much more likely to be whatever it would have been if the well pad were not there.
We must also consider that this dataset has some limitations. First of all, it was built to be a tool for wildfire management, not as a means to measure deforestation. Secondly, there are often impacts that are captured by the tool that were not exactly on the well site. For this reason, it would make sense to evaluate the area around the well pad in future versions of the analysis.
Figure 2 – A close up of a group of wells in the study area. Note that the disturbed land (light grey) does not always correspond exactly with the well locations.
In Figure 2, we see a number of light grey areas –representing quarries, strip mines, and gravel pits –with an O&G well just off to the side. Such wells did not get classified as being on deforested land in this analysis.
And finally, after clarifying the LANDFIRE metadata with US Forest Service personnel involved in the project, we learned that while the map does represent vegetation cover circa 2014, it is actually build on satellite data collected in 2001, which has subsequently been updated with a detailed algorithm. However, the project is just beginning a reboot of the project, using imagery from 2015 and 2016. This should lead to much more accurate analyses in the future.
Why Forest Fragmentation Matters
The clearing of forests for well pads, pipelines, access roads, and other O&G infrastructure that has happened to date in the Susquehanna Basin is only a small fraction of the planned development. The industry operates at full capacity, there could be tens of thousands of new unconventional wells drilled on thousands of well pads in the region through 2030, according to estimates by the Nature Conservancy. They have also calculated an average of 1.65 miles of gathering lines from the well pad to existing midstream infrastructure. With a typical right-of-way being 100 feet wide, these gathering lines would require clearing 20 acres. It isn’t unusual for the total disturbance for a single well pad and the associated access road to exceed ten acres, making the total disturbance about 30 acres per well pad. Based on the vegetation distribution of the region, we can expect that 22 of these acres, on average, are currently forested land. Taking all of these factors into consideration, a total disturbance of 100,000 to 200,000 acres in Pennsylvania’s Susquehanna River Basin due to oil and gas extraction, processing, and transmission may well be a conservative estimate, depending on energy choices we make in the coming years.
This forest fragmentation has a number of deleterious effects on the environment. First, many invasive plant species, such as bush honeysuckle and Japanese knotweed, tend to thrive in recently disturbed open areas, where competing native plants have been removed. The practice also threatens numerous animal species that thrive far from the forest’s edge, including a variety of native song birds. The disturbed lands create significant runoff into nearby rivers and streams, which can have an impact on aquatic life. And the cumulative release of carbon into the atmosphere is staggering – consider that the average acre of forest in the United States contains 158,000 pounds of organic carbon per acre. As the area is 73% forested, the total cumulative impact could result in taking 5.8 to 11.6 million tons of organic carbon out of forested storage. Much of this carbon will find its way into the atmosphere, along with the hydrocarbons that are purposefully being extracted from drilling operations.
https://www.fractracker.org/a5ej20sjfwe/wp-content/uploads/2017/06/Forest-Fragmentation-Feature.jpg400900Matt Kelso, BAhttps://www.fractracker.org/a5ej20sjfwe/wp-content/uploads/2025/09/2025-Wordmark-Logo.pngMatt Kelso, BA2017-06-06 10:09:452021-04-15 15:03:01Forest Fragmentation and O&G Development in PA’s Susquehanna Basin
How fragmented approvals and infrastructure favor petrochemical development
By Leann Leiter and Lisa Graves-Marcucci
Let’s think back to 2009, when oil and gas companies like Range Resources began drilling the northeast shale plays in earnest. Picture the various stages involved in drilling – such as leasing of land, clearing of trees, boring of wells, siting of compressor stations, and construction of pipelines to gather the gas. Envision the geographic scope of the gas infrastructure, with thousands of wells in Pennsylvania alone, and thousands of miles of pipelines stretching as far as Louisiana.
Figure 1. A pipeline right-of-way snakes behind a residential property in Washington County, PA. Photo credit: Leann Leiter
Now, picture the present, where a homeowner looks out over her yard and wonders how a lease she signed with Shell several years prior made it possible for the company to run an ethane pipeline across her property and between her house and her garage.
Think forward in time, to 2022, the year when a world-scale ethane cracker is set to go online in Beaver County, Pennsylvania, to begin churning through natural gas liquids from wells in PA and others, producing a variety of disposable plastic products.
At each of these moments in gas development, which of the many stakeholders – industry leaders, local governments, state regulatory agencies, or landowners and residents – were granted a view of the full picture?
The proposed Shell ethane cracker in Beaver County is an illustration of the fragmented nature of gas development. From the extensive web of drilling infrastructure required to supply this massive facility, to several years of construction, this project is a case-study in piecemeal permitting. Such fragmentation creates a serious barrier to transparency and to the informed decision-making that relies upon it.
In the first two articles in this series on the petrochemical development in Beaver County, we focused on ethane cracker emergency scenarios and how the area might prepare. In this article, we draw the lens back to take in the larger picture of this region-altering project and highlight the effects of limited transparency.
The “Piecemeal” Nature of Gas Development
All across the Pennsylvania, proposed industrial development – even coal operations – have historically provided to the public, elected officials, and regulatory agencies the extent or footprint of their planned operations. Nonetheless, the oil and gas industry has in several instances undertaken a practice of developing its extensive infrastructure piece-by-piece. Operators of these facilities first acquire a GP-5 General Permit, which is only available to certain oil and gas operations with “minor” emissions and which allows them to avoid having the permit undergo public notice or comment. These operators then add emissions sources and increases through a series of minor amendments. While they are required to obtain a “major” source permit once their modifications result in major emissions, they avoid the scrutiny required for a major source by this fragmented process.
Unlike most other industrial permitting, the gas industry has enjoyed a much less transparent process. Instead of presenting their entire planned operation at the time of initial permit application, gas operators having been seeking – and receiving – incremental permits in a piecemeal fashion. This process puts local decision makers and the women, men, and children who live, work, and go to school near gas development at a severe disadvantage in the following ways:
Without full disclosure of the entirety of the planned project, neither regulatory bodies nor the public can conduct a full and factual assessment of land use impacts;
Incremental approvals allow for ever-expanding operations, including issuance of permits without additional public notification and participation;
Piecemeal approvals allow operations to continuously alter a community and its landscape;
The fragmented approval process prevents consideration of cumulative impacts; and
Without full transparency of key components of the proposed operations, emergency planning is hampered or non-existent.
From the Well to the Ethane Cracker
In the fragmented approval process of gas development, the proposed ethane cracker in Beaver County represents a pertinent example. Developers of this massive, multi-year, and many-stage project have only revealed the size and scope in a piecemeal fashion, quietly making inroads on the project (like securing land leases along the route of the pipeline required for the cracker, years in advance of permit approvals for the facility itself). By rolling out each piece over several years, the entirety of the petrochemical project only becomes clear in retrospect.
A World-Scale Petrochemical Hub
While Shell is still pursuing key approval from the PA Department of Environmental Protection, industry leaders treat the ethane cracker as a foregone conclusion, promising that this facility is but one step in turning the area into a “petrochemical hub.”
The cracker facility, alone, will push existing air pollution levels further beyond their already health-threatening state. Abundant vacant parcels around Shell’s cracker site are attractive sites for additional spin-off petrochemical facilities in the coming “new industry cluster.” These facilities would add their own risks to the equation, including yet-unknown chemical outputs emitted into the air and their resulting cumulative impacts. Likewise, disaster risks associated with the ethane cracker remain unclear, because in the piecemeal permitting process, the industry is not required to submit Preparedness, Prevention, and Contingency (PPC) Plans until after receiving approval to build.
Figure 2. A portion of the extensive US natural gas interstate pipeline system stretching from the petrochemical hubs in the bayous of the Gulf Coast Basin to Pittsburgh’s Appalachian Basin. However, petrochemical development in the northeast may reverse or otherwise change that flow. Visualization created by Sophie Riedel, Carnegie Mellon University, School of Architecture. Data on interstate natural gas supply sourced from Energy Information Administration, Form EIA176 “Annual Report of Natural Gas and Supplemental Gas Supply and Disposition,” 2007.
92.3 Miles of Explosive Pipeline
More than just a major local expansion, communities downriver and downwind will be susceptible to the impacts, including major land disturbance, emissions, and the potential for “incidents,” including explosion. The pipeline required to feed the cracker with highly flammable, explosive ethane would tie the tri-state region into the equation, expanding the zone of risk into Ohio and crossing through West Virginia.
Figure 3. The Falcon Pipeline, which would be used to transport ethane to the cracker in Beaver County. At 92.3 miles long, it consists of two “legs,” starting from Scio and Cadiz, Ohio and Houston, PA, respectively, and extending up to the site of Shell’s ethane cracker. Credit: Shell Pipeline Company LP
Renewed Demand at the Wellhead
No one piece of the gas infrastructure stands alone; all work in tandem. According to the Energy Information Administration (EIA), the new US ethane crackers will drive consumption of ethane up by a 26% by the end of 2018. Gas wells in the northeast already supply ethane; new ethane crackers in the region introduce a way to profit from this by-product of harvesting methane without piping it to the Gulf Coast. How this renewed demand for ethane will play out at fracked wells will be the result of complex variables, but it will undoubtedly continue to drive demand at Pennsylvania’s 10,000 existing unconventional oil and gas wells and those of other states, and may promote bringing new ones online.
Figure 4. Excerpt from Executive Summary of IHS Markit Report, “Prospects to Enhance Pennsylvania’s Opportunities in Petrochemical Manufacturing.”
Along with drilling comes a growing network of gathering and transmission lines, which add to the existing 88,000 miles of natural gas pipeline in Pennsylvania alone, fragment wildlife habitat, and put people at risk from leaks and explosions. Facilities along the supply stream that add their own pollution and risks include pump stations along the route and the three cryogenic facilities at the starting points of the Falcon Pipeline (see Fig. 6).
Figure 5. Several yards of the 88,000 miles of gas pipelines cutting through Pennsylvania. Finleyville, PA. Credit: Leann Leiter
The infrastructure investment required for ethane crackers in this region could reach $3.7 billion in processing facilities, pipelines for transmitting natural gas liquids including ethane, and storage facilities. A report commissioned by Team Pennsylvania and the PA Department of Community and Economic Development asserts that “the significant feedstock and transportation infrastructure required” will “exceed what is typically required for a similar facility” in the Gulf Coast petrochemical hub, indicating a scale of petrochemical development that rivals that of the southern states. This begs the question of how the health impacts in Pennsylvania will compare to those in the Gulf Coast’s “Cancer Alley.”
Figure 6. Houston, PA Cryogenic and Fractionation Plant, one of three such facilities supplying feedstock to the proposed Shell ethane cracker. Credit: Garth Lenz, iLCP
Water Impacts, from the Ohio River to the Arctic Ocean
Shell’s facility is only one of the ethane crackers proposed for the region that, once operational, would be permitted to discharge waste into the already-beleaguered Ohio River. This waterway, which traverses six separate states, supplies the drinking water for over 3 million people. Extending the potential water impact even further, the primary product of the Shell facility is plastics, whose inevitable disposal would unnecessarily add to the glut of plastic waste entering our oceans. Plastic is accumulating at the alarming rate of 3,500 pieces a day on one island in the South Pacific and as far away as the waters of the Arctic.
Figure 7. View of the Ohio River, downriver from the site of Shell’s proposed ethane cracker. Existing sources of industrial pollution to the river include the American Electric power plants, coal loading docks, barges, coal ash lagoons, and dry coal ash beds shown in this picture, and at least two fracking operations within the coal plant areas. Credit: Vivian Stockman/ohvec.org; flyover courtesy SouthWings.org.
How does fragmentation favor industry?
The gas and petrochemical industry would likely defend the logistical flexibility the piecemeal process affords them, allowing them to tackle projects, make investments, and involve new players as needed overtime. But in what other ways do the incredibly fragmented approval processes, and the limited requirements on transparency, favor companies like Shell and their region-changing petrochemical projects? And what effect does the absence of full transparency have on local communities like those in Beaver County? We conclude that it:
“Divides and conquers” the region. The piecemeal approach to gas development, and major projects like the Shell ethane cracker, deny any sense of solidarity between the people along the pipeline route resisting these potentially explosive channels cutting through their yards, and residents of Beaver County who fear the cracker’s emissions that will surround their homes.
Makes the project seem a foregone conclusion, putting pressure on others to approve. For example, before Shell formally announced its intention to build the facility in Potter Township, it rerouted a state-owned road to facilitate construction and increased traffic flow. Likewise, though a key permit is still outstanding with the PA DEP, first responders, including local volunteer firefighters, have already begun dedicating their uncompensated time to training with Shell. While this is a positive step from a preparedness standpoint, it is one of many displays of confidence by Shell that the cracker is a done deal.
Puts major decisions in the hands of those with limited resources to carry them out and who do not represent the region to be affected. In the case of the Shell ethane cracker, three township supervisors in Potter Township granted approvals for the project. The impacts, however, extend well beyond Potter or even Beaver county and include major air impacts for Allegheny County and the Pittsburgh area. Effects will also be felt by landowners and residents in numerous counties and two states along the pipeline route, those near cryogenic facilities in Ohio and Pennsylvania, plus those living on the Marcellus and Utica shale plays who will see gas well production continue and potentially increase.
Figures 8a and 8b. Potter Township Supervisors give the go-ahead to draft approval of Shell’s proposed ethane cracker at a January meeting, while confronted with public concern about deficiencies in Shell’s permit applications. Photos courtesy of the Air Quality Collaborative.
The piecemeal, incremental, and fragmented approval processes for the ethane cracker – and other gas-related facilities in the making – create one major problem. They make it nearly impossible for locals, elected officials, and regulatory agencies to see the whole picture as they make decisions. The bit-by-bit approach to gas development amounts to far-reaching development with irreversible impacts to environmental and human health.
We ask readers, as they contemplate the impacts closest to them – be it a fracked well, a hazardous cryogenic facility, the heavily polluted Ohio River, a swath of land taken up for the pipeline’s right-of-way, or Shell’s ethane cracker itself – to insist that they, their elected officials, and regulators have access to the whole picture before approvals are granted. It’s hard to do with a project so enormous and far-reaching, but essential because the picture includes so many of us.
Sincere Appreciation
To The International League of Conservation Photographers, The Ohio Environmental Council, and The Air Quality Collaborative for sharing photographs.
To Sophie Riedel for sharing her visualizations of natural gas interstate pipelines.
To Lisa Hallowell at the Environmental Integrity Project, and Samantha Rubright and Kirk Jalbert at FracTracker, for their review of and and invaluable contributions to this series.
Feature image: Map of US counties and natural gas interstate pipeline system describes the wide-diameter (20-42 inch), high capacity trunklines that carry most of the natural gas that is transported throughout the nation. Visualization created by Sophie Riedel, Carnegie Mellon University, School of Architecture. Data on interstate natural gas supply sourced from Energy Information Administration, Form EIA176 “Annual Report of Natural Gas and Supplemental Gas Supply and Disposition,” 2007.
https://www.fractracker.org/a5ej20sjfwe/wp-content/uploads/2017/05/Pipelines-US-Graphic-Riedel-Feature.jpg400900FracTracker Alliancehttps://www.fractracker.org/a5ej20sjfwe/wp-content/uploads/2025/09/2025-Wordmark-Logo.pngFracTracker Alliance2017-05-31 09:12:492021-04-15 15:03:01Piecing Together an Ethane Cracker
Eighty years ago, Southeastern Ohio was a wasteland of barren, eroding hills. During the 18th and 19th centuries this once heavily forested area in the Appalachian foothills had been clear cut and mined beyond recognition. When the Great Depression struck, lowering crop prices made farming unprofitable in the area, and 40% of the population moved away.
In 1933, President Franklin Delano Roosevelt established the Civilian Conservation Corps (CCC), a public work relief program that employed men aged 18-25 to do manual labor related to conservation and development of natural resources such as planting trees, constructing trails, roads, and lodges, fighting wildfires, and controlling erosion. The following year, Ohio’s legislature agreed to allow the federal government to purchase land in the state for the purpose of establishing a national forest. The Forest Service was tasked with restoring the land for what is now called Wayne National Forest (WNF). A tree nursery was established near Chillicothe, and with the help of the CCC and volunteers, including members of the Daughters of the American Revolution, garden clubs, and school children, reforestation began.
Photos Credit: US Forest Service
An Area on the Mend
Today, WNF comprises three units that span 12 Ohio counties in the Unglaciated Allegheny Plateau. The hills are covered in biologically diverse mixed mesophytic forest, which includes approximately 120 species of trees and provides habitat for at least 45 species of mammals, 158 species of birds, 28 species of reptiles, 29 species of amphibians, and 87 species of fish. The US Forest Service estimates that 240,000 people visit this ecological wonder annually, according to Forest Recreation Program Manager, Chad Wilberger, in Nelsonville, Ohio. The restoration of barren public land to its current state is a great achievement. If it continues to be protected, Wayne could one day resemble the old growth forest that thrived here before the arrival of European settlers.
The Bureau of Land Management (BLM), however, has recently decided to lease up to 40,000 acres of Wayne to gas and oil companies for horizontal hydraulic fracturing, or fracking. The first auction took place last December resulting in the lease of 700 acres. A second auction this March leased another 1,200 acres. Nearly all of this land lies within the 60,000 acre Marietta Unit of the forest. This brings Oil & Gas Expressions of Interest (EOI) acreage to roughly 7.5% of all WNF owned parcels in this unit.
Wayne National Forest and Adjacent Existing Oil and Gas Infrastructure Below is a map of the Wayne National Forest, along with parcels owned by WNF (shown in gray) and those that might be subject to unconventional oil and gas development (gray parcels outlined with dashes). We also include existing unconventional oil and gas infrastructure near the park. Explore the map below, or click here to view the map fullscreen.
Gas and oil development is not new to the Wayne. Since the passage of The Federal Land Policy and Management Act of 1976, the US Forest Service’s land management plan for WNF has included conventional drilling, and derricks are a common sight on both public and private land in southeastern Ohio.
Fracking (unconventional drilling), however, has a far greater impact, requiring clear cutting of large areas of land for the construction of concrete well pads, and the use of millions of gallons of water that will become contaminated during the process and then transported by truck to injection wells. Accidents can be catastrophic for workers and nearby residents, and fracking and waste water disposal have been linked to earthquakes in Ohio.
In 2012, BLM updated its WNF Land and Resource Management Plan to allow fracking in the forest without conducting new impact studies.
What is at risk?
The Marietta Unit of the WNF is located in Monroe, Perry, and Washington counties in Southeastern Ohio along the Ohio River. Within its boundary are a wealth of trails used for hiking, backpacking, horseback riding, and mountain biking, campgrounds, and waterways ideal for kayaking and fishing. Both the highest and lowest points in the Wayne lie in this unit, as does the Irish Run Natural Bridge. The area is also known for its exceptional wildflowers, as shown in the photos below.
One popular recreation area, Lamping Homestead, lies directly within an oil and gas Expression Of Interest (EOI) parcel #3040602400 (See Map Above), one of the areas under consideration for lease. In the 1800s, it was the site of the Lamping family’s farm, but today all that remains of the settlers is a small cemetery with an iron gate atop a hill overlooking a small lake. Six campsites are situated around the western side of the lake, and two intersecting hiking loops rise into the wooded hills to the east. On the western side of the parking lot is a covered picnic area. A creek flows out of the lake and into Clear Fork, a tributary of the Little Muskingum River, across the road from the parking lot.
Both the lake and stream are popular boating and fishing areas. Lamping is an excellent spot for wildlife viewing. The lake, the creeks that flow in and out of it, and the surrounding wooded hills support an impressive variety of plant and animal species. During the day, visitors might spot ducks, geese, great blue herons, red-winged blackbirds, summer tanagers, red spotted newts, box turtles, northern water snakes, garter snakes, deer, rabbits, and muskrats. At night, they could be greeted by a cacophony of voices from frogs, owls, and coyotes.
Species of trees, plants, and fungus are also numerous. In winter, stands of white pine pop out against the bare branches of oak, hickory, maple, buckeye, and other deciduous trees. In spring, eye-catching splotches of blooming dogwood and redbud contrast against the many shades of green. But hikers who pull their gaze away from the brightly colored canopy and look down are rewarded with an abundance of wildflowers and the butterflies they attract, as well as many varieties of mushrooms and fungus, including such edible varieties as morels, wood ear, and dryad’s saddle.
Estimating Disturbances
It is unclear how much surface disturbance would occur on public land if this parcel were to be fracked, but even if the well pad and pipelines were constructed on private land adjacent to the forest, in order to drill under the forest, the public land and its inhabitants and visitors would certainly be impacted.
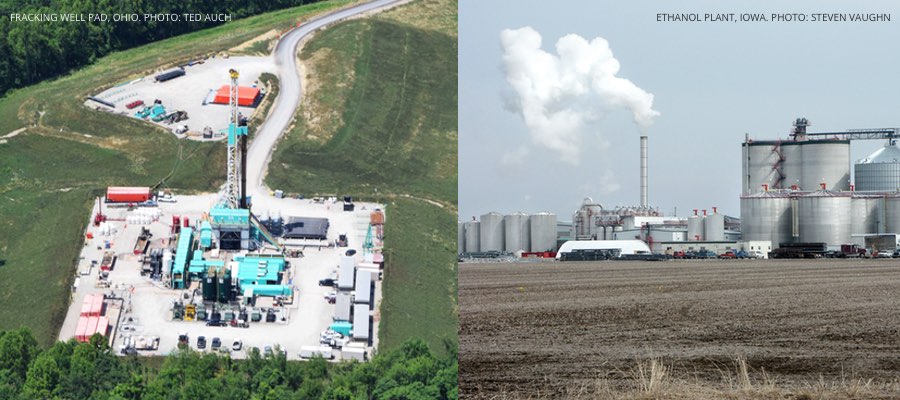
There is no question that noise and air pollution from traffic and construction would be disruptive both to wildlife and to human visitors. Explore various photos of the oil and gas industry in the gallery below:
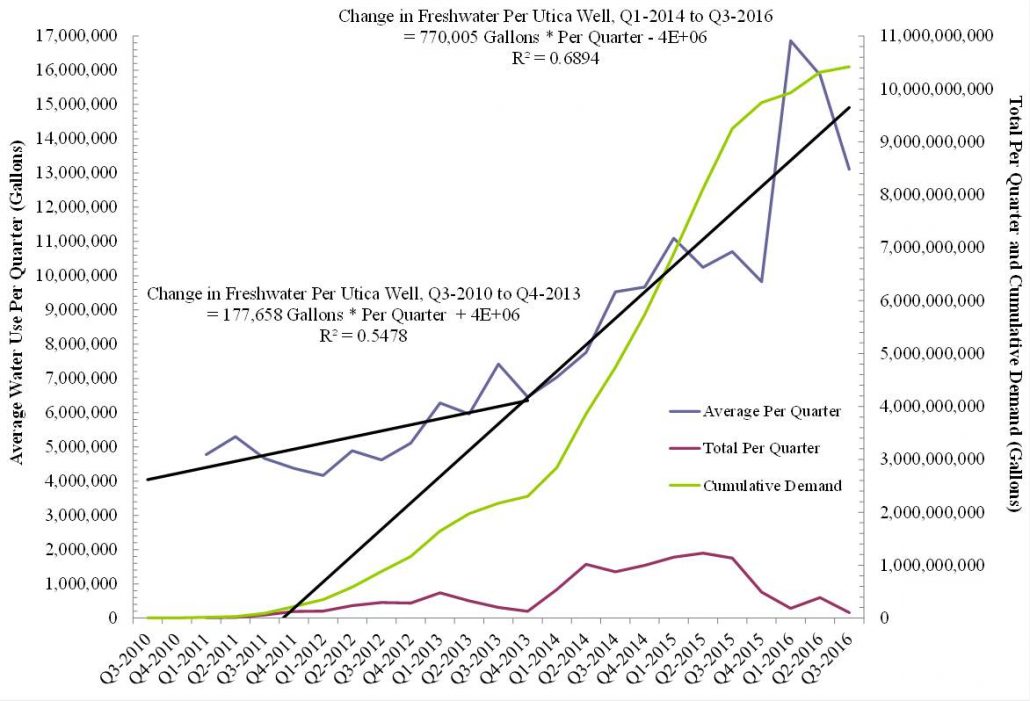
The extraction process requires 2 million to 6 million gallons of fresh water each time a well is fracked. The rate at which hydraulic fracturing’s water demand is increasing on a per-well basis here in Ohio reached an exponential state around Q4-2013 and Q1-2014 and continues to rise at a rate of 3.1 million gallons per well per year (Figure 1).
Ohio Hydraulic Fracturing Total and Per Well Freshwater Demand between Q3-2010 and Q3-2016.
In Ohio, oil and gas companies are allowed to pull this water directly from streams and rivers at no cost. All this is possible, despite the fact that after its use it is so contaminated that it must be disposed of via injection wells and is permanently removed from the water cycle. The industry is already pulling water from streams in the Marietta Unit of the WNF for use in fracking on private land. Fracking public land simply means water withdrawals will occur on a much larger scale.
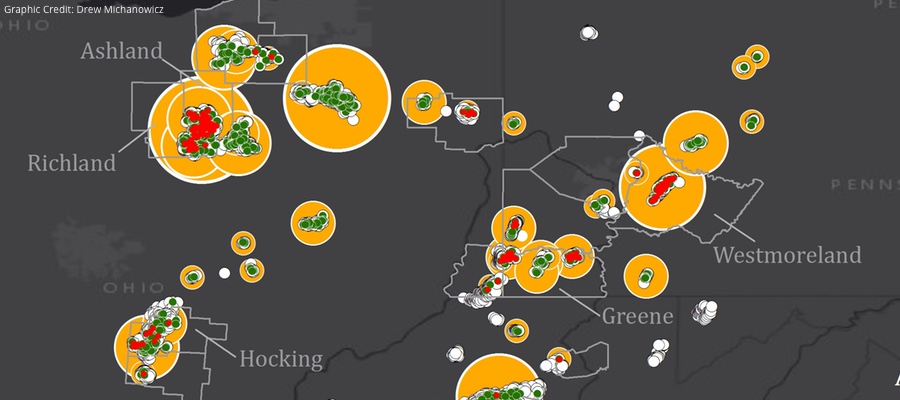
Ohio and West Virginia Shale Water Demand and Injection Waste Disposal This map shows Utica wells weighted by water demand and disposal (and/or production). It also depicts water, sand, and chemical usage as well as injection waste and oil production. Explore the map below, or click here to view map fullscreen.
Inevitable methane leaks, in addition to contributing to climate change, affect humans and wildlife in their immediate vicinity, causing headaches and nausea and even killing trees and plants.
In addition to the anticipated harm that fracking inflicts upon a natural area, there is also a risk of accidents with potentially devastating consequences. Residents of Monroe County have already seen a few in recent years from fracking on private land. In 2014, a well pad fire in the village of Clarington resulted in a chemical spill that contaminated nearby Opossum Creek, killing 70,000 fish. The same year a large gas leak 15 miles south in the village of Sardis resulted in the evacuation of all homes within half mile radius.
Recent studies have shown that extraction wells, in addition to injection wells, can cause earthquakes. Unsurprisingly, Monroe County has seen a spike in seismic activity with the increase in fracking activity in the area. The most recent incident was a 3.0 magnitude earthquake in the forest less than five miles from Lamping Homestead in April of this year.
Supporters of Wayne National Forest
Many people have repeatedly spoken out against BLM’s plan, submitting a petition with more than 100,000 signatures, and protesting outside Wayne National Forest Headquarters and Athens Ranger Station in Nelsonville. They have even organized voters to call and write letters to Regional Forester Kathleen Atkinson and legislators, including Senators Sherrod Brown and Rob Portman, and Governor John Kasich. BLM has not budged on its decision, unfortunately, insisting that leasing this land for fracking, and associated infrastructure buildout, will have “no significant impact.”
This May, the Center for Biological Diversity, Ohio Environmental Council, Ohio Sierra Club, and Heartwood, a regional organization focused on protecting forests, filed a lawsuit against BLM, aiming to void BLM leases and halt all fracking operations within the national forest.
Concerned citizens continue to organize raise awareness as they await the outcome of the suit.
Becca Pollard is Freelance Journalist and Co-founder of Keep Wayne Wild
Data Downloads
Click on the links below to download the data used to create this article’s maps:
https://www.fractracker.org/a5ej20sjfwe/wp-content/uploads/2017/05/Wayne-National-Forest-Feature.jpg400900Guest Authorhttps://www.fractracker.org/a5ej20sjfwe/wp-content/uploads/2025/09/2025-Wordmark-Logo.pngGuest Author2017-05-24 11:35:532021-04-15 15:03:02Wayne National Forest Could Be Deforested – Again
The largest accidental release of methane in U.S. history began October 23, 2015 with the blowout of an underground natural gas storage well in Aliso Canyon about 20 miles west of Los Angeles. By the time the well was plugged 112 days later, more than 5.0 billion cubic feet of methane and other pollutants had been released to the atmosphere. It was a disaster for the climate, the environment, California’s energy supply, and the more than 11,000 people that were forced to evacuate.
A new study from the Harvard T. H. Chan School of Public Health – Center for Health and the Global Environment shows that more than one in five of the almost 15,000 active underground gas storage (UGS) wells in the US could be vulnerable to serious leaks due to obsolete well designs – similar in design to the well that failed at the Aliso Canyon storage facility.
Published today in the journal Environmental Research Letters, the study presents a national baseline assessment of underground storage wells in the U.S. and indicates the need for a better understanding of the risks associated with the obsolescence of aging storage wells. The study also highlights the widespread nature of certain age-related risk factors, but indicates that some of the highest priority wells may be located in PA, OH, NY, and WV.
The study shows that the average construction year of largely unregulated active UGS wells in the US is 1963, with potentially obsolete wells that were not originally designed for storage operating in 160 facilities across 19 states. Some of the wells were constructed over 100 years ago – a time period that precedes many modern well containment systems such cement isolation and the use of multiple casings. Some of the oldest active UGS wells were not designed for two-way flow of gas, and therefore may not exhibit sufficient material-grade or redundant precautionary systems to prevent containment loss, as was evident at Aliso Canyon.
An Interview with the Author
Sam, Matt, and Kyle of FracTracker caught up with lead author and former FracTracker colleague, Dr. Drew Michanowicz, now with the Center for Health and Global Environment within the Harvard T. H. Chan School of Public Health to find out more about their study.
When we spoke with Drew, he began the interview by posing the first question to us:
Did you know that about 15% of the natural gas produced in the US is injected back into the ground each year?
While we had all heard of underground gas storage before, we had to admit that we never thought of the process like that before. In other words, some of the natural gas in the US is being produced twice from two different reservoirs before being consumed. And because many of these storage systems utilized depleted oil and gas reservoirs, many of the same pre- and post-conditioning processes, such as dehydrating and compressing, are necessary to bring the gas to market.
The following questions and answers from Drew expand upon the study’s findings:
Q: What prompted you and your colleagues to investigate this topic?
A: After the Aliso Canyon incident, we became interested in the question: ‘Is Aliso Canyon Unique?’ Interestingly, there were plenty of early warning signs at that facility that corrosion issues on very old repurposed wells were becoming a significant issue. Almost a year before the well blowout, Southern California gas went on record in front of California’s Public Utility Commission stating that they needed a rate increase to implement a necessary integrity management plan for their wells, and to be able to move beyond operating in a reactive mode. That unfortunately prophetic document really got us interested in better understanding why their infrastructure was in the state it was in. And like any major accident like this, a logical next step is to assess the prevalence of hazardous conditions elsewhere in the system, in the hope to prevent the next one.
From our research, it appears that a very large portion of the UGS sector may be facing similar obsolescence issues compared to Aliso, such as decades-old wells not originally designed for two-way flow. Our work here, however, is a simplified assessment that focused only on passive barriers or the fixed structures such as the steel pipes likely present in a well. Much more work is needed to fully understand the active-type safety measures in place such as safety valves, tubing/packers, and overall integrity management plans – all important factors for manage risks.
Q: We see that your team developed a well-level database of over 14,000 active UGS wells across 29 states. Because data-collation is a big part of our work here, can you describe that data collection process?
A: Very early on we also realized that underground gas storage was exempt from the Safe Drinking Water Act’s Underground Injection Control (UIC) program – similar to exemption with hydraulic fracturing and the Energy Policy Act of 2015, AKA the Halliburton Loophole. This meant in part that very little aggregate well data was available from the Federal Government or by third-party aggregators like FracTracker and DrillingInfo. Reminiscent of my former extreme data-paucity days at FracTracker, we knew we needed to build a database basically from scratch to effectively perform a hazard assessment that incorporated a spatial component.
We began by gathering what data we could from the U.S. Energy Information Administration (EIA), which gave us good detail at the field or facility level, but the fields were generalized to a county centroid. So to fully evaluate these infrastructure, we needed to figure out how to join the facility-level data to the well data for each state. We relied on NETL’s Energy Data eXchange to identify state-level wellbore data providers where applicable. Once we collected all of the state data, we created a decision-tree framework to join the individual wells to the EIA field names in order to produce a functional geodatabase. Because we had to manage data from so many sources, we had to devote quite a bit of effort to data QA/QC, and that is reflected in the methods and results of the paper. For example, some of our fields and wells had to be joined via visual inspection of company system maps, because of missing identifier information.
Q: We see that some of the oldest repurposed wells you mapped are located in PA, OH, NY, and WV. Was that a surprise to you?
A: That was a surprise considering this story started for us in California, and even more surprising was that some are more than 100 years old. Now, a bit of caution here is warranted when thinking about the age of any engineered system. On the one hand, something that functions for a very long time is an indication that the system was very well suited for its task, and likely has been very well taken care of – think of an antique automobile like a fully functional 1916 Model T Ford, for example. On the other hand, age and construction year relates to the integrity of an engineered system through two processes by:
providing information to how long a system has been exposed to natural degradation processes such as corrosion, and stresses from thermal and abrasive cycles; and by
proxying for knowledge and regulatory safety standards at the time of construction which informs the design, materials, technologies likely used.
To go back to the car example, while an old classic car may still be operational, it may not have certain safety features like antilock brakes, airbags, or safety belts, and generally will not be able to go as fast as a modern car. Therefore, a gas storage well’s integrity is at least indirectly related to its construction year when considering the multitude of technological and safety improvements have occurred over the years. This is how we have been thinking about well integrity from a 5,000 foot perspective. Needless to say, more research is needed to understand the causal effect of age on well integrity.
Q: So if we understand you correctly, these older wells can be maintained with sufficient management practices, but there may be inherent safety features missing on these older wells that don’t adhere to todays’ standards?
A: That’s right. So what we can say about some of these aging wells is that some will not reflect certain modern fail-safe engineering such as sufficient casing design strength and multiple casings or barriers along the full length. And these are permanent structural elements vestigial to the well’s original design, and therefore cannot be undone or redesigned away. In other words, it makes much more sense to drill a new well with new materials than attempt to significantly alter an old well. And the gas storage wells built today are designed with redundant fail-safe systems including multiple barriers and real-time pressure sensors.
But back to my earlier point about lack of federal regulations to set a minimum safety standard – because of that, there is also much uncertainty surrounding how many of these facilities have been dealing with safety and risk management. That is a future direction of this work – to really try to fill in some of regulatory gaps between states and the impending Federal guidelines and identify some best practices to help inform policy makers specifically at the state level.
Drew put together a map to highlight where some of these active storage wells are in PA, OH, NY, and WV:
This area map of PA, WV, OH, and NY displays where active underground natural gas storage operations are located. The small white points represent active storage wells that have a completion, SPUD, or permit date that occurs after the field was designated for storage indicating that these wells are more likely to have been designed for storage operations. The green points are active storage wells that predate storage operations, indicating that these wells may not have been designed for storage.
There are 121 storage fields connected to at least 6,624 active gas storage wells across these four states. A portion of wells in this region were not included in this final count because they did not contain sufficient status or date information. Pennsylvania has the most individual storage fields of any state with 47, while Ohio boasts the most active storage wells of any state in the country with 3,318 across its 22 active fields. Of the 6,624 active UGS wells across these four states, 1,753 predate storage designation indicating that these wells were likely not originally designed for storage. These ‘repurposed’ wells have a median age of 84 years, with 210 wells constructed over 100 years ago (red points). The 100 year cutoff is not arbitrary, as the year 1917 marks the advent of cement zonal isolation techniques, indicating that these wells may be of the highest priority in terms of design deficiencies related to well integrity, and they are primarily located across the four states pictured above.
Top Counties with Obsolete1/Repurposed2 Wells
Westmoreland, PA (86/93)
Ashland, OH (50/217)
Richland, OH (31/99)
Greene, PA (25/76)
Hocking, OH (18/99)
1Obsolete wells are repurposed wells constructed before 1916 2Repurposed wells predate the storage facility
The well that failed at Aliso Canyon was originally drilled in 1954 for oil production. In 1972, it was repurposed for underground gas storage, which entails both production and injection cycles in a single well. The problem seems to be that because it was not originally constructed to store natural gas, only a single steel pipe separated the flow of gas and the outside rock formation. That meant the well’s passive structural integrity was vulnerable to a single point-of-failure along a portion of its casing. When part of the subsurface well casing failed, there were no redundancies or safety valves in place to prevent or minimize the blow out.
More information related to the Aliso Canyon incident and this study is available here.
More info on the Center for Health and the Global Environment can be found here.
https://www.fractracker.org/a5ej20sjfwe/wp-content/uploads/2017/05/UGS-Map-Feature.jpg400900FracTracker Alliancehttps://www.fractracker.org/a5ej20sjfwe/wp-content/uploads/2025/09/2025-Wordmark-Logo.pngFracTracker Alliance2017-05-23 13:12:102021-04-15 15:03:04Underground Gas Storage Wells – An Invisible Risk in the Natural Gas Supply Chain
Even though it is a biofuel and not a fossil fuel, in this post we discuss the ways in which the corn ethanol production industry is similar to the fracking industry. For those who may not be familiar, biofuel refers to a category of fuels derived directly from living matter. These may include:
Direct combustion of woody biomass and crop residues, which we recently mapped and outlined,
Ethanol1 produced directly from the fermentation of sugarcanes or indirectly by way of the intermediate step of producing sugars from corn or switchgrass cellulose,
Biodiesel from oil crops such as soybeans, oil palm, jatropha, and canola or cooking oil waste,2 and
Anaerobic methane digestion of natural gas from manures or human waste.
To be a viable substitute for a fossil fuel, an alternative fuel should not only have superior environmental benefits over the fossil fuel it displaces, be economically competitive with it, and be producible in sufficient quantities to make a meaningful impact on energy demands, but it should also provide a net energy gain over the energy sources used to produce it.
Out of all available biofuels it is ethanol that accounts for a lion’s share of North American biofuel production (See US Renewables Map Below). This trend is largely because most Americans put the E-10 blends in their tanks (10% ethanol).3 Additionally, the Energy Independence and Security Act of 2007 calls for ethanol production to reach 36 billion gallons by 2022, which would essentially double the current capacity (17.9 billion gallons) and require the equivalent of an additional 260 refineries to come online by then (Table 1, bottom).
US Facilities Generating Energy from Biomass and Waste along with Ethanol Refineries and Wind Farms
But more to the point… the language, tax regimes, and potential costs of both ethanol production and fracking are remarkably similar. (As evidenced by the quotes scattered throughout this piece.) Interestingly, some of the similarities are due to the fact that “Big Ag” and “Big Oil” are coupled, growing more so every year:
The shale revolution has resulted in declining natural gas and oil prices, which benefit farms with the greatest diesel, gasoline, and natural gas shares of total expenses, such as rice, cotton, and wheat farms. However, domestic fertilizer prices have not substantially fallen despite the large decrease in the U.S. natural gas price (natural gas accounts for about 75-85 percent of fertilizer production costs). This is due to the relatively high cost of shipping natural gas, which has resulted in regionalized natural gas markets, as compared with the more globalized fertilizer market. (USDA, 2016)
Ethanol’s Recent History
For background, below is a timeline of important events and publications related to ethanol regulation in the U.S. in the last four decades:
Energy Research Advisory Board (ERAB) 1980, Gasohol
US Department of Energy (DOE), 2002, “Roadmap for biomass technologies in the United States. Biomass Technical Advisory Committee”, Found here and here
The Renewable Fuel Standard (RFS) program is implemented as part of the Energy Policy Act of 2005 and extended in the Energy Independence and Security Act of 2007
USDA, 2007, Growing global demands for soy for edible oil, livestock feed, and biodiesel are also contributing to high soy prices (no file found on USDA site anymore)
2014 Farm Bill authorized the “Biomass Crop Assistance Porgram” (aka, The 2014 Agricultural Act)
Benefits of Biofuels
[Bill] Clinton justified the ethanol mandate by declaring that it would provide “thousands of new jobs for the future” and that “this policy is good for our environment, our public health, and our nation’s farmers—and that’s good for America.” EPA administrator Carol Browner claimed that “it is important to our efforts to diversify energy resources and promote energy independence.” – James Bovard citing Peter Stone’s “The Big Harvest,” National Journal, July 30, 1994.
Of the 270 ethanol refineries we had sufficient data for, we estimate these facilities employ 235,624 people or 873 per facility and payout roughly $6.18-6.80 billion in wages each year, at an average of $22.9-25.2 million per refinery. These employees spend roughly 423,000 hours at the plant or at associated operations earning between $14.63 and $16.10 per hour including benefits. Those figures amount to 74-83% of the average US income. In all fairness, these wages are 13-26% times higher than the farming, fishing, and forestry sectors in states like Minnesota, Nebraska, and Iowa, which alone account for 33% of US ethanol refining.
Additional benefits of ethanol refineries include the nearly 179 million tons of CO2 left in the field as stover each year, which amounts to 654,532 tons per refinery. Put another way – these amounts are equivalent to the annual emissions of 10.7 million and 39,194 Americans, respectively.
Finally, what would a discussion of ethanol refineries be without an estimate of how much gasoline is produced? It turns out that the 280 refineries (for which we have accurate estimates of capacity) produce an average of 71.93 million gallons per year and 20.1 billion gallons in total. That figure represents 14.3% of US gasoline demand.
Costs of Biofuels
Direct Costs
Biofuel expansions such as those listed in the timeline above and those eluded to by the likes of the IPCC have several issues associated with them. One of which is what Pimentel et al. considered an insufficient – and to those of us in the fracking NGO community, familiar sounding – “breadth of relevant expertise and perspectives… to pronounce fairly and roundely on this many-sided issue.”
Figures 1A and 1B. Palm Oil Production in A) Indonesia and B) Malaysia between 1960 and 2016.
There is an increasing amount of connectivity between disparate regions of the world with respect to energy consumption, extraction, and generation. These connections also affect how we define renewable or sustainable:
In a globalized world, the impacts of local decisions about crop preferences can have far reaching implications. As illustrated by an apparent “corn connection” to Amazonian deforestation, the environmental benefits of corn-based biofuel might be considerably reduced when its full and indirect costs are considered. (Science, 2007)
These authors pointed to the fact that biofuel expectations and/or mandates fail to account for costs associated with atmospheric – and leaching – emissions of carbon, nitrogen, phophorus, etc. during the conversion of lands, including diverse rainforests, peatlands, savannas, and grasslands, to monocultures. Also overlooked were:
The ethical concerns associated with growing malnourishment from India to the United States,
The fact that 10-60%5 more fossil fuel derived energy is required to produce a unit of corn ethanol than is actually contained within this very biofuel, and
The tremendous “Global land and water grabbing” occuring in the name of natural resource security, commodification, and biofuel generation.
Sacrificing long-term ecological/food security in the name of short-term energy security has caused individuals and governments to focus on taking land out of food production and putting it into biofuels.
The rationale for ethanol subsidies has continually changed to meet shifting political winds. In the late 1970s ethanol was championed as a way to achieve energy independence. In the early 1980s ethanol was portrayed as salvation for struggling corn farmers. From the mid and late 1980s onward, ethanol has been justified as saving the environment. However, none of those claims can withstand serious examination. (James Bovard, 1995)
This is instead of going the more environmentally friendly route of growing biofuel feedstocks on degraded or abandoned lands. An example of such an endeavor is the voluntary US Conservation Reserve Program (CRP), which has stabilized at roughly 45-57 thousand square miles of enrolled land since 1990, even though the average payout per acre has continued to climb (Figure 2).
Figure 2. The Average Subsidy to Farmers Per Acre of Conservation Reserve Program (CRP) between 1986 and 2015.
The primary goals of the CRP program are to provide an acceptable “floor” for commodity prices, reduce soil erosion, enhance wildlife habitat, ecosystem services, biodiversity, and improve water quality on highly erodible, degraded, or flood proned croplands. Interestingly CRP acreage has declined by 27% since a high of 56 thousand square miles prior to the Energy Independence and Security Act of 2007 being passed. Researchers have pointed to the fact that corn ethanol production on CRP lands would create a carbon debt that would take 48 years to repay vs. a 93 year payback period for ethanol on Central US Grasslands.
Alternative fuel sources are attractive because they can be developed and used without questioning the very workings of the economic system — just substitute a more “sustainable,” “ecologically sound,” and “renewable” energy for the more polluting, expensive, and finite amounts of oil. People are hoping for magic bullets to “solve” the problem so that capitalist societies can continue along their wasteful growth and consumption patterns with the least disruption. Although prices of fuels may come down somewhat — with dips in the business cycle, higher rates of production, or a burst in the speculative bubble in the futures market for oil — they will most likely remain at historically high levels as the reserves of easily recovered fuel relative to annual usage continues to decline.
Indirect Costs: Ethanol, Fertilizers, and the Gulf of Mexico Dead Zone
This is the Midwest vs. the Middle East. It’s corn farmers vs. the oil companies. – Dwaney Andreas in Big Stink on the Farm by David Greising
Sixty-nine percent6 of North America’s ethanol refineries are within the Mississippi River Basin (MRB). These refineries collectively rely on corn that receives 1.9-5.1 million tons of nitrogen each year, with a current value of $1.06-2.91 billion dollars or 9,570-26,161 tons of nitrogen per refinery per year (i.e. $5.42-14.81 million per refinery per year). These figures account for 27-73% of all nitrogen fertilizer used in the MRB each year. More importantly, the corn acreage receiving this nitrogen leaches roughly 0.81-657 thousand tons of it directly into the MRB. Such a process amounts to 5-44% of all nitrogen discharged into the Gulf of Mexico each year and 1.7-13.8 million tons of algae responsible for the Gulf’s growing Dead Zone.
Leaching of this nitrogen is analogous to flushing $45.7-371.6 million dollars worth of precious capital down the drain. Put another way, these dollar figures translate into anywhere between 55% and an astonishing 4.53 times Direct Costs to the Gulf’s seafood and tourism industries of the Dead Zone itself.
These same refineries rely on corn acreage that also receives 0.53-2.61 million tons of phosphorus each year with a current value of 0.34-1.66 billion dollars. Each refinery has a phosphrous footprint in the range of 2,700 to 13,334 tons per year (i.e., $1.72-8.47 million). We estimate that 25,399-185,201 tons of this fertilizer phosphorus is leached into the the MRB, which is equivalent to 19% or as much as 1.42 times all the phosphorous dischared into the Gulf of Mexico per year. Such a process means $16.13-117.60 million is lost per year.
Together, the nitrogen and phosphorus leached from acreage allocated to corn ethanol have a current value that is between 75% and nearly 6 times the value lost every year to the Gulf’s seafood and tourism industries.
Indirect Costs: Fertilizer and Herbicide Costs and Leaching
The 270 ethanol refineries we have quality production data for are relying on corn that receives 367,772 tons of herbicide and insecticide each year, with a current value of $6.67 billion dollars or 1,362 tons of chemical preventitive per refinery per year (i.e. $24.7 million per refinery per year). More importantly the corn acreage receiving these inputs leaches roughly 15.8-128.7 thousand tons of it directly into surrounding watersheds and underlying aquifers. Leaching of these inputs is analogous to flushing $287 million to $2.3 billion dollars down the drain.
What’s Next?
During the recent Trump administration EPA, USDA, DOE administrator hearings, the Renewable Fuel Standard (RFS) was cited as critical to American energy independence by a bipartisan group of 23 senators. Among these were Democratic senator Amy Klobuchar and Republican Chuck Grassley, who co-wrote a letter to new EPA administrator Scott Pruitt demanding that the RFS remains robust and expands when possible. In the words of Democratic Senator Heidi Heitkamp – and long-time ethanol supporter – straight from the heart of the Bakken Shale Revolution in North Dakota:
The RFS has worked well for North Dakota farmers, and I’m fighting to defend it. As we’re doing today in this letter, I’ll keep pushing in the U.S. Senate for the robust RFS [and Renewable Volume Obligations (RVOs)] we need to support a thriving biofuels industry and stand up for biofuels workers. Biofuels create good-paying jobs in North Dakota and help support our state’s farmers, who rely on this important market – particularly when commodity prices are challenging.
Furthermore, the entire Iowa congressional delegation including the aforementioned Sen. Grassley joined newly minted USDA Secretary Sonny Perdue when he told the Iowa Renewable Fuels Association:
You have nothing to worry about. Did you hear what he said during the campaign? Renewable energy, ethanol, is here to stay, and we’re going to work for new technologies to be more efficient.
How this advocacy will play out and how the ethanol industry will respond (i.e., increase productivity per refinery or expand the number of refineries) is anybody’s guess. However, it sounds like the same language, lobbying, and advertising will continue to be used by the Ethanol and Unconventional Oil and Gas industries. Additional parallels are sure to follow with specific respect to water, waste, and land-use.
Furthermore, as both industries continue their ramp up in research and development, we can expect to see productivity per laborer to continue on an exponential path. The response in DC – and statehouses across the upper Midwest and Great Plains – will likely be further deregulation, as well.
From a societal perspective, an increase in ethanol production/grain diversion away from people’s plates has lead to a chicken-and-egg positive feedback loop, whereby our farmers continue to increase total and per-acre corn production with less and less people. In rural areas, mining and agriculture have been the primary employment sectors. A further mechanization of both will likely amplify issues related to education, drug dependence, and flight to urban centers (Figures 4A and B).
We still don’t know exactly how efficient ethanol refineries are relative to Greenhouse Gas Emissions per barrel of oil. By merging the above data with facility-level CO2 emissions from the EPA Facility Level Information on Greenhouse gases Tool (FLIGHT) database we were able to match nearly 200 of the US ethanol refineries with their respective GHG emissions levels back to 2010. These facilities emit roughly:
195,116 tons of CO2 per year, per facility,
A total of 36.97 million tons per year (i.e., 2.11 million Americans worth of emissions), and
22,265 tons of CO2 per barrel of ethanol produced.
Emissions from ethanol will increase to 74.35 million tons in 2022 if the Energy Independence and Security Act of 2007’s prescriptions run their course. Such an upward trend would be equivalent to the GHG emissions of somewhere between that of Seattle and Detroit.
What was once a singles match between Frackers and Sheikhs may turn into an Australian Doubles match with the Ethanol Lobby and Farm Bureau joining the fray. This ‘game’ will only further stress the food, energy, and water (FEW) nexus from California to the Great Lakes and northern Appalachia.
We are on a thinner margin of food security, just as we are on a thinner margin of oil security… The [World] Bank implicitly questions whether it is wise to divert half of the world’s increased output of maize and wheat over the next decade into biofuels to meet government “mandates.” – Ambrose Evans-Pritchard in The Telegraph
Figure 3. US and Global Corn Production and Acreage between 1866 and 2015.
Figures 4A and 4B. A) Number of Laborers in the US Mining, Oil and Gas, Agriculture, Forestry, Fishing, and Hunting sector and B) US Corn Production Metrics Per Farm Laborer between 1947 and 2015.
Ethanol Tables
Table 1. Summary of our Corn Ethanol Production, Land-Use, and Water Demand analysis
Gallons of Corn Ethanol Produced Per Year
17,847,616,000
Bushels of Corn Needed
6,374,148,571
Percent of US Production
44.73%
Land Needed
104,372,023 acres
“”
163,081 square miles
Percent of Contiguous US Land
5.51%
Percent of US Agricultural Land
11.28%
Gallons of Water Needed
49.76 trillion (i.e. 3.55 million swimming pools)
Gallons of Water Per Gallon of Oil
2,788
Average and Total Site/Industry Capacity
Average Corn Ethanol Production Per Existing or Under Construction Facility (n = 257)
69,717,250
Gallons of Corn Ethanol Produced Per Year
17,847,616,000
Difference Between 2022 Energy Independence and Security Act of 2007 36 Billion Gallon Mandate
18,152,384,000
# of New Refineries Necessary to Get to 2022 Levels
260
Percent Increase Over Current Facility Inventory
1.7
IEA 2009 World Energy Outlook 250-620% Increase Predictions for 2030
250%
44,619,040,000
# of New Refineries Necessary
640
Percent Increase Over Current Facility Inventory
150.00
620%
110,655,219,200
# of New Refineries Necessary
1,587
Percent Increase Over Current Facility Inventory
520.00
Table 2. Global Population Growth and Corn and Soybean Productivity Trends.
Percent Change
Metric
+1.13%
Global Population Growth Trend
Corn (Bushels Per Acre)
+1.15% Per Year
United States
+1.20% Per Year
Global
Soybean (Tons Per Acre)
+0.9% Per Year
United States
+1.5% Per Year
Brazil
Palm Oil (Tons)
+5.1% Per Year
Indonesia
+2.7% Per Year
Malaysia
References and Footnotes
Ethanol as defined in the Ohio Revised Code (ORC) Corporation Franchise Tax 5733.46 means “fermentation ethyl alcohol derived from agricultural products, including potatoes, cereal, grains, cheese whey, and sugar beets; forest products; or other renewable resources, including residue and waste generated from the production, processing, and marketing of agricultural products, forest products, and other renewable resources that meet all of the specifications in the American society for testing and materials (ASTM) specification D 4806-88 and is denatured as specified in Parts 20 and 21 of Title 27 of the Code of Federal Regulations.”
According to Fred Magdoff, the ethanol complex is lobbying for “more automobile engines capable of using E-85 (85 percent ethanol, 15 percent gasoline) for which there are currently 2,710 fueling stations across the country although 56% of them are in just nine states: 1) Wisconsin (117), 2) Missouri (107), 3) Minnesota (335), 4) Michigan (174), 5) Indiana (172), 6) Illinois (221), 7) Iowa (193), 8) Texas (99), and 9) Ohio (97). Some states are mandating a mixture greater than 10 percent. Ethanol can’t be shipped together with gasoline in pipelines because it separates from the mixture when moisture is present, so it must be trucked to where it will be mixed with gasoline.” The E-85 blend comes with its own costs including higher emissions of CO, VOC, PM10, SOx, and NOx than gasoline.
McClaugherty, C., Auch, W. Genshock, E. and H. Buzulencia. (2017). Landscape impacts of infrastructure associated with Utica shale oil and gas extraction in eastern Ohio, Ecological Society of America, 100th Annual Meeting, Baltimore, MD, August, 2015.
Hill et al. recently indicated “Ethanol yields 25% more energy than the energy invested in its production, whereas biodiesel yields 93% more.”
An additional 9-10 refineries or 73% of all ethanol refineries are within 25 miles of the Mississippi River Basin.
By Ted Auch, PhD, Great Lakes Program Coordinator, FracTracker Alliance
Cover photo, left: Oil and gas well pad, Ohio. Photo by Ted Auch. Cover photo, right: A typical ethanol plant in West Burlington, Iowa. Photo by Steven Vaughn.
Data Downloads
Click on the links below to download the datasets used to create the maps in this article.
Air quality in the California Bay Area has been steadily improving over the last decade, and the trend can even be seen over just the course of the last few years. In this article we explore data from the ambient air quality monitoring networks in the Bay Area, including a look at refinery emissions.
From the data and air quality reports we find that that many criteria pollutants such as fine particulate matter (PM2.5) and oxides of nitrogen (NOX) have decreased dramatically, and areas that were degraded are now in compliance.
While air pollution from certain sectors such as transportation have been decreasing, the north coast of the East Bay region is home to a variety of petrochemical industry sites. This includes five petroleum refineries. The refineries not only contribute to these criteria pollutants, but also emit a unique cocktail of toxic and carcinogenic compounds that are not monitored and continue to impact cardiovascular health in the region. This region, aptly named the “refinery corridor” has a petroleum refining capacity of roughly 800,000 BPD (barrels per day) of crude oil.
Petroleum refineries in California’s East Bay have always been a contentious issue, and several of the refineries date back to almost the turn of the 20th century. The refineries have continuously increased their capacities and abilities to refine dirtier crude oil through “modernization projects.” As a result, air quality and health impacts became such a concern that in 2006 and again in 2012, Gayle McLaughlin, a Green Party candidate, was elected as Mayor of the City of Richmond. Richmond, CA became the largest city in the U.S. with a Green Party Mayor. While there have been many strides in the recent decade to clean up these major sources of air pollution, health impacts in the region including cardiovascular disease and asthma, as well as cancer rates, are still disproportionately high.
Regulations
To give additional background on this issue, let’s discuss some the regulations tasked with protecting people and the environment in California, as well as climate change targets.
However – a current proposal will actually allow the refineries to process more crude oil by setting a standard for emissions by volume of crude/petroleum refined, rather than an actual cap on emissions. The current regulatory approach focuses on “source-by-source” regulations of individual equipment, which ignores the overall picture of what’s spewing into nearby communities and the atmosphere. Even the state air resources board has supported a move to block the refineries from accepting more heavy crude from the Canadian tar sands.
New regulatory proposals incentivize refineries to continue expanding operations to refine more oil, resulting in a larger burden on the health of these already disproportionately impacted environmental justice communities. Chevron, in particular, is upgrading their Richmond refinery in a way as to allow it to process dirtier crude in larger volumes from the Monterey Shale and Canada’s Tar Sands. Since the production volumes of lighter crudes are shrinking, heavier dirtier crudes are becoming a larger part of the refinerys’ feedstocks. Heavier crudes require more energy to refine and result in larger amounts of hazardous emissions.
Upgrades are also being implemented to address greenhouse gas emissions. While the upgrades address the carbon emissions, regulatory standards without strict caps for other pollutants will allow emissions of criteria and toxic air pollutants such as VOC’s, nitrosamines, heavy metals, etc… to increase. In fact, newly proposed emissions standards for refineries will make it easier for the refineries to increase their crude oil volumes by regulating emissions on per-barrel standards. Current refining volumes can be seen below in Table 1, along with their maximum capacity.
Table 1. Bay Area refineries average oil processed and total capacity
Refinery
Location
Ave. oil processed Barrels Per Day (2012 est.)
Max. capacity (BPD)
Chevron U.S.A. Inc. Richmond Refinery
Richmond
245,271
>350,000
Tesoro Refining & Marketing, Golden Eagle Refinery
The Bay Area, and in particular the city of Richmond, have been noted in the literature as a place where environmental racism and environmental health disparity exist. The city’s residents of color disproportionately live near the refineries and chemical plants, which is noted in early works on environmental racism by pioneers of the idea, such as Robert Bullard (Bullard 1993a,b).
Since the issue has been brought to national attention by environmental justice groups like West County Toxics Coalition, progress has been made to try to bring justice, but it has been limited. People of color are still disproportionately exposed to toxic, industrial pollution in that area. A recent study showed 93% of respondents in Richmond were concerned about the link between pollution and health, and 81% were concerned about a specific polluter, mainly the Chevron Refinery (Brody et al. 2012). Recent health reports continue to show the trend that these refinery communities suffer disproportionately from cases of asthma and cardiovascular disease and higher mortality rates from a variety of cancers.
Health Impact Studies
Manufacturing and refining are known to produce particularly toxic pollution. Additionally, there has been research done on the specific makeup of pollution in the refinery corridor. The best study to do this is the Northern California Household Exposure Study (Brody et al. 2009). They examined indoor and outdoor air in Richmond, a refinery corridor community, and Bolinas, a nearby but far more rural community. They found 33% more compounds in Richmond, along with higher concentrations of each compound. The study also found very high concentrations of vanadium and nickel in Richmond, some of the highest levels in the state. Vanadium and nickel have been shown to be some of the most dangerous PM2.5 components as we previously stated, which gives reason to believe the air pollution in Richmond is more toxic than in surrounding areas.
Another very similar study compared the levels of endocrine disrupting compounds in Richmond and Bolinas homes, and found 40 in Richmond homes and only 10 in Bolinas (Rudel et al. 2010). This supports the idea that a large variety of pollutants with synergistic effects may be contributing to the increased mortality and hospital visits for communities in this region. This small body of research on pollution in Richmond suggests that the composition of air pollution may be more toxic and thus trigger more pollution-related adverse health outcomes than in surrounding communities.
Air Quality Monitoring
As discussed above and in FracTracker’s previous reports on the refinery corridor, the refinery emissions are a unique cocktail whose synergistic effects may be driving much of the cardiovascular disease, asthma, and cancer risk in the region. Therefore, the risk drivers in the Bay Area need to be prioritized, in particular the compounds of interest emitted by the petrochemical facilities.
The targets for emissions monitoring are compounds associated with the highest risk in the neighboring communities. An expert panel was convened in 2013 to develop plans for a monitoring network in the refinery corridor. Experts found that measurements should be collected at 5 minute intervals and displayed to the public real-time. The gradient of ambient air concentrations is determined by the distance from refinery, so a network of three near-fence-line monitors was recommended. Major drivers of risk are supposed to be identified by air quality monitoring conducted as a part of Air District Regulation 12m Rule 15: Petroleum Refining Emissions tracking. According to the rule, fence-line monitoring plans by refinery operators:
… must measure benzene, toluene, ethyl benzene, and xylenes (BTEX) and HS concentrations at refinery fence-lines with open path technology capable of measuring in the parts per billion range regardless of path length. Open path measurement of SO2, alkanes or other organic compound indicators, 1, 3-butadiene, and ammonia concentrations are to be considered in the Air Monitoring Plan.
The following analysis found that the majority of hazardous pollutants emitted from refineries are not monitored downwind of the facility fence-lines, much less the list explicitly named in the regulations above.
As shown below in Figure 1, the most impacted communities are in those directly downwind of the facility. According to the BAAQMD, each petroleum refinery is supposed to have fence-line monitoring. Despite this regulation developed by air quality and health experts, only two out of the five refineries have even one fence-line monitor. Real-time air monitoring data at the Chevron Richmond fence-line monitor and the Phillips 66 Rodeo fence-line monitor can be found on fenceline.org. Data from these monitors are also aggregated by the U.S. EPA, and along with the other local monitors, can be viewed on the EPA’s interactive mapping platform.
Figure 1. Map of Hydrogen Sulfide Emissions from the Richmond Chevron Refinery
Hazardous Emissions and Ambient Pollution
Since the majority of hazardous chemicals emitted from the refineries are not measured at monitoring sites, or there are not any monitoring sites at the fence-line or downwind of the facility, our mapping exercises instead focus on the hazardous air pollution for which there is data.
As shown in the map of hydrogen sulfide (H2S) above, the communities immediately neighboring the refineries are subjected to the majority of hazardous emissions. The map shows the rapidly decreasing concentration gradient as you get away from the facility. H2S would have been a good signature of refinery emissions throughout the region if there were more than three monitors. Also, those monitors only existed until 2013, when they were replaced with a singular monitor in a much better location, as shown on the map. The 2016 max value is much higher because it is more directly downwind of Chevron Refinery.
The interpolated map layer was created using 2013 monitoring data from three monitors that have since been removed. The 2016 monitoring location is in a different location and has a maximum value more than twice what was recorded at the 2013 location.
Table 2. Inventory of criteria pollutant emissions for the largest sectors in the Bay Area
Annual average tons per day
PM10
PM2.5
ROG
NOX
SOX
CO
Area wide
175.51
52.90
87.95
19.92
0.62
161.86
Mobile
20.33
16.27
183.12
380.52
14.93
1541.50
Total Emissions
16.30
12.14
106.58
50.59
45.95
44.31
Table adapted from the BAAQMD Refinery Report. PM10 = particulate matter less than 10 microns in diameter (about the width of a human hair); PM2.5 = PM less than 2.5 microns in diameter; ROG = reactive organic gases; NOX = nitrogen oxides; SOX = sulfur oxides; CO = carbon monoxide.
Additionally, exposure assessment can also rely on using surrogate emissions to understand where the plumes from the refineries are interacting with the surrounding communities. It is particularly important to also discriminate between different sources of pollution. As we see in Table 2 above, the largest volume of particulate matter (PM), NOX, and CO emissions actually come from mobile sources, whereas the largest source of sulfur dioxide and other oxides (SOX) is from stationary sources. Since the relationship between PM2.5 and health outcomes is most established, the response to ambient levels of PM2.5 in the refinery corridor gives insight into the composition of PM as well as the presence of other species of hazardous air pollution. On the other hand, SO2 can be used as a surrogate for the footprint of un-monitored air toxics.
Pollutants’ Fingerprints
Particulate Matter
Figure 2. Map of fine particulate matter (PM2.5) for the Bay Area Air Quality Management District
Figure 2 above displays ambient levels of PM2.5, and as the map shows, the highest levels of particulate matter surround the larger metro area of downtown Oakland and also track with the larger commuting corridors. The map shows evidence that the largest contributor to PM2.5 is truly the transportation (mobile) sector. PM2.5 is one hazardous air pollutant which negatively impacts health, causing heart attack, or myocardial infarction (MI), among other conditions. PM2.5 is particulate matter pollution, meaning small particles suspended in the air, specifically particles under 2.5 microns in diameter. Exposure to high levels of PM2.5 increases the risk of MI within hours and for the next 1-2 days (Brooks et al. 2004; Poloniecki et al. 1997).While refineries may not be the largest source of PM in the Bay Area, they are still large point sources that contribute to high local conditions of smog.
The chemical make-up of the particulate matter also needs to be considered. In addition, the toxicity of PM from the refineries is of particular concern. Since particulate matter acts like small carbon sponges, the source of PM affects its toxicity. The cocktail of hazardous air toxics emitted by refineries absorb and adsorb to the surfaces of PM. When inhaled with PM, these toxics including heavy metals and carcinogens are delivered deep into lung tissue.
Pooled results of many studies showed that for every 10 micrograms per meter cubed increase in PM2.5 levels, the risk of MI increases 0.4-1% (Brooks et al. 2010). However, this relationship has not been studied in the context of EJ communities. EJ communities are generally low income communities of color (Bullard 1993), which have higher exposures to pollution, more sources of stress, and higher biological markers of stress (Szanton et al. 2010; Carlson and Chamberlein 2005). All of these factors may affect the relationship between PM2.5 and MI, and increase the health impact of pollution in EJ communities relative to what has been found in the literature.
Sulfur Dioxide
Figure 3 below shows the fingerprint of the refinery emissions on the refinery corridor, using SO2 emissions as a surrogate for the cocktail of toxic emissions. The relationship between SO2 and health endpoints of cardiovascular disease and asthma have also been established in the literature (Kaldor et al. 1984).
In addition to assessing SO2 as a direct health stressor, it is also the most effective tracer of industrial emissions and specifically petroleum refineries for a number of reasons. Petroleum refineries are the largest source of SO2 in the BAAQMD by far (Table 1), and there are more monitors for SO2 than any of the other emitted chemical species that can be used to fingerprint the refineries. The distribution of SO2 is therefore representative of the cocktail of a combination of the hazardous chemicals released in refinery emissions.
Figure 3. Map of Sulfur Dioxide for the Bay Area Air Quality Management District
The next step for FracTracker Alliance is to further explore the relationship between health effects in the refinery communities and ambient levels of air pollution emitted by the refineries. Our staff is currently working with the California Department of Public Health to analyze the response of daily emergency room discharges for a variety of health impacts including cardiovascular disease and asthma.
References
Brody, J. G., R. Morello-Frosch, A. Zota, P. Brown, C. Pérez, and R. A. Rudel. 2009. Linking Exposure Assessment Science With Policy Objectives for Environmental Justice and Breast Cancer Advocacy: The Northern California Household Exposure Study. American Journal of Public Health 99:S600–S609.
Brook, R. D., B. Franklin, W. Cascio, Y. Hong, G. Howard, M. Lipsett, R. Luepker, M. Mittleman, J. Samet, S. C. Smith, and I. Tager. 2004. Air Pollution and Cardiovascular Disease. Circulation 109:2655–2671.
Brooks, R. D., S. Rajagopalan, C. A. Pope, J. R. Brook, A. Bhatnagar, A. V. Diez-Roux, F. Holguin, Y. Hong, R. V. Luepker, M. A. Mittleman, A. Peters, D. Siscovick, S. C. Smith, L. Whitsel, and J. D. Kaufman. 2010. Particulate Matter Air Pollution and Cardiovascular Disease. Circulation 121:2331–2378.
Bullard, R. D. 1993a. Race and Environmental Justice in the United States Symposium: Earth Rights and Responsibilities: Human Rights and Environmental Protection. Yale Journal of International Law 18:319–336.
Bullard, R. D. 1993b. Confronting Environmental Racism: Voices from the Grassroots. South End Press.
Carlson, E.D. and Chamberlain, R.M. (2005), Allostatic load and health disparities: A theoretical orientation. Res. Nurs. Health, 28: 306–315. doi:10.1002/nur.20084
Kaldor, J., J. A. Harris, E. Glazer, S. Glaser, R. Neutra, R. Mayberry, V. Nelson, L. Robinson, and D. Reed. 1984. Statistical association between cancer incidence and major-cause mortality, and estimated residential exposure to air emissions from petroleum and chemical plants. Environmental Health Perspectives 54:319–332.
Poloniecki, J. D., R. W. Atkinson, A. P. de Leon, and H. R. Anderson. 1997. Daily Time Series for Cardiovascular Hospital Admissions and Previous Day’s Air Pollution in London, UK. Occupational and Environmental Medicine 54:535–540.
Rudel, R. A., R. E. Dodson, L. J. Perovich, R. Morello-Frosch, D. E. Camann, M. M. Zuniga, A. Y. Yau, A. C. Just, and J. G. Brody. 2010. Semivolatile Endocrine-Disrupting Compounds in Paired Indoor and Outdoor Air in Two Northern California Communities. Environmental Science & Technology 44:6583–6590.
Szanton SL, Thorpe RJ, Whitfield KE. Life-course Financial Strain and Health in African-Americans. Social science & medicine (1982). 2010;71(2):259-265. doi:10.1016/j.socscimed.2010.04.001.
By Daniel Menza, Data & GIS Intern, and Kyle Ferrar, Western Program Coordinator, FracTracker Alliance
Cover photo credit: Claycord.com
https://www.fractracker.org/a5ej20sjfwe/wp-content/uploads/2017/05/tesoro-refinery_re.jpg400900Kyle Ferrar, MPHhttps://www.fractracker.org/a5ej20sjfwe/wp-content/uploads/2025/09/2025-Wordmark-Logo.pngKyle Ferrar, MPH2017-05-10 09:48:052021-04-15 15:03:07Tracking Refinery Emissions in California’s Bay Area Refinery Corridor
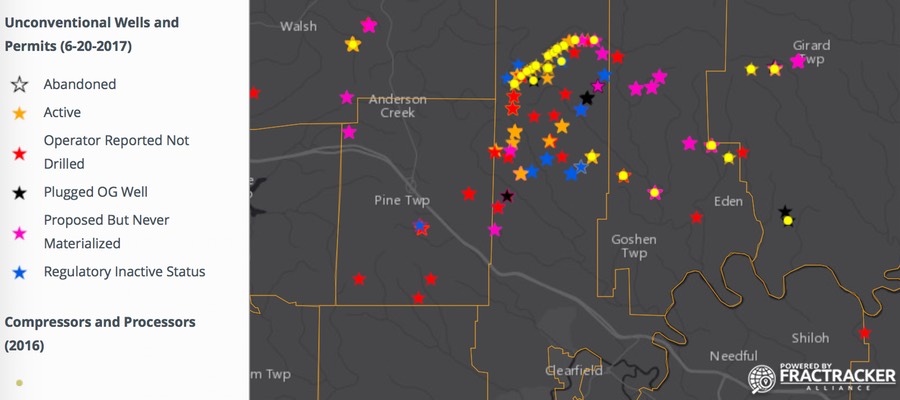
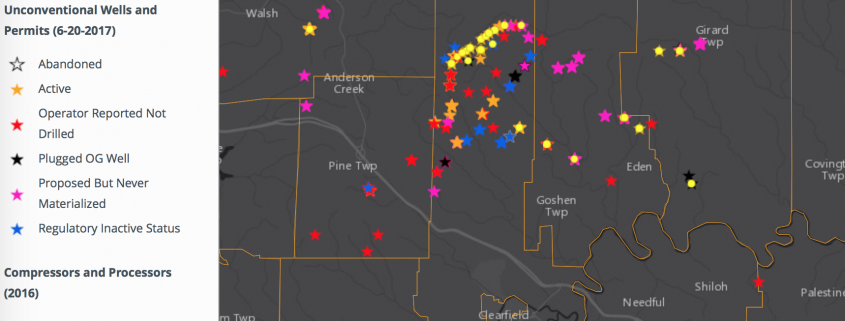
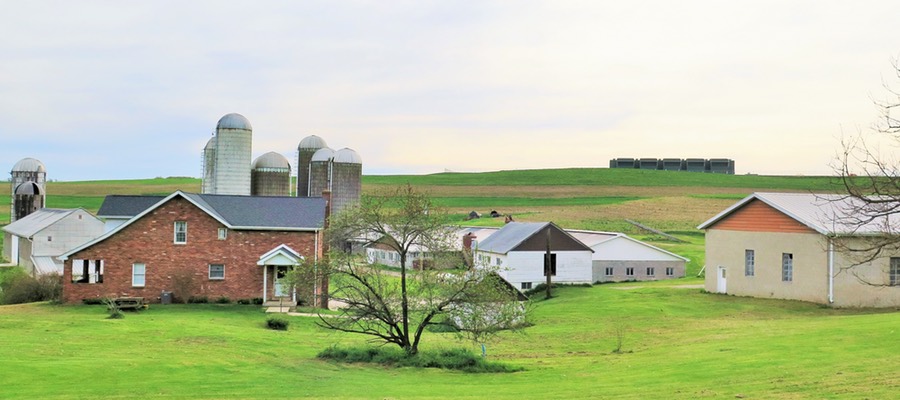

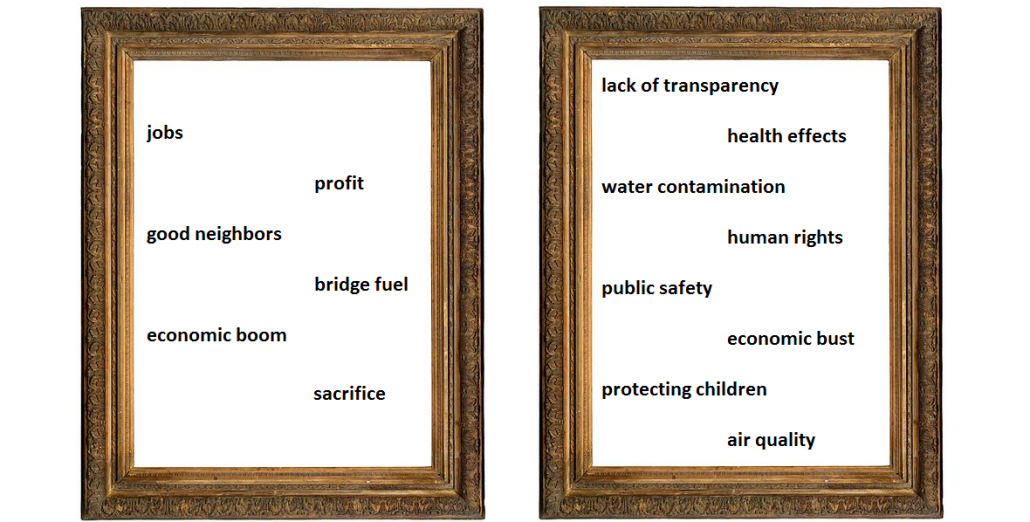

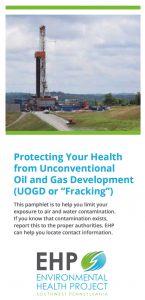
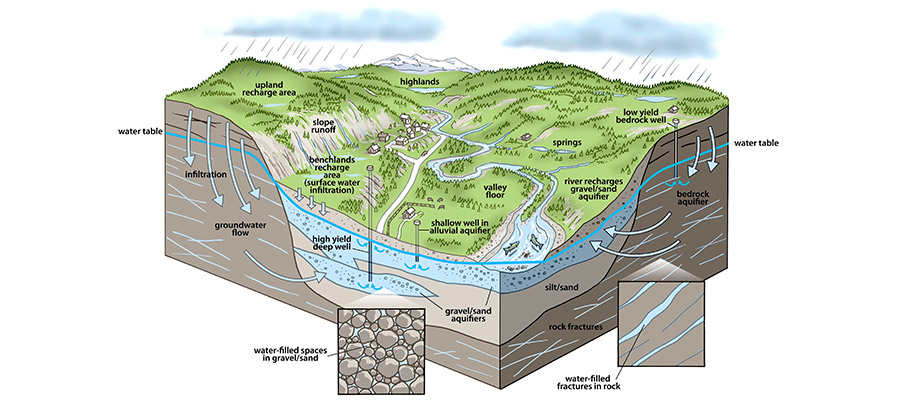
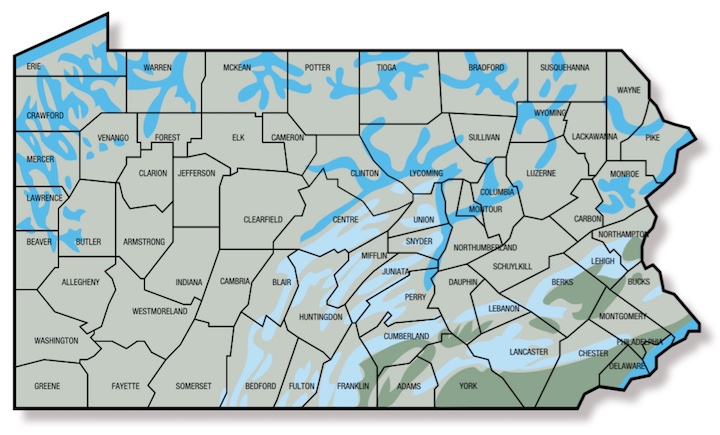
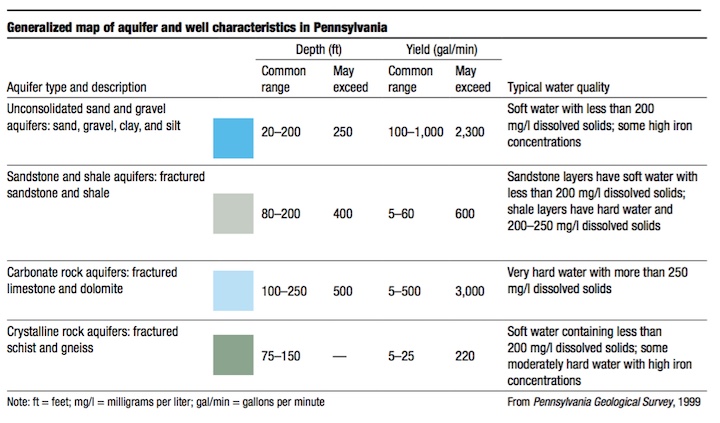
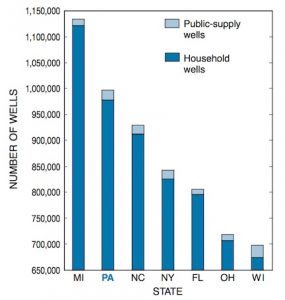
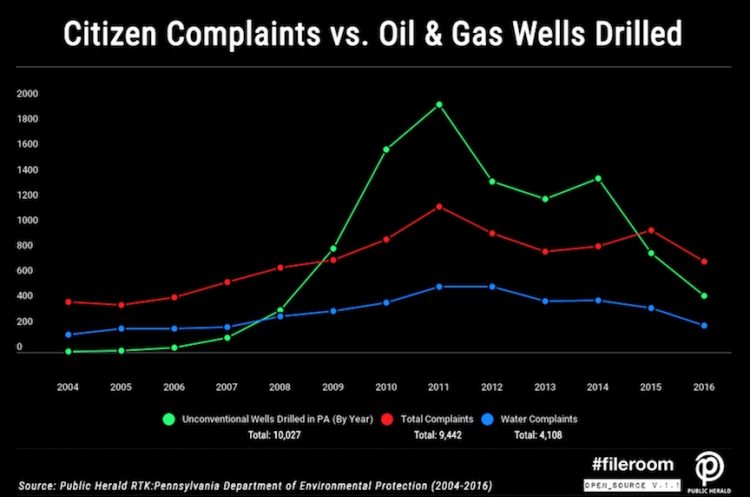
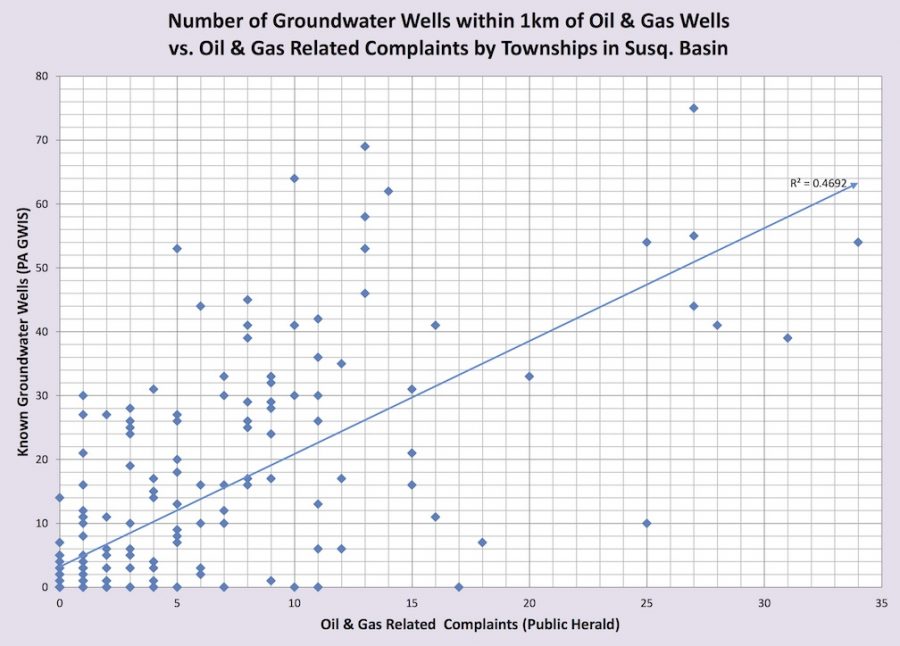
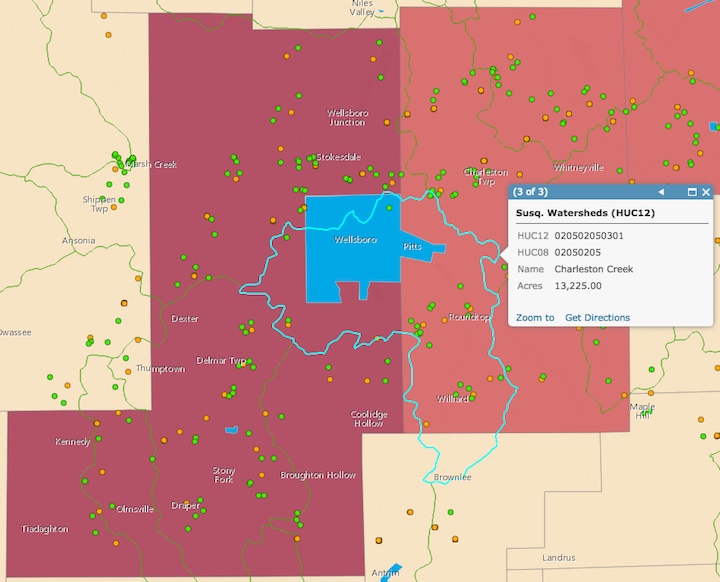
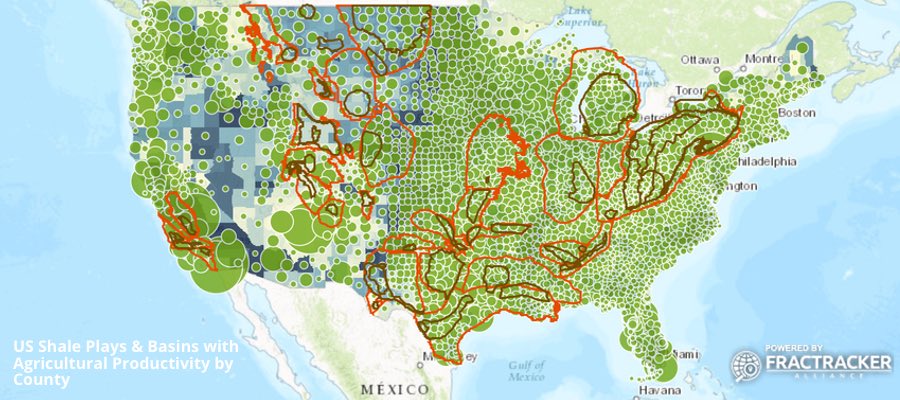
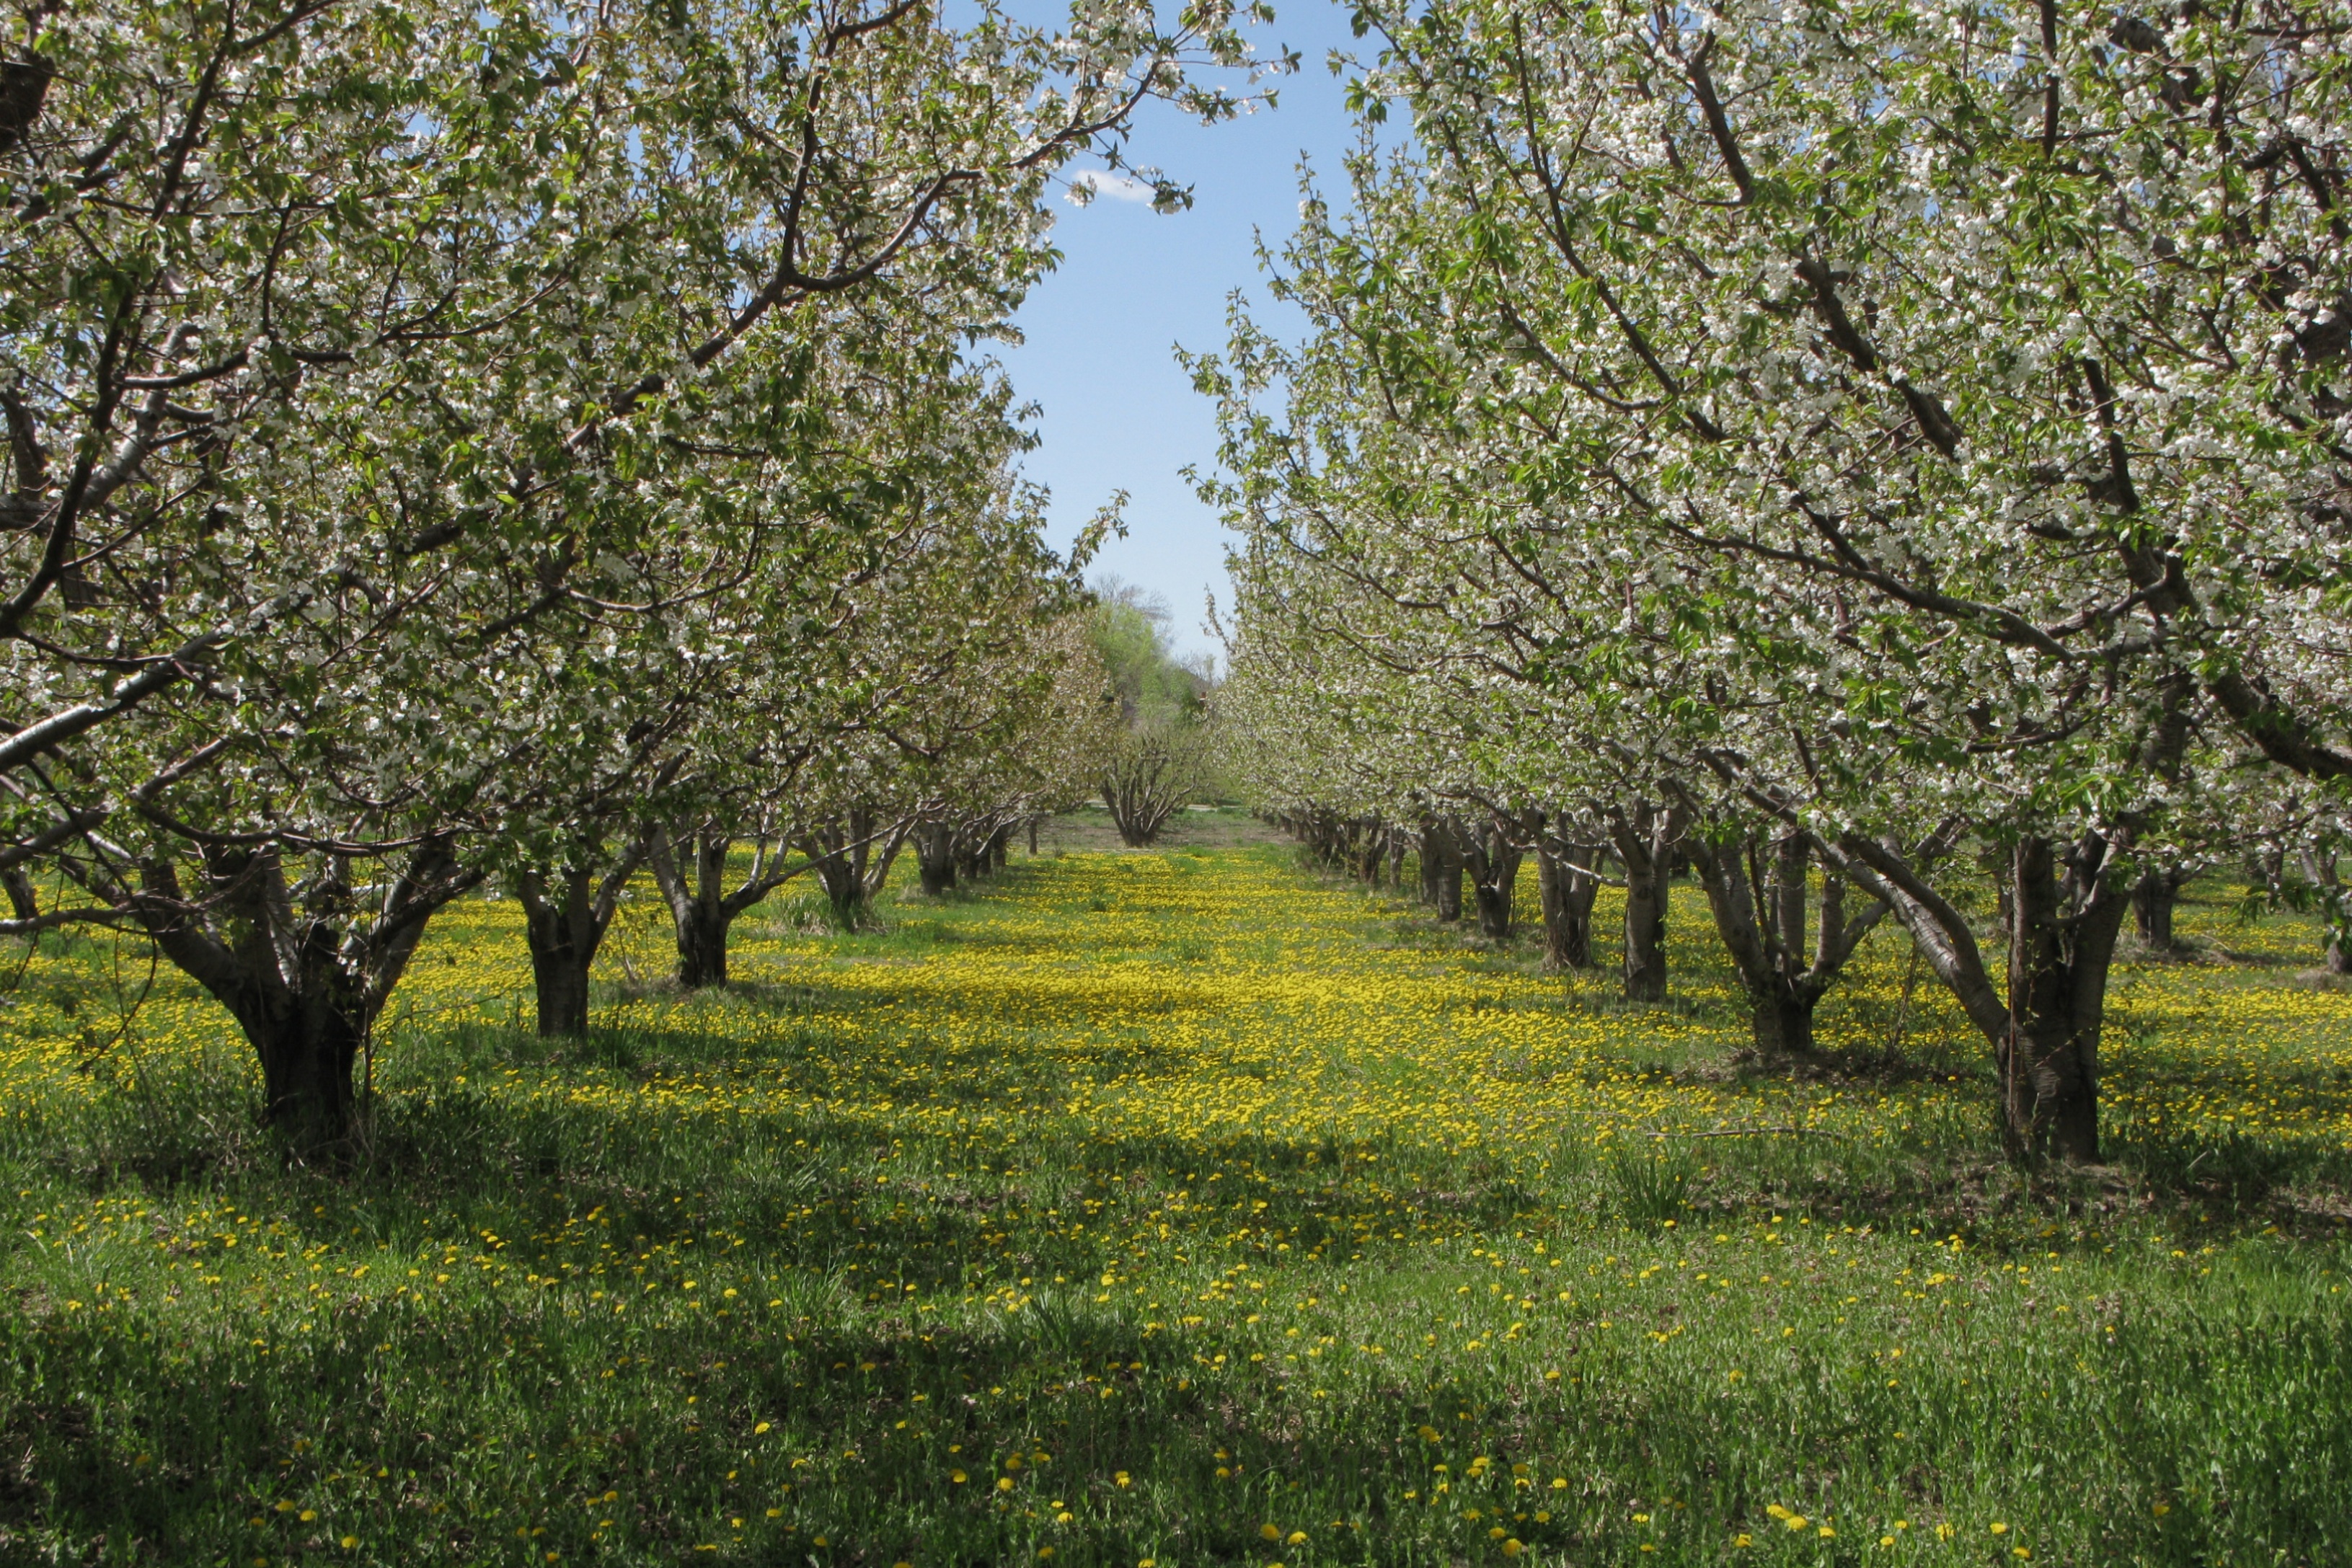
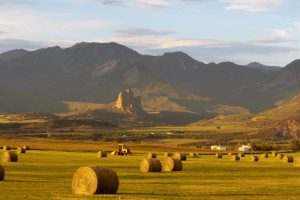
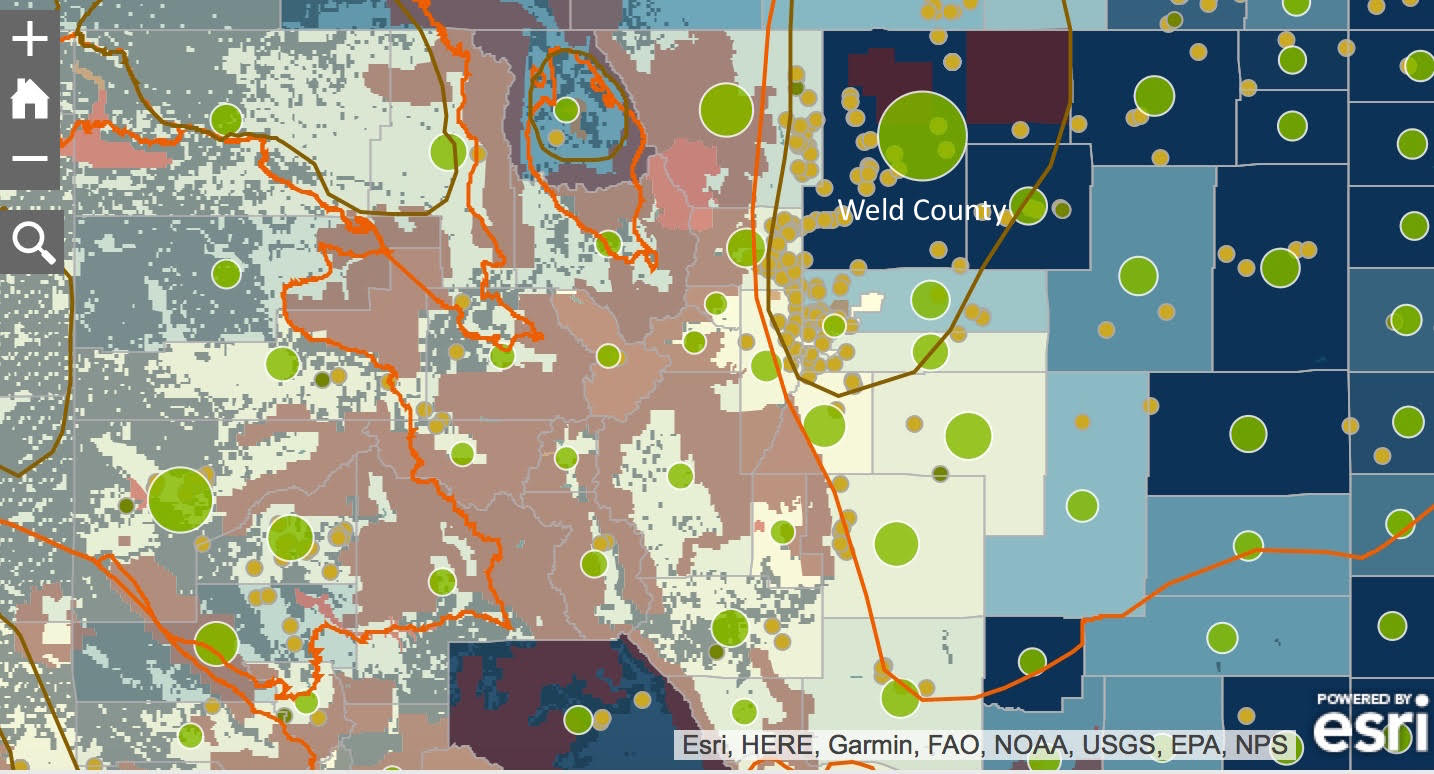
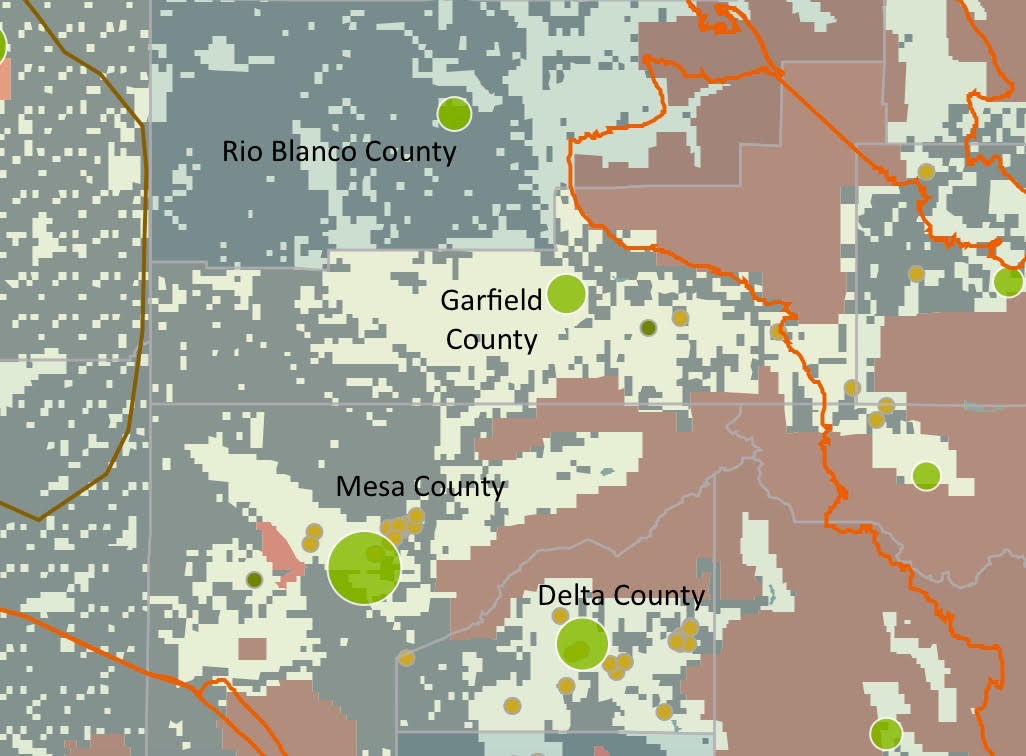
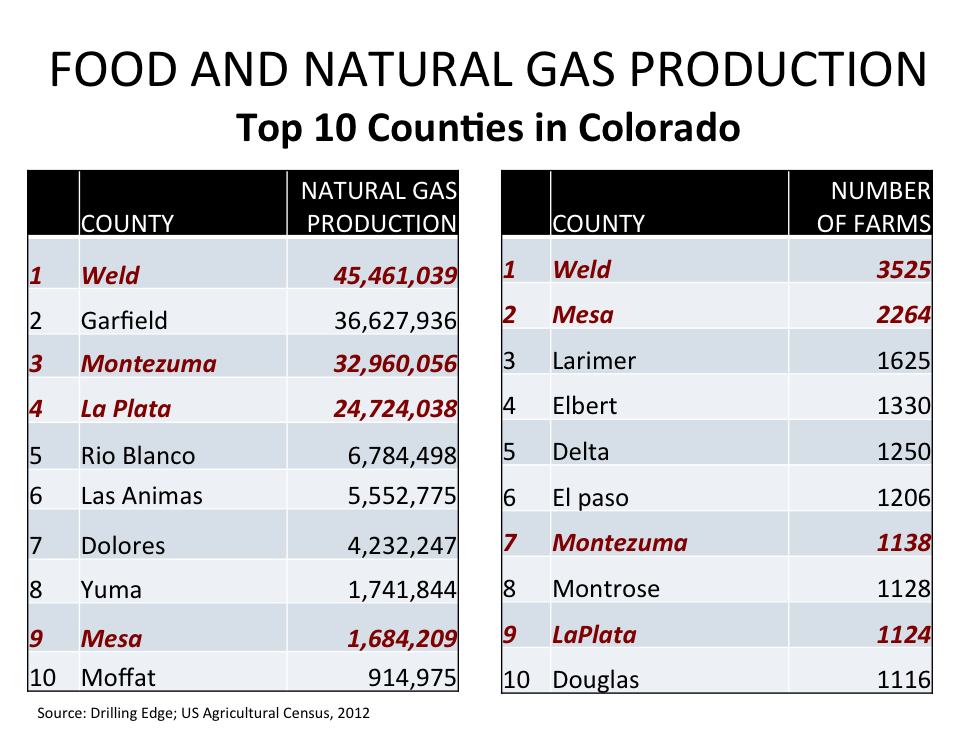


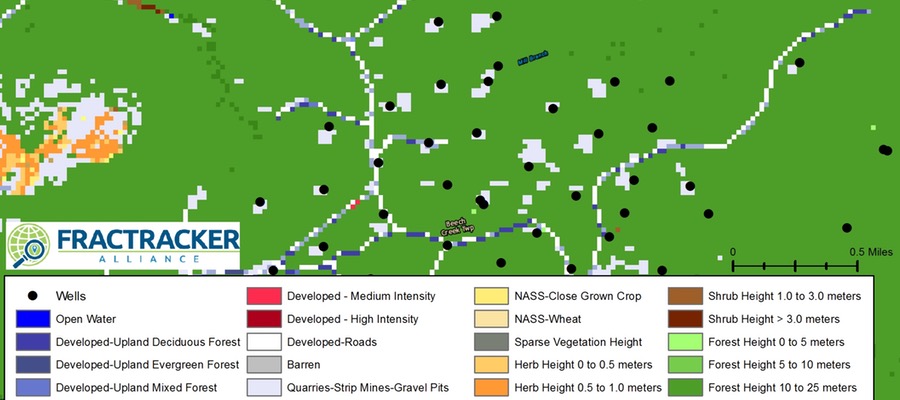
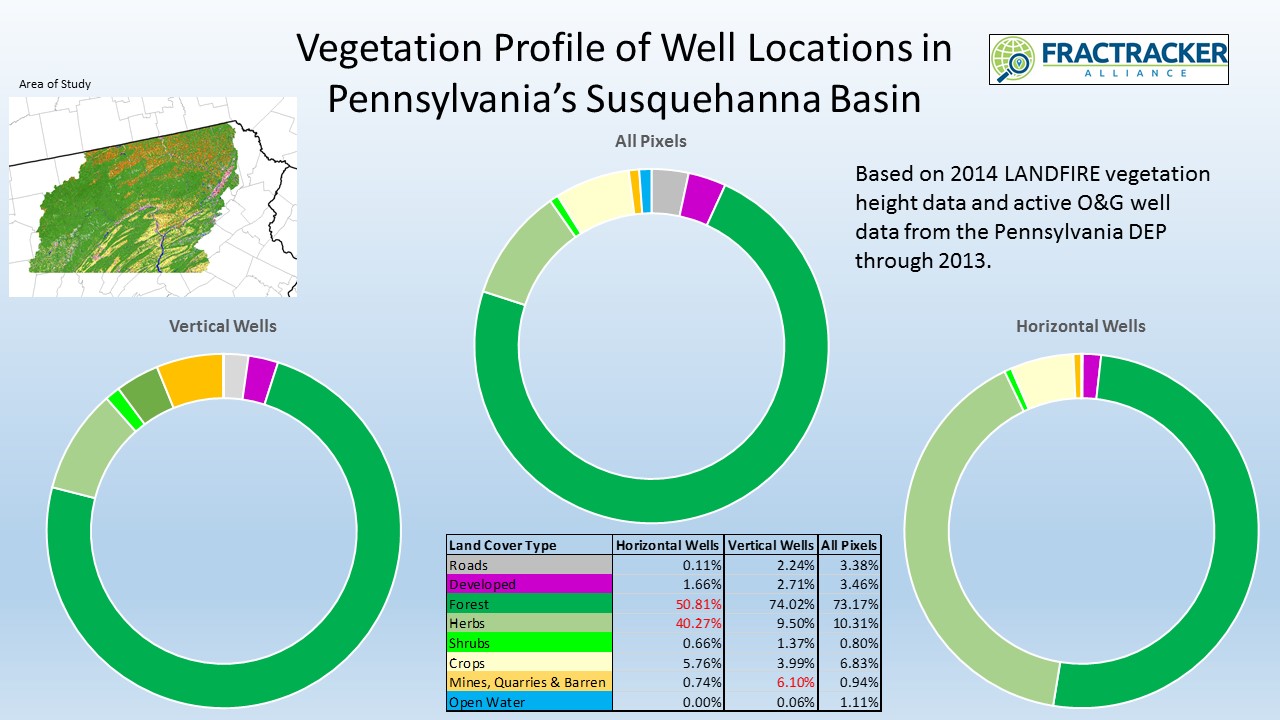
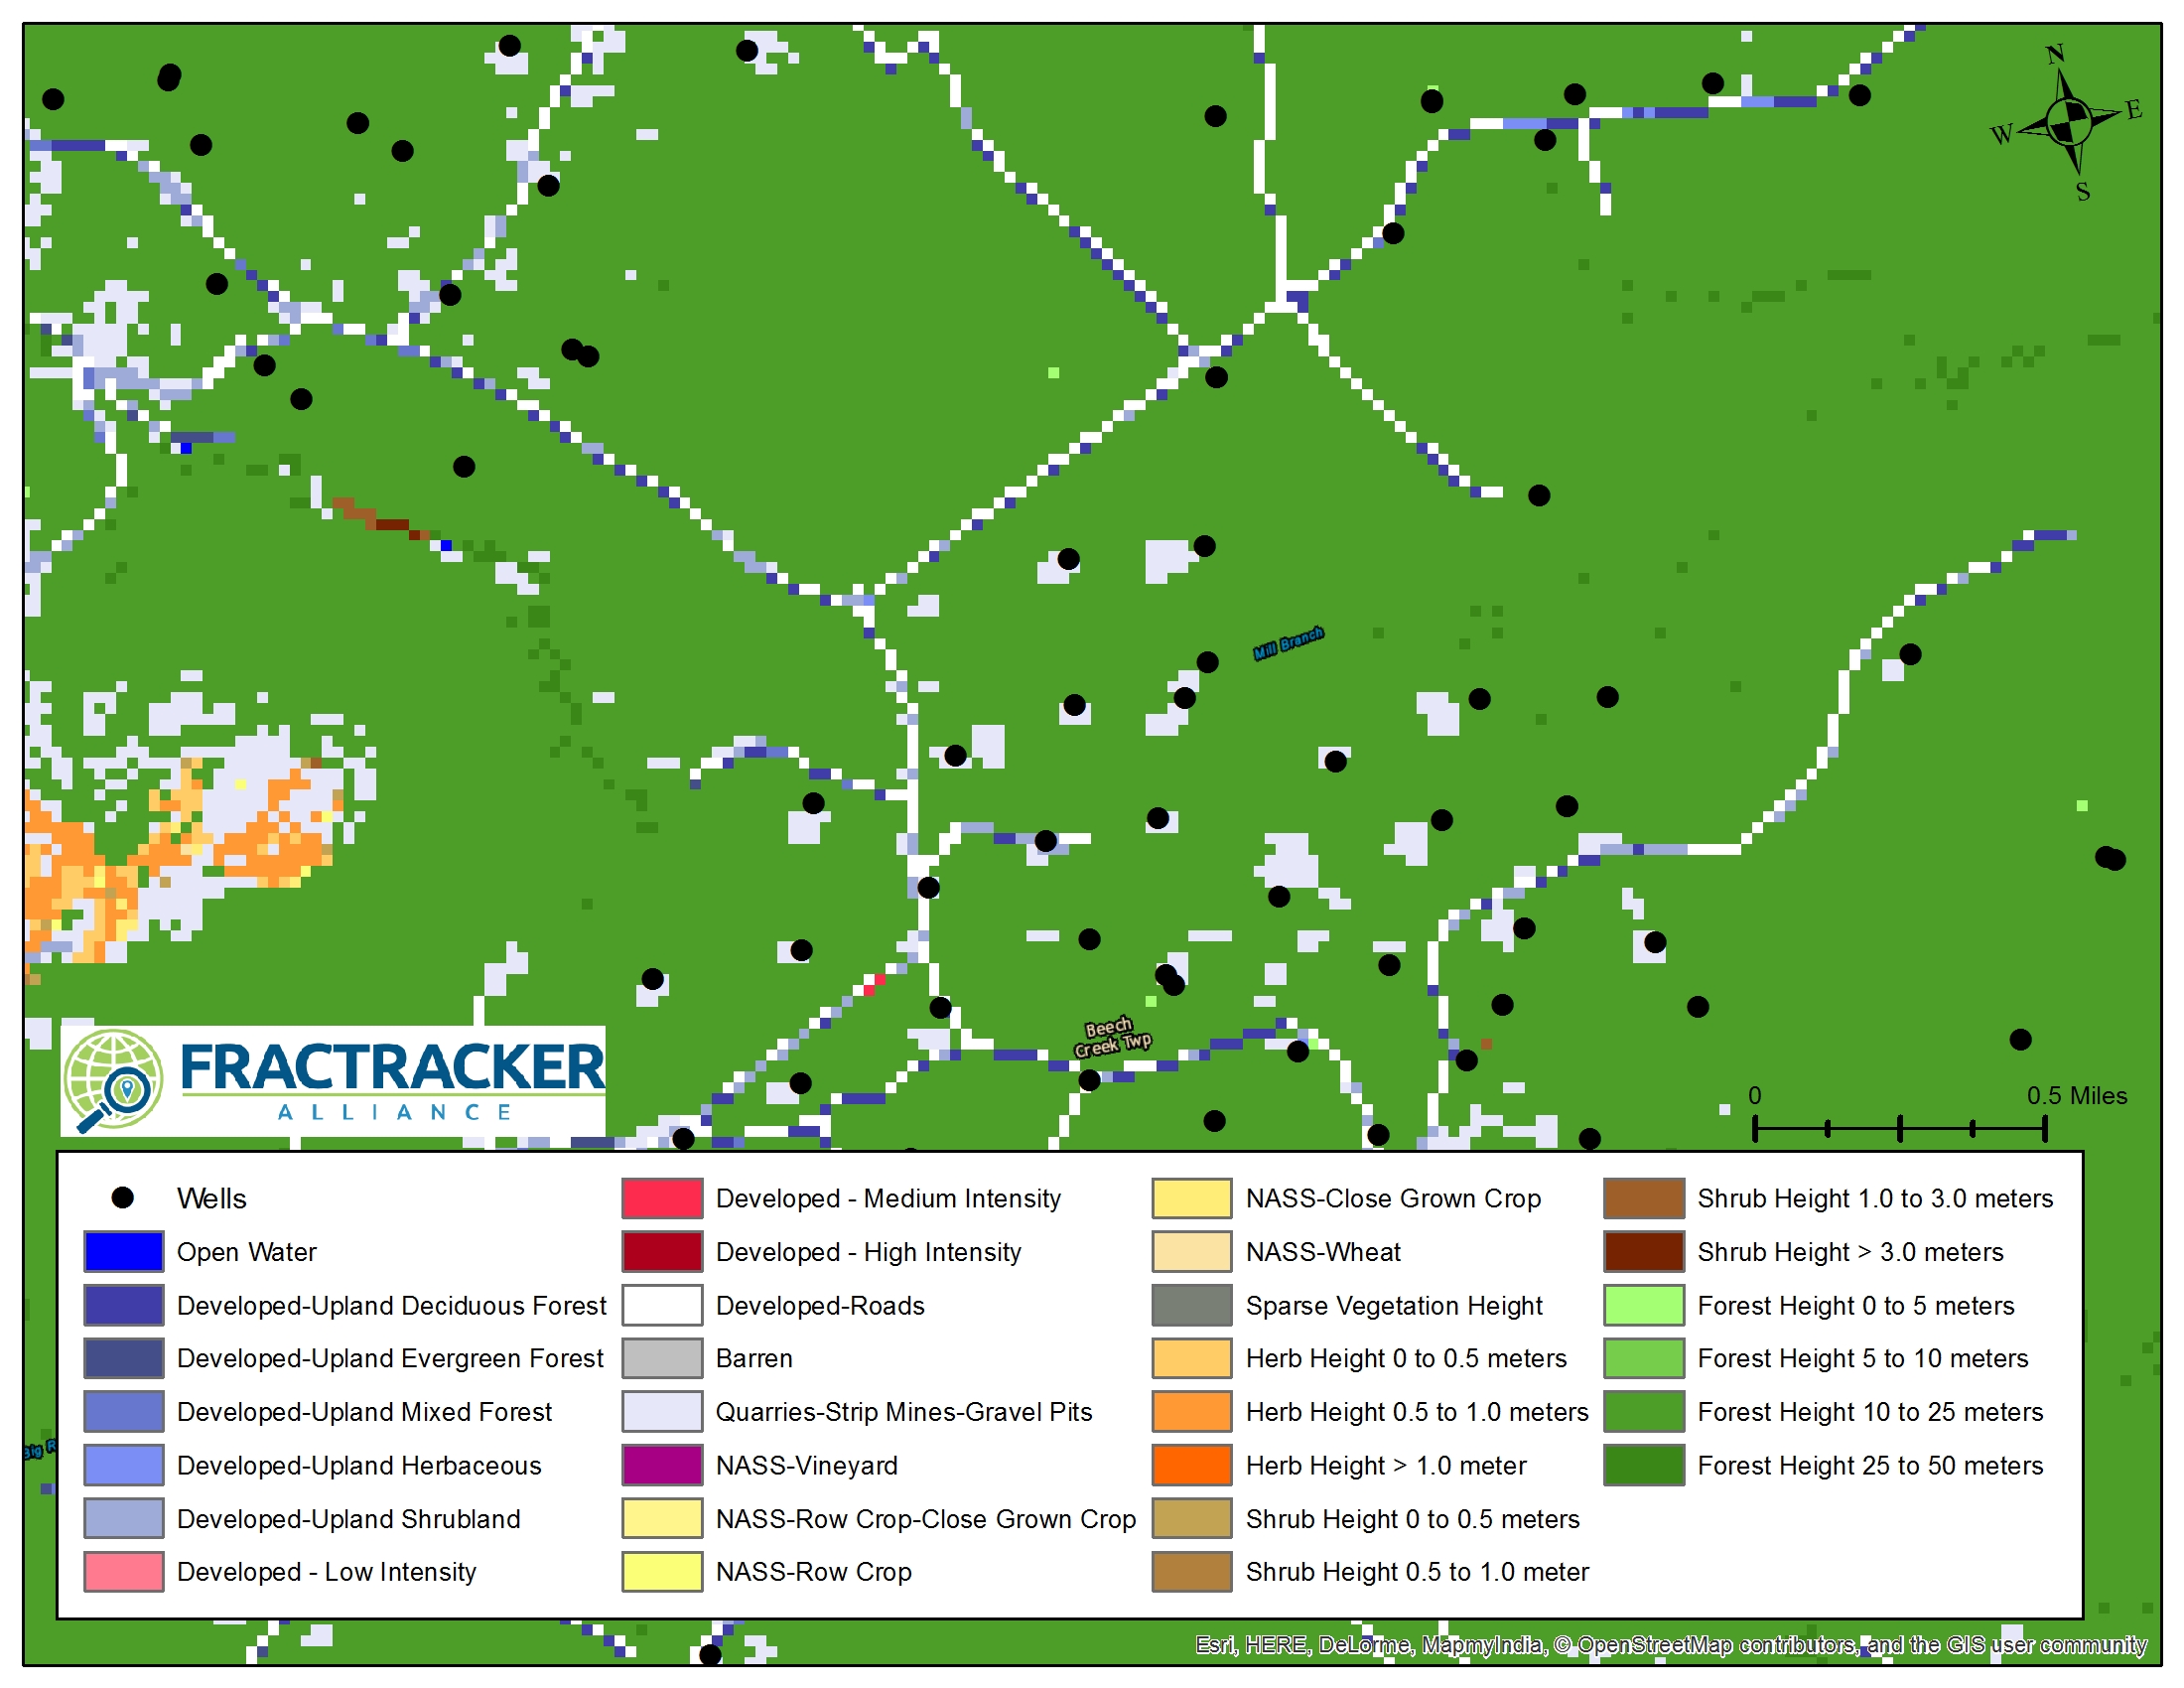
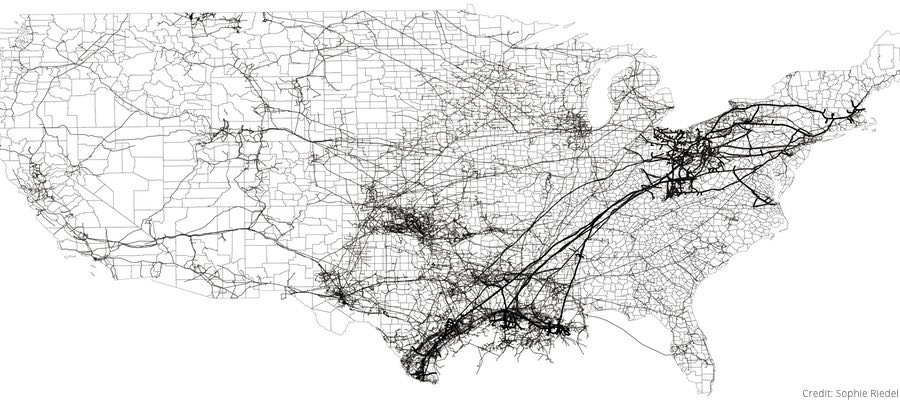
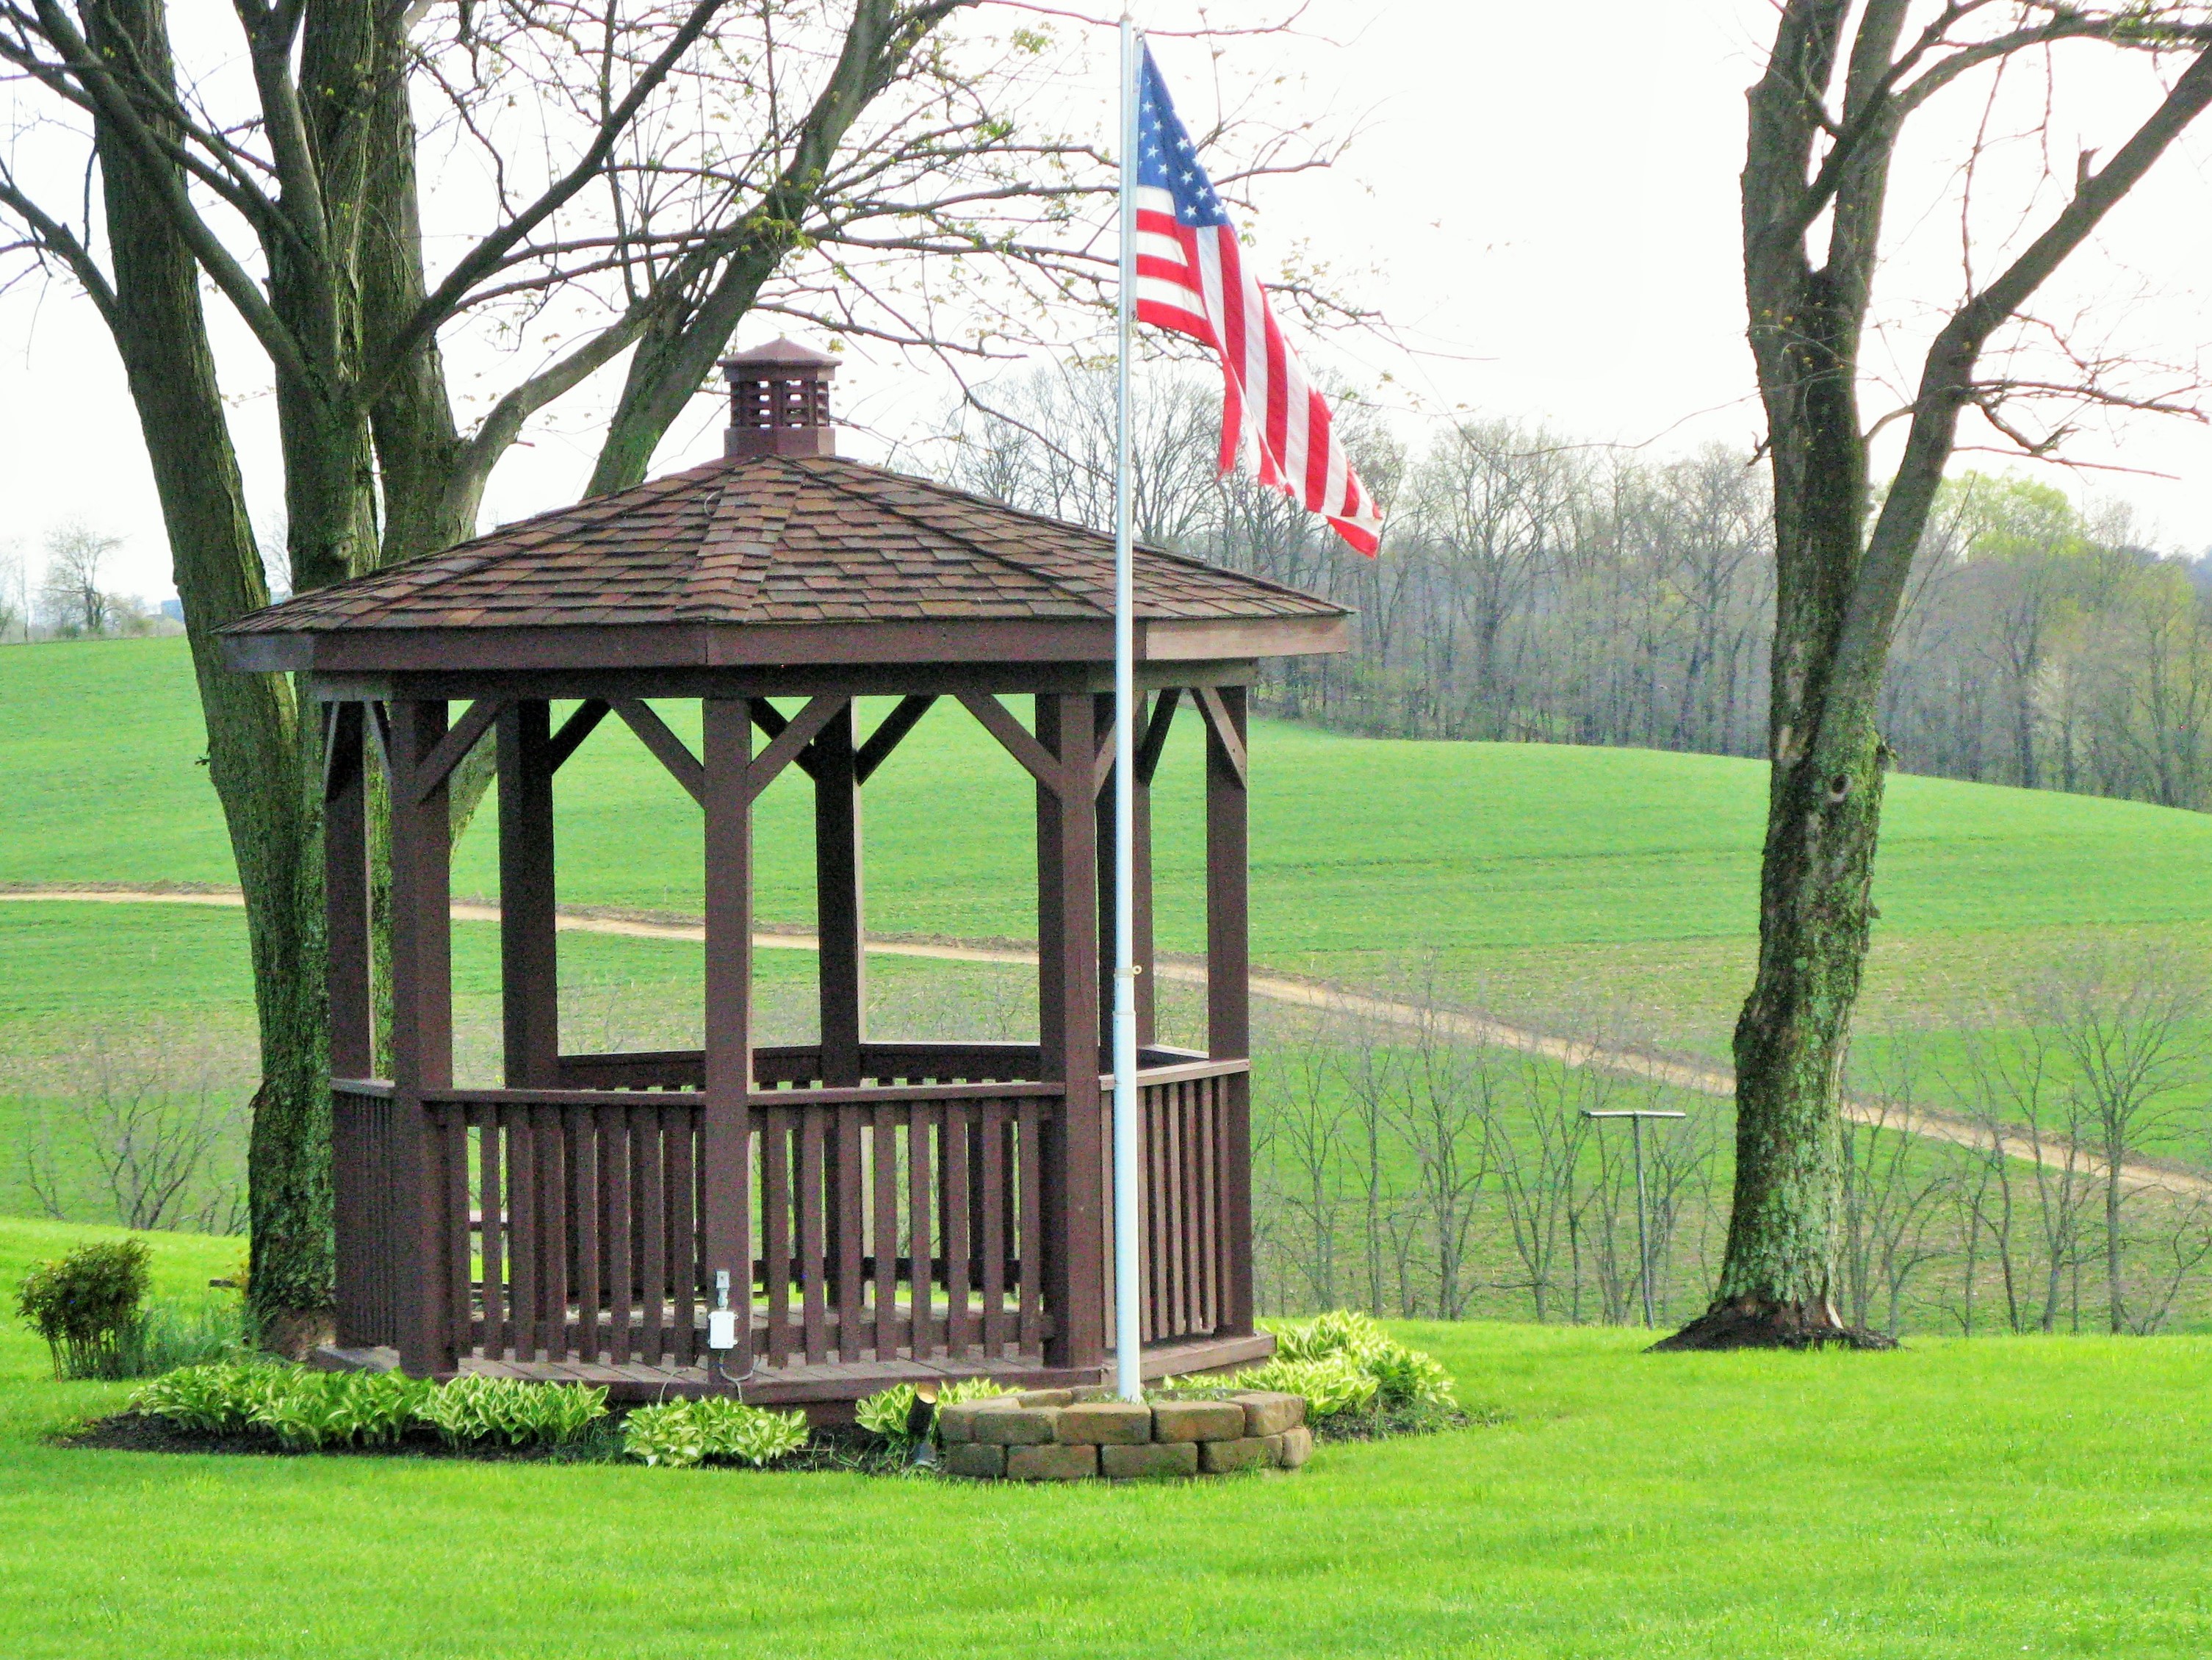
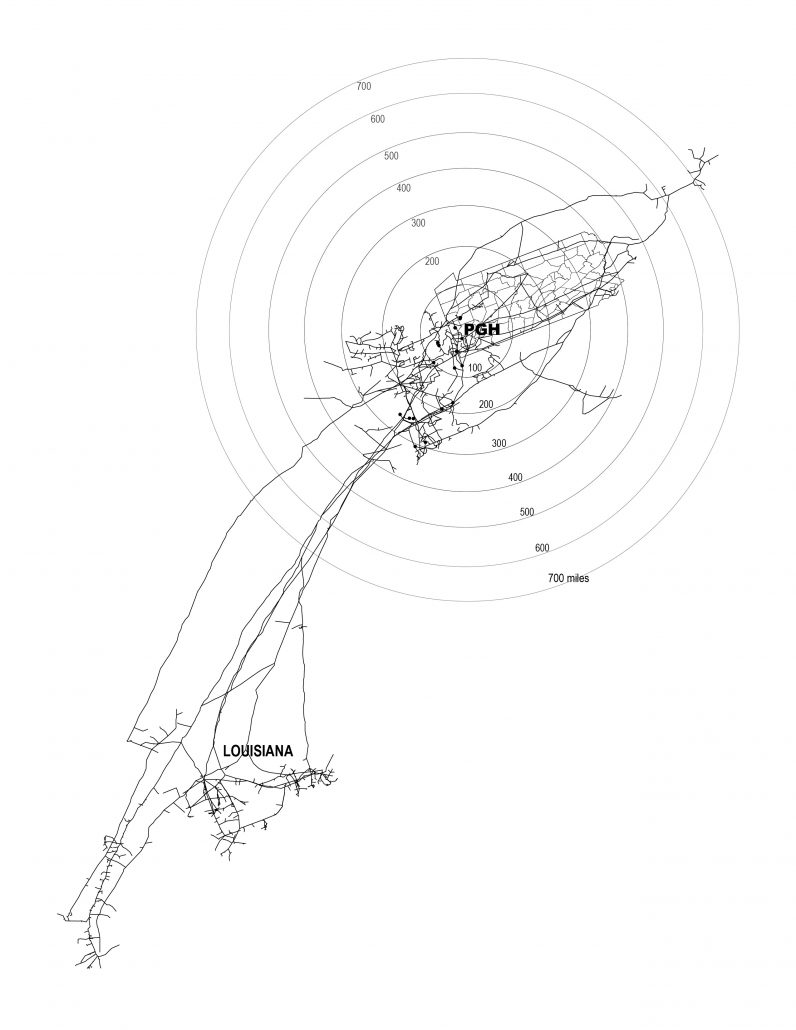
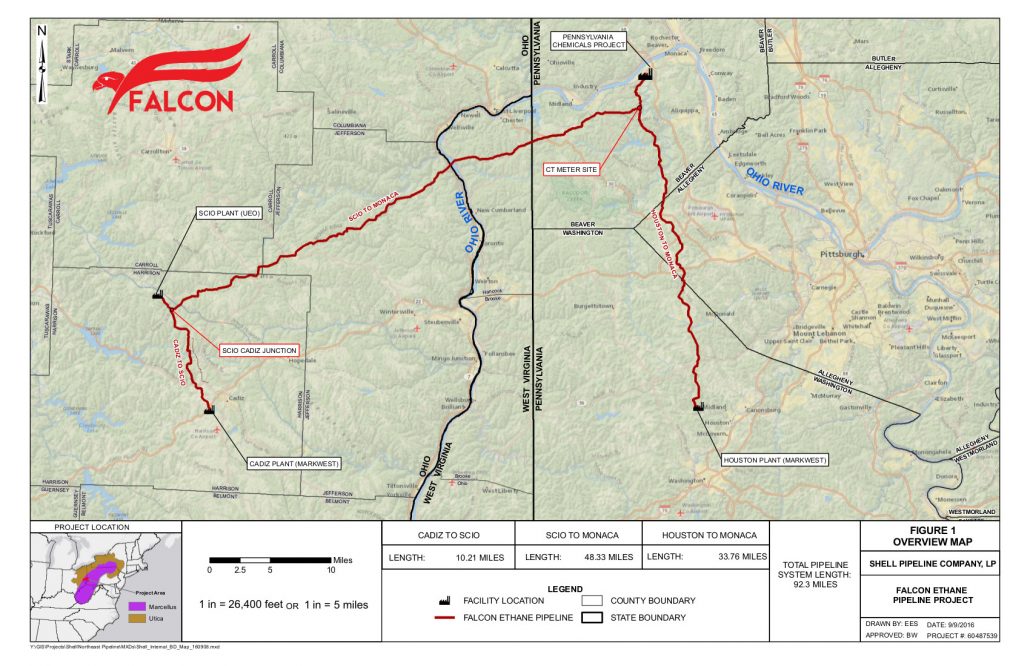
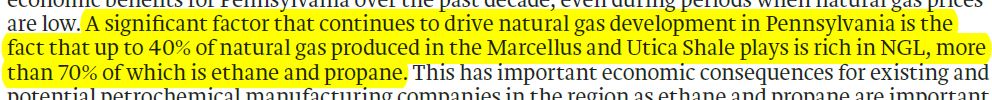
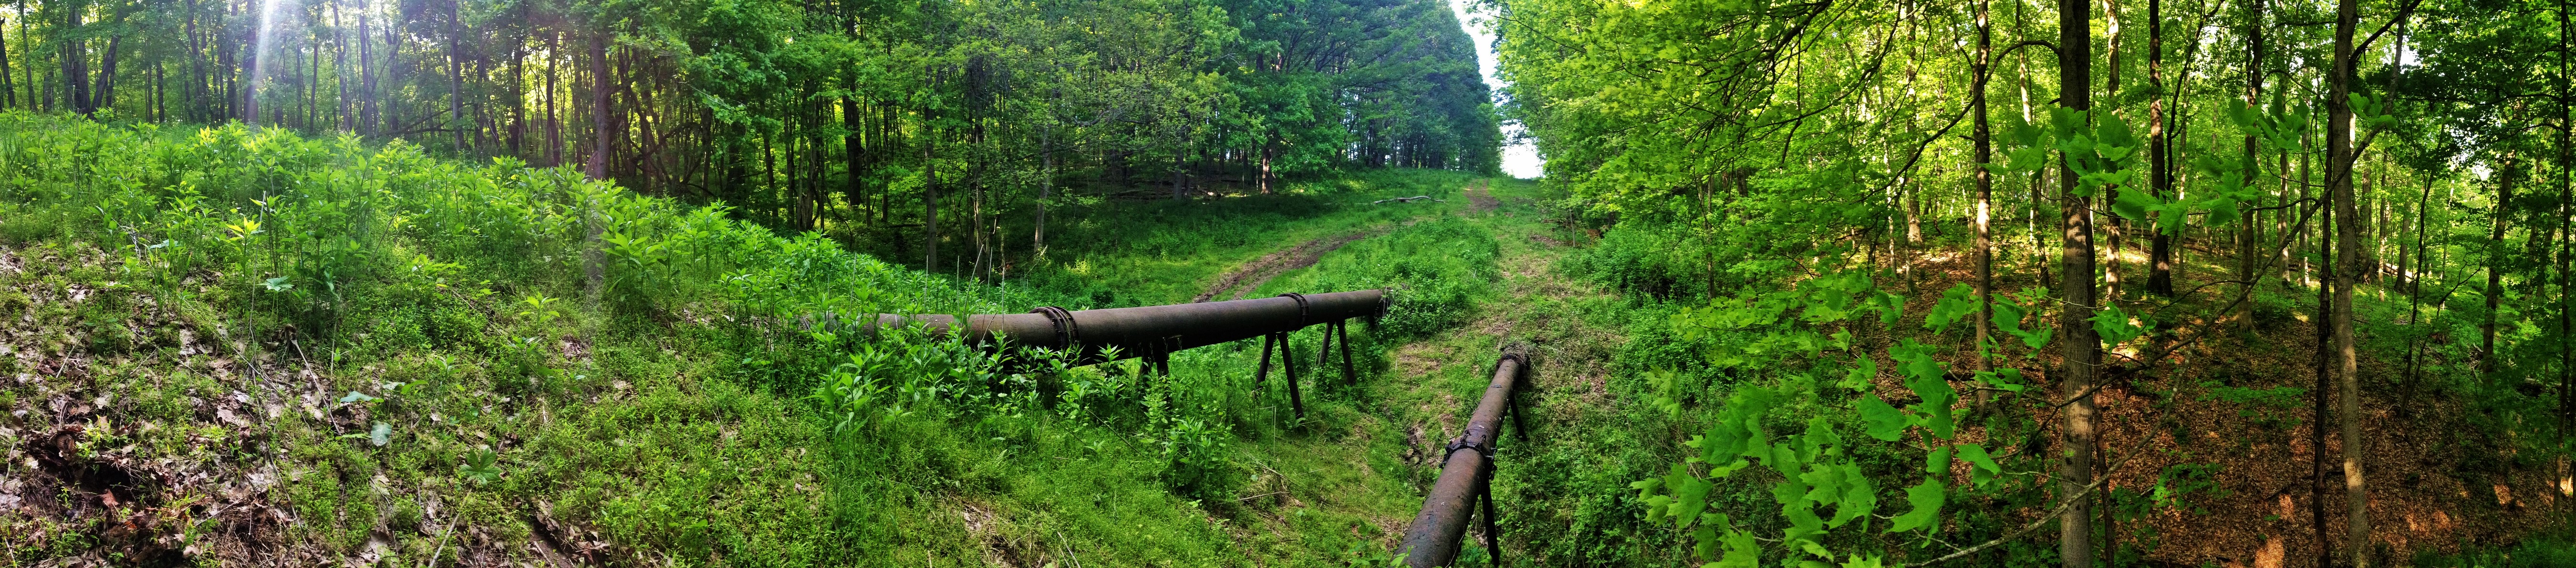
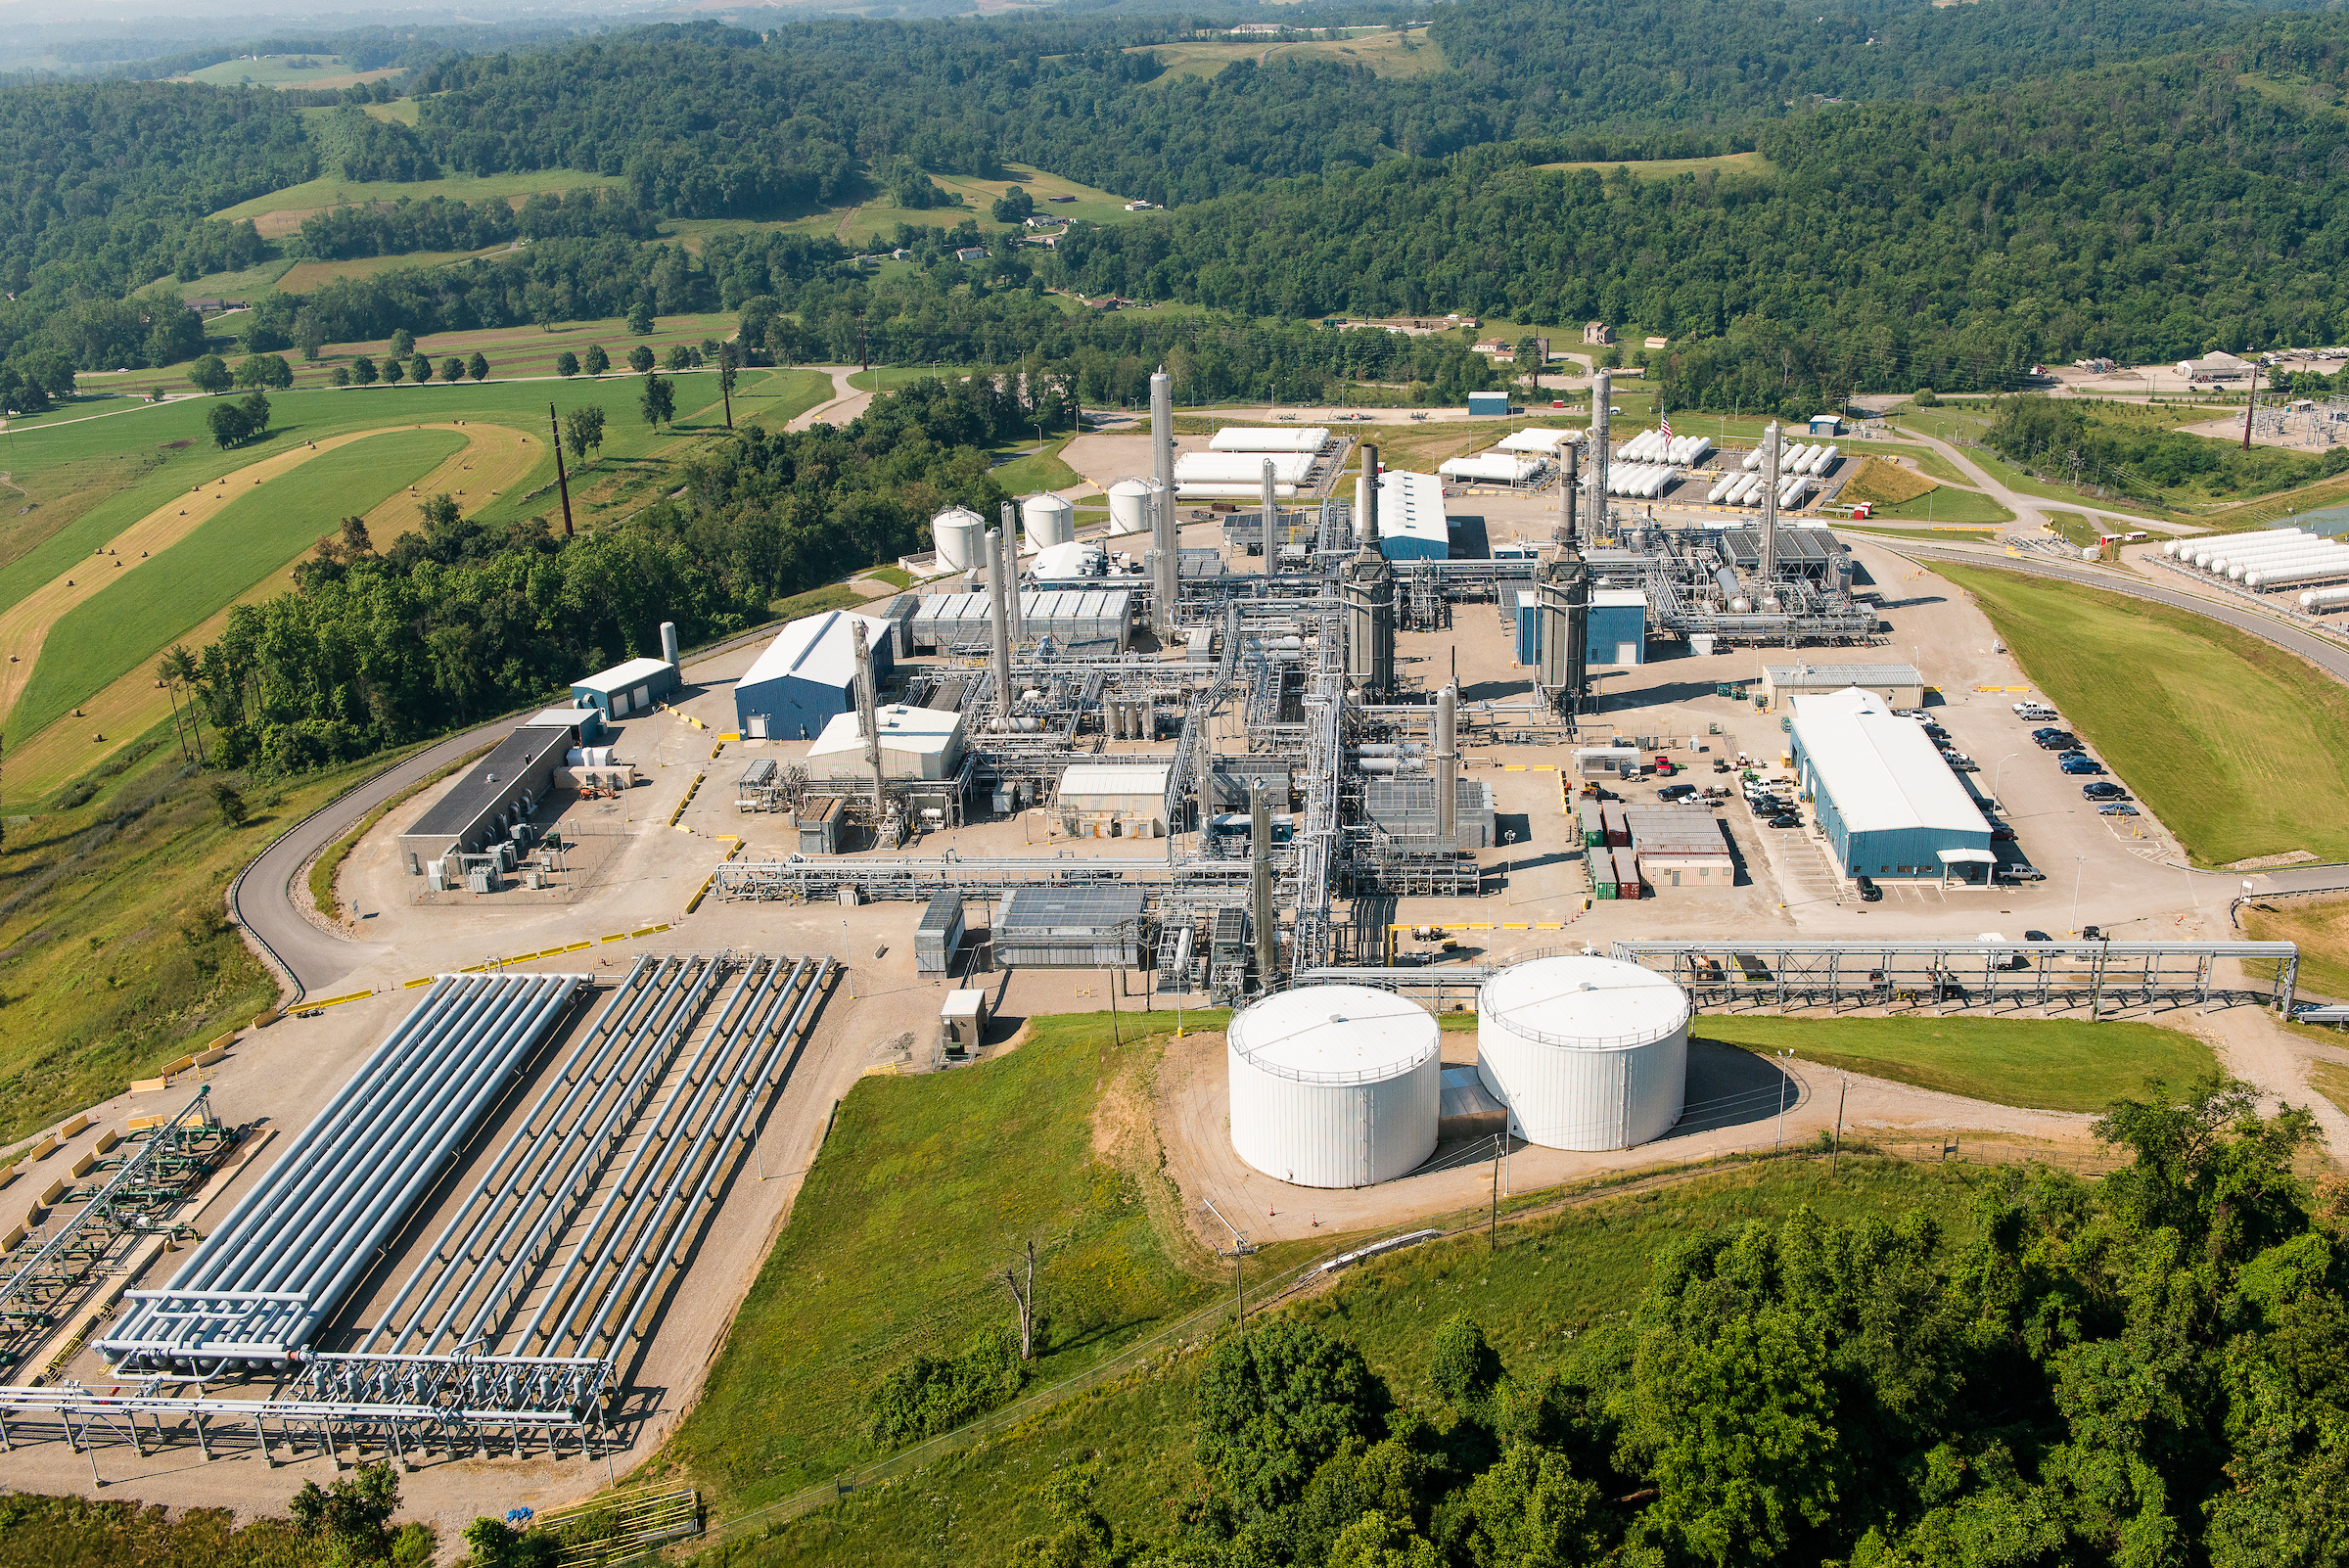
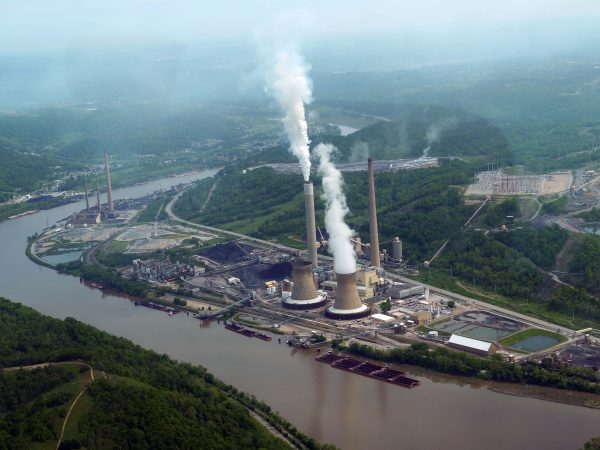


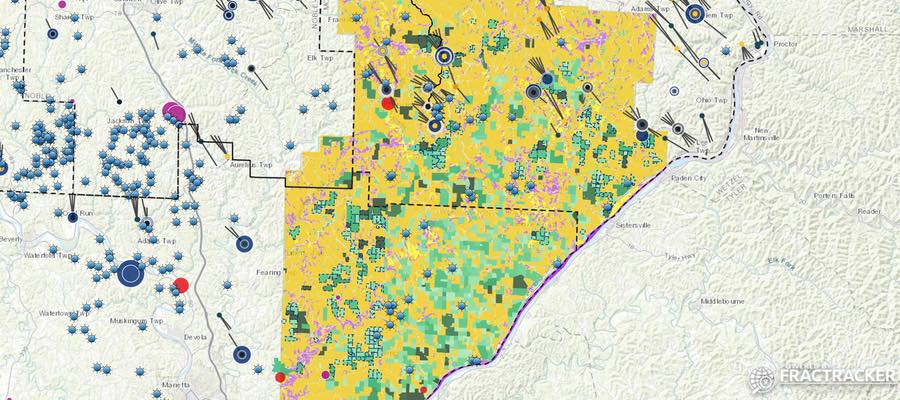


")
")
")
")
")
")

")

")


")
")