The majority of FracTracker’s posts are generally considered articles. These may include analysis around data, embedded maps, summaries of partner collaborations, highlights of a publication or project, guest posts, etc.
Citizen David Tames Gas Goliaths on the Marcellus Shale Stage: Citizen Action as a Form of Dispute Prevention in the Internet Age
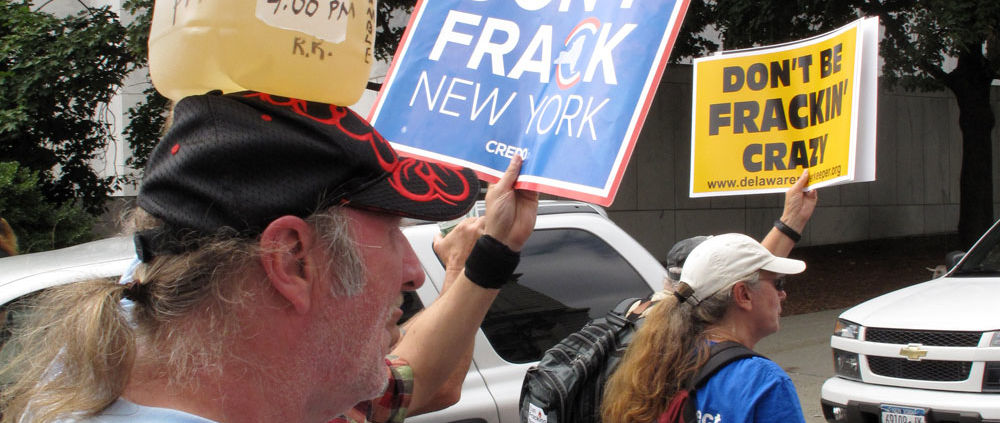
A NY colleague of ours recently published an article on the issue of natural gas drilling and public engagement in New York State. The potential for environmental and public health issues were discussed in great detail for those who are interested in becoming more versed on the topic. (FracTracker was mentioned as a tool for dispute prevention, so that is exciting for us, too!)
Article Excerpt
“Water, water everywhere and not a drop to drink.” This could soon become the lament of millions of people who derive their drinking water from sources located near the latest natural gas boom site in the East, known as the “Marcellus Shale” region. Drilling is underway in Pennsylvania and West Virginia, but not yet in New York. The focus here is New York.
Horizontal hydraulic fracturing holds promise for accessing shale gas. But with the current state of the industry practices, it also promises certain devastation to the environment and human health unless all local, state, and federal government officials immediately begin to take seriously the already documented risks associated with this unconventional drilling method. Every citizen has an interest in protecting our natural resources, water included. In this real life drama, David is played by U.S. citizens and Goliath is played by the rich and powerful oil and gas industry. Members of the oil and gas industry and land-owning citizens seeking to lease their property for gas extraction prefer the circumscribed definition of the term hydraulic fracturing or “fracking,” which refers only to the actual gas drilling. Environmental groups and individuals advocating for conservation of natural resources opt for a broad interpretation of the term, reasoning that every step in the hydraulic gas drilling process is worthy of attention since adverse impacts can and do result from steps before and after the actual drilling occurs. The future environmental and human …
Published in the Spring, 2011 edition of Cardozo Journal of Conflict Resolution. 373. by Elisabeth N. Radow
https://www.fractracker.org/a5ej20sjfwe/wp-content/uploads/2014/07/NY-Protest.jpg13331000FracTracker Alliancehttps://www.fractracker.org/a5ej20sjfwe/wp-content/uploads/2025/09/2025-Wordmark-Logo.pngFracTracker Alliance2011-09-02 13:43:342020-07-21 10:38:20Energy and the Environment: Preventing and Resolving Conflicts
The Debate: Can the process of hydraulically fracturing underground natural gas wells contaminate groundwater?
Industry Position: There has never been a documented case of groundwater contamination due to hydraulic fracturing; the process occurs thousands of feet below drinking water aquifers. Therefore, the chemicals used in the fracturing process pose no threat to drinking water.
Opposition Position: It can and has contributed to pollution of underground drinking water sources.
The Data: Previous lawsuits from landowners were settled by the industry and the data kept private for various litigation reasons. A U.S. EPA report now indicates that hydraulic fracturing has been linked to at least one case of drinking water contamination in West Virginia in 1987 and could feasibly contribute to future problems.
Future Obligations: Some improved regulations and protections have been put in place since 1987, but the risk still exists if natural gas drilling is done hastily or if abandoned wells exist nearby. Once pollutants are introduced into underground water aquifers they are very difficult to remove, so significant care and review must be taken if drilling is going to continue. The EPA report further supports the need for increased government and industry transparency across the board. It should also be stated that a large-scale health impact assessment is needed to comprehensively determine the risk that the entire natural gas drilling operation poses to public health.
Compiled by: Samantha Malone, MPH, CPH – Communications Specialist, Center for Healthy Environments and Communities (CHEC), Environmental and Occupational Health (EOH) department, University of Pittsburgh Graduate School of Public Health (GSPH); and Doctoral Student, GSPH
I was recently contacted by a resident of New York State who was concerned about Marcellus Shale gas drilling moving into his area. He found a report by geologists Dr. Gary Lash from SUNY – Fredoinia and Dr. Terry Engelder from Penn State that showed the shale layer thinning substantially as it heads north across the Pennsylvania-New York border.
What’s more, this report breaks up the Marcellus Shale into several substrata, including the Union Springs shale and the Oatka Creek shale, which are separated by a thin and intermittent layer of limestone.
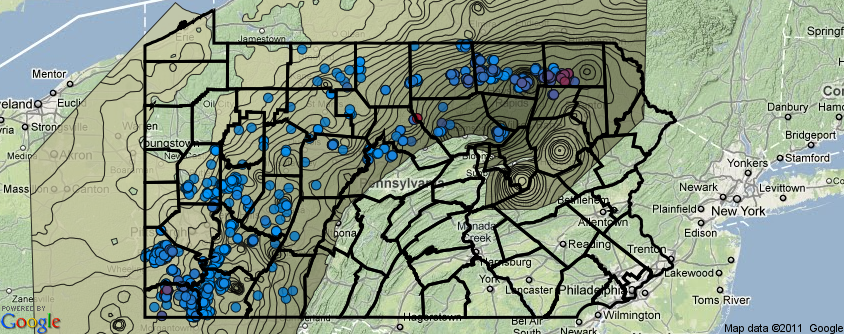
On a cursory level, the thickest parts of the Union Springs substratum of the Marcellus Shale seemed to correspond with the highest production areas in Bradford and Susquehanna Counties. Even though there was another high production area in Southwestern Pennsylvania in a relatively thin portion of the Union Springs (and Marcellus Shale in general), it seemed like a reasonable hypothesis to explore. Does the thickness of the shale layer effectively predict the production values from wells in those areas?
Thickness of the Union Springs substratum of the Marcellus Shale and daily production values. As the shale layer gets thicker, it is represented by darker brown bands, while production values range from blue (lowest production) to red (highest production). For more information and a dynamic view, click the image to visit our DataTool.
Karen Edelstein, FracTracker’s New York Liason, digitized the Union Springs thickness map from the Lash-Engelder report, and then I was able to correlate the production values of all Marcellus Shale wells to the average thickness of each category. For the purpose of this exercise, only wells reporting positive (non-zero) production values between July and December 2011 were included. To account for wells in production for only part of that period, I calculated the average daily production in thousands of cubic feet (Mcf) per day.
Thickness of the Union Springs substratum of the Marcellus Shale in feet versus average daily production in thousands of cubic feet (Mcf) per day.
Overall, the correlation isn’t very strong. While the trend line does show moderate increases in production as the Union Springs shale layer thickens, the low R-squared shows that there is a good bit of randomness involved. Part of this was expected, due to the large number of productive wells in Southwestern Pennsylvania, where the formation is quite thin. This would be the notable bump in the plot chart above between 20 and 60 feet of thickness.
Thickness of the Union Springs substratum of the Marcellus Shale and average daily production values. Click the image for more information and a dynamic view.
However, there is another factor that contributes to the poor correlation. As I mentioned above, the trendline does indicate that on average, wells in the thicker formations produce more gas than those in thinner formations, but there are also a large number of duds from the most robust parts of the Union Springs. That is to say, there are a lot of blue dots in the dark brown regions of the map below.
It is likely that if the whole thickness of the Marcellus Shale were considered, the results would have been even worse. In fact, some of the thickest parts of the whole Marcellus, at least according to Lash and Engelder, are in Pike County, which drillers have left alone so far.
So we have not cracked the nut of predicting which areas will yield the highest production returns, but at least we have good company in that regard. Despite the huge amount of data that the oil and gas companies possess, the results that they report to the Pennsylvania Department of Environmental Protection show that they still don’t really know what they’ll find at the bottom of a hole until they drill it.
Although there is clearly more to gas yields than thickness of the shale, it was an interesting exercise, and if the industry ever does figure it out, it will be a multi-billion dollar discovery–keep in mind that each of the thousands of wells planned cost at least $5 million to drill. Here’s hoping that they do figure it out someday, and not just because of the economics. If drilling wildcat wells can be minimized, then many of the significant adverse effects of the industry would also be mitigated as well, at least in areas where production values were estimated to be low.
By Deanna Bitetti (Common Cause) and Samantha Malone, MPH, CPH (CHEC)
In the quiet of the morning the group we have travelled to Ghana with using a grant from the US Department of State to study extractive industries find ourselves swapping stories – wistfully thinking of American life back home. We find ourselves constantly comparing and contrasting the political environment in which public policy around extractive industries are crafted in both nations. Scratch beneath the surface and you will find that Ghana and the US are not that different after all.
The pernicious influence of special interest money permeates throughout American political culture just as it does in Ghana; compulsory Integration models in the states have allowed for mineral rights to be taken from American citizens, and confusion over the leasing of mineral rights for natural gas extraction has led to uprooted communities. Environmental degradation and costs to local communities have been paramount in both the US and Ghana. These two nations separated by the Atlantic are struggling to balance new extractive industries as an engine for economic growth and protecting communities from the pitfalls associated with the “resource curse.” As both nations forge ahead in developing their oil and gas sectors, how they manage the risk associated with natural gas development will ultimately define how the citizenry thinks about the role of government and government institutions.
Below is a short comparison of some key aspects affecting constituencies in the US and Ghana.
Special Interest Influence
During a recent discussion with a local royal chief in a small village I am reminded that corporate influence is not localized to any specific nation. Here, a gold mining company publicly presents the tribal leaders of a village with keys to two Land Rovers. In America, special interest money floods campaign coffers, exceedingly so in the wake of Citizen United. According to Open Secrets individuals and political action committees affiliated with oil and gas companies have donated $238.7 million to candidates since 1990. From 2010-2011 Exxon Mobil and The Koch Brothers, one of the largest oil and gas conglomerates in the US, spent $384,030 and $318,800 respectively on campaign donations on both sides of the partisan divide to influence environmental legislation aimed at regulating the oil and gas sector. In Pennsylvania, Common Cause’s www.marcellusmoney.org has tracked the significant campaign cash contributions that have flooded campaign coffers, and in New York our recent report “Deep Drilling, Deep Pockets,” highlighted the large amounts industry has spent to lobby our elected officials.
Public Benefits for Public Good
In Ghana only 5% of royalties paid by the extractive industry sector is paid to the State. Out of that 80% of the money goes into the government’s general fund, with only 9% trickling down to effected communities. In the US, Congress has historically rewarded energy companies and those involved in the extractive industry sector with tax breaks, without tangible realization of positive benefits to communities. Nearly two-thirds of US corporations don’t pay any income taxes. According to a study from the non-partisan Government Accountability Office, 83 of the top 100 publicly traded corporations that operate in the US exploit corporate tax havens. Since 2009, America’s most profitable companies, such as ExxonMobil, General Electric, Bank of America and Citigroup, all paid a grand total of $0 in federal income taxes. Even as we write this, Congress is considering offering major subsidies to promote natural gas extraction methods and providing major tax incentives to the industry, speeding up the timeline for extraction and feeding the natural gas boom (and possibly bust) cycle.
Mineral Rights and Extraction
At the heart of the debate over natural gas extraction in the US is the right of landowners to either retain their land or sign leases with companies with the hope of negotiating lucrative contracts for their mineral rights. In Ghana, Article 257 of the Constitution states that public lands and public property are “vested in the President on the behalf of, and in trust for, the people of Ghana.” In essence, the state has claims to mineral rights, not the individual. On the surface the situation in Ghana appears anathema to American values. Forced resettlement programs of thousands of fisherman, farmers and landowners offends our notion of private property and ownership as inviolate. Yet areas in New York and Pennsylvania have allowed for Compulsory Integration where companies were granted the right to drill on lands for which they did not hold leases. Some residents that may own the surface rights but not the mineral rights experience the effects of a “split estate.” Additionally, population displacement often occurs near areas of heavy drilling either because of fear of health effects, noise or pollution, or due to harassment by companies. The important benefits and drawbacks that result from personal ownership of mineral rights must be considered seriously. Further, neither the United States or Ghana require companies to disclose the exact composition of the chemical mixtures used in the process, shrouding it in a cloud of secrecy from the public.
Externalities of Natural Gas Development
In Ghana, as farmland is turned over to industry to pave the way for rapid development, food productivity has begun decreasing – causing food and commodity prices to rise. Housing prices have been steadily increasing as foreigners flock to the areas surrounding the Jubilee oil field, causing a surge in demand for those residences. Prostitution and crime has been on the rise, as well. Even smoking has increased as foreigners bring with them new social norms. In the US we have seen similar externalities imposed on host communities by the extractive industry sector. In Pennsylvania we have already seen the rise in housing shortages due to workers being brought in from out of state, traffic incidences, and roadway degradation. Air quality concerns, drinking water contamination, and stress-related health effects are being documented. Both nations lack clear and updated standards for hazardous waste removal of drilling fluid or drill cuttings. Each country will have to address new pressures placed on transportation infrastructure, including increasing maintenance costs as new roads are created and old roads need constant repair to handle the increase in heavy truck traffic.
Public Health Issues
Residential and operational waste – regardless of its country of origin – is a common postcard to receive from the presence of extractive industries. Improperly handled waste contributes to a multitude of public health issues, such as tainted drinking water, disease transmission, air pollution, and threats to the food supply. One of the differences between Ghana and the U.S. lies in the awareness of where our waste goes. Americans are physically separated from the sources and end products of our distracted commercial lives. Trash is collected by a contractor and taken to dump sites, incinerators, or overseas. Ghanaians face their (and others’) waste on the country’s busy sidewalks, in open sewers, and floating in their magnificent waterways. They witness the neocolonial exploitation of their local resources for the imbalanced consumption and financial gain of other countries. While our processes for extraction and waste disposal differ somewhat, we share a common problem – how to reduce our demand on the entire cycle. Many of the earth’s resources are finite and severely threatened, and so sustainability must be the prescription for healthy development.
Conclusion
This list is not exhaustive, nor it is it meant to be. To move toward a best-practices model for developing extractive industry sectors and managing the high risks associated with doing so means paying close attention to the pace and scope of development, as well as attempting to ameliorate negative externalities imposed on communities. This must include mechanisms for proper oversight and regulation, sustainable planning and development, enhanced civic societal input at the decision- making table, and realistic expectations about the financial promises of oil and gas. In nations such as Ghana, managing these revenues will require more transparency and better management to ensure that revenues do not create large wealth distribution imbalances. In the US, ensuring that industry and government do not form cozy relationships that undermine independent oversight regimes is a major concern.
Deanna Bitetti is the Associate Director of Common Cause/NY. Samantha Malone is the Communications Specialist at the Center for Environmental Healthy Environments and Communities and a doctorate student in the University of Pittsburgh Graduate School of Public Health. They are currently in Ghana as part of a State Department funded research trip on resource extraction hosted by Duquesne University (Pittsburgh, Pennsylvania) and the University of Ghana (Legon, Ghana).
https://www.fractracker.org/a5ej20sjfwe/wp-content/uploads/2011/08/equipment.jpg201300FracTracker Alliancehttps://www.fractracker.org/a5ej20sjfwe/wp-content/uploads/2025/09/2025-Wordmark-Logo.pngFracTracker Alliance2011-08-03 09:18:502020-07-21 10:38:18Comparing & Contrasting Extractive Industry Sectors in Ghana & the US
Yesterday, the Governor’s Marcellus Shale Advisory Commission, lead by Lieutenant Governor Jim Cawley, released a 137 report of their recommendations, which is available at the Post-Gazette website. The Commission, composed of industry and state government officials, came up with almost a hundred recommendations, including some controversial items such as a drilling “impact fee”, as well as forced pooling.
Take a look at the document linked above, and let us know what you think about it.
In addition to the half hour weekly episode of “Inside Shale”, in which callers ask questions of industry insiders, there will be a “Marcellus Minute” that airs 10 to 20 times per day. Both programs are scheduled to launch on 49 radio stations throughout West Virginia.
Talking about the Marcellus Shale on the radio is certainly not off limits, but the industry sponsored call in show does sound questionable, in that the format mimics a news format, and it could be confused as such. It’s a shame that the industry didn’t push for actual moderated discussions, with guests arguing from a variety of perspectives. That is something that there’s a real need for, not just in West Virginia, but wherever shale gas extraction is occurring.
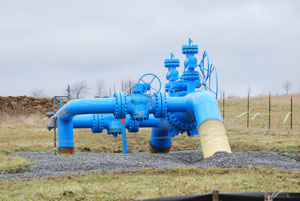
There are real impacts of drilling. Some people are giddy with prospective royalty checks. Others are bitter with the presence of compressors, condensers, and fouled water wells on property that they own, but not the mineral rights for. There’s a lot to talk about, and communities that might be affected by the industry deserve to hear both sides.
https://www.fractracker.org/a5ej20sjfwe/wp-content/uploads/2025/09/2025-Wordmark-Logo.png00Matt Kelso, BAhttps://www.fractracker.org/a5ej20sjfwe/wp-content/uploads/2025/09/2025-Wordmark-Logo.pngMatt Kelso, BA2011-07-16 11:23:032020-07-21 10:38:18Paid Marcellus Programming to Play in West Virginia
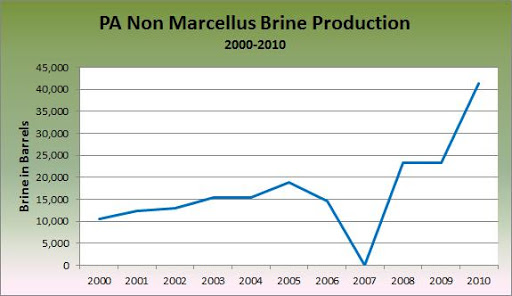
Yesterday, I provided our readers with a summary of long term non Marcellus Shale production data, which is self reported by the industry to the Pennsylvania Department of Environmental Protection (DEP). The DEP has recently made this information available retroactive to 2000, at least for oil and gas wells not drilled into the Marcellus Shale.
The following charts show the total reported waste for non Marcellus Shale wells over time, from 2000 to 2010.
Non Marcellus Shale brine production in Pennsylvania: 2000 to 2010 Read more
https://www.fractracker.org/a5ej20sjfwe/wp-content/uploads/2025/09/2025-Wordmark-Logo.png00Matt Kelso, BAhttps://www.fractracker.org/a5ej20sjfwe/wp-content/uploads/2025/09/2025-Wordmark-Logo.pngMatt Kelso, BA2011-07-12 11:21:062020-07-21 10:38:182000 to 2010 Non Marcellus Waste Data
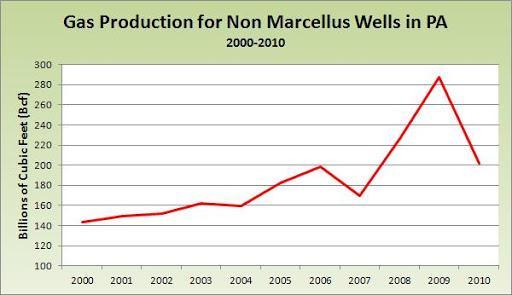
Recently, the Pennsylvania Department of Environmental Protection Bureau of Oil and Gas Management has added historical oil and gas production and waste data for non Marcellus Shale wells. This data is now available as far back as 2000.
I’ve made a couple of charts to illustrate production values for these wells over time.
Gas production per year, in billions of cubic feet (Bcf) Read more
https://www.fractracker.org/a5ej20sjfwe/wp-content/uploads/2025/09/2025-Wordmark-Logo.png00Matt Kelso, BAhttps://www.fractracker.org/a5ej20sjfwe/wp-content/uploads/2025/09/2025-Wordmark-Logo.pngMatt Kelso, BA2011-07-11 11:18:242020-07-21 10:38:18Historical Production and Waste Data Added to DEP Site
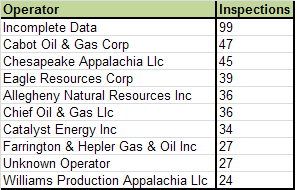
Between January and May 2011, the Pennsylvania DEP conducted 977 inspections on oil and gas operations, issuing 1,751 violations to drilling and pipeline operators, and 311 enforcement actions. These totals are for all oil and gas operations, including the Marcellus Shale.
Most inspections by operator, January – May 2011
Two of these entries are similar: “Incomplete Data” and “Unknown Operator”. All but one entry listed as having an unknown operator involved failing to plug and abandoned well, and was issued either on the 17th or 18th of February. Everything else where the operator is unknown is listed as “Incomplete Data”.
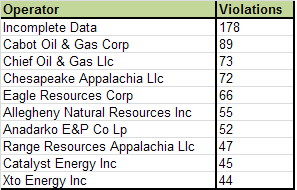
Most violations by operator, January – May 2011
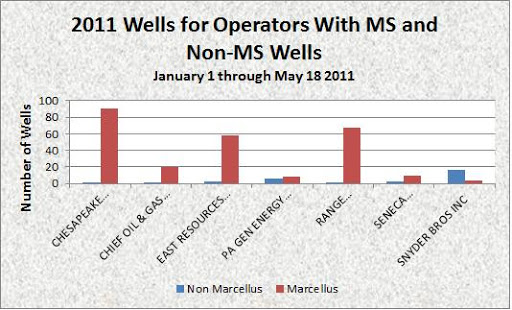
Although this particular analysis does not include details about the wells which were flagged for violations, many of the operators on this list are focused on Marcellus Shale operations in Pennsylvania, including Cabot, Chief, Chesapeake, Anadarko, Range, and XTO. In May, I discussed how there was little overlap between Marcellus and non Marcellus drillers. At that point, the distribution of the only seven companies that drilled one or more of each kind of well in Pennsylvania was as follows:
Operators with at least one Marcellus Shale and non Marcellus Shale well between January 1 and May 18, 2011.
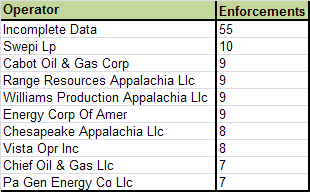
Most enforcement actions by operator, January – May 2011
I’m not sure what the point of issuing an enforcement action is when the well operator is not known. There are 187 rows of incomplete data, detailing 178 violations, and 55 enforcement actions. The following columns are missing data for every single row: operator, permit number, county, municipality. It does, however, include penalty amounts issued and total amounts collected, which means that the DEP does have information about at least some of these wells, they just neglected to share it with the rest of us.
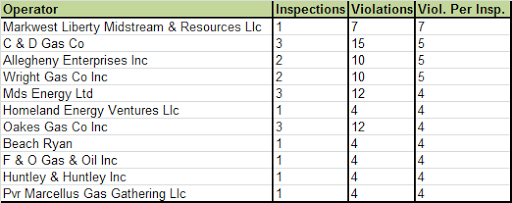
Most violations per inspection by operator, January – May 2011
The list of most violations per inspection is dominated by small, non Marcellus Shale operators, with relatively few inspections.
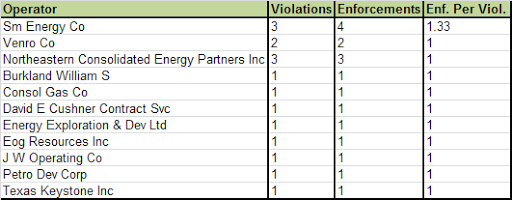
Most enforcement actions per violation by operator, January – May 2011
Similarly, the companies with the most enforcement actions per violation involve those with relatively low sample sizes.
It isn’t clear to me though, what constitutes an enforcement action, and when such an action is deemed appropriate.
Land of Confusion
The last time I checked on Consol, for example, they had no violations. This time, not only is there a violation, but an enforcement action as well. That doesn’t mean that they were given a fine, however–their enforcement description reads, “Notice of violation”. And yet, according to the report, there are 1,751 violations issued but only 311 enforcements, or roughly 18 percent. So when do they get the enforcement of “Notice of violation”?
Curious. But it gets more confusing than that. Although there are only 311 enforcements, there are 729 instances of “notice of violation”, 43 counts of “administrative orders”, 48 instances of “consent assessment of a civil penalty”, and “consent order and agreement” came up four times. That totals 824 enforcement descriptions for only 311 enforcements.
How can this be?
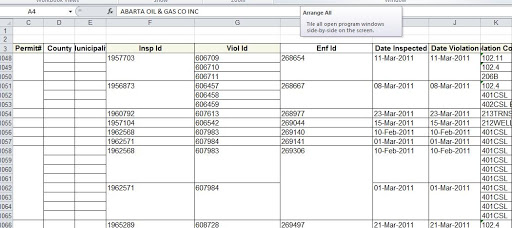
This is an example of what the violations report looks like. The report is set up so that a particular inspection is listed just once, even thought there might be multiple violations that occurred as a result, as is the case for rows 1048-1050. Additionally, multiple violations from different inspections might be covered by the same enforcement ID, as is the case for rows 1058-1065. Although not shown here, there are also instances where the same Violation ID is used more than once, non consecutively.
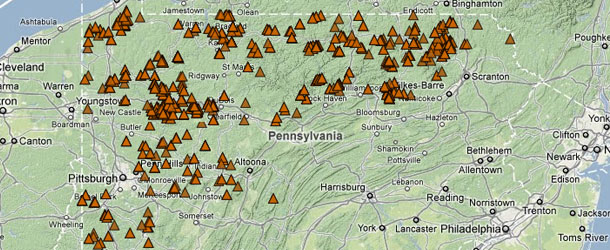
Location of oil and gas violations in PA, January to May, 2011. Click the “i” icon then any map feature for more information.
From my perspective, each row of data should be complete, not only because it is needed for our DataTool to associate all of the information with each map feature, but it also allows for looking deeper into the patterns of where the problems are.
For example, how many of the violations were for non Marcellus Shale wells? The report itself doesn’t say, although there is a separate Marcellus-only report, so you could subtract the total of that from the overall list. But what about horizontal wells? What if you want to know which companies have the worst record at certain types of violations? What if you want to compare the number of violations issued on a monthly basis?
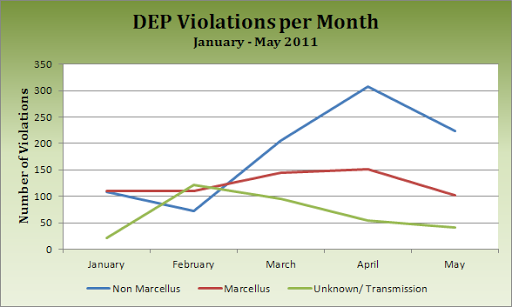
Violations issued by month, January – May, 2011. Values are between 4 and 6 percent overstated on average.
If you want to dig deeper, there is no choice but to fill in the blanks. When I did that for this five month period, however, the values for violations were increase by between four and six percent over the totals that the DEP provided, due to the factors stated above. While that may be a tolerable difference, the same process increases the number of enforcements by 165 percent. Both of these inflated numbers represent actual events. The differences arise more from the standpoint of how violations and enforcement actions are applied.
I applaud the DEP for releasing its oil and gas violation and inspection data so willingly and so thoroughly. At the same time, it could certainly stand to be simplified. As it stands, it isn’t enough to proclaim that “Operator A has seven violations” without answering whether there are any blanks in the data to be filled in, or whether any of the violations included multiple enforcement actions.
https://www.fractracker.org/a5ej20sjfwe/wp-content/uploads/2011/07/Feature_2011_0705.jpg250610Matt Kelso, BAhttps://www.fractracker.org/a5ej20sjfwe/wp-content/uploads/2025/09/2025-Wordmark-Logo.pngMatt Kelso, BA2011-07-05 15:11:512020-07-21 10:38:17Five Month Oil and Gas Inspection Data
As a part of its study on potential effects of hydraulic fracturing on drinking water, the Environmental Protection Agency (EPA) has selected seven sites to study in two distinct categories, three of which are in Pennsylvania’s Marcellus Shale.
The EPA will conduct five retrospective case studies nationwide, two of which are from Pennsylvania’s Marcellus Shale, including one site in Washington County, and another in Susquehanna and Bradford Counties. The other three retrospective case studies, in which water contamination is either confirmed or suspected include one site each from the Bakken Shale in North Dakota, the Barnett Shale in Texas, and the Raton Basin in Colorado.
The other two sites are considered prospective, where the EPA will monitor the hydraulic fracturing process at future drill sites. As with the retrospective sites, one of the prospective sites is a Marcellus Shale well in Washington County, PA, while the other is from the Haynesville Shale in Louisiana.
https://www.fractracker.org/a5ej20sjfwe/wp-content/uploads/2011/06/Article_2011_0624.jpg115115Matt Kelso, BAhttps://www.fractracker.org/a5ej20sjfwe/wp-content/uploads/2025/09/2025-Wordmark-Logo.pngMatt Kelso, BA2011-06-24 15:30:002020-07-21 10:38:17EPA Hydraulic Fracturing Study to Include Sites in Pennsylvania’s Marcellus Shale