Tag Archive for: Pennsylvania

Landfill disposal of drill cuttings

Has radioactivity risk from oil and gas activity been underrated?

Reviewing a Pennsylvania TENORM Study

By Juliana Henao, Communications Intern

Technologically-enhanced, naturally-occurring radioactive materials, also known as TENORM, are produced when radionuclides deep in the earth are brought to the surface by human activity such as oil and gas drilling. The radioactive materials, which include uranium (U), thorium (th), potassium-40 (K-40) and their decay products, occur naturally in the environment. These materials are known to dissolve in produced water, or brine, from the hydraulic fracturing process (e.g. fracking), can be found in drilling muds, and can accumulate in drilling equipment over time.

According to the EPA, ~30% of domestic oil and gas wells produce TENORM. Surveys have shown that 90% of the wells show some TENORM concentrations, while others have nothing at all. However, with increasing natural gas exploration and production in Pennsylvania’s Marcellus Shale, there is a parallel increase in TENORM. According to Dr. Marvin Resnikoff, an international expert on radiation, drilling companies and geologists locate the Marcellus Shale layer by way of its higher level of radiation.

Bringing more of this TENORM to the surface has the potential to greatly impact public health and the environment. Since 2013, the Pennsylvania Department of Environmental Protection (PA DEP) has been gathering raw data on TENORM associated with oil and gas activity in the state. The study was initiated due to the volume of waste containing high TENORM concentrations in the state’s landfills, something that is largely unregulated at the state and federal level.  In January 2015, the PA DEP released a report that outlined their findings and conclusions, including potential exposures, TENORM disposal practices, and possible environmental impacts.

Radioactivity Study Overview

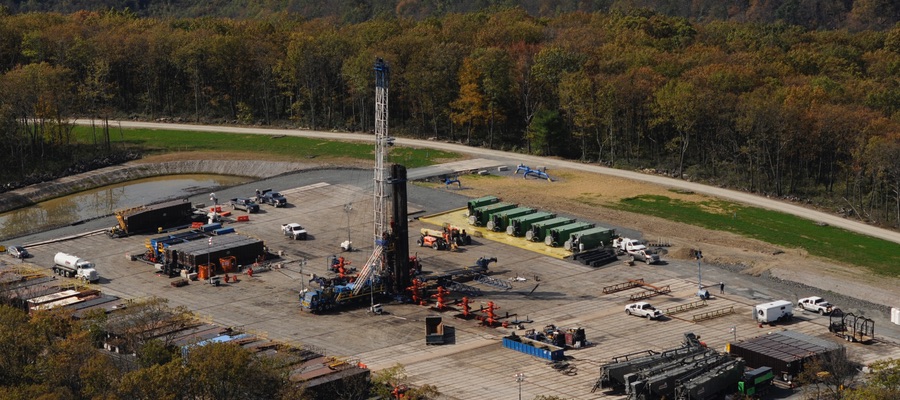
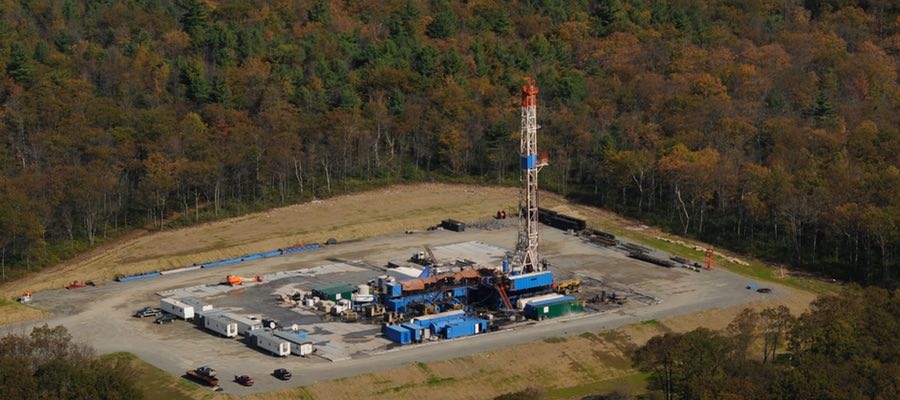
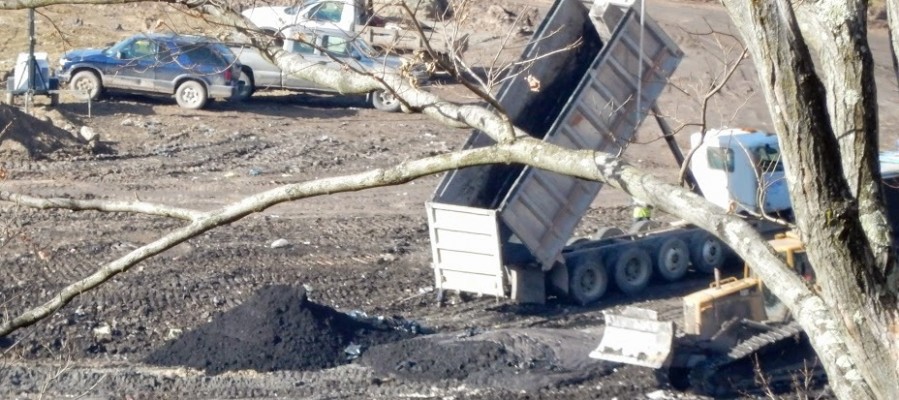
Drilling mud being collected on the well pad

This review touches on the samples tested, the findings, and the conclusions drawn after analysis. The main areas of concern included potential exposure to workers, members of the public, and the environment.

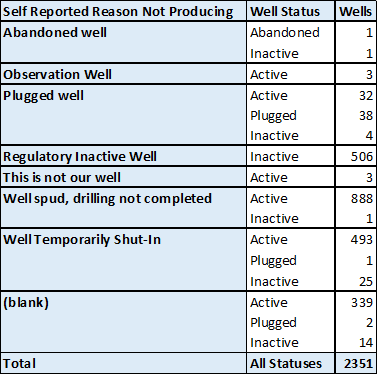
The samples gathered by the DEP came from 38 well sites, conventional and unconventional, by testing solids, liquids, ambient air, soils, and natural gas near oil and gas activity in Pennsylvania. All samples contained TENORM or were in some way impacted by TENORM due to oil and gas operations. The samples were mainly tested for radioactive isotopes, specifically radium, through radiological surveys.

The PA DEP concluded in the cases of well sites, wastewater treatment plants (POTW), centralized wastewater treatment plants, zero liquid discharge plants, landfills, natural gas in underground storage, natural gas fired power plants, compressor stations, natural gas processing plants, radon dosimetry (the calculation and assessment of the radiation dose received by the human body), and oil and gas brine-treated roads that there is little potential for internal radiation exposure to workers and members of the public. In spite of this, each section of the report typically concluded with: however, there is a potential for radiological environmental impacts…

Examples of these findings include:

  • There is little potential for radiological exposure to workers and members of the public from handling and temporary storage of produced water on natural gas well sites. However, there is a potential for radiological environmental impacts from spills of produced water from unconventional natural gas well sites and from spills that could occur from the transportation of this fluid.
  • There is little potential for radiological exposure to workers and members of the public from sediment-impacted soil at landfills that accepted O&G waste for disposal.  However, there may be a radiological environmental impact to soil from the sediments from landfill leachate treatment facilities that treat leachate from landfills that accept O&G waste for disposal.
  • Radium 226 was detected within the hydraulic fracturing fluid ranging from 64.0-21,000 pCi/L. Radium-228 was also detected ranging from 4.5-1,640 pCi/L. The hydraulic fracturing fluid was made up of a combination of fresh water, produced water, and reuse flowback fluid. There is little potential impact for radiological exposure to workers and members of the public from handling and temporary storage of flowback fluid on natural gas well sites. However, there is a potential for radiological environmental impacts from spills of flowback fluid on natural gas well sites and from spills that could occur from the transport of this fluid.
  • Nine influent and seven effluent leachate samples were collected at the nine selected landfills.  Radium was detected in all of the leachate samples. Radium-226 concentrations were detected in produced water samples ranging from 40.5 – 26,600 pCi/L. Radium-228 concentrations were also detected ranging from 26.0 – 1,900 pCi/L. The Ra-226 activity in unconventional well site produced water is approximately 20 times greater than that observed in conventional well site produced water. The ratio of Ra-226 to Ra-228 in unconventional well site produced water is approximately eight times greater than that found in conventional well site produced water.  (Sections 3.3.4 and 3.6.3) (PA DEP TENORM study report section 9.0)

According to Melody Fleck from Moshannon Group- Sierra Club Executive Committee:

While the report comprehensively covers the processes from drilling to end users, the number of samples collected and analyzed are very sparse for a state-wide study. Just to give an idea, only 8 well sites were sampled during the flowback phase and of the 8 only 4 had enough volume to analyze. Of 14 drill mud samples collected, only 5 were analyzed as liquids, and alpha & beta analysis was only done on one sample.

Obtaining the proper sample size is often a major barrier for field studies. Additional research needs to be conducted with a larger sample size and more rigorous exposure monitoring to determine specific risk metrics for workers and the public.

Current Handling of TENORM

From drilling to distribution, there are many topics of concern associated with TENORM; however, we will focus on the current treatment of TENORM waste, the release of data, and the transparency of this issue.

On a federal level, there are no specific regulations governing many aspects of TENORM, such as sludge or solids containing TENORM from water treatment plants. Additionally, if concentrations of U or Th make up less than .05% by weight, they are seen as an “unimportant quantity” and are exempt from NRE regulation. Currently, 13 states regulate TENORM with varying degrees of standards. Hazardous waste facilities in each state can choose to accept TENORM materials as long as they don’t exceed certain concentrations.

Today, about 12 of PA’s 50 landfills accept such radioactive waste from oil and gas activity at a 1:50 dilution ratio (related to their other intake sources). Under RCRA’s Land Disposal Restrictions, “dilution is prohibited as treatment for both listed and characterized wastes.”

According to the DEP report, hydraulic fracturing produces an enormous stream of waste by-products. Safe disposal of this waste has not yet been devised. A few of the conclusions concerning TENORM disposal and treatment in the report listed some areas of concern, identified below:

  1. Filter cake [1] and its radiological environmental impact if spilled, and
  2. The amount of radioactive waste entering the landfills in PA, which reached 430,317 tons in the first 10 months of 2014.

In unison with the conclusions were recommendations, where the report “recommends considering limiting radioactive effluent discharge from landfills, and adding radium-226 and radium-228 to annual sample analysis of leachate from landfills.” Additionally, the report states that if something such as filter cake spills, it will bring into question the safety of long-term disposal and suggest a protocol revision.

Public Health Concerns

The report identified two places where there is a higher than average radioactive exposure risk for workers and community members of the public: specifically at centralized wastewater treatment plants and zero liquid discharge plants that treat oil and gas wastewater. An additional unknown is whether there is a potential inhalation or ingestion hazard from fixed alpha and beta surface radioactivity if materials are disturbed. As a general precaution, they recommend the evaluation of worker’s use of protective equipment under certain circumstances.

Although research has not come to a consensus regarding a safe level of radiation exposure, it should not be assumed that any exposure is safe. Past research has evaluated two types of radiation exposure: stochastic and non-stochastic, both of which have their own risks and are known to be harmful to the human body. The EPA has defined stochastic effects as those associated with long-term, low level exposure to radiation, while non-stochastic effects are associated with short-term, high-level exposure. From past scientific research, radiation is known to cause cancer and alter DNA, causing genetic mutations that can occur from both stochastic and non-stochastic exposure. Radiation sickness is also common, which involves nausea, weakness, damage to the central nervous system, and diminished organ function. Exposure levels set by the EPA and other regulatory agencies fall at 100 millirem (mrem) per year to avoid acute health effects. As a point of reference, medical X-rays deliver less than 10 mrem, and yearly background exposure can be about 300 mrem.

In the report, Radiological Dose and Risk Assessment of Landfill Disposal of TENORM in North Dakota, Argonne National Laboratory researchers suggest that the exposure to workers be limited and monitored. In many of their studies, they found the doses exceed the 100 mrem/year level in the workers when the appropriate attire is not worn during working hours, which raised some concern.

The DEP deems certain radiation levels “allowable”, but it should be noted that allowable doses are set by federal agencies and may be arbitrary. Based on the PA DEP’s report, consumers of produced gas can get up to 17.8% of their yearly radiation allowance, while POTW workers could get up to 36.3% of their yearly allowable dose. According to the Nuclear Information and Resource Service, radiation bio-accumulates in ecosystems and in the body, which introduces a serious confounder in understanding the risk posed by a dose of 17.8% per year.

Transparency of Radiation Risk

The DEP has been gathering data for their TENORM report since 2012. In July of 2014, Delaware Riverkeeper Network filed a Right-to Know request to obtain the information that the DEP had collected in order for their expert to analyze the raw data. The department refused to release the information, insisting that “the release of preliminary invalidated data, including sample locations, could likely result in a substantial and demonstrable risk of physical harm, pose a security risk and lead to erroneous and/or misleading characterizations of the levels and effects of the radioactive risks.” Essentially, the DEP was equating the risks of radioactive material to the risks of releasing raw data — two incomparable risks. DRN appealed, claiming that they simply sought the raw information, which is presumed public unless exempt, and would have no risk on the public. PA DEP was ordered to release their records to DRN within 30 days.

Conclusion

One observation that you could take from this report is the lack of regulatory advancement. The study is filled with suggestions, like:

  • Radium should be added to the PA spill protocol to ensure cleanups are adequately characterized,
  • A limited potential was found for recreationists on roads with oil and gas brine from conventional natural gas wells–further study should be conducted, and
  • More testing is needed to identify areas of contamination and any area should be cleaned up.

Intent doesn’t make the changes; action does. Will any regulations change, at least in Pennsylvania where radioactive materials are returning to the surface on a daily basis? There seems to be no urgency when it comes to regulating TENORM and its many issues at the state level. Are workers, citizens, and the environment truly being protected or will we wait for a disaster to spur action?

Footnotes:

[1] This is the residue deposited on a permeable medium when a slurry, such as a drilling fluid, is forced against the medium under pressure. Filtrate is the liquid that passes through the medium, leaving the cake on the medium.

Washington Co. Production Layout

A Closer Look at PA’s Unconventional Production Data

By Matt Kelso, Manager of Data and Technology

Twice per year, the Pennsylvania Department of Environmental Protection (PADEP) releases its unconventional oil and gas production and waste reports, which is a good opportunity to check on what’s happening with the industry as a whole. In the past, FracTracker has analyzed this data as soon as it became available. That strategy proved to be a mistake, however, as it is common for some of the operators to release data after the deadline, meaning that early versions of the report can be incomplete. To mitigate the effects of late reporting, the data in this analysis was downloaded from the PADEP on March 10, 2015, several weeks after the reports were first published.

While the production and waste reports are released together, and appear together on the same map below, the FracTracker Alliance will analyze the data from these two reports in separate blogs, with this one focusing on PA’s unconventional production data.


PA Unconventional O&G Production and Waste – July 1, 2014 to December 31, 2014. Click here to access the full screen map, with legend, details, and additional controls.

Producing Wells

The production report lists the amount of gas produced per well in thousands of cubic feet (Mcf), as well as oil and condensate totals in 42 gallon barrels. Also included are the spud date and the number of days that each well produced in each of the three categories. This allows us to take a look at how the age of the well factors into its daily production rates:

Average daily production values for PA unconventional wells between July and December 2014, sorted by year well was spudded.

Figure 1: Average daily production values for PA unconventional wells between July and December 2014, sorted by year well was spudded.

The average daily production values in Figure 1 were calculated from all wells reporting production for the given commodity type. For example, of the 1,467 wells on the report with a spud date in 2010, 1,221 (83.2%) of those produced some gas in the latest reporting period, and the average daily production of that group is 1,300 Mcf. Only 102 wells spudded that same year reported condensate production, averaging 6 barrels per day, and 35 wells produced oil, also averaging 6 barrels per day. It’s also worth pointing out that the majority of wells drilled last year were not yet in production for the reporting period.

Wells drilled in 2013 produced 38% less gas than wells those drilled in 2014, and the newer wells are producing 4.4 times as much as wells drilled in 2010.

Average daily production (Mcf) for unconventional wells in PA between July and December 2014, sorted by spud year.

Figure 2: Average daily production (Mcf) for unconventional wells in PA between July and December 2014, sorted by spud year.

In Pennsylvania, gas production amounts are quite high, while liquid hydrocarbon returns are fairly modest. In this six month period, operators reported 2.13 trillion cubic feet of gas production, 2.1 million barrels of condensate, and 171 thousand barrels of oil. Over 71% of all oil was produced in Washington County in Southwestern Pennsylvania, while other counties in the western part of the state made up the rest of the production. Washington County also accounts for 94% of all condensate produced from the state’s unconventional wells.

FracTracker wanted to see if there were any liquid production trends when we sorted the data by operator. Of the 1,146 active wells on the report in Washington County, 769 (67%) are operated by Range Resources Appalachia, LLC. Their wells produced 1,955,302 barrels (97%) of the condensate in the county, meaning that the remaining 377 wells from other operators produced a combined 50,915 barrels of condensate.

At first, it seems a bit anomalous that all of the other producers in the county should have such low a total for condensate. Some of this is likely attributable to defining the difference between condensate and oil. The way the data are presented, it seems as if they are two separate liquid hydrocarbon products. However, the difference really amounts to the liquid’s density, with heavier, thicker fluids considered to be oil, while condensates occupy the lighter, less viscous end of the spectrum. Condensate is also legal to export, while crude oil is not.

Oil and condensate production in Washington County from July to December 2014, by operator.

Figure 3: Oil and condensate production in Washington County from July to December 2014, by operator.

With this in mind, when we look at the liquid production in Washington County over the six month period, it seems likely that what Range Resources considered to be condensate was classified as oil by Chesapeake. The complete lack of liquid hydrocarbon production by any of the 259 wells operated by CNX, Rice, or EQT in the county does seem curious at first, but none of the three operators are active in any of the six municipalities reporting 100,000 or more barrels of liquids. Unconventional liquid hydrocarbon production in Washington County – and PA for that matter – is limited geographically, with the highest returns limited to a handful of municipalities close to the northern panhandle of West Virginia.


Unconventional wells reporting liquid production in Washington County from July to December 2014. Among unconventional wells in Pennsylvania, those in Washington County accounts for over 71% of oil production and 94% of condensate production.

Non-Producing Wells

Spudded PA Unconventional wells not producing - July to December 2014

Figure 4: Spudded PA Unconventional wells not producing – July to December 2014

Altogether, there are 2,351 wells on the production report that are listed as spudded but are not producing any of the three commodity types. The report includes a section for operators to explain why there is no production, as well as data about the well’s status. The reason that the majority of these wells are not producing are relatively straightforward; they are either plugged, have an inactive status, are not yet complete, or are shut-in, awaiting a pipeline connection.

In prior discussions with PADEP, active wells were described to us as those that had been spudded and not yet permanently plugged. There are also some conditions that can put the well into an inactive status at the operator’s request, for up to five years.

Figure 5: Operators with the most unconventional active wells that are not in production – excluding observation wells, those that were not completed during the reporting period, or those that are shut-in, awaiting additional infrastructure.

Still, there are a number of active wells that don’t fall into any of these categories, leaving us with no clear idea as to why they are not producing. The 10 operators with with the most active wells not in production – excluding observation, incomplete, and shut-in wells – are listed in Figure 5: Chevron, Chief, Southwestern, Cabot, and Anadarko.

Included in the statewide totals are three wells listed as having the incorrect operator, 32 wells where the reason for no production is listed as “Plugged well” but the well status is active, and 339 wells with active statuses where the reason for no production was left blank. Two operators, Chevron Appalachia and Chief Oil & Gas, account for 46% of these wells where the reason for non-production is uncertain.


Population Near Railroads in Allegheny County, PA

By Matt Kelso, Manager of Data and Technology

In a joint project with PennEnvironment earlier this month, we analyzed the number of people who live within a half-mile of active rail lines in Pennsylvania and are therefore potentially at risk of an oil train explosion similar to the recent ones in Lac-Mégantic, Quebec; Lynchburg, Virginia; and Mount Carbon, West Virginia. To take that project one step further, we have taken a closer look at the population near railroads in Allegheny County, the second most populous county in PA with over 1.2 million inhabitants. Of the various figures, we found that Pittsburgh has over 183,000 people that live with half-mile mile of an active rail line.

In Philadelphia, the city’s boundary takes up the entire county of the same name, but in Allegheny County, the municipal boundaries are considerably more fractured. In fact, Pittsburgh is just one of 130 municipalities in Allegheny County; its 305,704 inhabitants represent just 25% of the residents in the county, and 13% of the metropolitan area. For the sake of simplicity, residents from the various cities, boroughs, and townships in the county will often say they are from Pittsburgh when speaking with people from outside the region, although they might actually live in Blawnox, McKees Rocks, or Swissvale, for example.


Estimated population within a half-mile of active rail lines in Allegheny County, PA. Click here to access the legend and other map tools.

Here is a list of the top ten municipalities with the largest estimated population in the at-risk zone:

Municipalities in Allegheny County with the largest estimated population within a half-mile of railroads.

Municipalities in Allegheny County with the largest estimated population within a half-mile of railroads.

Not surprisingly, the most at-risk municipality in Allegheny County is Pittsburgh, with over 183,000 people living within a half-mile of an active rail line. During any given workday, when individuals flock into the city, even more individuals would theoretically be at risk of an oil train disaster. Following Pittsburgh, Baldwin, West Mifflin, and Shaler all share similar numbers at risk, with Baldwin seeing the greatest percentage of its population at risk of the three. While Castle Shannon and Carnegie have lower populations than the other municipalities, a significant proportion of their residents (93-95%) are near rail lines.

Danger Around the Bend

The Threat of Oil Trains in Pennsylvania

A PennEnvironment Report – Read Full Report (PDF)

On the heels of the West Virginia oil train explosion, this new study and interactive map show populations living in the evacuation zone of a potential oil train crash.

PA Oil Train Routes Map


This dynamic map shows the population estimates in Pennsylvania that are within a half-mile of train tracks – the recommended evacuation distance in the event of a crude oil rail car explosion. Zoom in for further detail or view fullscreen.

Danger Around the Bend Summary

The increasingly common practice of transporting Bakken Formation crude oil by rail from North Dakota to points across the nation—including Pennsylvania—poses a significant risk to the health, well-being, and safety of our communities.

This risk is due to a confluence of dangerous factors including, but not limited to:

  1. Bakken Formation crude oil is far more volatile and combustible than typical crude, making it an incredibly dangerous commodity to transport, especially over the nation’s antiquated rail lines.
  2. The routes for these trains often travel through highly populated cities, counties and neighborhoods — as well as near major drinking water sources.
  3. Bakken Formation crude is often shipped in massive amounts — often more than 100 cars, or over 3 million gallons per train.
  4. The nation’s existing laws to protect and inform the public, first responders, and decision makers are woefully inadequate to avert derailments and worst-case accidents from occurring.
Lac-Mégantic derailment. Source: http://en.wikipedia.org/wiki/Lac-M%C3%A9gantic_derailment

Lac-Mégantic derailment, July 2013. Source

In the past few years, production of Bakken crude oil has dramatically increased, resulting in greater quantities of this dangerous fuel being transported through our communities and across the nation every day. This increase has led to more derailments, accidents, and disasters involving oil trains and putting local com- munities at risk. In the past 2 years, there have been major disasters in Casselton, North Dakota; Lynchburg, Virginia; Pickens County, Alabama; and most recently, Mount Carbon, West Virginia. The worst of these was the town of Lac-Mégantic, in Canada’s Quebec Province. This catastrophic oil train accident took place on July 6, 2013, killing 47 people and leveling half the town.

Oil train accidents have not just taken place in other states, they have also happened closer to home. Pennsylvania has had three near misses in the last two years alone — one near Pittsburgh and two in Philadelphia. In all three cases, trains carrying this highly volatile Bakken crude derailed in densely populated areas, and in the derailment outside of Pittsburgh, 10,000 gallons of crude oil spilled. Fortunately these oil train accidents did not lead to explosions or fires.

All of these incidents point to one fact: that unless we take action to curb the growing threat of oil trains, the next time a derailment occurs an unsuspecting community may not be so lucky.

Bakken oil train routes often travel through high-density cities and neighborhoods, increasing the risk of a catastrophic accident for Pennsylvania’s residents. Reviewing GIS data and statewide rail routes from Oak Ridge National Laboratory, research by FracTracker and PennEnvironment show that millions of Pennsylvanians live within the potential evacuation zone (typically a half-mile radius around the train explosion ). Our findings include:

  • Over 3.9 million Pennsylvania residents live within a possible evacuation zone for an oil train accident.
  • These trains travel near homes, schools, and day cares, putting Pennsylvania’s youngest residents at risk. All told, more than 860,000 Pennsylvania children under the age of 18 live within the 1⁄2 mile potential evacuation zone for an oil train accident.
  • Philadelphia County has the highest at-risk population — Almost 710,000 people live within the half-mile evacuation zone. These areas include neighborhoods from the suburbs to Center City.
  • 16 of the 25 zip codes with the most people at risk — the top percentile in the state — are located in the city of Philadelphia.
  • The top five Pennsylvania cities with the most residents at risk are:
    • Philadelphia (709869, residents),
    • Pittsburgh (183,456 residents),
    • Reading (70,012 residents),
    • Scranton (61,004 residents), and
    • Erie (over 51,058 residents).
Read full report

Danger Around The Bend


Bakken Crude Oil

How we get it and why we ship it

Bakken crude oil comes from drilling in the Bakken Formation, located in North Dakota. It contains deposits of both oil and natural gas, which can be accessed by hydraulic fracturing, or “fracking.” Until recent technological developments, the oil contained in the formation was too difficult to access to yield large production. But advances in this extraction technology since 2007 have transformed the area into a major oil producer — North Dakota now ranks second in the U.S. for oil production. The vast expansion of wells over the last 4 years (from 470 wells to over 3,300 today) means that there is more oil to transport to the market, both domestically and abroad. This increase is especially concerning considering that the U.S. Department of Transportation stated in early 2014 that Bakken crude oil may be more flammable than traditional crude, therefore making it more dangerous to transport by rail.

For More Information

Shale Gas Development on Public Lands

By Mark Szybist and George Jugovic, Jr., PennFuture Guest Authors

Citizens for Pennsylvania’s Future (PennFuture) and FracTracker Alliance have collaborated to create a unique GIS map that enables the public to investigate how shale gas development is changing the face of our public lands. The map allows viewers to see, in one place:

  • Pennsylvania’s State Forests, Parks and Game Lands;
  • State Forest tracts containing active oil and gas leases;
  • State Forest areas where the oil and gas rights have been “severed” from the surface lands and are owned by third parties;
  • State Forest lands that are to be protected for recreational use under the federal Land and Water Conservation Fund Act;
  • The location of unconventional shale gas wells that have been drilled on State Forest and State Game Lands; and
  • The boundaries of watersheds that contain one or more High Quality or Exceptional Value streams.

The goal of this project was to develop a resource that would highlight the relationship between unconventional shale gas development and public resources that the State holds in trust for Pennsylvania’s citizens under Article I, Section 27 of the Pennsylvania Constitution. It is our hope that the map will be useful to citizens, conservation groups and others in planning educational, advocacy, and recreational activities.

The Public Lands Map


A full screen version of The Public Lands Map can be found here.

Background

Public lands held in trust by the Commonwealth of Pennsylvania for citizens of the state are managed by various state agencies and commissions. The vast majority of State lands, though, are managed by just two bodies – the Department of Conservation and Natural Resources (DCNR) and the Pennsylvania Game Commission (PGC). Under Act 147 of 2012, the Department of General Services has the authority to lease other lands controlled by the state. In recent years, DCNR and the PGC have made liberal use of their powers to lease State lands for oil and gas development.

DCNR: State Forests, State Parks, and Publicly Owned Streambeds

The DCNR manages approximately 2.2 million acres of State Forest lands and 283,000 acres of State Park lands, as well as many miles of publicly owned streambeds. The Conservation and Natural Resources Act (CNRA) authorizes DCNR to develop oil, gas and other minerals under these lands, so long as the state controls those mineral rights. In some cases, separate persons or entities own the surface of the land and mineral rights. Where DCNR does not control the mineral rights, the owners of the oil and gas have the ability to make reasonable use of the land surface for mineral extraction, subject to restrictions in their property deeds.

Before the start of the Marcellus era, the DCNR leased about 153,268 acres of State Forest lands for mineral development. These leases largely allowed the drilling of “conventional” shallow vertical gas wells. Between 2008 and 2010, the DCNR, under Governor Ed Rendell, leased another 102,679 acres of public lands for natural gas development – but this time the leases were for the drilling of horizontal wells in “unconventional” shale formations using high-volume hydraulic fracturing.

Following the lease sale, DCNR published a report on October 26, 2010 that stated any further gas leasing of State Forest Lands would jeopardize the sustainability of the resource. As a result, Governor Rendell signed Executive Order 2010-05, which placed a moratorium on the sale of any additional leases for oil and gas development on lands “owned and managed by DCNR.

On May 23, 2014, Governor Tom Corbett revoked Governor Rendell’s moratorium, and issued a new Executive Order that allowed the issuance of additional leases for gas development beneath State Lands so long as the leases did not entail “additional surface disturbance on State Forest or State Park lands.” Ultimately, Governor Corbett’s DCNR did not enter into any leases under the new Order. However, between January 2011 and January 2015, Governor Corbett’s DCNR did issue leases for gas extraction beneath a number of publicly owned streambeds, which, according to the Post-Gazette, raised $19 million. Governor Corbett’s DCNR also renewed at least one State Forest lease that otherwise would have expired.

On January 29, 2015, Governor Tom Wolf issued another Executive Order on the matter, which re-established a moratorium on the leasing of State Park and State Forest lands “subject to future advice and recommendations by DCNR.” The Order allows for the continued leasing of publicly owned streambeds. As of the publication of this blog, the DCNR is fighting two lawsuits concerning the leasing of the lands it manages, one by the Pennsylvania Environmental Defense Foundation and one by the Delaware Riverkeeper Network.

Drilling in Loyalsock State Forest, PA. Photo by Pete Stern 2013

Drilling in Loyalsock State Forest, PA. Photo by Pete Stern 2013.

PGC: State Game Lands

The PGC manages more than 1.5 million acres of State Game Lands that it may lease for gas development under the Pennsylvania Game and Wildlife Code. The PGC can also exchange mineral rights beneath State Game Lands for “suitable lands having an equal or greater value.” To date, the PGC has entered into surface and non-surface leases (technically, cooperative agreements for the exercise of oil and gas production rights) for natural gas development totaling 92,000 acres, of which about 45,000 acres were leased since 2008.

Land and Water Conservation Fund Act Lands

The LWCF Act is a federal law administered by the National Park Service (NPS) that authorizes federal grants to state and local governments for “outdoor recreation.” When a state accepts money for a recreational project, it agrees to protect the recreational value of the area supported by the grant. If the state later decides to take or allow actions that would “convert” parts of the protected area to a non-recreational use (1) the state must seek prior approval from the NPS, and (2) the NPS must perform an environmental assessment of the proposed conversion under the National Environmental Policy Act. The NPS may approve a conversion of LWCF-supported lands only if those lands will be replaced with “other recreation properties of at least equal fair market value and of reasonably equivalent usefulness and location.”

Between 1978 and 1986, Pennsylvania received three LWCF grants (Project Numbers 42-00580, 42-01235, and 42-01351) to support recreational opportunities on State Forest lands. Most of the money was used to improve roads in various State Forests to improve access for hunters, hikers and anglers. The LWCF layer on the Public Lands map represents those areas that Pennsylvania agreed to protect in exchange for these grants.

In 2009 and 2010, Pennsylvania entered into leases opening up about 11,718 acres of LWCF-protected areas to unconventional gas development. On the map, these areas can be highlighted by selecting “Land and Water Conservation Fund Lands” and “SF Lands – DCNR Leases”; the purplish, overlapping areas represent the leased LWCF lands.

Governor Corbett’s DCNR refused to recognize that shale gas development on public lands constituted a “conversion” under the LWCF Act. The Sierra Club was the first to identify this problem in a 2011 letter to the NPS and the DCNR. That letter requested, among other things, that the NPS formally determine the extent to which DCNR leasing of LWCF-protected State Forest lands has violated the LWCF Act. Nearly four years later, the NPS has yet to determine whether drilling and fracking of unconventional gas wells and construction of the necessary support structures constitutes a “conversion” and loss of recreational opportunities under the LWCF Act.

Old Loggers Path

Old Loggers Path, a favorite among hikers

A Note on the Map Layers

The sources of the GIS layers in the Public Lands map are explained in the “Details” section of the map. For the most part, PennFuture and FracTracker obtained or created the layers from public sources and through open records requests to the DCNR. In all cases, the layers came from the DCNR with a disclaimer as to the accuracy of the data and a warning about relying on the data.

GIS layers that are not currently on the map, but that this project hopes to add, include:

  • State Game Lands that have been leased for drilling;
  • State Park and Game Lands where the oil and gas rights have been “severed” and not controlled by the State;
  • Publicly owned streambeds that the State has leased for oil and gas development;
  • Public lands containing areas of significant ecologic value; and
  • Compressor stations, natural gas and water pipelines, and fresh water and wastewater impoundments.

Persons having access to this data are invited to contact PennFuture or FracTracker.

Pennsylvania Data Discrepancies

By Matt Kelso, Manager of Data & Technology

The Pennsylvania Department of Environmental Protection (PADEP) publishes oil and gas well data in two different places: on their own website’s Spud Data Report, and in the Oil and Gas Locations file published on the PA Spatial Data Access repository, also known as PASDA. Because these two sources are both ultimately published by PADEP, it would stand to reason that the data sources would match up. Unfortunately, that is not the case. Learn more about the data discrepancies we uncovered:


This map shows those wells in Pennsylvania that only show up on one of the two data sources. Pink dots show wells that appear on PASDA but not the PADEP site, while the reverse is true for blue wells. Click here for the full screen view with additional map tools.

Methodology

Both of these data sources have existed for years. When FracTracker does analyses of PA, we usually use data directly from the PADEP site, because it includes far more information about the wells, such as the spud date, county, municipality, well configuration, and whether or not the well is classified as unconventional. Even though it has less information about each well, the data on PASDA is useful for expediently mapping the inventory of wells in the Keystone State. In this current analysis, we looked at both sources, and found significant discrepancies between the two.

Individual oil and gas wells have been given unique API numbers since the 1950’s. The overwhelming majority of items on both lists that we examined have these numbers, and those that do not have other numeric identifiers in their place. The uniqueness of the data in these columns is what we used to determine the number of wells on both lists. These columns in both data sources were then tested against one another using Microsoft Excel in order to determine which wells were included on both lists.

The data on PASDA is described as “Oil and Gas Locations,” and nothing in available metadata made it clear as to whether wells that were permitted but not yet drilled might be included in this or not. Additionally, we are mostly interested in wells that are still operational, assuming that there might be accuracy issues for historical wells in an industry that has been operational in the state since before the Civil War. We did, however, include orphaned and abandoned wells, as they remain a source of impact throughout the state.

Summary

PADEP_PASDA_descrep

Number of wells in PA in various categories. For brevity, “Total wells – Drilled and not plugged” is shown as “TW-DnP.”

We found 3,315 records of drilled, unplugged wells with location information on the PASDA dataset that are not on the PADEP search tool, and 96 such wells on the PADEP site that aren’t found on PASDA. Additionally, there are 35,434 drilled and unplugged wells in the PADEP data that lack location data, although six of these wells are actually on the PASDA site, meaning that there is some location data for them somewhere at PADEP.

For those of you who might be looking for discrepancies in our discrepancy table, one might expect the number of both wells that appear on both lists (the second to last row on the chart) to be identical. The biggest reason that they are not is that some wells appear in the PASDA dataset multiple times. There are 6,997 fewer unique wells than there are entries on the full file, or a 95.74% match rate. In comparison, the PADEP spud report only has 19 duplicates for over 204,000 wells, a 99.99% match between the number of wells and the number of records. Indeed, when we filter for unique wells, the difference between the two lists shrinks to only 40 records, which might be explained by differences is well statuses that were used to shape our analysis.

This chart shows the number of wells drilled per year in Susquehanna County, through 2/11/15.

Number of wells drilled per year in Susquehanna Co., through 2/11/15.

Undoubtedly, it will take some effort to get the two datasets to reflect the full set of wells in PA, but that is certainly a task than can be accomplished. The wells lacking location data are likely to be much more of a challenge. If we include all status types, there are 75,508 wells on the spud report that lack latitude and longitude values altogether, leaving us with only the county and municipality to determine where these wells are located. Hopefully, this crucial data exists somewhere in the PADEP inventory, and these wells are not in fact lost.

Finally, there are a couple of things to note about dates. Since the PASDA dataset does not include spud dates, it is impossible to determine the age of the majority of the mismatched wells. Looking at the pink dots on the interactive map above, though, it is clear that a large number of these mismatched PASDA wells are in the northeastern corner of the state that has been booming since the recent development of the Marcellus, but saw little to no development before that time – at least according to the spud report.

Of the 96 wells that are on the spud report but not PASDA, 67 are given the date “1/1/1800,” which seems to be a default date; over 94,000 wells on the report have this listed as the spud date. Most of the other wells that don’t match are relatively old wells, with spud dates ranging between 1960 and 1984. One of these wells was drilled on May 6, 1999 though, and four more were drilled on August 19, 2014.

The mismatched data can be accessed here for those who are interested.

A Bird’s Eye View of Pipeline Oppositions

By Samantha Malone, FracTracker Alliance

New York State is not the only area where opposition to fracking and its related activities is emerging. A 108-mile proposed PennEast pipeline between Wilkes-Barre, PA and Mercer County, New Jersey is facing municipal movements against its construction, as well. The 36-inch diameter pipeline will likely carry 1 billion cubic feet of natural gas per day. According to some sources, this proposed pipeline is the only one in NJ that is not in compliance with the state’s standard of co-locating new pipelines with an existing right-of-way.1

PennEast Pipeline Oppositions

Below is a dynamic, clickable map of said opposition by FracTracker’s Karen Edelstein, as well as documentation associated with each municipality’s current stance:


Click here to view map and legend fullscreen.

Additional Projects and Pushback

In Ohio, many communities are working on similar projects to prevent over 40,000 miles of proposed pipelines according to recent news reports.

And in Massachusetts and New Hampshire, municipalities are working to ban, reroute, or regulate heavily the Northeast Energy Direct Pipeline (opposition map shown below):

MA Opposition Map

Northeast Energy Direct Proposed Pipeline Paths and Opposition Resolutions in MA & NH

Why is this conversation important?

Participation in government is a beneficial practice for citizens and helps to inform our regulatory agencies on what people want and need. This surge in opposition against oil and gas activity such as pipelines or well pads near schools highlights a broader question, however:

If not pipelines, what is the least risky form of oil and gas transportation?

Oil and gas-related products are typically transported in one of four ways: Truck, Train, Barge, or Pipeline.

Truck-Spill

Drilling mud spill from truck accident

Megantic-Train

Lac-Mégantic oil train derailment

Barge-Sand

Using a barge to transport frac sand

Pipeline-Construction

Gas pipeline construction in PA forest

Trucks are arguably the most risky and environmentally costly form of transport, with spills and wrecks documented in many communities. Because most of these well pads are being built in remote areas, truck transport is not likely to disappear anytime soon, however.

Transport by rail is another popular method, albeit strewn with incidents. Several, major oil train explosions and derailments, such as the Lac-Mégantic disaster in 2013, have brought this issue to the public’s attention recently.

Moving oil and gas products by barge is a different mode that has been received with some public concern. While the chance of an incident occurring could be lower than by rail or truck, using barges to move oil and gas products still has its own risks; if a barge fails, millions of people’s drinking water could potentially be put at risk, as highlighted by the 2014 Elk River chemical spill in WV.

So we are left with pipelines – the often-preferred transport mechanism by industry. Pipelines, too, bring with them explosion and leak potential, but at a smaller level according to some sources.2 Property rights, forest loss and fragmentation, sediment discharge into waterways,  and the potential introduction of invasive species are but a few examples of the other concerns related to pipeline construction. Alas, none of the modes of transport are without risks or controversy.

Footnotes

  1. Colocation refers to the practice of constructing two projects – such as pipelines – in close proximity to each other. Colocation typically reduces the amount of land and resources that are needed.
  2. While some cite pipelines as relatively safe, incidents do occur quite often: ~1.6 incidents per day.

Has our beer been fracked?

By Matt Unger and Gianna Calisto, FracTracker PA Interns

Recently, a Grist.com article, entitled Hey! Did somebody frack my favorite beer? caught our attention here at FracTracker Alliance. In the piece, a concerned citizen questioned whether or not fracking could be affecting what many consider to be the crown jewel of Pennsylvania brewing – Yuengling. The author responded very thoroughly, but needed a map to help show the locations of breweries closest to drilling. To help identify any potential problems and hopefully allow the Commonwealth’s beer drinkers to drink easily tonight, we’ve pulled together such a map.

The PA Beer and Unconventional Drilling Map

Beer and Fracking Map

Click on the map to explore the breweries and nearby drilling activity

On this map you will see all of the drilled wells (orange), permitted wells (purple), and breweries / brewpubs that we could find in Pennsylvania as of 11-16-2014. The data was gathered from the PA DEP website and The Beer Mapping Project, as well as from a tool our map below contains that allows the viewer to measure distances between two points.

The breweries/brewpubs in the South Central and South Eastern parts of the state are located quite a long distance away from unconventional well pads. This means that Yuengling is likely safe so long as there are no pipeline or traffic incidents nearby!

Even the other areas of Pennsylvania show that brewing near areas of fracking is relatively uncommon. However, there are a few exceptions, particularly in the North Eastern and South Western parts of the state.

Select Results

  • Yuengling Brewery: 38 Miles from the nearest permitted well, 40 miles from the nearest drilled well.
  • Iron City Brewing Company: 12 miles from the nearest permitted well, 11.7 miles from the nearest drilled well. Both well sites are upstream from the brewery.
  • Nimble Hill Brewing Company: 0.5 miles from nearest drilled and permitted well

Use the measure tool on the fullscreen map to explore more about PA brewing and its proximity to drilling.

Things to Consider

The Grist article that we referred to earlier did a great job at outlining some of the risks of drilling and caveats to supporting your favorite brewery. Simply being located near a drilling site does not necessarily mean that the area’s water and air are polluted, but it is a risk. In addition to the points that Grist made, keep in mind that fracking can have other, more indirect effects on the beer industry; well pads are not the only places where effects on the environment can be seen. Spills and traffic involving the transportation of drilling resources, products, and waste pose very serious risks through the areas that these items are transported. This intense industrial activity can also give off localized air pollution. The map above only begins to highlight all of the potential beer-scare scenarios, unfortunately.

If you do feel that your favorite beer is being affected by nearby drilling activity, there are very easy things that you can do, as the Grist article explains. In the mean time, we at FracTracker will happily taste test each PA brewery’s product should the need arise!

If there are other maps that you would like to see made showing where drilling is located near you, just let us know.

Updated PA Data and Trends

By Matt Kelso, Manager of Data and Technology

The FracTracker Alliance periodically takes a deeper look into the unconventional oil and gas data in Pennsylvania, in order to provide updates for some frequently requested statistics on the industry. Here we provide updated PA data and trends as of December 4, 2014. Since unconventional drilling began in the Commonwealth permits have been issued to drill 15,573 unconventional wells, according to data from the Pennsylvania DEP. Many – 8,696 (56%) – of those permits have actually been drilled. In terms of violations, there have been 5,983 entries on the statewide Compliance Report for unconventional wells throughout the state, which are attributed to 1,790 distinct wells.

Pennsylvania Shale Viewer Map


Please click here for the full screen version, with additional map tools and controls.

Additional Stats

The number of permits, wells, and violations vary significantly from month to month, but each category is well off of its peak. The largest number of unconventional permits issued in a single month was 402, which was in December 2010, more than twice as many as were issued last month. In that year, there were six months with 300 or more permits issued, whereas there has only been one such month to date in 2014.

PA unconventional O&G activity per month from Jan. 2009 to Nov. 2014.  Source:  PADEP

PA unconventional O&G activity per month from Jan. 2009 to Nov. 2014. Source: PADEP

The 210 wells spudded (drilled) in August 2011 represents the high water mark, and is more than two times the amount of wells drilled last month. In the 28 months between March 2010 and June 2012, the industry failed to spud 100 wells only once, reaching 98 in April 2011. In the first 11 months of 2014, that plateau was missed three times, with a low of 58 spuds in February.

There was a significant spike in violations appearing on the compliance report from December 2009 through August 2011. More than 100 violations were issued in 17 out of 21 months, including 196 in March 2010. The number of violations issued has slowed down considerably since then, with November 2014 being the 34th straight month with fewer than 100 violations. Only 14 violations were issued in June 2014.

Violations per Well (VpW)

Unconventional violations per well by county in PA, showing the 10 counties with the largest number of violations.  Counties with an above average Violations per Well (VpW) score are highlighted in red.

Unconventional violations per well by county in PA, showing the 10 counties with the largest number of violations. Counties with an above average Violations per Well (VpW) score are highlighted in red.

We often ask whether drilling is more problematic in some areas than others. Since the number of wells varies depending upon the location, we must approach this question by looking at the number of violations issued per well drilled (VpW). However, there is an important caveat to consider. Put simply, what is a violation? The Pennsylvania DEP publishes a Compliance Report for unconventional wells, which has 5,983 incidents listed from 2000 through December 4, 2014. However, it used to be common for the DEP to lump several incidents into the same Violation ID number, although this is not the case for more recent infractions. When the DEP counts violations issued, they look at the total number of unique Violation ID numbers that have been issued, not the total number of incidents on the report. Here, we include the more inclusive list of items on the compliance report.

Of the 10 counties with the largest number of violations issued, only 3 counties have a violations per well mark below the statewide average. Notably, each of those three counties are located in Southwestern Pennsylvania. It is unclear from these numbers what is going on in Potter County, but clearly there is a significant problem in that location – with almost three violations issued per well drilled, Potter County has a VpW score 4.3 times the statewide average.

Operator Trends

Before we look at the operators with the most violations, there is an additional caveat to consider: It is relatively common for wells to change hands over their operational lifetimes. This characteristic could be due to one company buying another out, or simply transferring some of their assets. Still, wells changing from one operator to another is a normal aspect of the oil and gas industry. Such a fact matters for this analysis because while violations issued always stick with the responsible party in the DEP data, the name of the operator changes on the Spud Report to the current operator.

Unconventional violations per well by operator in PA, showing the 10 operators with the largest number of violations.  Operators with an above average Violations per Well (VpW) score are highlighted in red.

Unconventional violations per well by operator in PA, showing the 10 operators with the largest number of violations. Operators with an above average Violations per Well (VpW) score are highlighted in red.

Because of how these datasets are maintained, we see that East Resources has 261 violations for zero wells, which is of course an impossibly large ratio. That is because East sold off its stake in the Marcellus to Royal Dutch Shell, which does business as SWEPI in Pennsylvania. SWEPI, by the way, is 13th on the list of violations in its own right, with 154 violations for 675 wells, resulting in a 0.23 VpW. If the legacy violations for the old East wells were included, the result would be a 0.61 ViW score, which is almost three times as high, but still below the statewide average. FracTracker doesn’t do the analysis that way, both because it is unfair to the new operator to charge them with violations that they had nothing to do with, as well as being nearly impossible to keep track of the various transactions that result in wells changing hands over the years.


Cover image by Pete Stern, 2013.

Oil Trains Passing Through Pittsburgh

A Pilot Train Count

By Samantha Malone – Manager of Education, Communications, & Partnerships

FracTracker Alliance and the CREATE Lab at CMU recently launched a pilot project to track the transportation of volatile crude oil as it passes through Pennsylvania and specifically the Pittsburgh region.

For a bit of background, we were specifically interested in how many cars marked with either a 1075 or 1267 placard (shown below). 1075 placards designate cars that are carrying or recently carried (not yet cleaned out) butane, LPG, propane, or a flammable gas. Alternatively, 1267 placards are warning signs for cars carrying petroleum crude oil or some sort of flammable liquid.

DOT Placard 1075 Butane, LPG, Propane, Flammable Gas, Class 2

DOT Placard 1075 Butane, LPG, Propane, Flammable Gas, Class 2

D.O.T. Placard 1267 Petroleum Crude Oil, Flammable Liquid, Class 3

DOT Placard 1267 Petroleum Crude Oil, Flammable Liquid, Class 3

Oil Train Counts

Over 11 hours we counted 28 trains, 10 of which contained at least one car with the 1075 or 1267 placard. Most of these trains were quite long, with 28 trains hauling 2,874 cars.

The largest inbound train with the 1267 placard that we identified and estimated to be full was hauling 97 crude tankers. If they were indeed full, this train carried between 2.5 and 3.4 million gallons of crude oil. As a point of reference, the Lac-Mégantic derailment that occurred in 2013 in Quebec and killed 47 people was only carrying 74 Bakken crude cars.

Of the 2,874 cars that we counted, 360 were carrying some sort of oil product. Of those oil cars, approximately 70% were of the 1267 variety (Figure 1).

Ratio of oil cars to total over 11 hours

Figure 1. Ratio of oil cars to total documented by volunteers in Pittsburgh, PA over 11 hours

Speed Matters

The fastest oil train that we observed was going approximately 50 MPH. This train was likely full, based on load estimates and the direction it was traveling. This speed violates a voluntary compliance that crude trains run <40 MPH through high-threat areas. A train that derailed in Lynchburg, VA in April was traveling just 24 mph. Our counting location would likely qualify as a high-threat area, as we were near Neville Island, relatively close to ALCOSAN and the City of Pittsburgh, and just a few yards from the Ohio River and residential homes.

While Pittsburgh certainly has its share of oil trains, concern over the dangers that these trains pose to towns along its tracks extends far beyond the Pittsburgh area. Groups as far as California have gathered together to monitor train traffic. We hope that by tracking and monitoring the number of oil trains over time, we can begin to understand the risks that these trains pose should an incident occur.

The Data Collection Process


Here is how we collected the above data: On October 21st our staff, interns, and generous volunteers spent designated shifts observing the passing of trains and the contents of their cars between about 7:30 AM and 6:30 PM. Under the cover of a pop-up shelter, teams of at least three participants videotaped trains as they passed in either direction, counted and recorded the number of cars that they carried, and most importantly identified and counted specific placards that labeled individual cars as oil-carrying.

Many thanks to the groups who helped with this pilot count: volunteer citizens, Group Against Smog and Pollution, Three Rivers Waterkeeper, Women for a Healthy Environment, our interns from Pitt and Duquesne, and CMU staff.

The CREATE Lab then reviewed and analyzed the collected information and video feed. You can take a look at some of the high-resolution video feed they were able to collect with their BreatheCam. If you have specific questions about the train counting protocol or would like to set up one of your own, please contact us.

About Us

FracTracker Alliance is a non-profit with an office in the Pittsburgh area whose mission is to share maps, data, and analyses to communicate impacts of the global oil and gas industry and to inform actions that positively shape our energy future. www.fractracker.org

The Community Robotics, Education and Technology Empowerment Lab (CREATE Lab) explores socially meaningful innovation and deployment of robotic technologies and is based out of Carnegie Mellon University. www.cmucreatelab.org