2012 Violations per Well in Pennsylvania
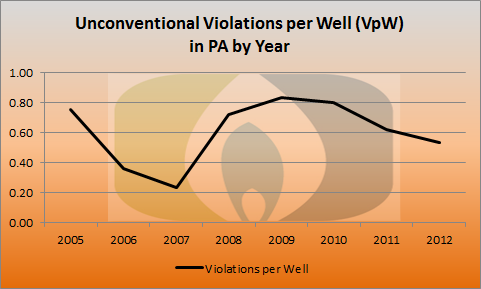
Ever since the Pennsylvania Department of Environmental Protection (PADEP) first released violation data to FracTracker in October 2010, our viewers have wanted to know if there were any discernible patterns in the data. Since that time, the format of the data has changed, the data categories have changed, and the analyses at FracTracker have continued to evolve. The gold standard has always been some variation on the number of violations per well (VpW), which takes into account the reality that some operators have many more wells than others, so ranking by the total number of violations would show the largest operators in the worst light.
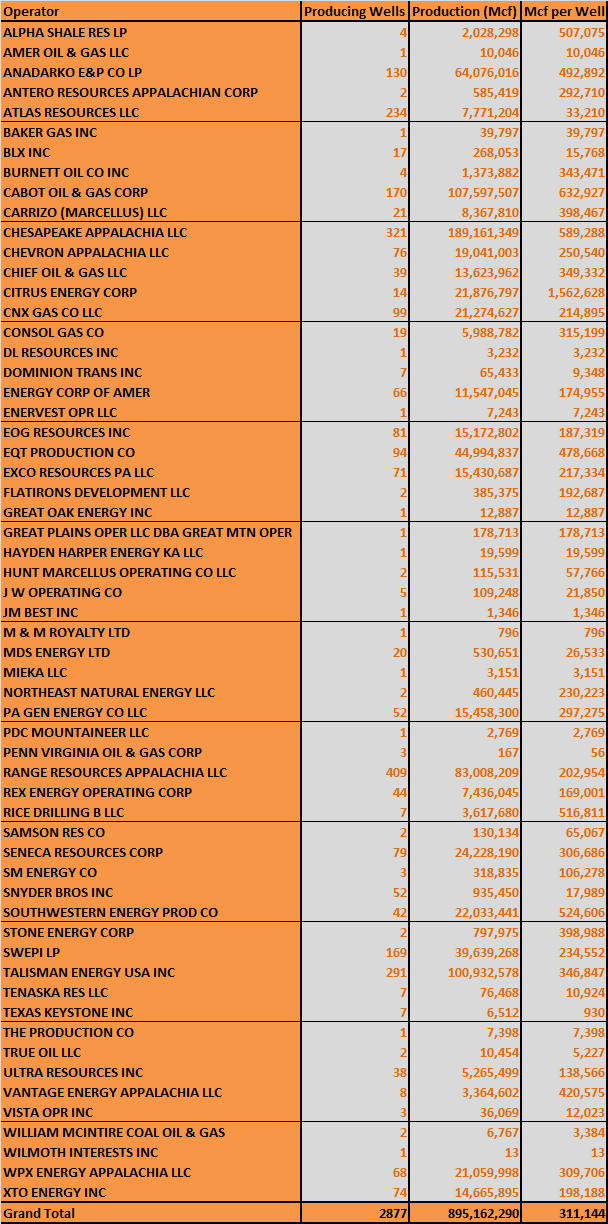
Even so, there are many ways to calculate the data. The first effort was violations per offending well, which more than anything measures how badly things go when they do go wrong. The difference between that and violations per drilled well is more than trivial semantics, because it’s designed to show how often things go wrong per attempt. This same analysis also includes violations per amount of gas produced, which is more of a cost/benefit analysis, which allows for the possibility that some violations may be “worth it” more so than others, if the well is an especially large producer.
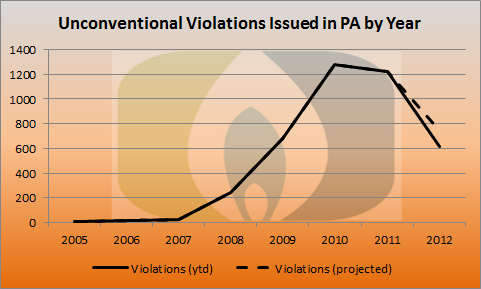
But even violations per drilled well is less straght-forward than one might think. You could look at a given time frame, or the entire period of available data–either way you do it there will be some skew, whether because some activity is excluded, or because the data for drilled wells goes back three years further than violations data.
There is also the fact that some violation ID numbers appear more than one time on the compliance report, a fact that makes, “What is a violation?” something of an existential question. Summaries by PADEP show that the agency counts violations by the number of violation IDs that have been issued, although a close look at the data really does make it seem like related issues are sometimes lumped together into a single violation ID, although usually not.
And finally, there is the whole issue of whether we should even bother to count administrative violations, or if we should limit it to the environmental, health, and safety (EH&S) category. In February 2012, FracTracker argued to include administrative violations, as a closer look at those violations showed that it included real-world impacts, and not just a failure to dot i’s and cross t’s. A few months later, the University of Buffalo’s Shale Resources and Society Institute (SRSI) argued, among other things, to exclude them. FracTracker then created a Classify the Violation Quiz, which asks users to guess whether a given violation was classified as administrative or EH&S. This anonymous quiz was set up so that participants who got half of the questions correct would pass, but despite the fact that each question only has two possible answers, a large majority of respondents have failed. A few months later, the prime advocate for excluding administrative violations–the SRSI–was closed by the University of Buffalo amid a cloud of ethics concerns.
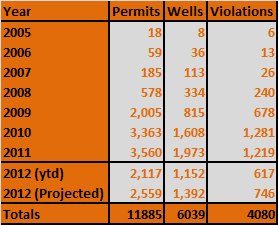
It is a shame that a simple metric like violations per well should require such a preamble, but at FracTracker, we strive to be completely open with what we have done with the data. In this case, I have looked at both the number of violation IDs issued as well as the raw number of appearances on the report. Administrative violations are rightfully included. Wells are included if their spud date was in 2012, and violations are included if their violation issue date was in 2012. This data has been summarized by drilling operator and by county. So let’s get to it:
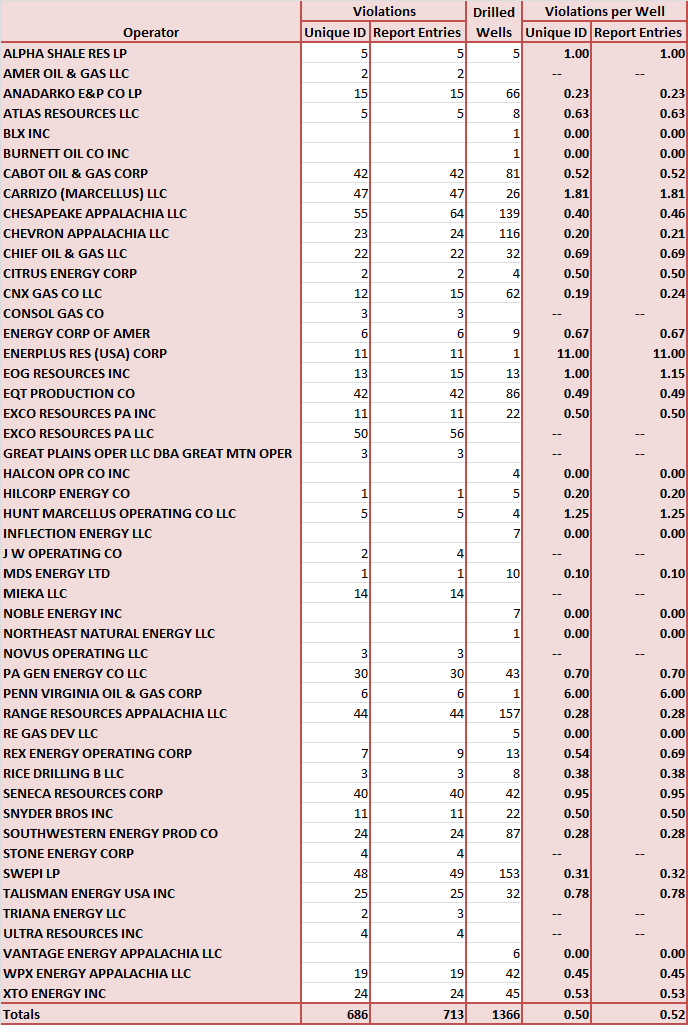
Violations issued per well drilled for unconventional oil and gas operators in Pennsylvania in 2012.
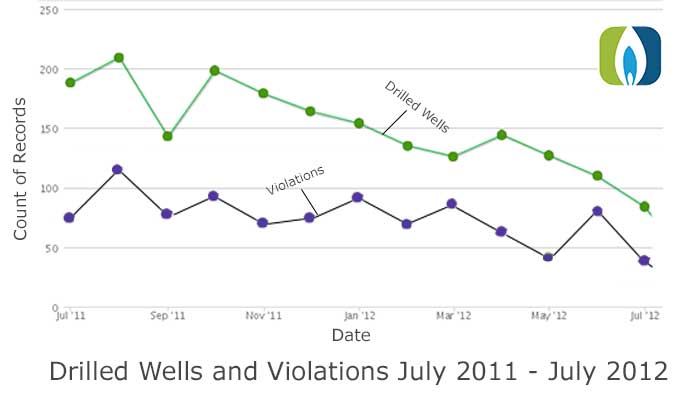
The following line chart shows the violations per well as tabulated by unique violation ID numbers issued:
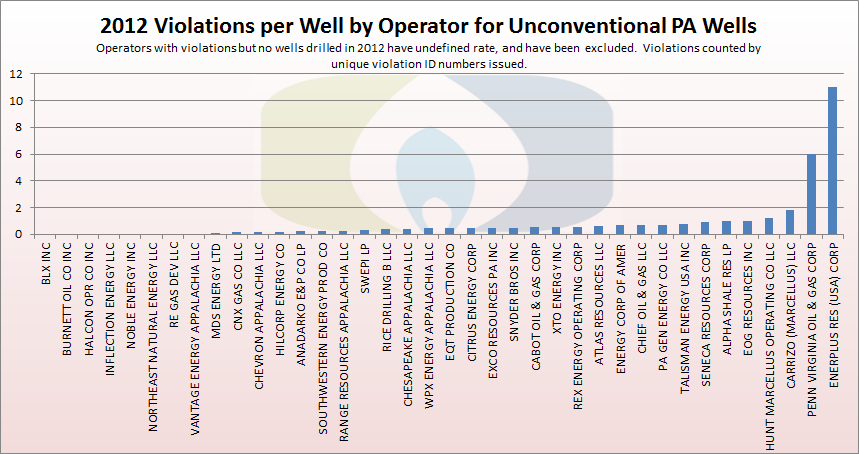
Violations per well by operator for unconventional wells in Pennsylvania in 2012. Violations tallied by unique violation ID numbers issued.
In the chart above, Penn Virginia and Enerplus seem to be particularly egregious in terms of violations per the number of wells drilled, but it should be pointed out that both operators had only one well drilled in 2012, reminding us of the importance of sample size. Here then is the same data, including only operators that drilled 10 or more wells in 2012:
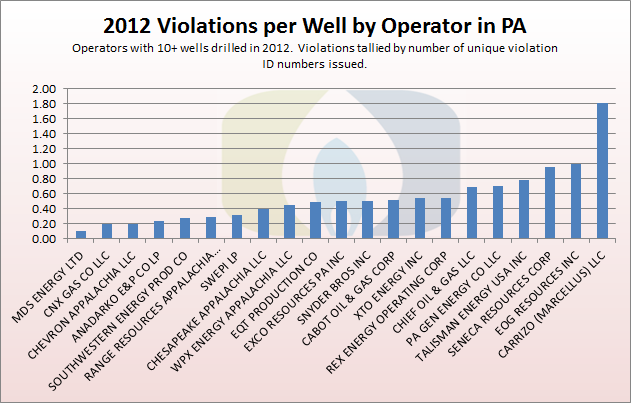
Violations per well by operators with 10 or more unconventional wells drilled in Pennsylvania.
The state-wide average in this category is 0.50 violations per well drilled.
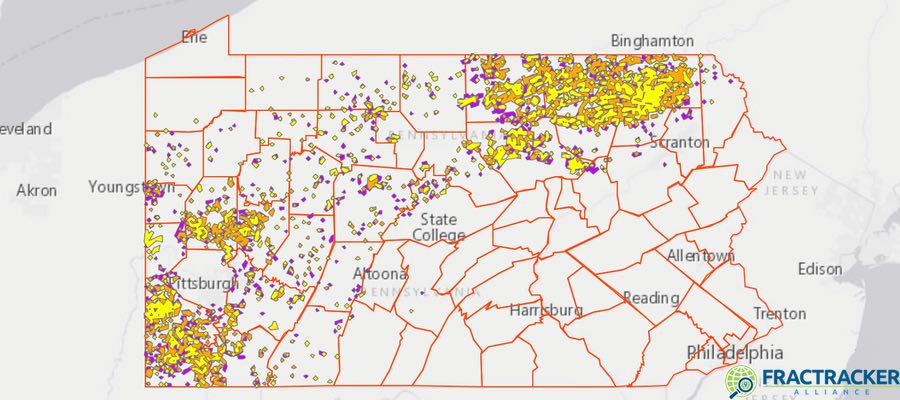
Let’s take a look at the data in terms of geography:
 Violations per well by county for unconventional wells in Pennsylvania
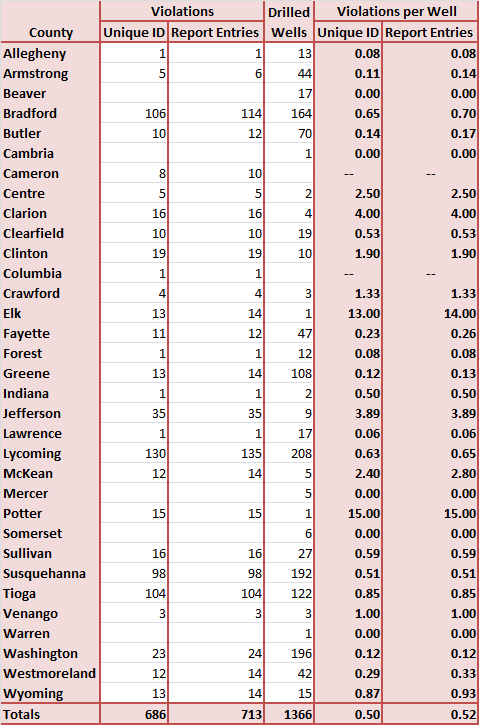
As with operators, there is considerable variation in terms of violations per well between the various counties:
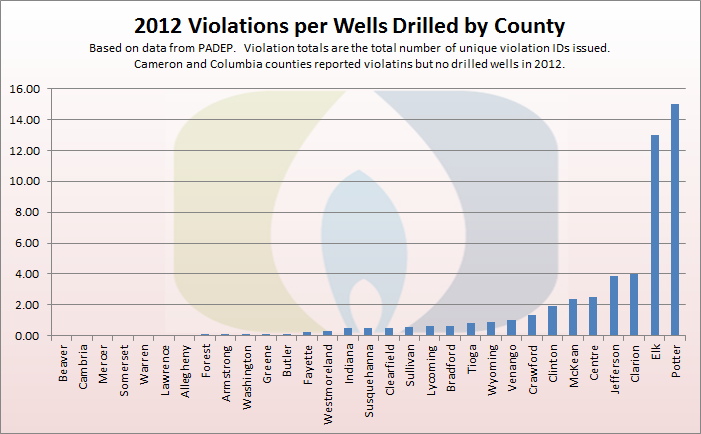
Violations per well by county for unconventional wells in Pennsylvania