Industrial Impacts in Michigan: A Photo Essay & Story Map
Southwest Detroit and neighboring South Rockwood in Monroe County could not be more different demographically, but one thing they have in common is a consistent battle with the extractives industry.
With environmental advocates Theresa Landrum and Doug Wood, FracTracker created a Story Map to document what this infrastructural buildout in Southeastern Michigan looks like from the air, how it has displaced entire neighborhoods, and how it has forever changed their quality of life, in the name of short-term profiteering.
“Marathon is a prime example of corporate polluters continuing
to choose profit over safeguards for our public health.”
– Congresswoman Rashida Tlaib
Each year, FracTracker Alliance gives out its Community Sentinel Award for Environmental Stewardship. We had an amazing group of candidates this year, and the four winners are extremely brave, persistent, insightful, and collaborative activists representing diverse communities all over the country.
I have had the good fortune to interact with two of the winners – Theresa Landrum and Brenda Jo McManama – quite frequently over my time at FracTracker. This year’s Sentinel Award winners and all its previous recipients are passionate and persistent fighters for environmental justice in their own backyards and around the United States.
It is around this time of year that all the negativity involved in the fight against fossil fuel industries dissolves away for me as I find myself inspired and humbled by the Sentinel winners. Theresa and Brenda Jo constantly inspire me and FracTracker to strive to do more, do better, and remain cleareyed as to whom we serve. All the Community Sentinel nominees are exemplars of what it is to walk authentically and humbly through life.
However, I am going to spend the next couple paragraphs speaking specifically about Ms. Landrum, because it is she that I have come to know and work quite well with since COVID-19 was something we thought would be gone by June.
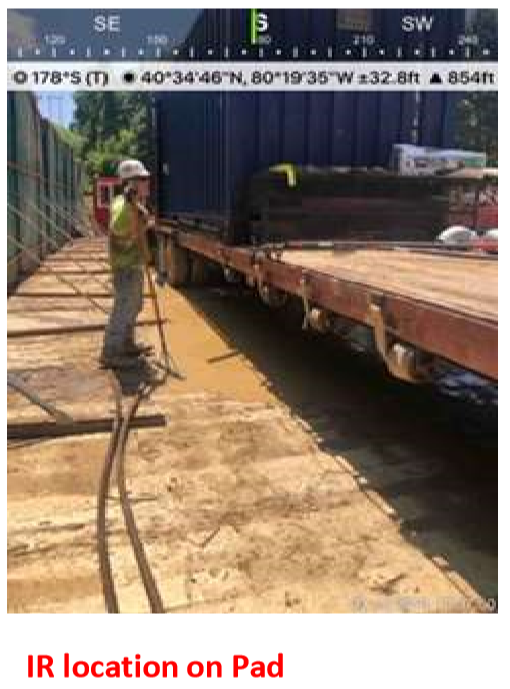
I had heard so many amazing things about Ms. Landrum from a common comrade, Mr. Doug Wood, whom FracTracker has written about with respect to the silica sand mining he is fighting and dubious pro-mining legislation being pushed in Michigan’s Statehouse, but I had never met her in person. That changed on a scorching hot day this past June, when Doug, Theresa, and I met (socially distanced) in the shadow of Marathon Petroleum’s refinery at Detroit’s Kemeny Recreation Center, just a couple stones throws across I-75 (see images below).
Incidentally, this is the same refinery that Congresswoman Rashida Tlaib (D, MI-13) has been railing against for years, including in a statement she issued on yet another incident at
the refinery:
“Marathon is a prime example of corporate polluters continuing to choose profit over safeguards for our public health. It is time to say enough is enough of Marathon’s constant disregard of the health and safety of residents who live, work, and visit the surrounding communities. Marathon has perpetrated numerous incidents detrimental to our communities and must be held accountable – they clearly cannot be trusted to protect our health. I look forward to discussing the need to hold Marathon and other entities who poison our community accountable and solutions to make our communities breathe and live free at the upcoming congressional field hearing I am hosting with other members of Congress, experts, and grassroots activists here in Detroit.”


")

Scroll horizontally to see additional images:
- Southeastern Michigan Environmental Activists Doug Wood and Theresa Landrum at Detroit’s 48217 Kimeny Park with Marathon’s Refinery in the Background, June, 2020
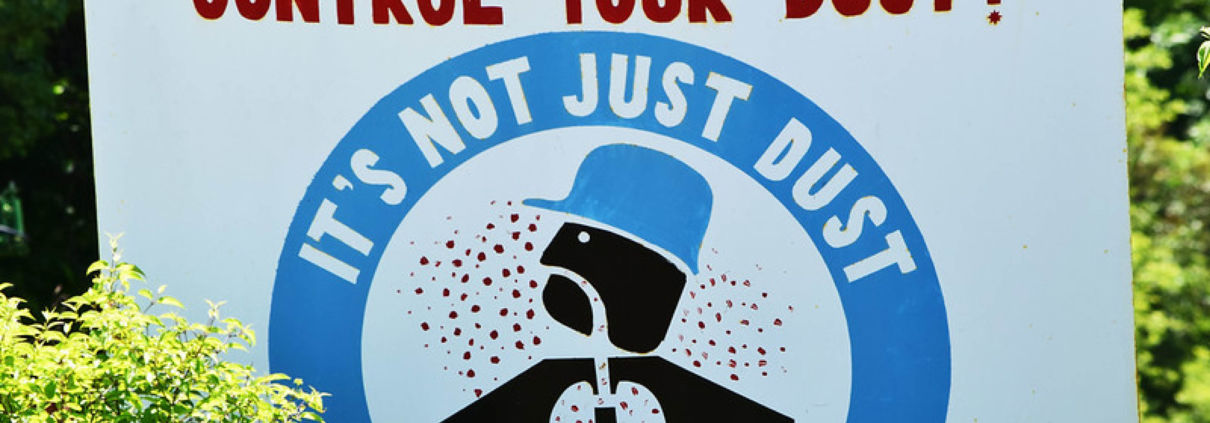
- Anti-Frac Sand mine signage created by Monroe County, Michigan activist Doug Wood, June, 2020
- No Dumping signage erected by Marathon Oil in Detroit’s Oakwood Neighborhood adjacent to the company’s oil refinery
- Concerned Citizen and Sylvania Minerals mine neighbor Doug Wood
It did not take more than 30 seconds for me to realize that Theresa was an authentic and persistent fighter for her community, and that she belongs on the Mt. Rushmore of EJ advocates – as does Doug Wood and all of the Community Sentinel nominees past, present, and future.
After meeting at the recreation center, I followed Theresa around with my drone, capturing footage and images of the worst actors in the 48217 zip code of Southwest Detroit, as well as of River Rouge and Ecorse. This turned out to be the first of three trips to meet with Theresa throughout the summer and fall of 2020.
During each trip and across dozens of phone conversations, Theresa explained to me what industry has done to Southwest Detroit, how she has gone about combatting it, and the way that Lansing treats Wayne County.
It struck me that much of her experience overlaps with the stories I have heard in disparate demographics, from soybean farmers in LaSalle County, Illinois, to dairy farmers in Western Wisconsin, all the way to coalminers in Central Appalachia.
Their stories illustrate the near universal tale of how industry needs and welfare demands take precedence over the rights of citizens. It is the story of globalization, shareholder returns, and political/economic elites ignoring, mocking, or being deaf and blind to the needs of their constituents and the crimes being committed in the name of progress and Gross Domestic Product (GDP).
One thing Theresa and I have spent quite a bit of time discussing is the overlap in environmental justice across demographics, and how superficial differences have been weaponized to divide us, leaving only corporations and their political handmaids to benefit. Industry beneficiaries and politicians have colluded to declare in the words of Thomas Frank’s latest book “The People, No!” Yet, it is people like Theresa, Doug, Brenda Jo, and all the other environmental activists we celebrate who are and will be instrumental in bridging those divides, and guiding the citizenry to pivot, to identify and defeat the real Leviathan – the Hydrocarbon Industrial Complex in all its manifestations and with all its tentacles spread out across this country.
The best way I know how to return the favor to folks like Theresa is to continue to do what FracTracker does best, and what I hope I am doing well, which is documenting the infrastructure and landscapes that are or have been in the crosshairs of industry, whether it be steel, coal, oil, or in the case of our name – fracked natural gas.
I have been working with Theresa and Doug on a Story Map that illustrates the scale and scope of industrial impacts in southeastern Michigan, from US Steel’s Zug Island to Sylvanian Mineral’s frac sand mine in South Rockwood. As I mentioned above, we have outlined the plight of Doug and Dawn Wood in their fight against their neighbor Sylvanian Minerals. However, with respect to Southwest Detroit, it is critical that we give a bit of background to the region’s cultural significance. For that, I am going to refer to Ms. Landrum’s own words, shared below:
A Historical Perspective of Wayne County Michigan’s Tri-Cities Region
By Theresa Landrum
During the first and second waves of the early 20th Century Great Migration, African Americans came from the South to Michigan’s communities of Ecorse (48229), River Rouge (48218), and Southwest Detroit (48217), AKA the “Triple Cities,” seeking factory jobs in the surrounding industries; U.S. Steel (formerly Great Lakes Steel), Ford Motor Company, Zug Island, Dana Corporation, and BASF Chemicals. During this time, many white men enlisted in the armed forces, and employers needed workers – so companies recruited southern African Americans to fill the jobs.
This region is one of the first African American settlements in Michigan after World War II, where Black people could actually buy homes, which helped establish metro Detroit’s Black middle class.
By the 1930s and 40s it was a self-sustaining area rich with opportunities, a mecca for Black-owned businesses, like gas stations, stores, jazz clubs, restaurants, hotels, laundromats, dry cleaners, and much more. It was also the home of Black professionals: doctors, pharmacists, policemen, florists, bakers, dentists, teachers, lawyers, and realtors thrived here, and was the site of one of Michigan’s first Black hospitals, Sidney A. Sumby Memorial Hospital, built by Black doctors.
The thread that ties these three communities/zip codes together is their formation of (what was then) Ecorse Township. Their division came after the City of Detroit expressed interest in annexing the River Rouge area. River Rouge incorporated into a village to ward this off, but Detroit was able to annex the Southwest 48217 area in 1922, thus segmenting Ecorse Township into three parts.
Fast forward to the 1950s, when Detroit’s landscape changed forever with the government’s declaration of “Eminent Domain” that claimed many African American homes for construction of the I-75 Expressway, which runs right through the center of Southwest Detroit’s (SWD) 48217 community. As I-75 was constructed, Ohio Oil (which officially became Marathon Oil in 1962) also increased its footprint in the area by acquiring nearly 100 acres and destroying a wetland habitat to expand its storage tank farm, which to date has over 100 storage tanks.
Marathon expanded again in 2007 with the announcement of the $2.2 billion Detroit Heavy Upgrade Project (DHOUP), where they would transition to refining dirty tar-sands from Alberta, Canada. This increased production to 120,000 barrels of crude per day, and thus increased the expulsion of harmful, pollutive emissions into the nearby neighborhoods. The project was completed in 2012, which also resulted in Marathon buying over 400 homes in the SWD 48217 (Oakwood Heights) area, further encroaching into residential communities.
Theresa was a recipient of the 2020 Community Sentinel Award for Environmental Stewardship, presented by FracTracker Alliance and Halt the Harm Network. Read more about her story here.
The Thoughts of Dawn & Doug Wood About Living Next to a Frac Sand Mine
I asked Dawn and Doug Wood to send me their thoughts on what it is like living next to Sylvanian Minerals and US Silica’s frac sand mine in South Rockwood, Michigan. I extracted (and clarified where necessary) the excerpts below that clearly illustrate their frustrations with their community, local, and federally elected officials, as well as the mine operators:
“[The] list of insurmountable mini-nightmares of living next to a frac sand mine [is endless at this point]. [Ten] years ago, they wanted to annex this quarry. [Our] village government has exercised no control over this corporation. [T]he village and the quarry refuse to do any air monitoring, [and] the residents who voted [in favor of] this quarry continue to be silent against any controls over this quarry. Residents seem to fear retaliation if they speak out against [the] village/quarry, [and to this day we] can’t quite explain the community’s lack of outrage … [We] have been shaking our head for years about this … It’s like the pandemic, it is invisible, yet it is killing people … [and] we are living in a polluted community, so our lungs are already taxed [which amplified the impacts of COVID]. [We] have been petitioning for air monitors and dust controls for four years, [and to add insult to injury] after ten years of this bull- – – -, the industry proposes Senate Bill 431 to totally strip communities of their controls, allowing mines to expand whenever they want, and new quarries to just be approved wherever they want [which has prompted the industry to correctly assume] they are entitled. PURE MICHIGAN is the state slogan. We think that’s PURE BULL- – – -!!”
A Southwestern Detroit and Neighboring Monroe County Industrial Impacts Story Map
Southwest Detroit and neighboring South Rockwood in Monroe County could not be more different demographically, but one thing they have in common is a consistent battle with the extractives industry.
We built this Story Map to identify the industrial bad actors and census-level indicators such as mean annual income, and most importantly, to present a growing library of georeferenced drone footage and imagery we have collected over the years.
There have been dozens of other industrial projects foisted on the Triple Cities area of Detroit during this period and to the present day. The goal of this Story Map was to document with drone photography what this infrastructural buildout looks like from the air, how it has displaced and been incorporated directly into neighborhoods – and in the case of Sylvanian Mineral’s South Rockwood facility operating adjacent to good people like the Woods – how it has forever changed their quality of life, in the name of short-term profiteering.
We will continue to “infill” and expand this Story Map in the coming months and years, especially throughout greater Wayne County and the surrounding counties, as southeastern Michigan continues to act as a chokepoint for all manner of industrial and fossil fuel operators and activities. Furthermore, this collaborative effort with Ms. Landrum demands her community’s involvement and acceptance. We also strive to make this project a valuable resource for Michigan-based environmental NGOs and the state’s excellent journalists, like Steve Neavling at Detroit MetroTimes, and Evan Kutz at Great Lakes Beacon.
We plan to update this Map with more culturally significant imagery from the Detroit Public Library and The Wayne State Walter Reuther Library to include media focusing on labor strife, police violence, and the rich tradition and history of the region’s artistic heritage. Additionally, we will expand the depth and breadth of our drone imagery library, as well as continue our nascent effort to collect the stories of regional elders who speak to Southwest Detroit as one of the fulcrums of African American culture, and who explore how industrial colonialism has decimated much the area’s sense of place and community pride.
However, I am confident and hopeful that with progressive voices like Congresswoman Tlaib, committed journalists like those previously mentioned, and activists like Ms. Landrum passing the torch to a younger generation of activists, Southwest Detroit’s condition will take a turn for the better.
Footnote on Michigan’s Senate Bill 431
We wrote about the impacts that SB 431 would have on Michigan’s community and ecosystems last summer, when we were outlining some of the industry’s efforts in Statehouses across the country to weaken environmental regulations – and in some cases, the democratic process itself. SB 431, in particular, would have made the process of operating a sand and gravel mine in Michigan much easier, by way of removing local participation. As the Metamora Land Preservation Alliance (MLPA) wrote in opposition to the bill, this legislation would have allowed for “uncontrolled gravel mining” throughout the state. However, in a bit of good news, a large coalition of Michigan environmental organizations was able to defeat this bill with the MLPA, writing the following on its Facebook page:
“KILLER GRAVEL BILLS DEFEATED!!!
SENATE BILLS 431/849 DEFEATED!
NO SENATE VOTE THIS YEAR – BILLS ARE DEAD!
After almost 18 months of battling in Lansing – Senate Bills 431 & 849 (sponsored by Senator Hollier (D) Detroit) – have been defeated. They will not be coming up for a vote this calendar year, and by Senate rules they will therefore expire. Thus ending, for this year, the dire threat of uncontrolled gravel mining, endangerment of our groundwater, and loss of control of how our communities grow and develop. Make no mistake – this was a serious threat to Michigan’s citizens and communities – and it was a no-holds-barred fight in Lansing.”
Wins for communities over corporations like this are rare, indeed, and should be celebrated. Congratulations to the Woods, MLPA, and all the Michigan communities and organizations that pushed back against this bill. You are true Community Sentinels!
Industrial Impacts in Michigan:
A Photo Essay & Story Map
By Ted Auch, PhD, Great Lakes Program Coordinator
and
Theresa Landrum, of Detroit, Michigan, 48217. The Original United Citizens of Southwest Detroit; 48217 Community and Environmental Health Organization; Michigan Advisory Council on Environmental Justice; Sierra Club Detroit Chapter, MEJC Clean Air Council; Michigan PFAS action response team
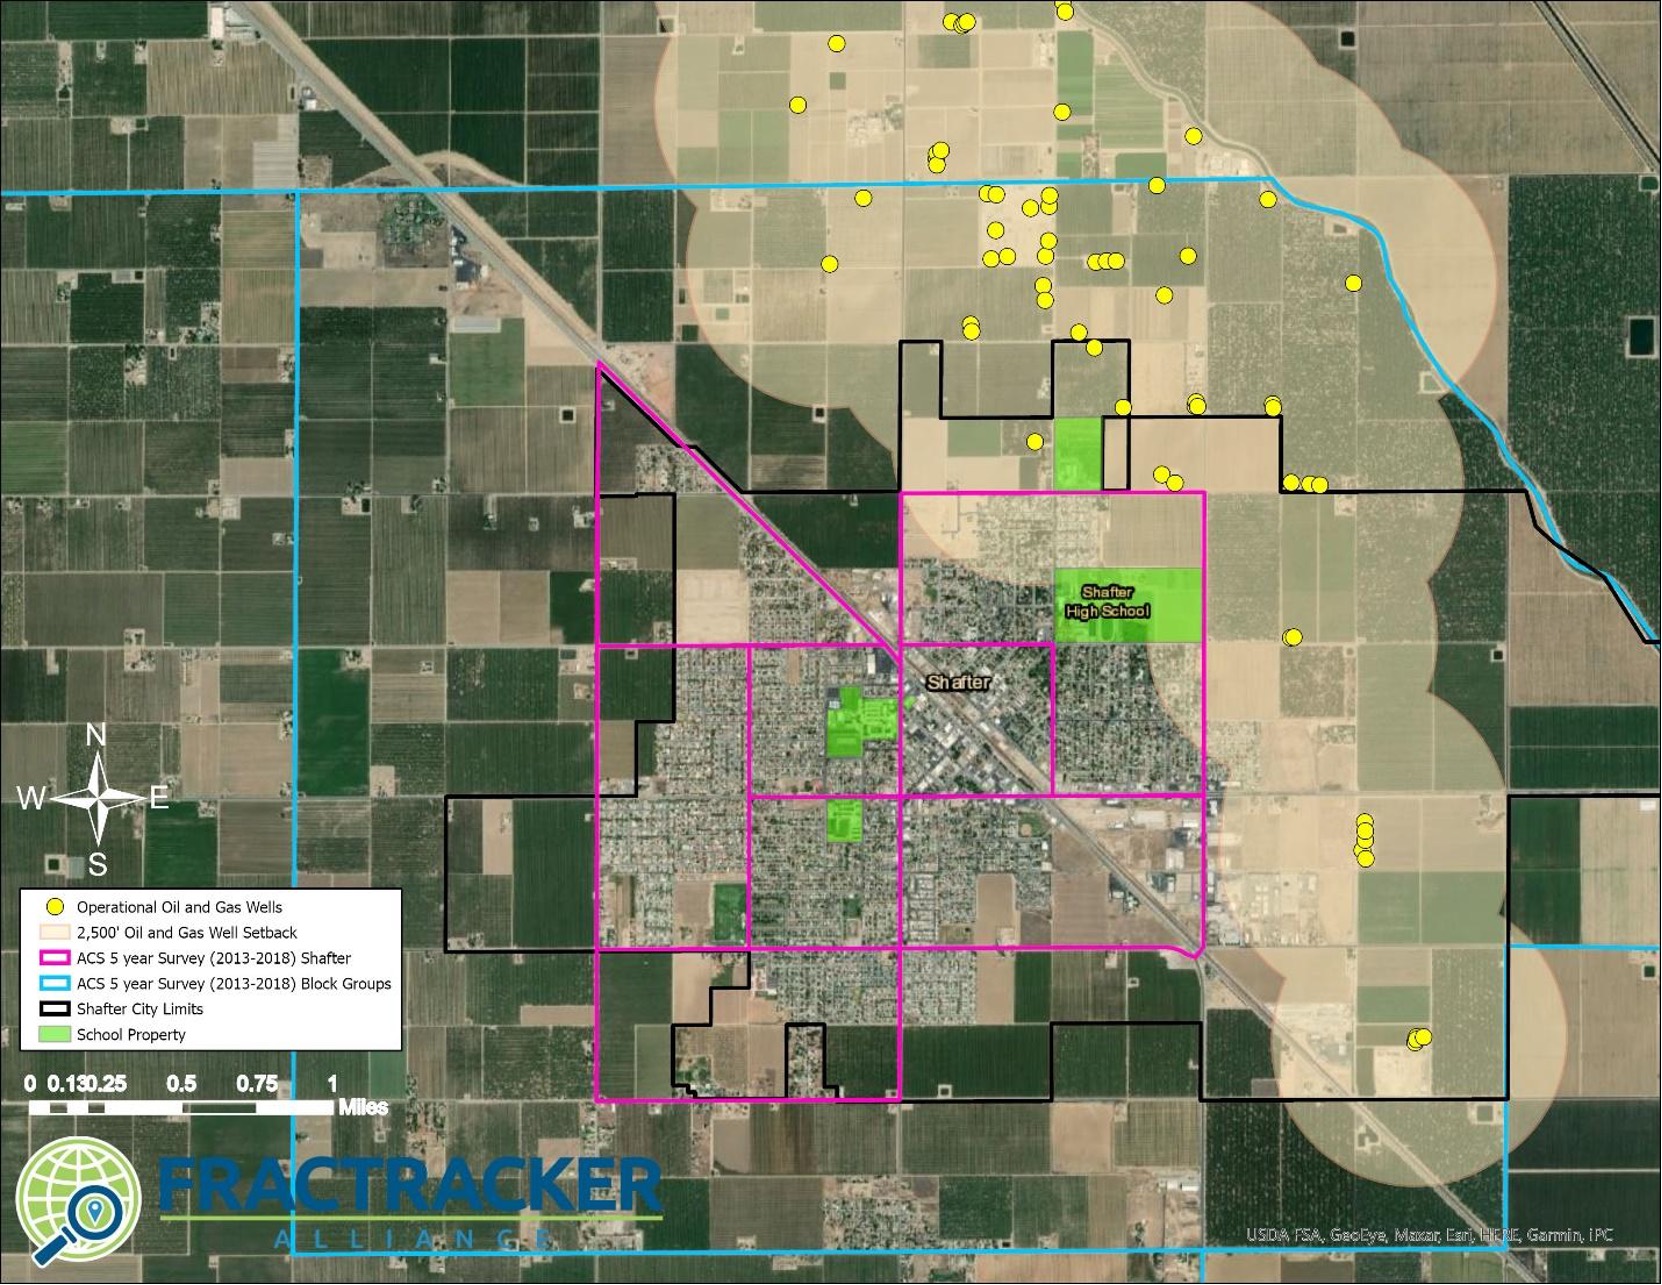


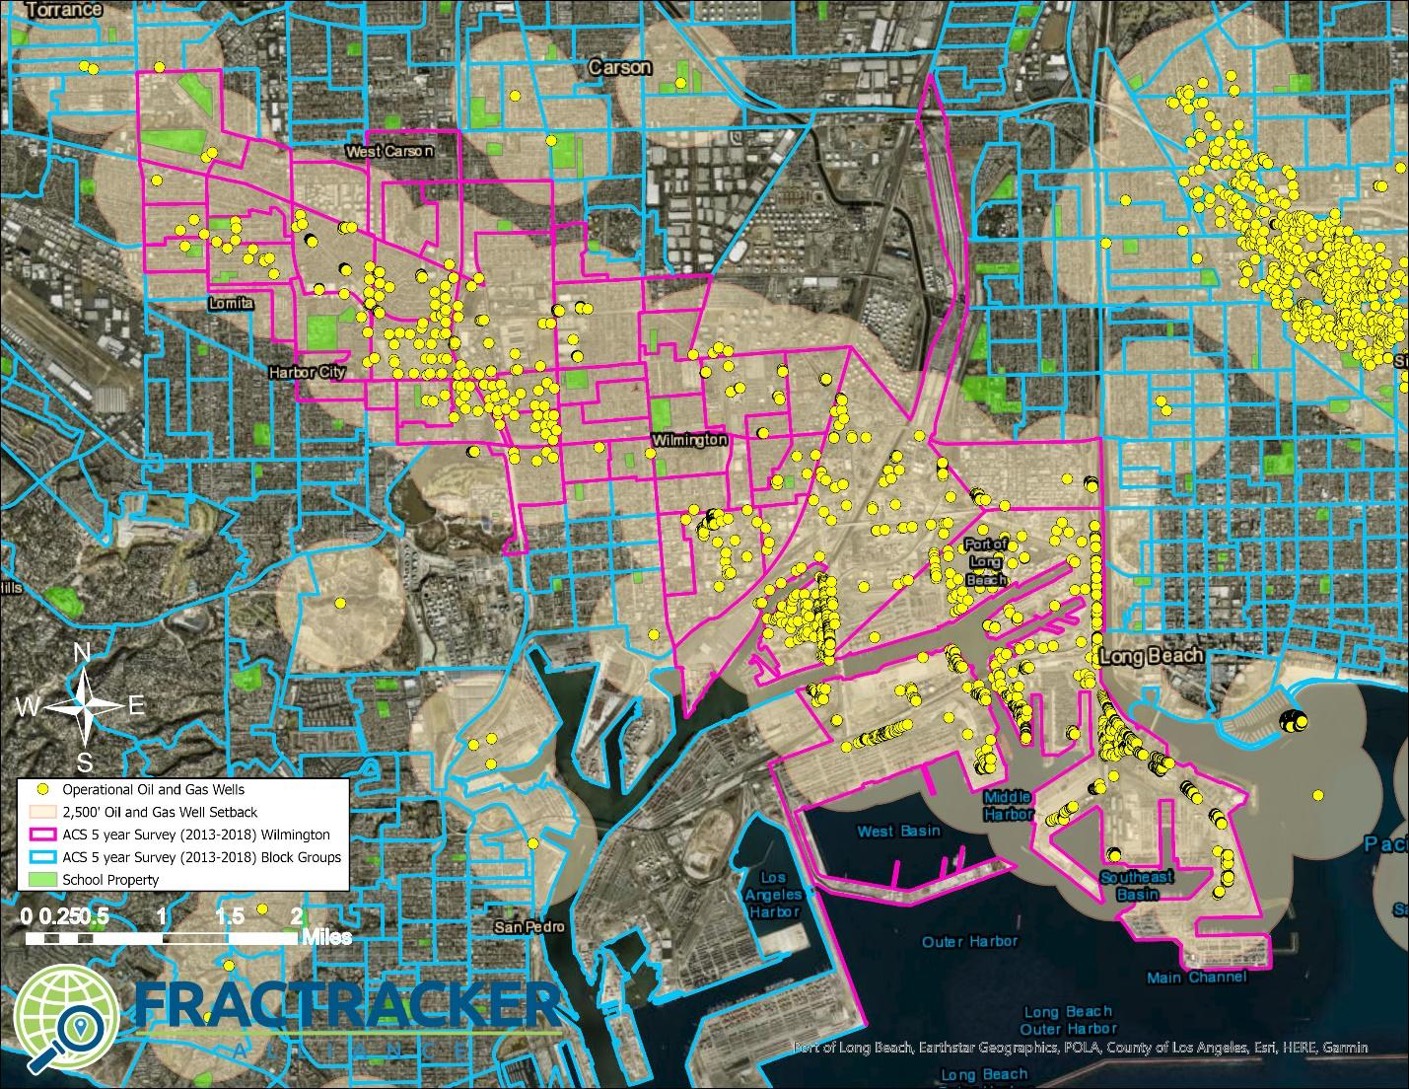

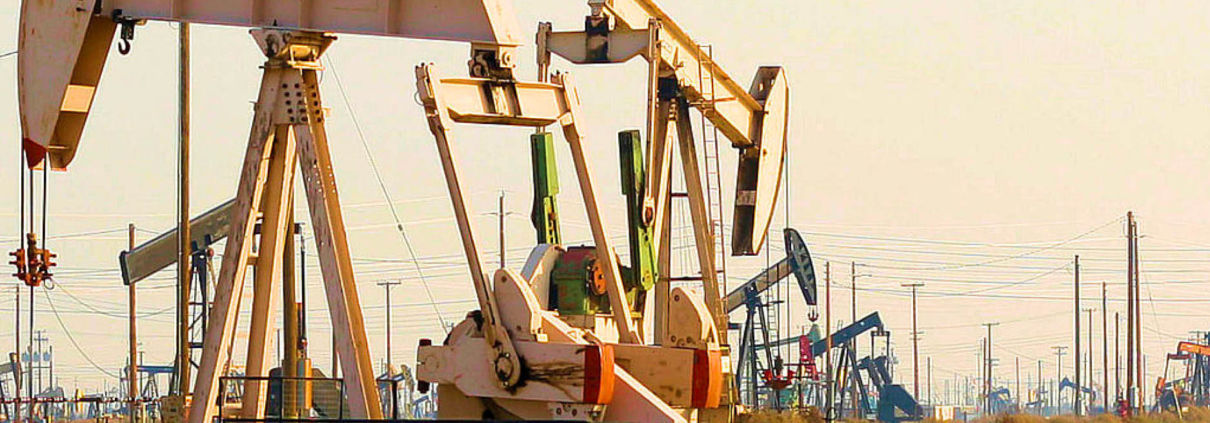


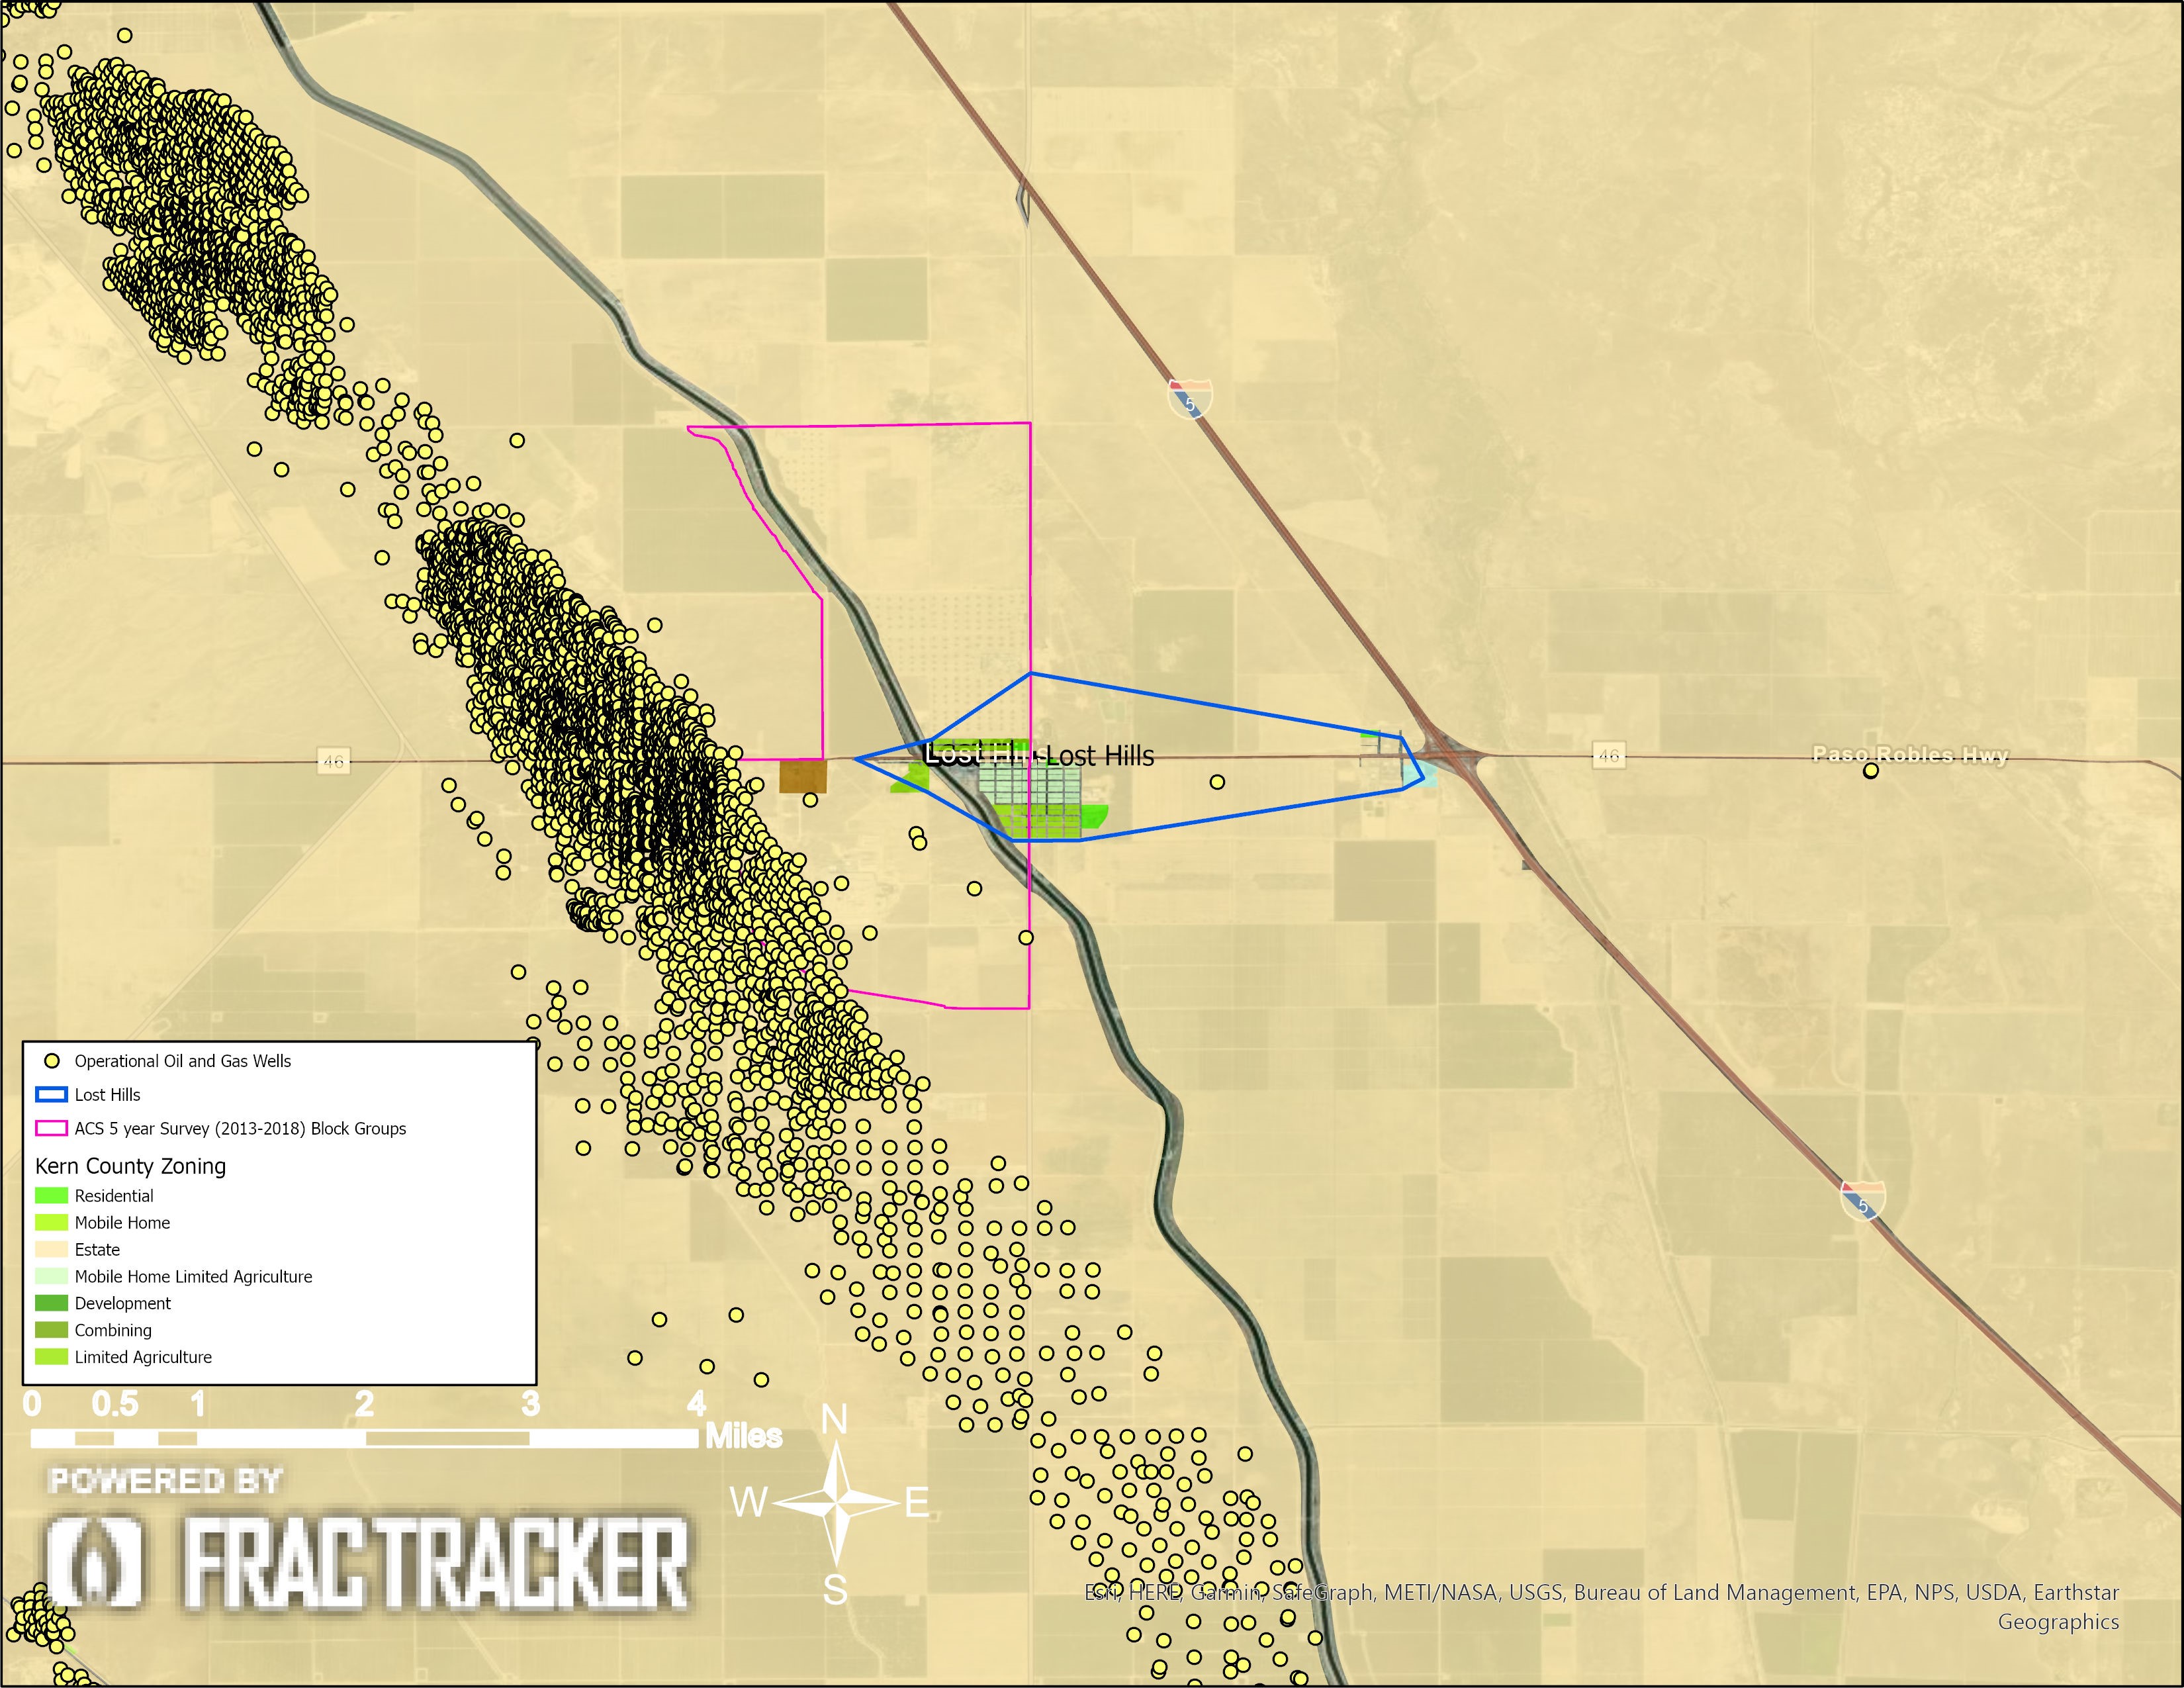
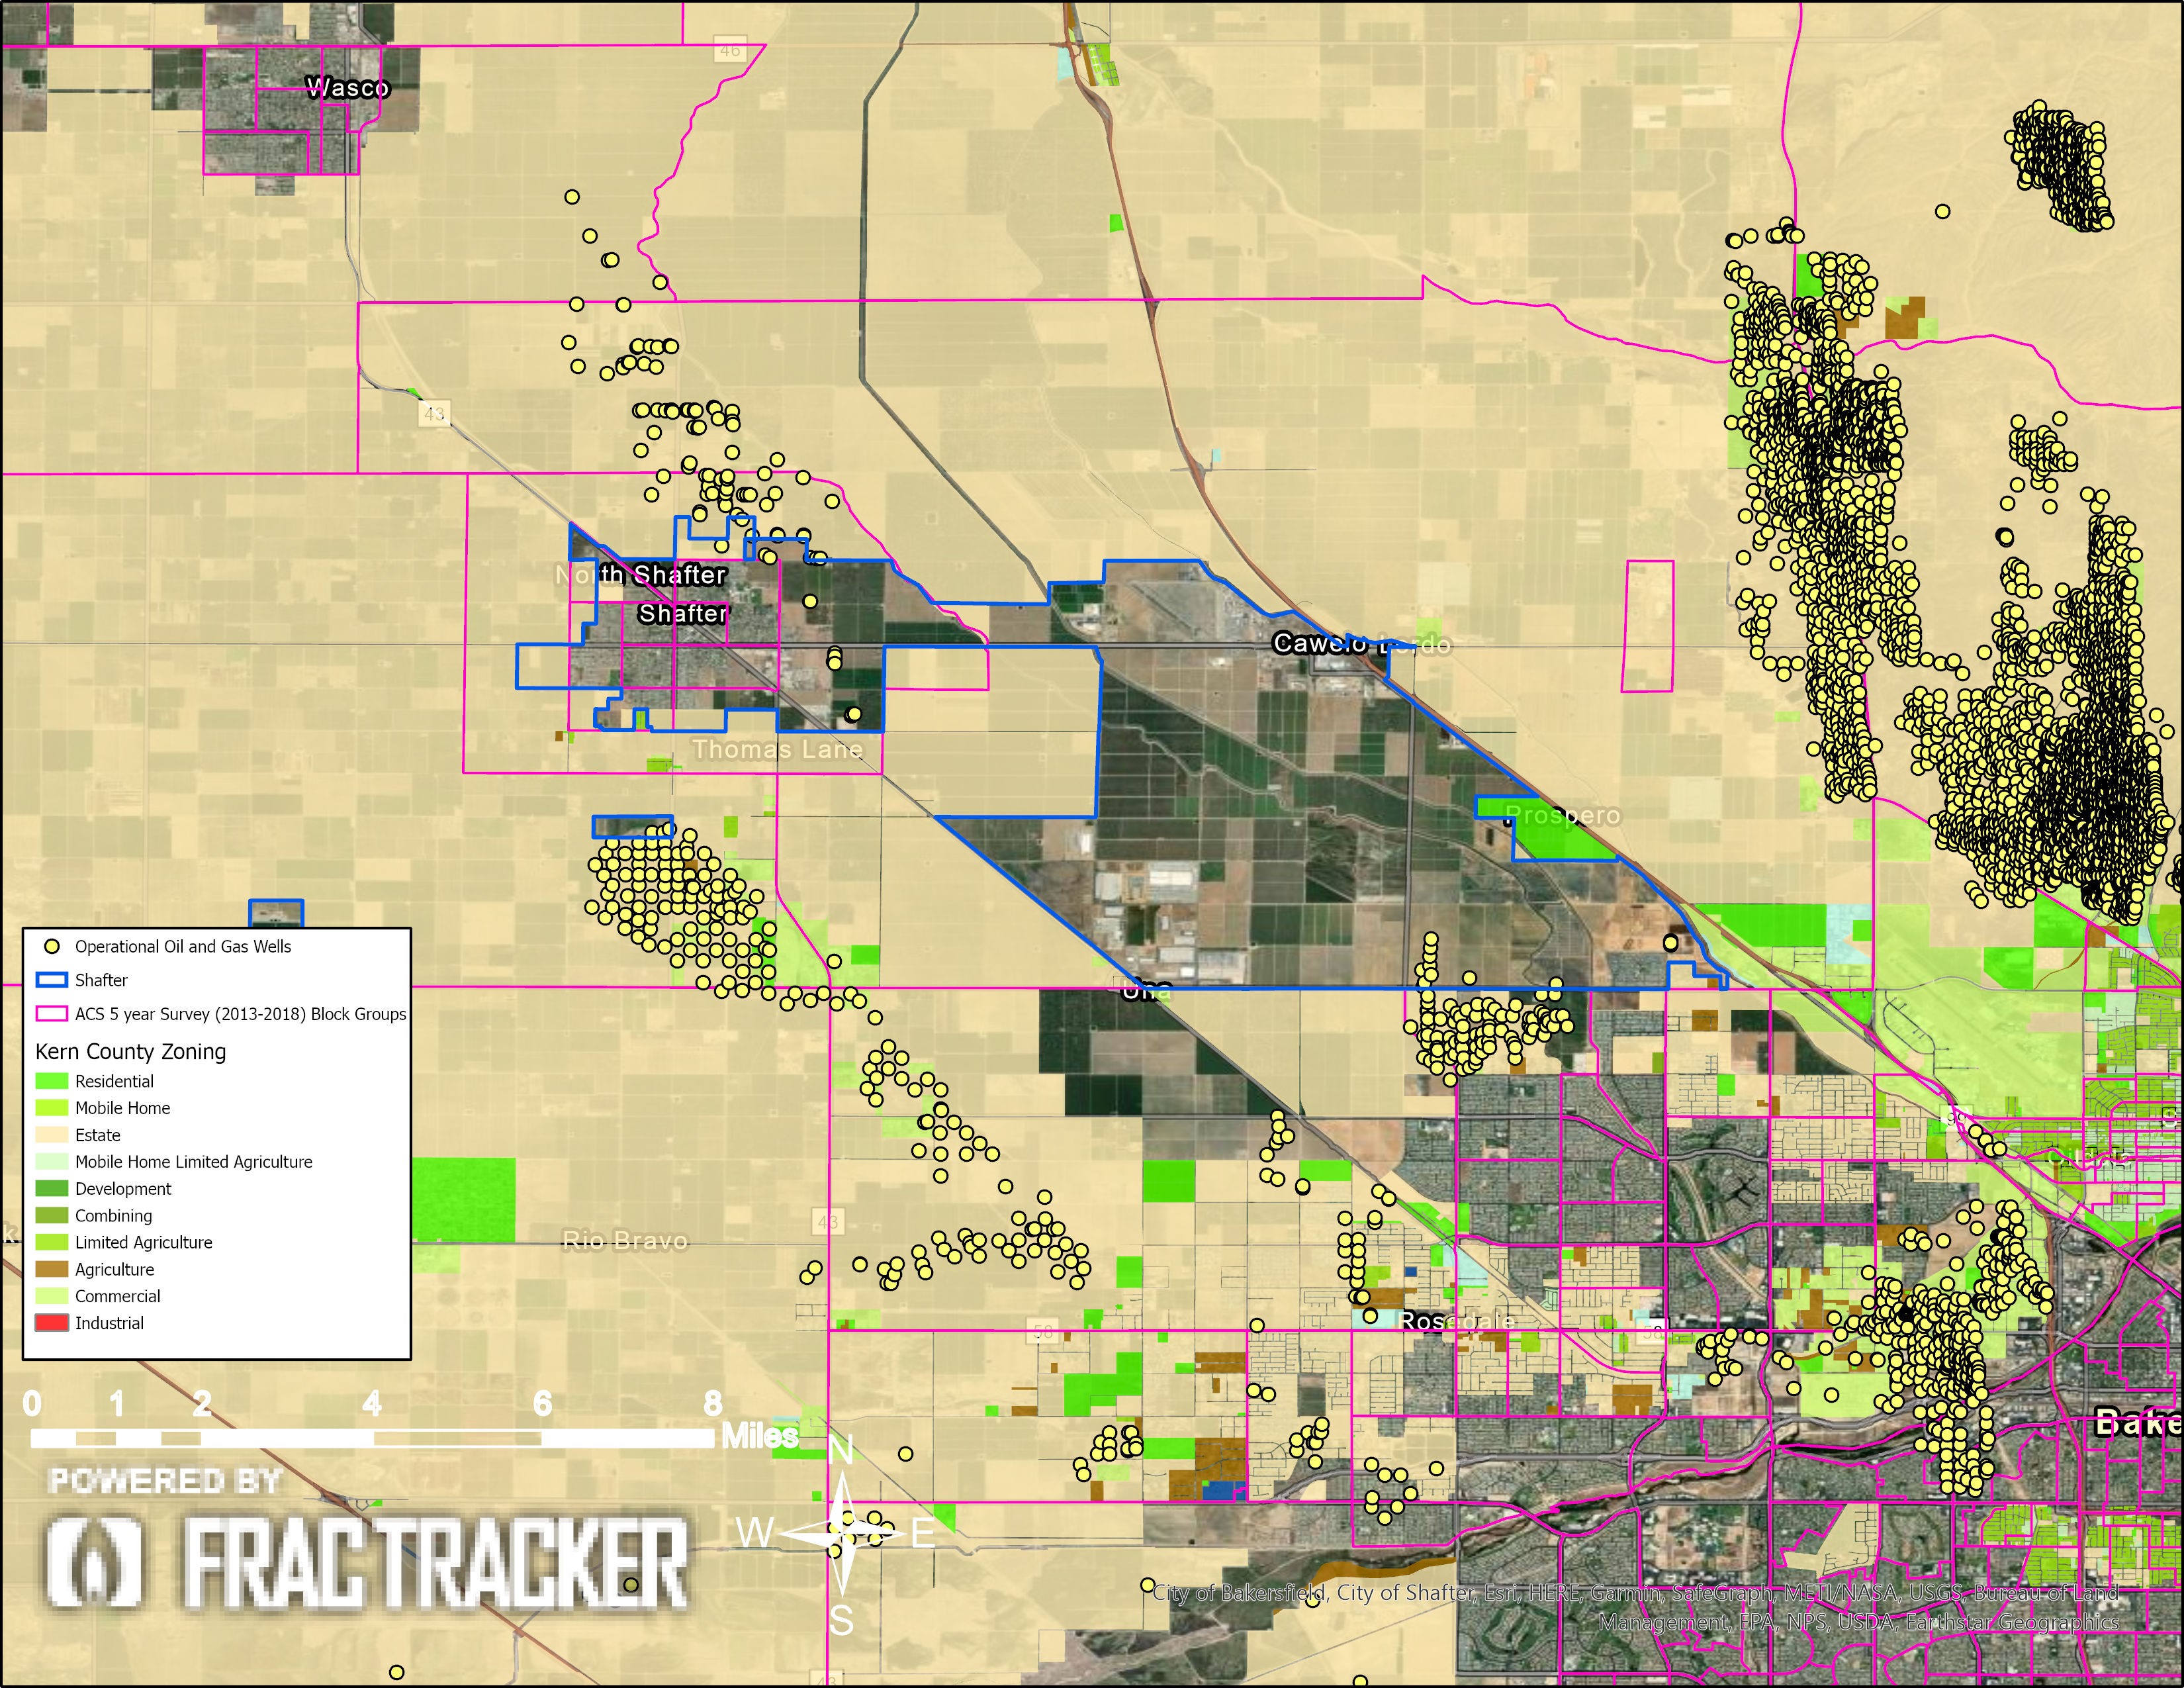

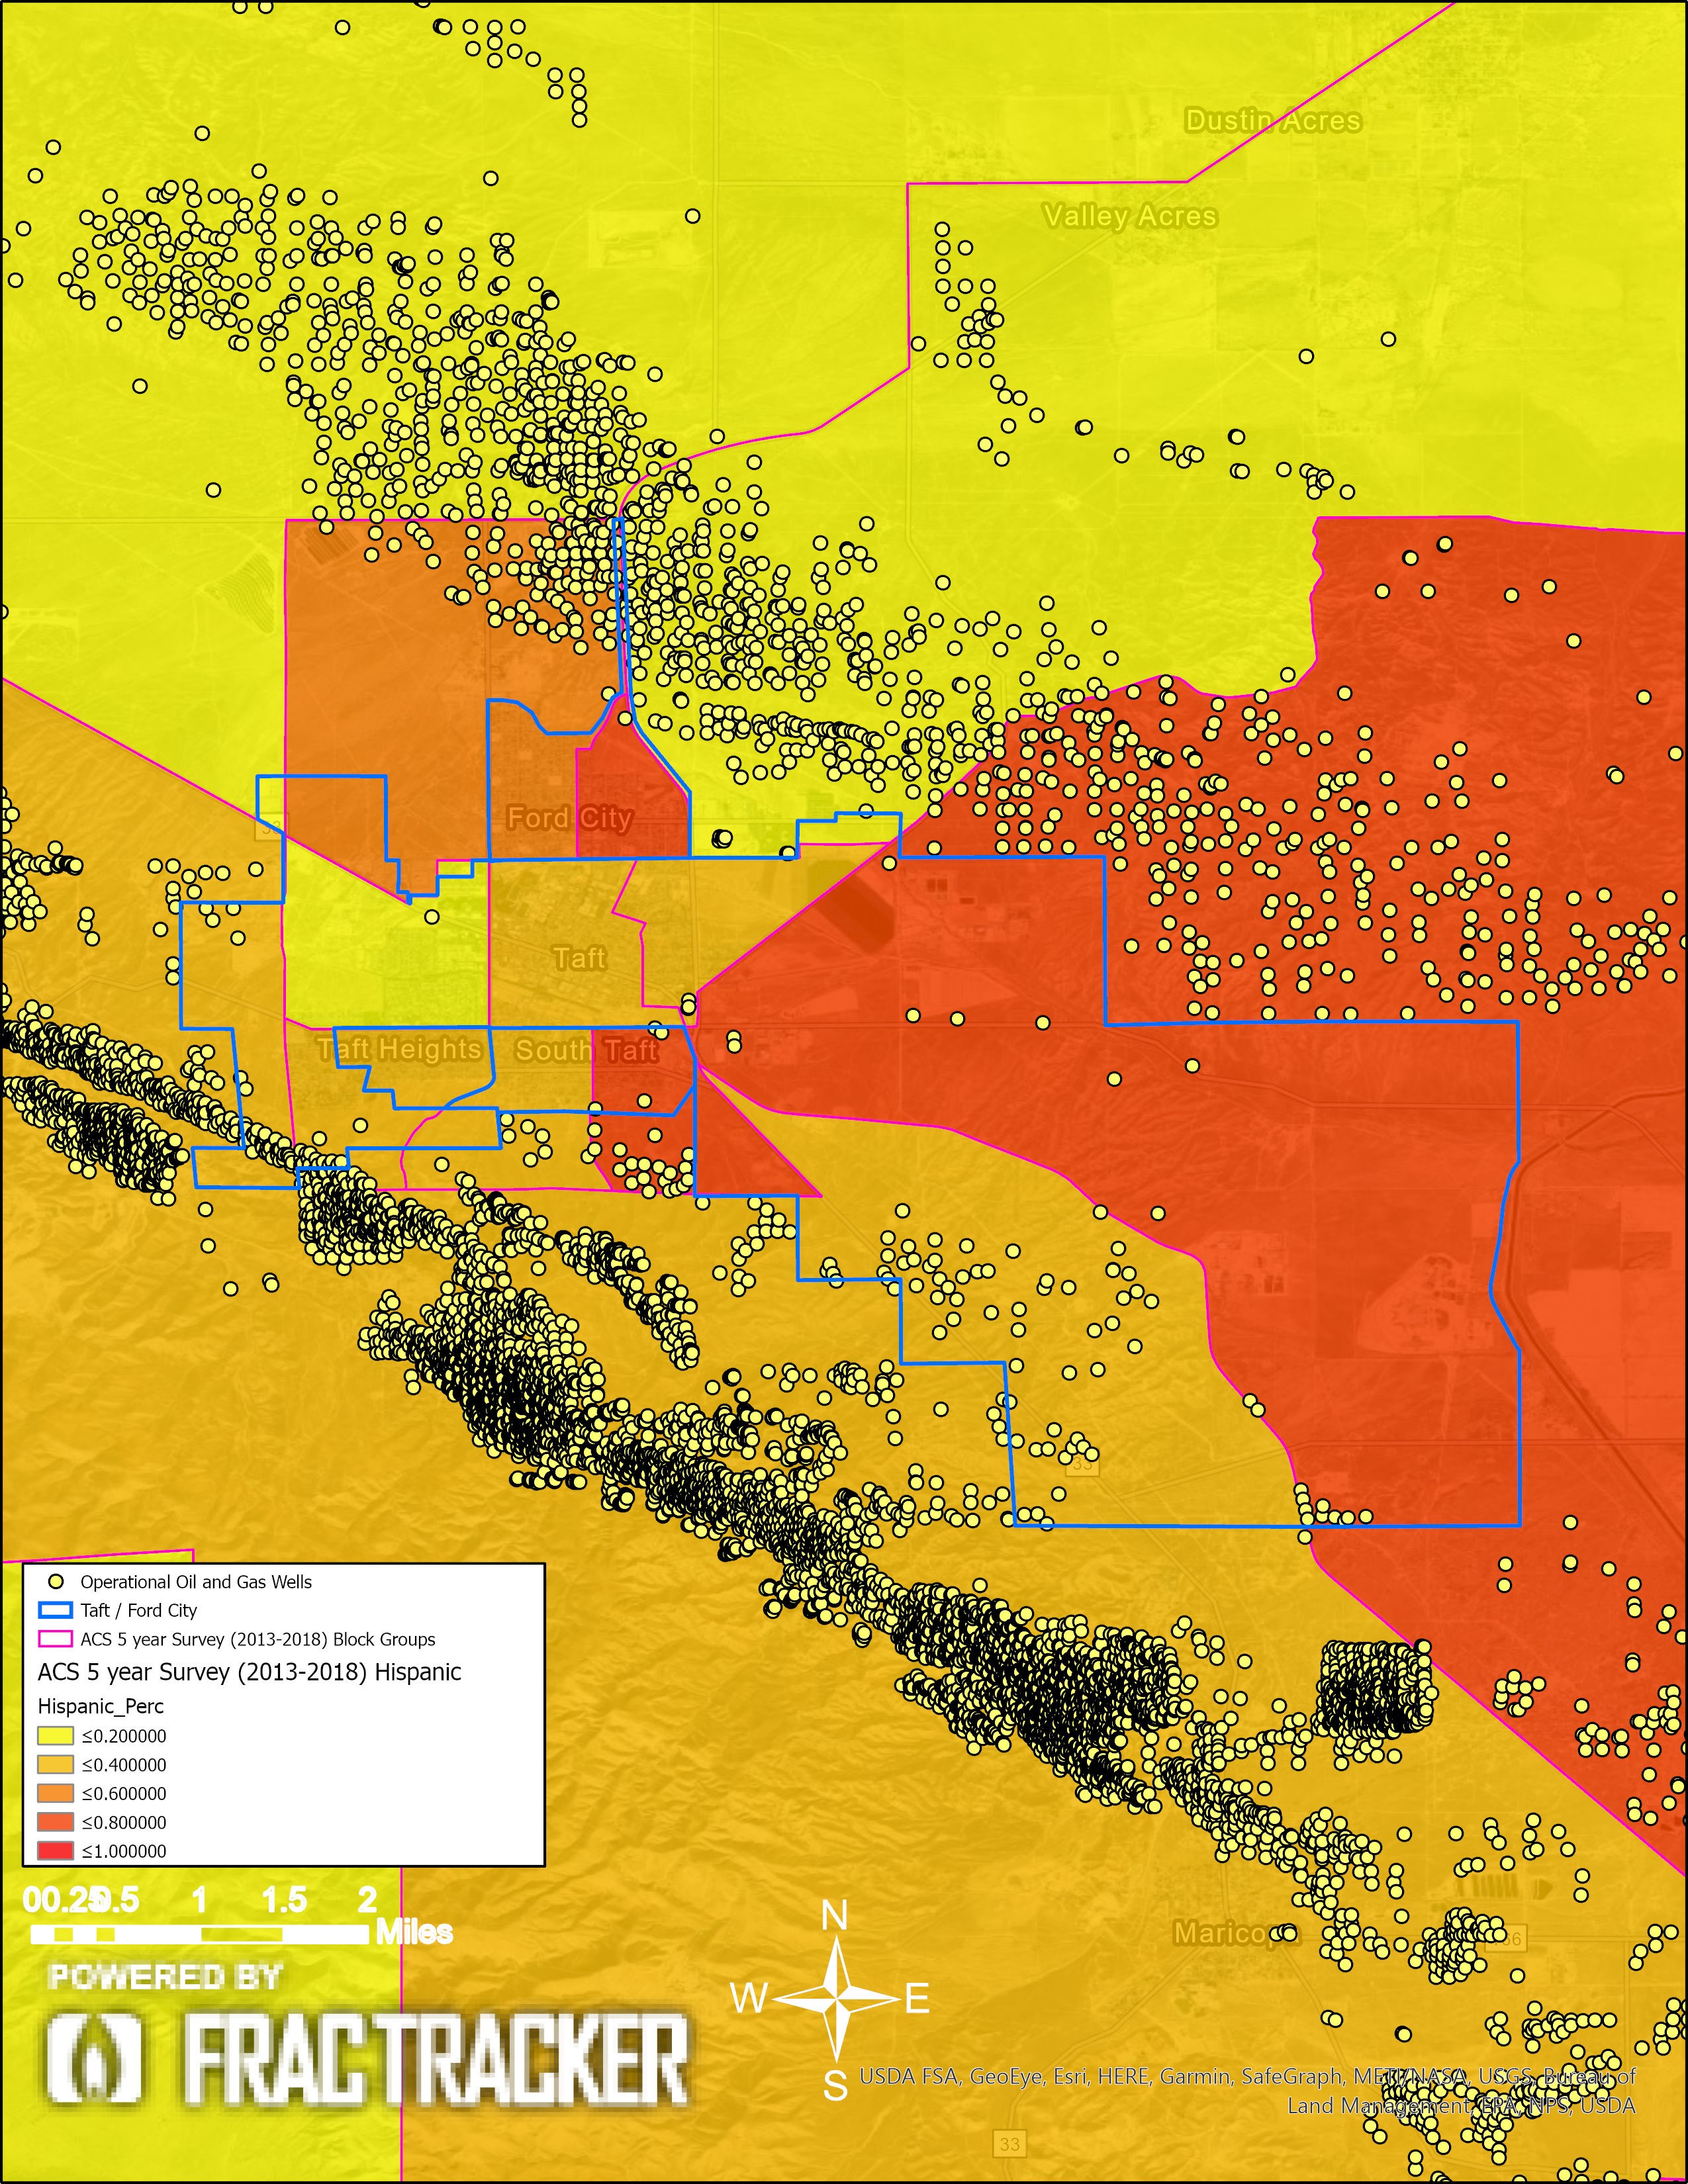
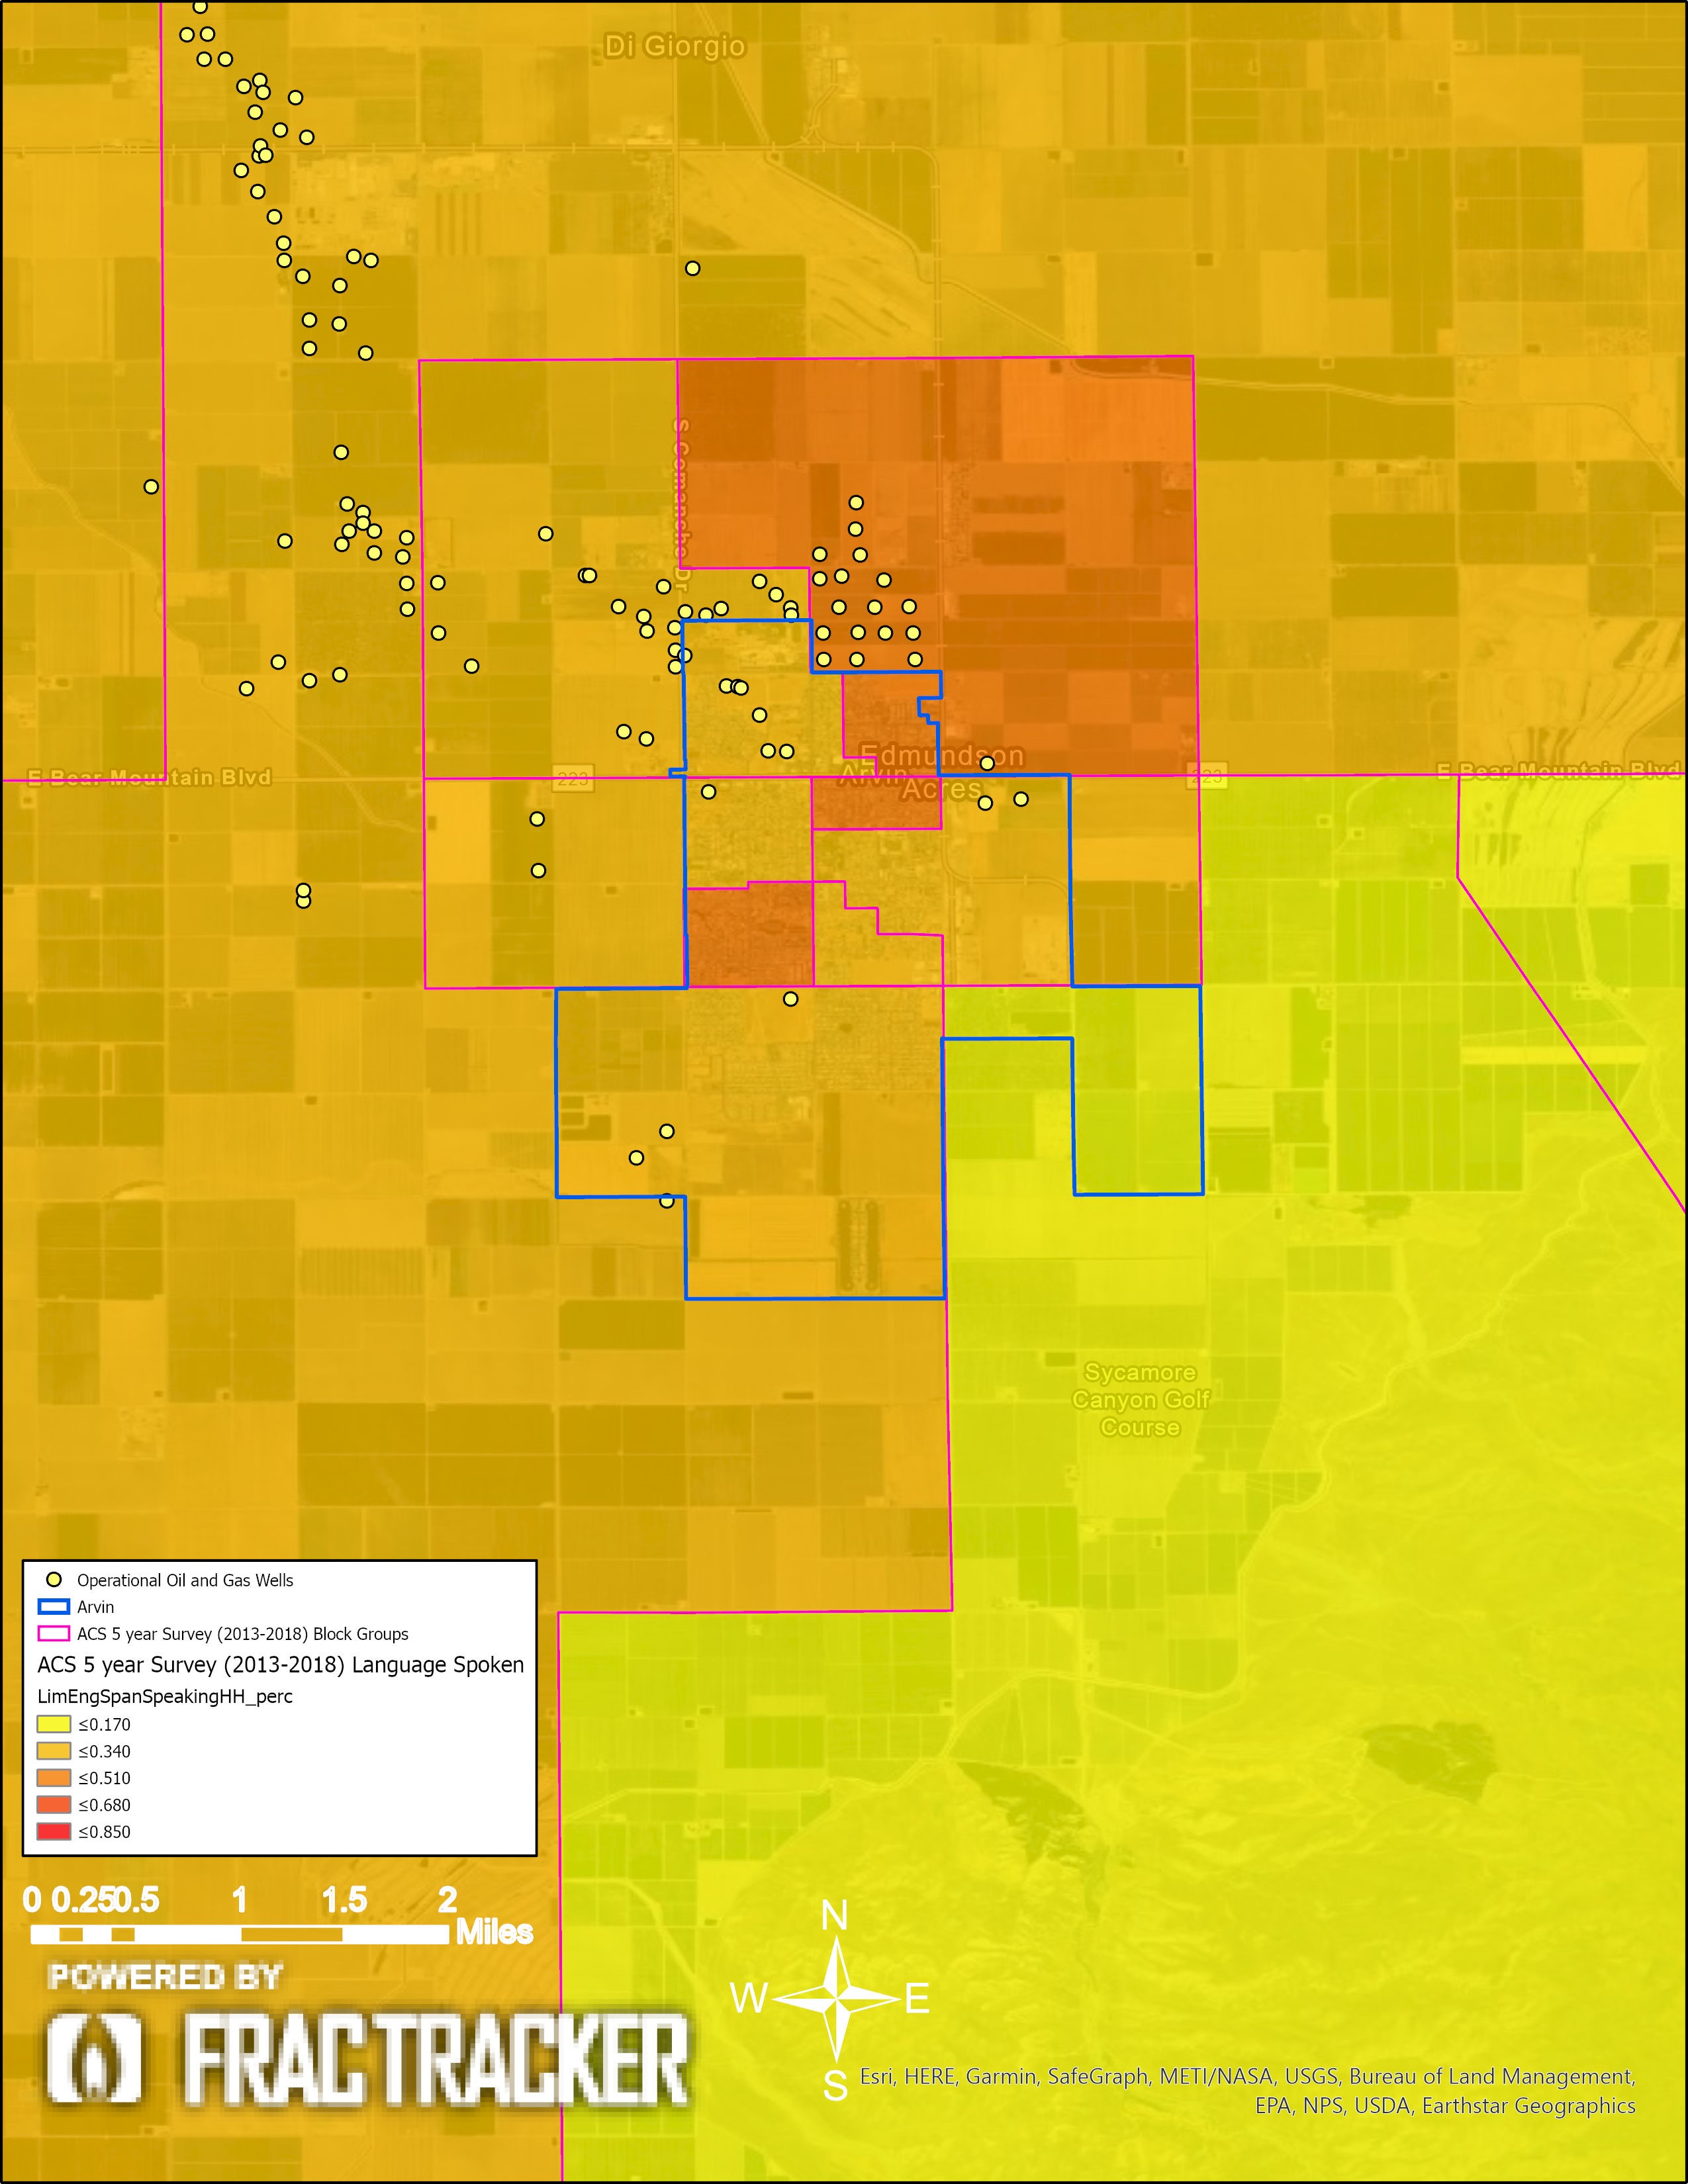
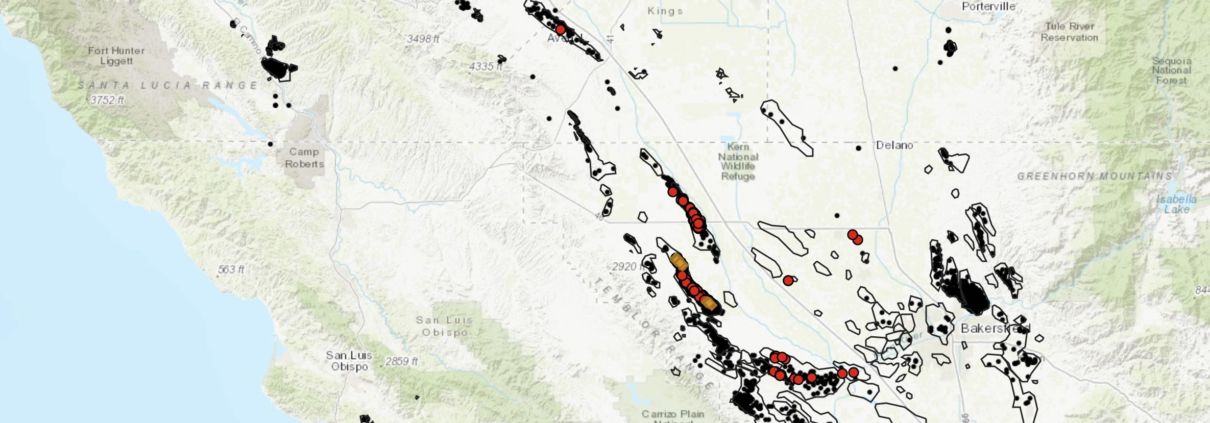
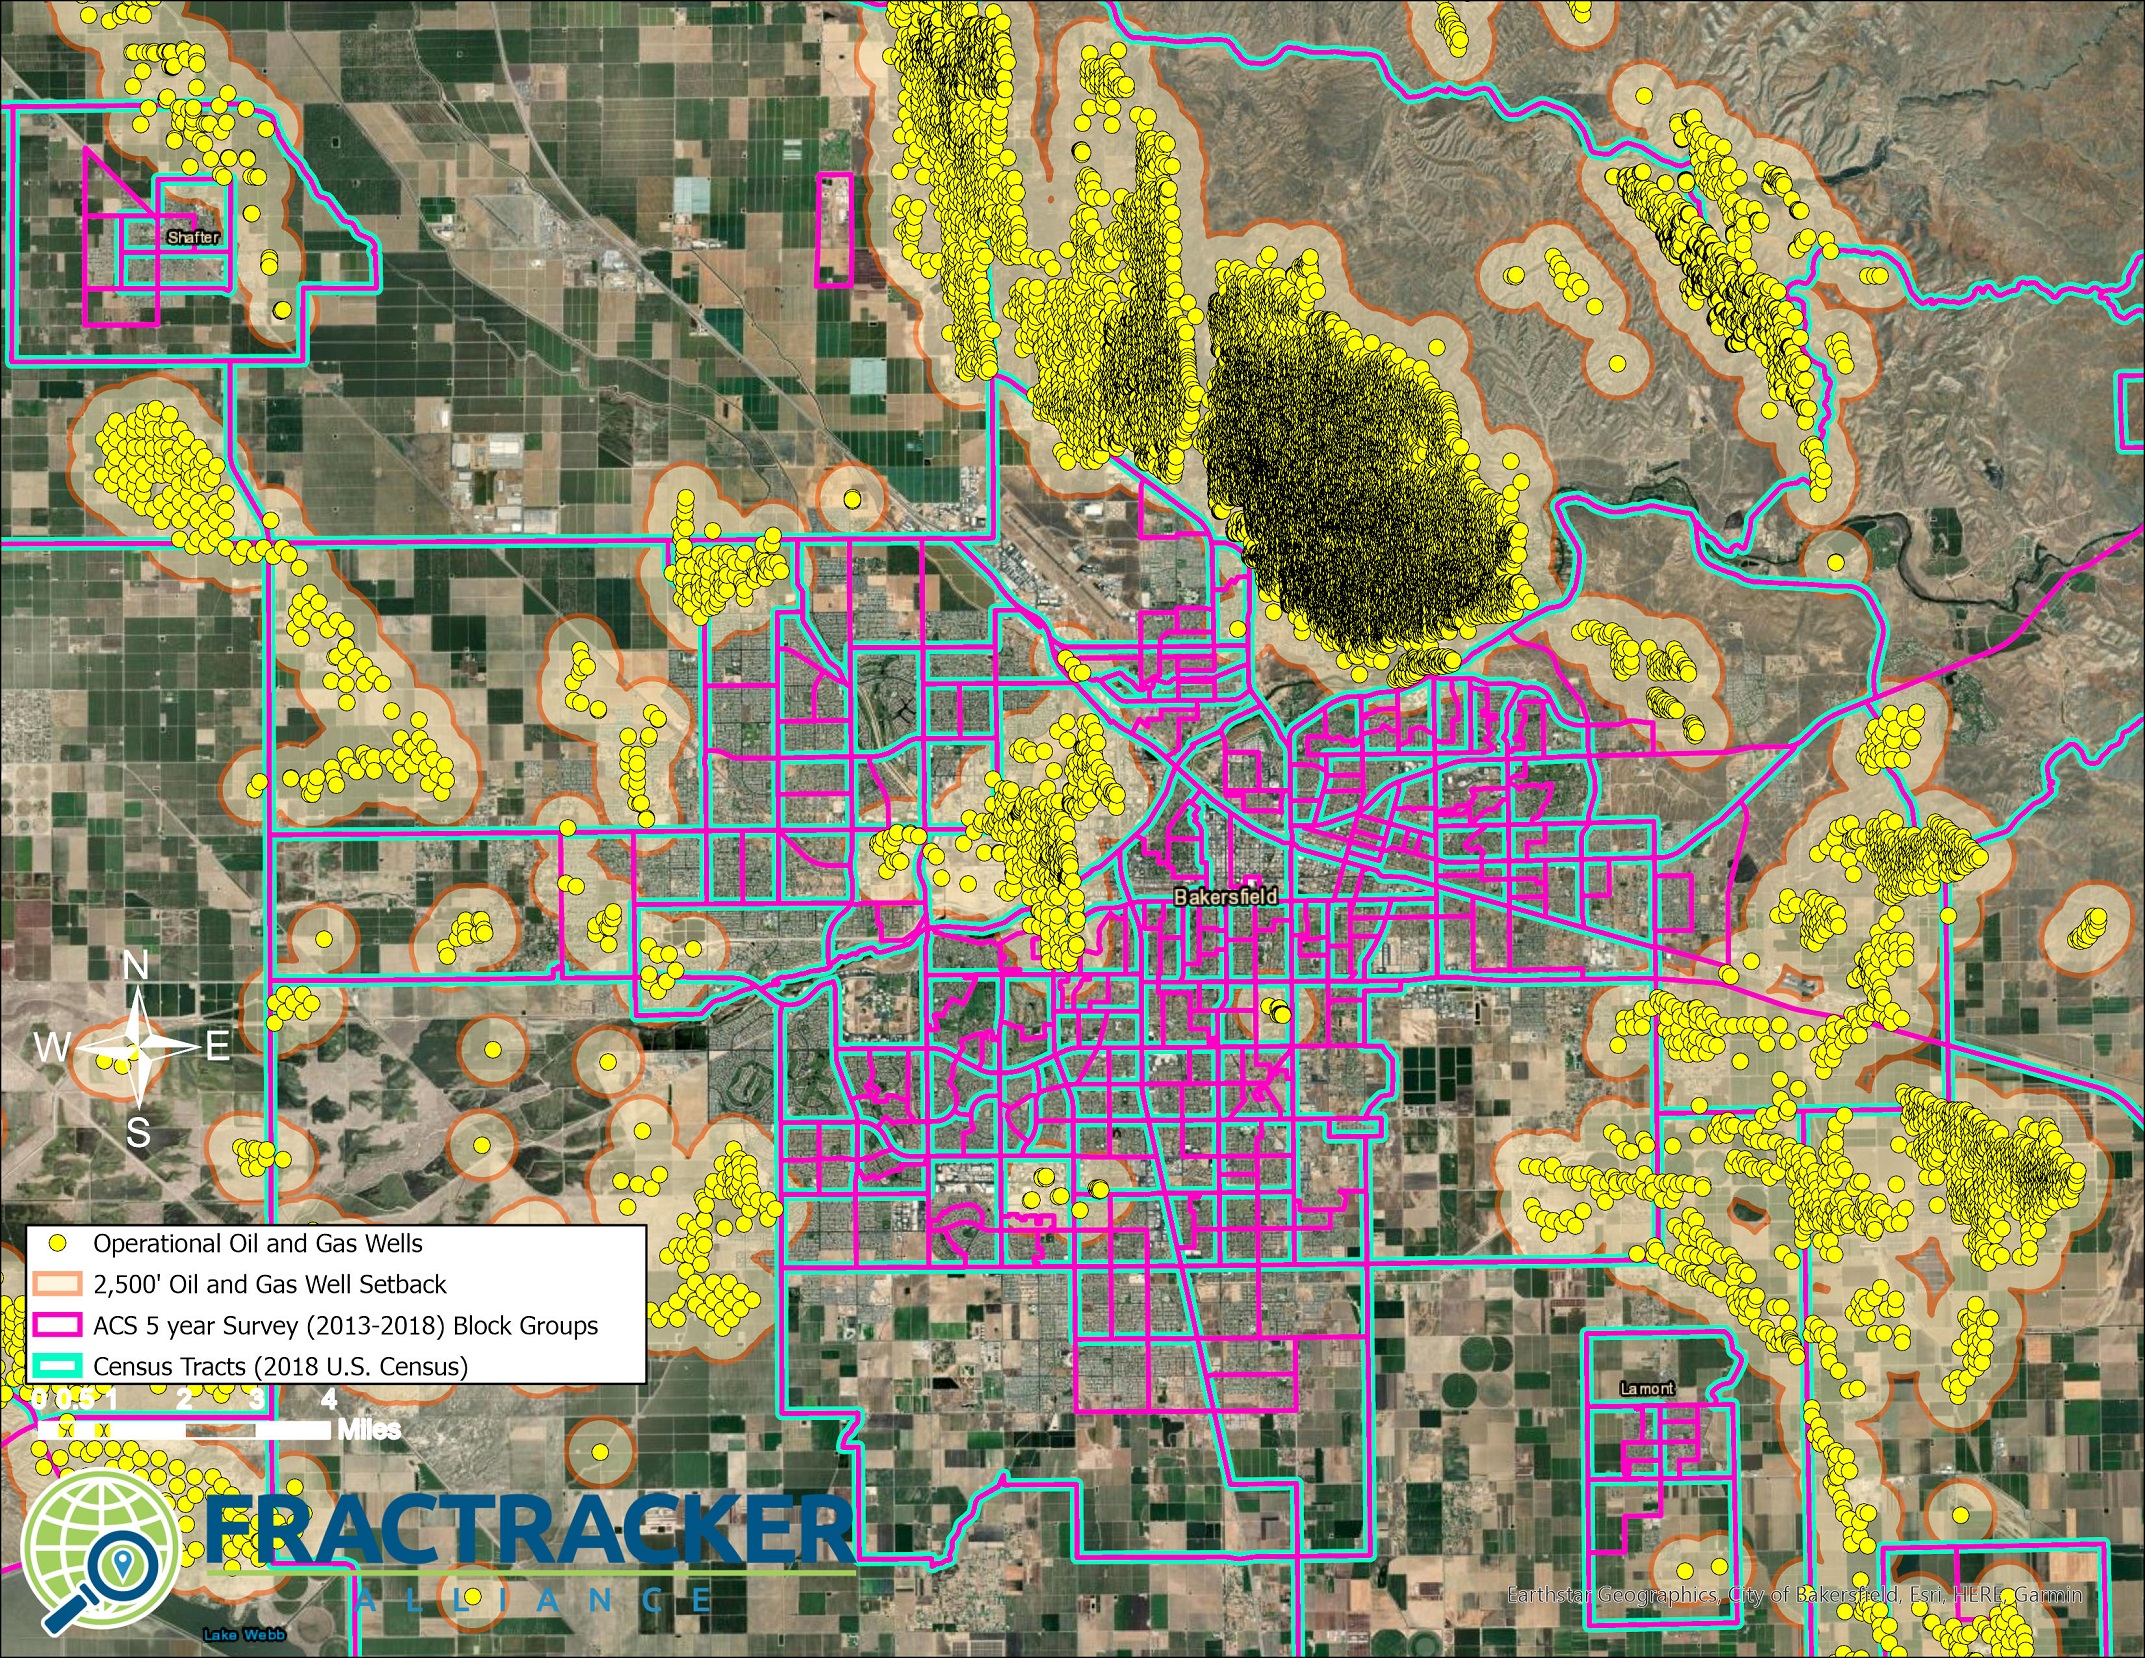
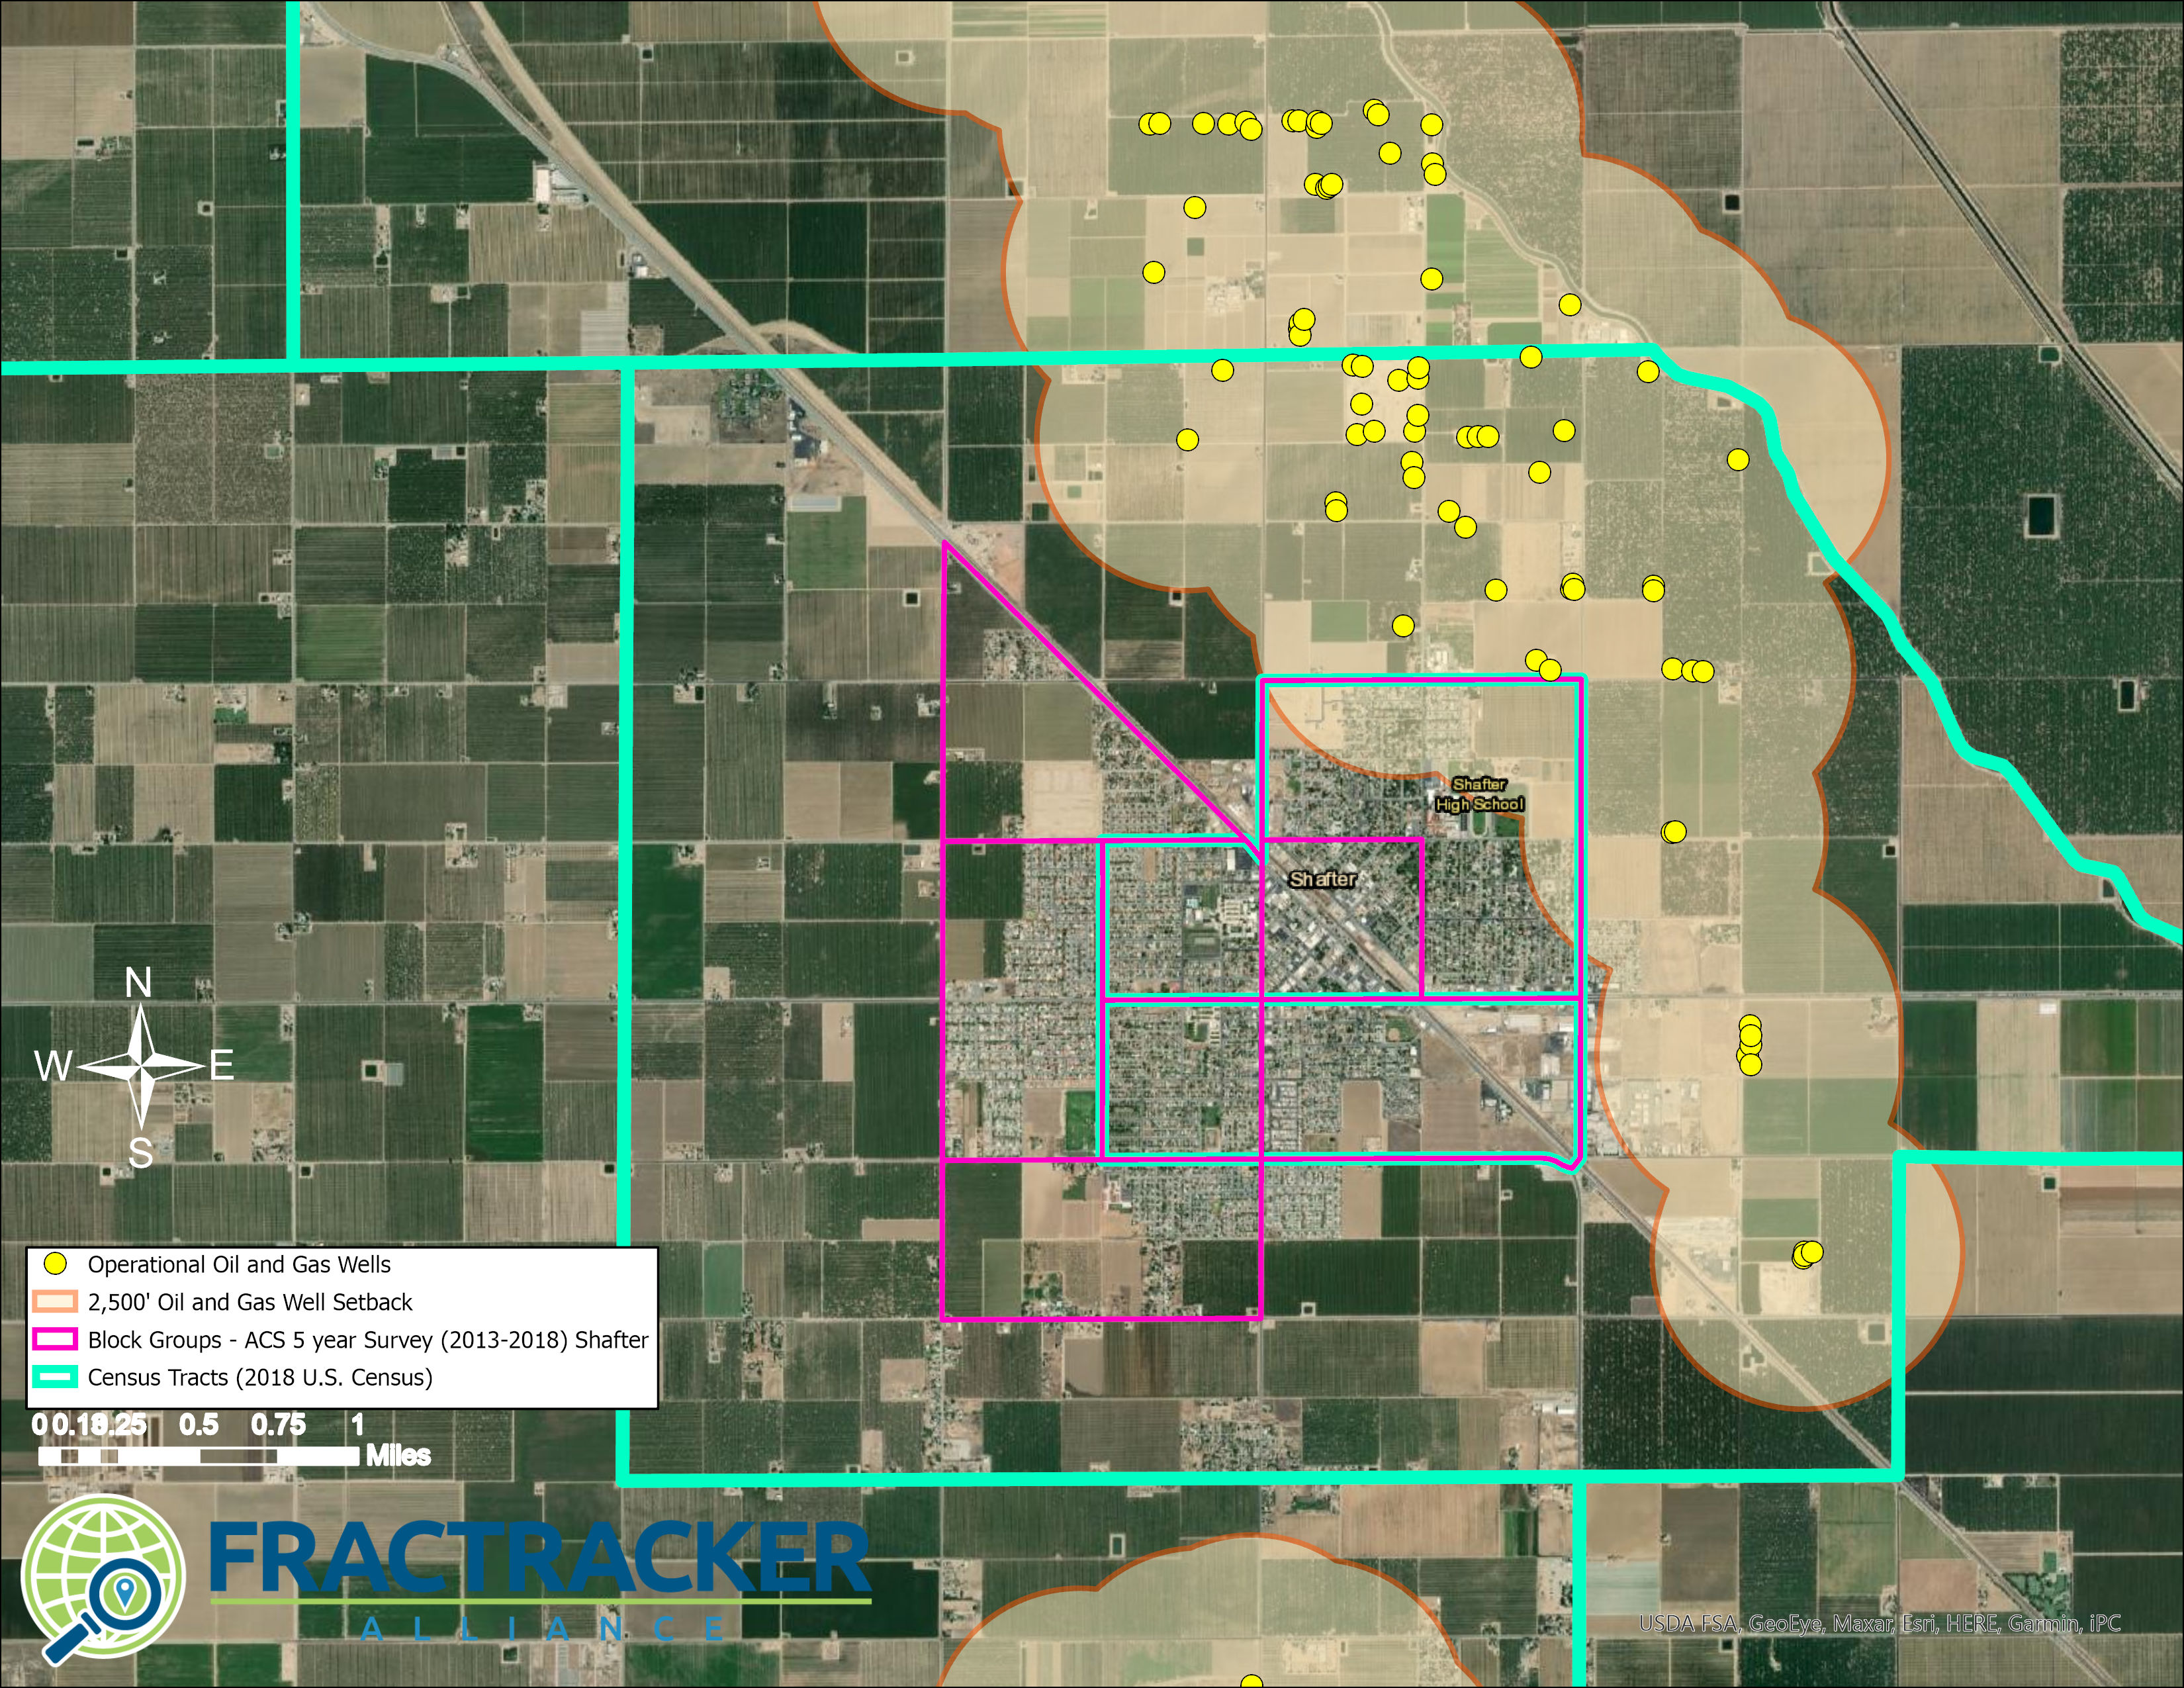
 Map A2. Shafter Census Designated Areas. The map shows the city of Shafter and includes both census tracts and census block groups for comparison. It shows operational oil and gas wells in the map, along with 2,500’ buffers. This Frontline Community would not be included in an analysis that only considers census tracts containing Tier 1 areas negatively impacted by oil and gas extraction operations. The census tract containing the North Shafter oil field forms a donut around the city of Shafter.
 Ted Auch, FracTracker Alliance
 Image courtesy of Lois Bower-Bjornson from the Clean Air Council.