Updated 8/2/17: An analysis by FracTracker and the Clean Air Council finds that approximately 202,000 gallons of drilling fluids have been accidentally released in 90 different spill events while constructing the Mariner East 2 pipeline in Pennsylvania. In a more recent update, FracTracker estimates these occurred at 42 distinct locations. Explore the map of these incidents below, which we have updated to reflect this growing total.
Last week, a judge with the PA Environmental Hearing Board granted a two week halt to horizontal directional drilling (HDD) operations pertaining to the construction of Sunoco Logistics’ Mariner East 2 (ME2) pipeline. The temporary injunction responds to a petition from the Clean Air Council, Mountain Watershed Association, and the Delaware Riverkeeper Network. It remains in effect until a full hearing on the petition occurs on August 7-9, 2017.
ME2 is a 350-mile long pipeline that, when complete, will carry 275,000 barrels of propane, ethane, butane, and other hydrocarbons per day from the shale gas fields of Western Pennsylvania to a petrochemical export terminal located on the Delaware River.
The petition relates to a complaint filed by the three groups detailing as many as 90 “inadvertent returns” (IRs) of drilling fluids and other drilling related spills along ME2’s construction route. IRs refer to incidents that occur during HDD operations in which drilling fluids consisting of water, bentonite clay, and some chemical mixtures used to lubricate the drill bit, come to the surface in unintended places. This can occur due to misdirected drilling, unanticipated underground fissures, or equipment failure.
What is Horizontal Directional Drilling?
An illustration of an “ideal” horizontal directional drilling boring operation is seen in the first graphic below (image source). The second image shows what happens when HDDs go wrong (image source).
Mapping Inadvertent Returns
The Pennsylvania Department of Environmental Protection (DEP) posted information on potential regulatory violations associated with these IRs on the PA Pipeline Portal website on July 24, 2017. This original file listed 49 spill locations. Our original map was based on those locations. As part of their legal filing, volunteer at the Clean Air Council (CAC) have parsed through DEP documents to discover 90 unique spills at these and other locations. On July 31, 2017, the DEP posted a new file that now lists 61 spills, which account for some of these discrepancies but not all.
Working with the CAC, we have created a map, seen below, of the 90 known IRs listed in the DEP documents and from CAC’s findings. Also on the map are the locations of all of ME2’s HDD boring locations, pumping stations, and workspaces, as well as all the streams, ponds, and wetlands listed in Sunoco’s permits as implicated in the project’s construction (see our prior article on ME2’s watershed implications here). Open the map full-screen to see many of these features and their more detailed information.
From our analysis, we find that, conservatively, more than 202,000 gallons of drilling fluids have been accidentally released while constructing the Mariner East 2 pipeline in Pennsylvania since the first documented incident on May 3rd. We say conservatively because a number of incidents are still under investigation. In a few instances we may never know the full volume of the spills as only a fraction of the total drilling muds lost were recovered.
We analyzed where these 90 spills occurred relative to known HDD sites and estimate that there are 38 HDDs implicated in these accidents. An additional 11 spills were found at sites where the DEP’s data shows no HDDs, so we calculate the total number of “spill locations” at 42. A full breakdown by county and known gallons spilled at these locations is seen below.
County
Number of IRs/Spills
Gallons Spilled
Allegheny
4
2,050
Berks
3
540
Blair
3
2,400
Chester
4
205
Cumberland
32
162,330
Delaware
8
2,380
Huntingdon
1
300
Lancaster
7
5945
Lebanon
1
300
Washington
9
4,255
Westmoreland
17
21,532
York
1
25
Total
90
202,262
A few important notes on our methods and the available data we have to work with:
CAC obtained spills from DEP incident reports, inadvertent return reports, and other documents describing spills of drilling fluid that have occurred during Mariner East 2 construction. Those documents reflected incidents occurring between April 25, 2017 and June 17, 2017. In reviewing these documents, volunteers identified 61 discrete spills of drilling fluid, many of which happened at similar locations. Unfortunately, separate coordinates and volumes were not provided for each spill.
When coordinates were not provided, approximate locations of spills were assigned where appropriate, based on descriptions in the documentation. Two IRs have no known location information whatsoever. As such, they are not represented on the map.
Spill volumes were reported as ranges when there was inconsistency in documentation regarding the same spill. The map circles represent the high-end estimates within these ranges. Of the 90 known spills, 29 have no volume data. These are represented on the map, but with a volume estimate of zero until more information is available.
All documentation available to CAC regarding these spills was filed with the Environmental Hearing Board on July 19, 2017. DEP subsequently posted a table of inadvertent returns on its website on July 24, 2017. Some of those spills were the same as ones already identified in documents CAC had reviewed, but 29 of the spills described on the DEP website were ones for which CCAC had never received documentation, although a subset of these are now listed in brief in the DEP spreadsheet posted on July 31, 2017. In total then, the documentation provided to CAC from DEP and spreadsheets on the DEP website describe at least 90 spills.
HDD Implications
The DEP’s press release assures the public that the drilling fluids are non-toxic and the IRs are “not expected to have any lasting effects on impacted waters of the commonwealth.” But this is not entirely the case. While the fluids themselves are not necessarily a public health threat, the release of drilling fluids into aquifers and drinking wells can make water unusable. This occurred in June in Chester County, for example.
More commonly, drilling fluid sediment in waterways can kill aquatic life due to the fine particulates associated with bentonite clay. Given that HDD is primarily used to lay pipe under streams, rivers, and ponds (as well as roads, parks, and other sensitive areas), this latter risk is a real concern. Such incidents have occurred in many of the instances cited in the DEP documents, including a release of drilling muds into a creek in Delaware County in May.
We hope the above map and summaries provide insights into the current risks associated with the project and levels of appropriate regulatory oversight, as well as for understanding the impacts associated with HDD, as it is often considered a benign aspect of pipeline construction.
By Kirk Jalbert, Manager of Community Based Research and Engagement, FracTracker Alliance
If you have any questions about the map on this page or the data used to create it, please contact Kirk Jalbert at jalbert@fractracker.org.
https://www.fractracker.org/a5ej20sjfwe/wp-content/uploads/2017/07/ME2-Returns-Feature.jpg400900FracTracker Alliancehttps://www.fractracker.org/a5ej20sjfwe/wp-content/uploads/2025/09/2025-Wordmark-Logo.pngFracTracker Alliance2017-07-26 11:49:282021-04-15 15:02:38Mariner East 2 Drilling Fluid Spills – Updated Map and Analysis
Given recent concerns about underground natural gas storage wells (UGS), FracTracker mapped UGS wells and fields in Colorado, as well as midstream transmission pipelines of natural gas that transport the gas from well sites to facilities for processing. Results show that 6,673 Colorado residents in 2,607 households live within a 2.5 mile evacuation radius of a UGS well. Additionally, the UGS fields with the largest number of “single-point-of-failure” high-risk storage wells are also the two fields in Colorado nearest communities.
Worst Case Scenario
A house exploding from a natural gas leak sounds straight out of a 19th century period drama, but this tragedy just recently occurred in Firestone, Colorado. How could this happen in 2017? We have seen pictures and read reports of blowouts and explosions at well sites, and know of the fight against big oil and natural gas pipelines across the country. At the same time we take for granted the natural gas range that heats our food to feed our families. The risk of harm is seemingly far removed from our stove tops, although it may be much closer to home than we think – There are documented occupational hazards and compartmentalized risks in moving natural gas off site.
Natural gas is an explosive substance, yet the collection of the gas from well sites remains largely industry-regulated. Unfortunately, it has become clear that production states like Colorado are not able to provide oversight, much less know where small pipelines are even located. This is particularly dangerous, since the natural gas in its native state is ordorless, colorless, and tasteless. Flowing in the pipelines between well sites and processing stations, natural gas does not contain the mercaptan that gives commercial natural gas its tell-tale odor. In fact, much of the natural gas or “product” is merely lost to the atmosphere, or much worse, can collect in closed spaces and reach explosive levels. This means that high, potentially explosive levels of methane may go undetected until far too late.
Mapping Flow Lines
As a result of the house explosion in Firestone on April 17th CO regulators are now requiring oil and gas operators to report the location of their collection flow pipelines, as shown in Figure 1.
The locations of the collection of pipeline “flowlines”, like the uncapped pipeline that caused the house explosion in Firestone, have been mapped by FracTracker Alliance (above). The dataset is not complete, as not all operators complied with the reporting deadline set by the COGCC. For residents living in the midst of Colorado’s oil and gas production zones, addresses can be typed into the search bar in the upper left corner of the map. Users can see if their homes are located near or on top of these pipelines. The original mapping was done by Inside Energy’s Jordan Wirfs-Brock.
Underground Storage
When natural gas is mixed with mercaptan and ready for market, operators and utility companies store the product in UGS fields. (EDIT – Research shows that in most cases natural gas in UGS fields is not yet mixed with mercaptan. Therefore leaks may go undetected more easily. Aliso Canyon was a unique case where the gas was being stored AFTER being mixed with mercaptan. Odorization is not legally required until gas moves across state lines in an interstate pipeline or is piped into transmission lines for commercial distribution.) In August 2016, a natural gas storage well at the SoCal Gas Aliso Canyon natural gas storage field failed causing the largest methane leak in U.S. history. The Porter Ranch community experienced health impacts including nosebleeds, migraines, respiratory and other such symptoms. Thousands of residents were evacuated. While Aliso Canyon was the largest leak, it was by no means a unique case.
FracTracker has mapped the underground natural gas storage facilities in Colorado, and the wells that service the facilities. As can be seen below, there are 10 storage fields in Colorado, and an 11th one is planned. All the fields used for storage in Colorado are previously depleted oil and gas production fields. The majority of storage wells used to be production wells. All sites are shown in the map below (Figure 2).
Figure 2. Map of Natural Gas Underground Storage Facilities
Our analysis of Colorado natural gas storage facilities shows that 6,673 Colorado residents living in 2,607 households live within a 2.5 mile evacuation radius of a UGS well. The majority of those Coloradans (5,422) live in Morgan County, with 2,438 in or near the city of Fort Morgan. The city of Fort Morgan is surrounded by the Young Gas Storage Facility with a working capacity of 5,790,049 MCF and Colorado Interstate Gas Company with a working capacity of 8,496,000 MCF.
By comparison, the failure in Aliso Canyon leaked up to 5,659,000 MCF. A leak at either of these facilities could, therefore, result in a similar or larger release.
UGS Well Risk Assessment
A FracTracker co-founder and colleague at Harvard University recently completed a risk assessment of underground natural gas storage wells across the U.S. The analysis identified the storage wells shown in the map above (Figure 1) and defined a number of “design deficiencies” in wells, including “single-point-of-failure” designs that make the wells vulnerable to leaks and failures. Results showed that 2,715 of the total 14,138 active UGS wells across the country were constructed using similar techniques as the Aliso Canyon failed well.
Applying this assessment to the wells in Colorado, FracTracker finds the following:
There are a total of 357 UGS wells in Colorado.
220 of which are currently active.
Of those 220 UGS wells, they were all drilled between 1949 and 1970.
43 of the UGS wells are repurposed production wells.
40 of those repurposed wells are the highest risk single barrier wells.
Specifically focusing on the UGS fields surrounding the city of Fort Morgan:
21 single barrier wells are located in the Flank field 2.5 miles North of the city.
13 single barrier wells are located in the Fort Morgan field 2.5 miles South of the city.
We originally asked how something as terrible as Firestone could have occurred. Collectively we all want to believe this was an isolated incident. Sadly, the data suggest the risk is higher than originally thought: The fields with the largest number of “single-point-of-failure” high-risk UGS wells are also the two fields in Colorado nearest communities. While the incident in Firestone is certainly heartbreaking, we hope regulators and operators can use the information in this analysis to avoid future catastrophes.
By Kyle Ferrar, Western Program Coordinator, FracTracker Alliance
Feature Image: Heavy equipment moves debris from the site of a house explosion April 17, 2017 in Firestone, Colorado, which killed two people. (David Kelly / For The Times)
https://www.fractracker.org/a5ej20sjfwe/wp-content/uploads/2017/07/firestone_DavidKelly_Forthetimes_re.jpg400900Kyle Ferrar, MPHhttps://www.fractracker.org/a5ej20sjfwe/wp-content/uploads/2025/09/2025-Wordmark-Logo.pngKyle Ferrar, MPH2017-07-20 12:57:302021-04-15 15:02:39Risks from Colorado’s Natural Gas Storage and Transmission Systems
Recently, the Pennsylvania Department of Environmental Protection (DEP) started to offer additional data resources with the introduction of the Open Data Portal. This development, along with the continued evolution of the ArcGIS Online mapping platform that we utilize has enabled some recent enhancements in our mapping of Pennsylvania oil and gas infrastructure. We’ve made changes to the existing Pennsylvania Shale Viewer for unconventional wells, and created a Conventional and Historical Wells in Pennsylvania map.
Unconventional Wells
Rather than defining the newer, industrial-scaled oil and gas wells by specific geological formations, configuration of the well, or the amount of fluid injected into the ground during the hydraulic fracturing process, Pennsylvania’s primary classification is based on whether or not they are considered to be unconventional.
Unconventional Wells – An unconventional gas well is a bore hole drilled or being drilled for the purpose of or to be used for the production of natural gas from an unconventional formation. An unconventional formation is defined as a geologic shale formation below the base of the Elk Sandstone or its geologic equivalent where natural gas generally cannot be produced except by horizontal or vertical well bores stimulated by hydraulic fracturing.
The previous structure of the PA Shale Viewer had separate layers for permits, drilled wells, and violations. This version replaces the first two layers with a single layer of unconventional locations, which we have called “Unconventional Wells and Permits” for the sake of clarity. The violations layer appears in the same format as before. When users are zoomed out, they will see generalized layers showing the overall location of O&G infrastructure and violations in the state, which were formed by creating a one mile buffer around these features. As users zoom in, the generalized layers are then replaced with point data showing the specific wells and violations. At this point, users can click on individual points and learn more about the features they see on the map.
Figure 1. PA Shale Viewer zoomed in to see individual wells by status
O&G locations are displayed by their well status, as of the time that FracTracker processed the data, including: Abandoned, Active, Operator Reported Not Drilled, Plugged OG Well, Proposed but Never Materialized, and Regulatory Inactive Status. Note that just because a well is classified as Active does not mean that it has been drilled, or even necessarily permitted. These milestones, along with whether or not it has been plugged, can be determined by looking for entries in the permit issue date, spud date, and plug date entries in the well’s popup box.
Conventional and Historical Wells
The map below shows known conventional wells in Pennsylvania along with additional well locations that were digitized from historical mining maps.
Although there are over 19,000 unconventional oil and gas locations in Pennsylvania, this figure amounts to just 11% of the total number of wells in the state that the DEP has location data for, the rest being classified as conventional wells. Furthermore, in a state that has been drilling for oil and gas since before the Civil War, there could be up to 750,000 abandoned wells statewide.
The DEP has been able to find the location of over 30,000 of these historical wells by digitizing records from old paper mining maps. This layer has records for 16 different counties, but well over half of these wells are in just three counties – Allegheny, Butler, and Washington. It looks like it would take a lot more work to digitize these historical wells throughout the rest of the state, but even when that happens, we will probably still not know where the majority of the old oil and gas wells in the state are located.
In this forest fragmentation analysis, FracTracker looked at existing vegetation height in the northern portion of Pennsylvania’s Susquehanna River Basin. The vegetation height data is available from LANDFIRE, a resource used by multiple federal agencies to assess wildfire potential by categorizing the vegetation growth in 30 by 30 meter pixels into different categories. In the portion of Pennsylvania’s Susquehanna Basin where we looked, there were 29 total categories based on vegetation height. For ease of analysis, we have consolidated those into eight categories, including roads, developed land, forest, herbs, shrubs, crops, mines and quarries, and open water.
Methods
We compared the ratio of the total number of each pixel type to the type that was found at vertical and horizontal wells in the region. In this experiment, we hypothesized that we would see evidence of deforestation in the areas where oil and gas development is present. Per our correspondence with LANDFIRE staff, the vegetation height data represents a timeframe of about 2014, so in this analysis, we focused on active wells that were drilled prior to that date. We found that the pixels on which the horizontal wells were located had a significantly different profile type than the overall pixel distribution, whereas conventional wells had a more modest departure from the general characteristics of the region.
Figure 1 – Vegetation profile of the northern portion of Pennsylvania’s Susquehanna River Basin. The area is highly impacted by O&G development, a trend that is likely to continue in the coming years.
In Figure 1, we see that the land cover profile where vertical wells (n=6,198) are present is largely similar to the overall distribution of pixels for the entire study area (n=40,897,818). While these wells are more than six times more likely to be on areas classified as mines, quarries, or barren, it is surprising that the impact is not even more pronounced. In terms of forested land, there is essentially no change from the background, with both at about 73%. However, the profile for horizontal wells (n=3,787) is only 51% forested, as well as being four times more likely than the background to be categorized as herbs, which are defined in this dataset as having a vegetation height of around one meter.
Why Aren’t the Impacts Even More Pronounced?
While the impacts are significant, particularly for horizontal wells, it is a bit surprising that evidence of deforestation isn’t even more striking. We know, for example, that unconventional wells are usually drilled in multi-well pads that frequently exceed five acres of cleared land, so why aren’t these always classified as mines, quarries, and barren land, for example? There are several factors that can help to explain this discrepancy.
First, it must be noted that at 900 square meters, each pixel represents almost a quarter of acre, so the extent of these pixels will not always match with the area of disturbance. And in many cases, the infrastructure for older vertical wells is completely covered by the forest canopy, so that neither well pad nor access road is visible from satellite imagery.
The map above shows horizontal and vertical wells in a portion of Centre County, Pennsylvania, an area within our study region. Note that many of the vertical wells, represented by purple dots, appear to be in areas that are heavily forested, whereas all of the horizontal wells (yellow dots) are on a defined well pad in the lower right part of the frame. Panning around to other portions of Centre County, we find that vertical wells are often in a visible clearing, but are frequently near the edge, so that the chances of the 30 by 30 meter pixel that they fall into is much more likely to be whatever it would have been if the well pad were not there.
We must also consider that this dataset has some limitations. First of all, it was built to be a tool for wildfire management, not as a means to measure deforestation. Secondly, there are often impacts that are captured by the tool that were not exactly on the well site. For this reason, it would make sense to evaluate the area around the well pad in future versions of the analysis.
Figure 2 – A close up of a group of wells in the study area. Note that the disturbed land (light grey) does not always correspond exactly with the well locations.
In Figure 2, we see a number of light grey areas –representing quarries, strip mines, and gravel pits –with an O&G well just off to the side. Such wells did not get classified as being on deforested land in this analysis.
And finally, after clarifying the LANDFIRE metadata with US Forest Service personnel involved in the project, we learned that while the map does represent vegetation cover circa 2014, it is actually build on satellite data collected in 2001, which has subsequently been updated with a detailed algorithm. However, the project is just beginning a reboot of the project, using imagery from 2015 and 2016. This should lead to much more accurate analyses in the future.
Why Forest Fragmentation Matters
The clearing of forests for well pads, pipelines, access roads, and other O&G infrastructure that has happened to date in the Susquehanna Basin is only a small fraction of the planned development. The industry operates at full capacity, there could be tens of thousands of new unconventional wells drilled on thousands of well pads in the region through 2030, according to estimates by the Nature Conservancy. They have also calculated an average of 1.65 miles of gathering lines from the well pad to existing midstream infrastructure. With a typical right-of-way being 100 feet wide, these gathering lines would require clearing 20 acres. It isn’t unusual for the total disturbance for a single well pad and the associated access road to exceed ten acres, making the total disturbance about 30 acres per well pad. Based on the vegetation distribution of the region, we can expect that 22 of these acres, on average, are currently forested land. Taking all of these factors into consideration, a total disturbance of 100,000 to 200,000 acres in Pennsylvania’s Susquehanna River Basin due to oil and gas extraction, processing, and transmission may well be a conservative estimate, depending on energy choices we make in the coming years.
This forest fragmentation has a number of deleterious effects on the environment. First, many invasive plant species, such as bush honeysuckle and Japanese knotweed, tend to thrive in recently disturbed open areas, where competing native plants have been removed. The practice also threatens numerous animal species that thrive far from the forest’s edge, including a variety of native song birds. The disturbed lands create significant runoff into nearby rivers and streams, which can have an impact on aquatic life. And the cumulative release of carbon into the atmosphere is staggering – consider that the average acre of forest in the United States contains 158,000 pounds of organic carbon per acre. As the area is 73% forested, the total cumulative impact could result in taking 5.8 to 11.6 million tons of organic carbon out of forested storage. Much of this carbon will find its way into the atmosphere, along with the hydrocarbons that are purposefully being extracted from drilling operations.
https://www.fractracker.org/a5ej20sjfwe/wp-content/uploads/2017/06/Forest-Fragmentation-Feature.jpg400900Matt Kelso, BAhttps://www.fractracker.org/a5ej20sjfwe/wp-content/uploads/2025/09/2025-Wordmark-Logo.pngMatt Kelso, BA2017-06-06 10:09:452021-04-15 15:03:01Forest Fragmentation and O&G Development in PA’s Susquehanna Basin
How fragmented approvals and infrastructure favor petrochemical development
By Leann Leiter and Lisa Graves-Marcucci
Let’s think back to 2009, when oil and gas companies like Range Resources began drilling the northeast shale plays in earnest. Picture the various stages involved in drilling – such as leasing of land, clearing of trees, boring of wells, siting of compressor stations, and construction of pipelines to gather the gas. Envision the geographic scope of the gas infrastructure, with thousands of wells in Pennsylvania alone, and thousands of miles of pipelines stretching as far as Louisiana.
Figure 1. A pipeline right-of-way snakes behind a residential property in Washington County, PA. Photo credit: Leann Leiter
Now, picture the present, where a homeowner looks out over her yard and wonders how a lease she signed with Shell several years prior made it possible for the company to run an ethane pipeline across her property and between her house and her garage.
Think forward in time, to 2022, the year when a world-scale ethane cracker is set to go online in Beaver County, Pennsylvania, to begin churning through natural gas liquids from wells in PA and others, producing a variety of disposable plastic products.
At each of these moments in gas development, which of the many stakeholders – industry leaders, local governments, state regulatory agencies, or landowners and residents – were granted a view of the full picture?
The proposed Shell ethane cracker in Beaver County is an illustration of the fragmented nature of gas development. From the extensive web of drilling infrastructure required to supply this massive facility, to several years of construction, this project is a case-study in piecemeal permitting. Such fragmentation creates a serious barrier to transparency and to the informed decision-making that relies upon it.
In the first two articles in this series on the petrochemical development in Beaver County, we focused on ethane cracker emergency scenarios and how the area might prepare. In this article, we draw the lens back to take in the larger picture of this region-altering project and highlight the effects of limited transparency.
The “Piecemeal” Nature of Gas Development
All across the Pennsylvania, proposed industrial development – even coal operations – have historically provided to the public, elected officials, and regulatory agencies the extent or footprint of their planned operations. Nonetheless, the oil and gas industry has in several instances undertaken a practice of developing its extensive infrastructure piece-by-piece. Operators of these facilities first acquire a GP-5 General Permit, which is only available to certain oil and gas operations with “minor” emissions and which allows them to avoid having the permit undergo public notice or comment. These operators then add emissions sources and increases through a series of minor amendments. While they are required to obtain a “major” source permit once their modifications result in major emissions, they avoid the scrutiny required for a major source by this fragmented process.
Unlike most other industrial permitting, the gas industry has enjoyed a much less transparent process. Instead of presenting their entire planned operation at the time of initial permit application, gas operators having been seeking – and receiving – incremental permits in a piecemeal fashion. This process puts local decision makers and the women, men, and children who live, work, and go to school near gas development at a severe disadvantage in the following ways:
Without full disclosure of the entirety of the planned project, neither regulatory bodies nor the public can conduct a full and factual assessment of land use impacts;
Incremental approvals allow for ever-expanding operations, including issuance of permits without additional public notification and participation;
Piecemeal approvals allow operations to continuously alter a community and its landscape;
The fragmented approval process prevents consideration of cumulative impacts; and
Without full transparency of key components of the proposed operations, emergency planning is hampered or non-existent.
From the Well to the Ethane Cracker
In the fragmented approval process of gas development, the proposed ethane cracker in Beaver County represents a pertinent example. Developers of this massive, multi-year, and many-stage project have only revealed the size and scope in a piecemeal fashion, quietly making inroads on the project (like securing land leases along the route of the pipeline required for the cracker, years in advance of permit approvals for the facility itself). By rolling out each piece over several years, the entirety of the petrochemical project only becomes clear in retrospect.
A World-Scale Petrochemical Hub
While Shell is still pursuing key approval from the PA Department of Environmental Protection, industry leaders treat the ethane cracker as a foregone conclusion, promising that this facility is but one step in turning the area into a “petrochemical hub.”
The cracker facility, alone, will push existing air pollution levels further beyond their already health-threatening state. Abundant vacant parcels around Shell’s cracker site are attractive sites for additional spin-off petrochemical facilities in the coming “new industry cluster.” These facilities would add their own risks to the equation, including yet-unknown chemical outputs emitted into the air and their resulting cumulative impacts. Likewise, disaster risks associated with the ethane cracker remain unclear, because in the piecemeal permitting process, the industry is not required to submit Preparedness, Prevention, and Contingency (PPC) Plans until after receiving approval to build.
Figure 2. A portion of the extensive US natural gas interstate pipeline system stretching from the petrochemical hubs in the bayous of the Gulf Coast Basin to Pittsburgh’s Appalachian Basin. However, petrochemical development in the northeast may reverse or otherwise change that flow. Visualization created by Sophie Riedel, Carnegie Mellon University, School of Architecture. Data on interstate natural gas supply sourced from Energy Information Administration, Form EIA176 “Annual Report of Natural Gas and Supplemental Gas Supply and Disposition,” 2007.
92.3 Miles of Explosive Pipeline
More than just a major local expansion, communities downriver and downwind will be susceptible to the impacts, including major land disturbance, emissions, and the potential for “incidents,” including explosion. The pipeline required to feed the cracker with highly flammable, explosive ethane would tie the tri-state region into the equation, expanding the zone of risk into Ohio and crossing through West Virginia.
Figure 3. The Falcon Pipeline, which would be used to transport ethane to the cracker in Beaver County. At 92.3 miles long, it consists of two “legs,” starting from Scio and Cadiz, Ohio and Houston, PA, respectively, and extending up to the site of Shell’s ethane cracker. Credit: Shell Pipeline Company LP
Renewed Demand at the Wellhead
No one piece of the gas infrastructure stands alone; all work in tandem. According to the Energy Information Administration (EIA), the new US ethane crackers will drive consumption of ethane up by a 26% by the end of 2018. Gas wells in the northeast already supply ethane; new ethane crackers in the region introduce a way to profit from this by-product of harvesting methane without piping it to the Gulf Coast. How this renewed demand for ethane will play out at fracked wells will be the result of complex variables, but it will undoubtedly continue to drive demand at Pennsylvania’s 10,000 existing unconventional oil and gas wells and those of other states, and may promote bringing new ones online.
Figure 4. Excerpt from Executive Summary of IHS Markit Report, “Prospects to Enhance Pennsylvania’s Opportunities in Petrochemical Manufacturing.”
Along with drilling comes a growing network of gathering and transmission lines, which add to the existing 88,000 miles of natural gas pipeline in Pennsylvania alone, fragment wildlife habitat, and put people at risk from leaks and explosions. Facilities along the supply stream that add their own pollution and risks include pump stations along the route and the three cryogenic facilities at the starting points of the Falcon Pipeline (see Fig. 6).
Figure 5. Several yards of the 88,000 miles of gas pipelines cutting through Pennsylvania. Finleyville, PA. Credit: Leann Leiter
The infrastructure investment required for ethane crackers in this region could reach $3.7 billion in processing facilities, pipelines for transmitting natural gas liquids including ethane, and storage facilities. A report commissioned by Team Pennsylvania and the PA Department of Community and Economic Development asserts that “the significant feedstock and transportation infrastructure required” will “exceed what is typically required for a similar facility” in the Gulf Coast petrochemical hub, indicating a scale of petrochemical development that rivals that of the southern states. This begs the question of how the health impacts in Pennsylvania will compare to those in the Gulf Coast’s “Cancer Alley.”
Figure 6. Houston, PA Cryogenic and Fractionation Plant, one of three such facilities supplying feedstock to the proposed Shell ethane cracker. Credit: Garth Lenz, iLCP
Water Impacts, from the Ohio River to the Arctic Ocean
Shell’s facility is only one of the ethane crackers proposed for the region that, once operational, would be permitted to discharge waste into the already-beleaguered Ohio River. This waterway, which traverses six separate states, supplies the drinking water for over 3 million people. Extending the potential water impact even further, the primary product of the Shell facility is plastics, whose inevitable disposal would unnecessarily add to the glut of plastic waste entering our oceans. Plastic is accumulating at the alarming rate of 3,500 pieces a day on one island in the South Pacific and as far away as the waters of the Arctic.
Figure 7. View of the Ohio River, downriver from the site of Shell’s proposed ethane cracker. Existing sources of industrial pollution to the river include the American Electric power plants, coal loading docks, barges, coal ash lagoons, and dry coal ash beds shown in this picture, and at least two fracking operations within the coal plant areas. Credit: Vivian Stockman/ohvec.org; flyover courtesy SouthWings.org.
How does fragmentation favor industry?
The gas and petrochemical industry would likely defend the logistical flexibility the piecemeal process affords them, allowing them to tackle projects, make investments, and involve new players as needed overtime. But in what other ways do the incredibly fragmented approval processes, and the limited requirements on transparency, favor companies like Shell and their region-changing petrochemical projects? And what effect does the absence of full transparency have on local communities like those in Beaver County? We conclude that it:
“Divides and conquers” the region. The piecemeal approach to gas development, and major projects like the Shell ethane cracker, deny any sense of solidarity between the people along the pipeline route resisting these potentially explosive channels cutting through their yards, and residents of Beaver County who fear the cracker’s emissions that will surround their homes.
Makes the project seem a foregone conclusion, putting pressure on others to approve. For example, before Shell formally announced its intention to build the facility in Potter Township, it rerouted a state-owned road to facilitate construction and increased traffic flow. Likewise, though a key permit is still outstanding with the PA DEP, first responders, including local volunteer firefighters, have already begun dedicating their uncompensated time to training with Shell. While this is a positive step from a preparedness standpoint, it is one of many displays of confidence by Shell that the cracker is a done deal.
Puts major decisions in the hands of those with limited resources to carry them out and who do not represent the region to be affected. In the case of the Shell ethane cracker, three township supervisors in Potter Township granted approvals for the project. The impacts, however, extend well beyond Potter or even Beaver county and include major air impacts for Allegheny County and the Pittsburgh area. Effects will also be felt by landowners and residents in numerous counties and two states along the pipeline route, those near cryogenic facilities in Ohio and Pennsylvania, plus those living on the Marcellus and Utica shale plays who will see gas well production continue and potentially increase.
Figures 8a and 8b. Potter Township Supervisors give the go-ahead to draft approval of Shell’s proposed ethane cracker at a January meeting, while confronted with public concern about deficiencies in Shell’s permit applications. Photos courtesy of the Air Quality Collaborative.
The piecemeal, incremental, and fragmented approval processes for the ethane cracker – and other gas-related facilities in the making – create one major problem. They make it nearly impossible for locals, elected officials, and regulatory agencies to see the whole picture as they make decisions. The bit-by-bit approach to gas development amounts to far-reaching development with irreversible impacts to environmental and human health.
We ask readers, as they contemplate the impacts closest to them – be it a fracked well, a hazardous cryogenic facility, the heavily polluted Ohio River, a swath of land taken up for the pipeline’s right-of-way, or Shell’s ethane cracker itself – to insist that they, their elected officials, and regulators have access to the whole picture before approvals are granted. It’s hard to do with a project so enormous and far-reaching, but essential because the picture includes so many of us.
Sincere Appreciation
To The International League of Conservation Photographers, The Ohio Environmental Council, and The Air Quality Collaborative for sharing photographs.
To Sophie Riedel for sharing her visualizations of natural gas interstate pipelines.
To Lisa Hallowell at the Environmental Integrity Project, and Samantha Rubright and Kirk Jalbert at FracTracker, for their review of and and invaluable contributions to this series.
Feature image: Map of US counties and natural gas interstate pipeline system describes the wide-diameter (20-42 inch), high capacity trunklines that carry most of the natural gas that is transported throughout the nation. Visualization created by Sophie Riedel, Carnegie Mellon University, School of Architecture. Data on interstate natural gas supply sourced from Energy Information Administration, Form EIA176 “Annual Report of Natural Gas and Supplemental Gas Supply and Disposition,” 2007.
https://www.fractracker.org/a5ej20sjfwe/wp-content/uploads/2017/05/Pipelines-US-Graphic-Riedel-Feature.jpg400900FracTracker Alliancehttps://www.fractracker.org/a5ej20sjfwe/wp-content/uploads/2025/09/2025-Wordmark-Logo.pngFracTracker Alliance2017-05-31 09:12:492021-04-15 15:03:01Piecing Together an Ethane Cracker
Eighty years ago, Southeastern Ohio was a wasteland of barren, eroding hills. During the 18th and 19th centuries this once heavily forested area in the Appalachian foothills had been clear cut and mined beyond recognition. When the Great Depression struck, lowering crop prices made farming unprofitable in the area, and 40% of the population moved away.
In 1933, President Franklin Delano Roosevelt established the Civilian Conservation Corps (CCC), a public work relief program that employed men aged 18-25 to do manual labor related to conservation and development of natural resources such as planting trees, constructing trails, roads, and lodges, fighting wildfires, and controlling erosion. The following year, Ohio’s legislature agreed to allow the federal government to purchase land in the state for the purpose of establishing a national forest. The Forest Service was tasked with restoring the land for what is now called Wayne National Forest (WNF). A tree nursery was established near Chillicothe, and with the help of the CCC and volunteers, including members of the Daughters of the American Revolution, garden clubs, and school children, reforestation began.
Photos Credit: US Forest Service
An Area on the Mend
Today, WNF comprises three units that span 12 Ohio counties in the Unglaciated Allegheny Plateau. The hills are covered in biologically diverse mixed mesophytic forest, which includes approximately 120 species of trees and provides habitat for at least 45 species of mammals, 158 species of birds, 28 species of reptiles, 29 species of amphibians, and 87 species of fish. The US Forest Service estimates that 240,000 people visit this ecological wonder annually, according to Forest Recreation Program Manager, Chad Wilberger, in Nelsonville, Ohio. The restoration of barren public land to its current state is a great achievement. If it continues to be protected, Wayne could one day resemble the old growth forest that thrived here before the arrival of European settlers.
The Bureau of Land Management (BLM), however, has recently decided to lease up to 40,000 acres of Wayne to gas and oil companies for horizontal hydraulic fracturing, or fracking. The first auction took place last December resulting in the lease of 700 acres. A second auction this March leased another 1,200 acres. Nearly all of this land lies within the 60,000 acre Marietta Unit of the forest. This brings Oil & Gas Expressions of Interest (EOI) acreage to roughly 7.5% of all WNF owned parcels in this unit.
Wayne National Forest and Adjacent Existing Oil and Gas Infrastructure Below is a map of the Wayne National Forest, along with parcels owned by WNF (shown in gray) and those that might be subject to unconventional oil and gas development (gray parcels outlined with dashes). We also include existing unconventional oil and gas infrastructure near the park. Explore the map below, or click here to view the map fullscreen.
Gas and oil development is not new to the Wayne. Since the passage of The Federal Land Policy and Management Act of 1976, the US Forest Service’s land management plan for WNF has included conventional drilling, and derricks are a common sight on both public and private land in southeastern Ohio.
Fracking (unconventional drilling), however, has a far greater impact, requiring clear cutting of large areas of land for the construction of concrete well pads, and the use of millions of gallons of water that will become contaminated during the process and then transported by truck to injection wells. Accidents can be catastrophic for workers and nearby residents, and fracking and waste water disposal have been linked to earthquakes in Ohio.
In 2012, BLM updated its WNF Land and Resource Management Plan to allow fracking in the forest without conducting new impact studies.
What is at risk?
The Marietta Unit of the WNF is located in Monroe, Perry, and Washington counties in Southeastern Ohio along the Ohio River. Within its boundary are a wealth of trails used for hiking, backpacking, horseback riding, and mountain biking, campgrounds, and waterways ideal for kayaking and fishing. Both the highest and lowest points in the Wayne lie in this unit, as does the Irish Run Natural Bridge. The area is also known for its exceptional wildflowers, as shown in the photos below.
One popular recreation area, Lamping Homestead, lies directly within an oil and gas Expression Of Interest (EOI) parcel #3040602400 (See Map Above), one of the areas under consideration for lease. In the 1800s, it was the site of the Lamping family’s farm, but today all that remains of the settlers is a small cemetery with an iron gate atop a hill overlooking a small lake. Six campsites are situated around the western side of the lake, and two intersecting hiking loops rise into the wooded hills to the east. On the western side of the parking lot is a covered picnic area. A creek flows out of the lake and into Clear Fork, a tributary of the Little Muskingum River, across the road from the parking lot.
Both the lake and stream are popular boating and fishing areas. Lamping is an excellent spot for wildlife viewing. The lake, the creeks that flow in and out of it, and the surrounding wooded hills support an impressive variety of plant and animal species. During the day, visitors might spot ducks, geese, great blue herons, red-winged blackbirds, summer tanagers, red spotted newts, box turtles, northern water snakes, garter snakes, deer, rabbits, and muskrats. At night, they could be greeted by a cacophony of voices from frogs, owls, and coyotes.
Species of trees, plants, and fungus are also numerous. In winter, stands of white pine pop out against the bare branches of oak, hickory, maple, buckeye, and other deciduous trees. In spring, eye-catching splotches of blooming dogwood and redbud contrast against the many shades of green. But hikers who pull their gaze away from the brightly colored canopy and look down are rewarded with an abundance of wildflowers and the butterflies they attract, as well as many varieties of mushrooms and fungus, including such edible varieties as morels, wood ear, and dryad’s saddle.
Estimating Disturbances
It is unclear how much surface disturbance would occur on public land if this parcel were to be fracked, but even if the well pad and pipelines were constructed on private land adjacent to the forest, in order to drill under the forest, the public land and its inhabitants and visitors would certainly be impacted.
There is no question that noise and air pollution from traffic and construction would be disruptive both to wildlife and to human visitors. Explore various photos of the oil and gas industry in the gallery below:
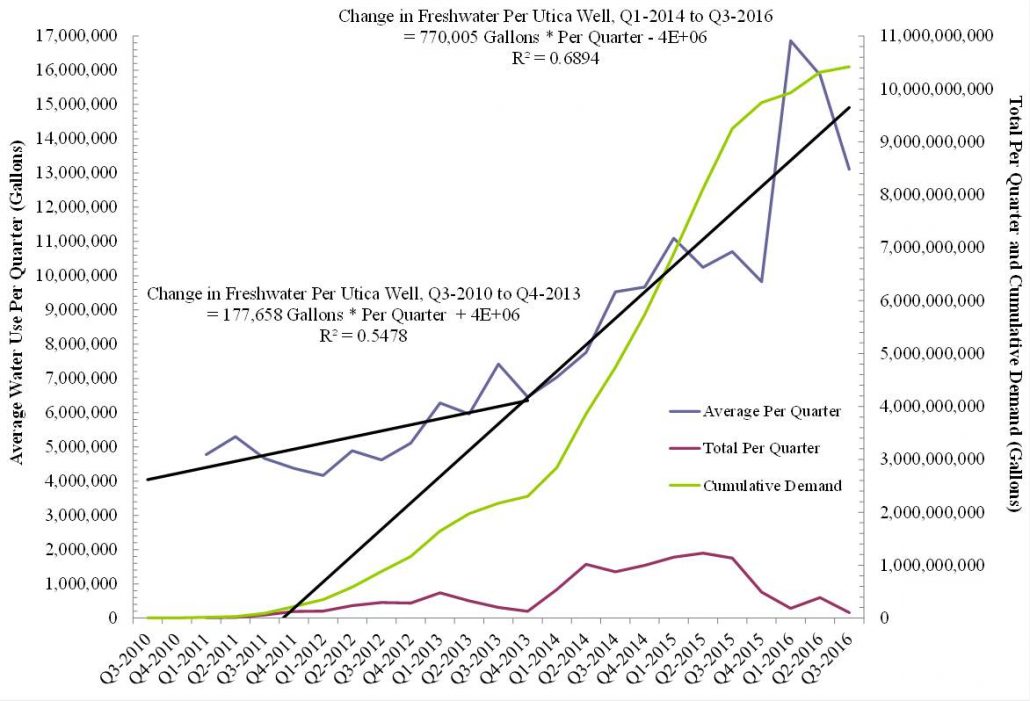
The extraction process requires 2 million to 6 million gallons of fresh water each time a well is fracked. The rate at which hydraulic fracturing’s water demand is increasing on a per-well basis here in Ohio reached an exponential state around Q4-2013 and Q1-2014 and continues to rise at a rate of 3.1 million gallons per well per year (Figure 1).
Ohio Hydraulic Fracturing Total and Per Well Freshwater Demand between Q3-2010 and Q3-2016.
In Ohio, oil and gas companies are allowed to pull this water directly from streams and rivers at no cost. All this is possible, despite the fact that after its use it is so contaminated that it must be disposed of via injection wells and is permanently removed from the water cycle. The industry is already pulling water from streams in the Marietta Unit of the WNF for use in fracking on private land. Fracking public land simply means water withdrawals will occur on a much larger scale.
Ohio and West Virginia Shale Water Demand and Injection Waste Disposal This map shows Utica wells weighted by water demand and disposal (and/or production). It also depicts water, sand, and chemical usage as well as injection waste and oil production. Explore the map below, or click here to view map fullscreen.
Inevitable methane leaks, in addition to contributing to climate change, affect humans and wildlife in their immediate vicinity, causing headaches and nausea and even killing trees and plants.
In addition to the anticipated harm that fracking inflicts upon a natural area, there is also a risk of accidents with potentially devastating consequences. Residents of Monroe County have already seen a few in recent years from fracking on private land. In 2014, a well pad fire in the village of Clarington resulted in a chemical spill that contaminated nearby Opossum Creek, killing 70,000 fish. The same year a large gas leak 15 miles south in the village of Sardis resulted in the evacuation of all homes within half mile radius.
Recent studies have shown that extraction wells, in addition to injection wells, can cause earthquakes. Unsurprisingly, Monroe County has seen a spike in seismic activity with the increase in fracking activity in the area. The most recent incident was a 3.0 magnitude earthquake in the forest less than five miles from Lamping Homestead in April of this year.
Supporters of Wayne National Forest
Many people have repeatedly spoken out against BLM’s plan, submitting a petition with more than 100,000 signatures, and protesting outside Wayne National Forest Headquarters and Athens Ranger Station in Nelsonville. They have even organized voters to call and write letters to Regional Forester Kathleen Atkinson and legislators, including Senators Sherrod Brown and Rob Portman, and Governor John Kasich. BLM has not budged on its decision, unfortunately, insisting that leasing this land for fracking, and associated infrastructure buildout, will have “no significant impact.”
This May, the Center for Biological Diversity, Ohio Environmental Council, Ohio Sierra Club, and Heartwood, a regional organization focused on protecting forests, filed a lawsuit against BLM, aiming to void BLM leases and halt all fracking operations within the national forest.
Concerned citizens continue to organize raise awareness as they await the outcome of the suit.
Becca Pollard is Freelance Journalist and Co-founder of Keep Wayne Wild
Data Downloads
Click on the links below to download the data used to create this article’s maps:
https://www.fractracker.org/a5ej20sjfwe/wp-content/uploads/2017/05/Wayne-National-Forest-Feature.jpg400900Guest Authorhttps://www.fractracker.org/a5ej20sjfwe/wp-content/uploads/2025/09/2025-Wordmark-Logo.pngGuest Author2017-05-24 11:35:532021-04-15 15:03:02Wayne National Forest Could Be Deforested – Again
The largest accidental release of methane in U.S. history began October 23, 2015 with the blowout of an underground natural gas storage well in Aliso Canyon about 20 miles west of Los Angeles. By the time the well was plugged 112 days later, more than 5.0 billion cubic feet of methane and other pollutants had been released to the atmosphere. It was a disaster for the climate, the environment, California’s energy supply, and the more than 11,000 people that were forced to evacuate.
A new study from the Harvard T. H. Chan School of Public Health – Center for Health and the Global Environment shows that more than one in five of the almost 15,000 active underground gas storage (UGS) wells in the US could be vulnerable to serious leaks due to obsolete well designs – similar in design to the well that failed at the Aliso Canyon storage facility.
Published today in the journal Environmental Research Letters, the study presents a national baseline assessment of underground storage wells in the U.S. and indicates the need for a better understanding of the risks associated with the obsolescence of aging storage wells. The study also highlights the widespread nature of certain age-related risk factors, but indicates that some of the highest priority wells may be located in PA, OH, NY, and WV.
The study shows that the average construction year of largely unregulated active UGS wells in the US is 1963, with potentially obsolete wells that were not originally designed for storage operating in 160 facilities across 19 states. Some of the wells were constructed over 100 years ago – a time period that precedes many modern well containment systems such cement isolation and the use of multiple casings. Some of the oldest active UGS wells were not designed for two-way flow of gas, and therefore may not exhibit sufficient material-grade or redundant precautionary systems to prevent containment loss, as was evident at Aliso Canyon.
An Interview with the Author
Sam, Matt, and Kyle of FracTracker caught up with lead author and former FracTracker colleague, Dr. Drew Michanowicz, now with the Center for Health and Global Environment within the Harvard T. H. Chan School of Public Health to find out more about their study.
When we spoke with Drew, he began the interview by posing the first question to us:
Did you know that about 15% of the natural gas produced in the US is injected back into the ground each year?
While we had all heard of underground gas storage before, we had to admit that we never thought of the process like that before. In other words, some of the natural gas in the US is being produced twice from two different reservoirs before being consumed. And because many of these storage systems utilized depleted oil and gas reservoirs, many of the same pre- and post-conditioning processes, such as dehydrating and compressing, are necessary to bring the gas to market.
The following questions and answers from Drew expand upon the study’s findings:
Q: What prompted you and your colleagues to investigate this topic?
A: After the Aliso Canyon incident, we became interested in the question: ‘Is Aliso Canyon Unique?’ Interestingly, there were plenty of early warning signs at that facility that corrosion issues on very old repurposed wells were becoming a significant issue. Almost a year before the well blowout, Southern California gas went on record in front of California’s Public Utility Commission stating that they needed a rate increase to implement a necessary integrity management plan for their wells, and to be able to move beyond operating in a reactive mode. That unfortunately prophetic document really got us interested in better understanding why their infrastructure was in the state it was in. And like any major accident like this, a logical next step is to assess the prevalence of hazardous conditions elsewhere in the system, in the hope to prevent the next one.
From our research, it appears that a very large portion of the UGS sector may be facing similar obsolescence issues compared to Aliso, such as decades-old wells not originally designed for two-way flow. Our work here, however, is a simplified assessment that focused only on passive barriers or the fixed structures such as the steel pipes likely present in a well. Much more work is needed to fully understand the active-type safety measures in place such as safety valves, tubing/packers, and overall integrity management plans – all important factors for manage risks.
Q: We see that your team developed a well-level database of over 14,000 active UGS wells across 29 states. Because data-collation is a big part of our work here, can you describe that data collection process?
A: Very early on we also realized that underground gas storage was exempt from the Safe Drinking Water Act’s Underground Injection Control (UIC) program – similar to exemption with hydraulic fracturing and the Energy Policy Act of 2015, AKA the Halliburton Loophole. This meant in part that very little aggregate well data was available from the Federal Government or by third-party aggregators like FracTracker and DrillingInfo. Reminiscent of my former extreme data-paucity days at FracTracker, we knew we needed to build a database basically from scratch to effectively perform a hazard assessment that incorporated a spatial component.
We began by gathering what data we could from the U.S. Energy Information Administration (EIA), which gave us good detail at the field or facility level, but the fields were generalized to a county centroid. So to fully evaluate these infrastructure, we needed to figure out how to join the facility-level data to the well data for each state. We relied on NETL’s Energy Data eXchange to identify state-level wellbore data providers where applicable. Once we collected all of the state data, we created a decision-tree framework to join the individual wells to the EIA field names in order to produce a functional geodatabase. Because we had to manage data from so many sources, we had to devote quite a bit of effort to data QA/QC, and that is reflected in the methods and results of the paper. For example, some of our fields and wells had to be joined via visual inspection of company system maps, because of missing identifier information.
Q: We see that some of the oldest repurposed wells you mapped are located in PA, OH, NY, and WV. Was that a surprise to you?
A: That was a surprise considering this story started for us in California, and even more surprising was that some are more than 100 years old. Now, a bit of caution here is warranted when thinking about the age of any engineered system. On the one hand, something that functions for a very long time is an indication that the system was very well suited for its task, and likely has been very well taken care of – think of an antique automobile like a fully functional 1916 Model T Ford, for example. On the other hand, age and construction year relates to the integrity of an engineered system through two processes by:
providing information to how long a system has been exposed to natural degradation processes such as corrosion, and stresses from thermal and abrasive cycles; and by
proxying for knowledge and regulatory safety standards at the time of construction which informs the design, materials, technologies likely used.
To go back to the car example, while an old classic car may still be operational, it may not have certain safety features like antilock brakes, airbags, or safety belts, and generally will not be able to go as fast as a modern car. Therefore, a gas storage well’s integrity is at least indirectly related to its construction year when considering the multitude of technological and safety improvements have occurred over the years. This is how we have been thinking about well integrity from a 5,000 foot perspective. Needless to say, more research is needed to understand the causal effect of age on well integrity.
Q: So if we understand you correctly, these older wells can be maintained with sufficient management practices, but there may be inherent safety features missing on these older wells that don’t adhere to todays’ standards?
A: That’s right. So what we can say about some of these aging wells is that some will not reflect certain modern fail-safe engineering such as sufficient casing design strength and multiple casings or barriers along the full length. And these are permanent structural elements vestigial to the well’s original design, and therefore cannot be undone or redesigned away. In other words, it makes much more sense to drill a new well with new materials than attempt to significantly alter an old well. And the gas storage wells built today are designed with redundant fail-safe systems including multiple barriers and real-time pressure sensors.
But back to my earlier point about lack of federal regulations to set a minimum safety standard – because of that, there is also much uncertainty surrounding how many of these facilities have been dealing with safety and risk management. That is a future direction of this work – to really try to fill in some of regulatory gaps between states and the impending Federal guidelines and identify some best practices to help inform policy makers specifically at the state level.
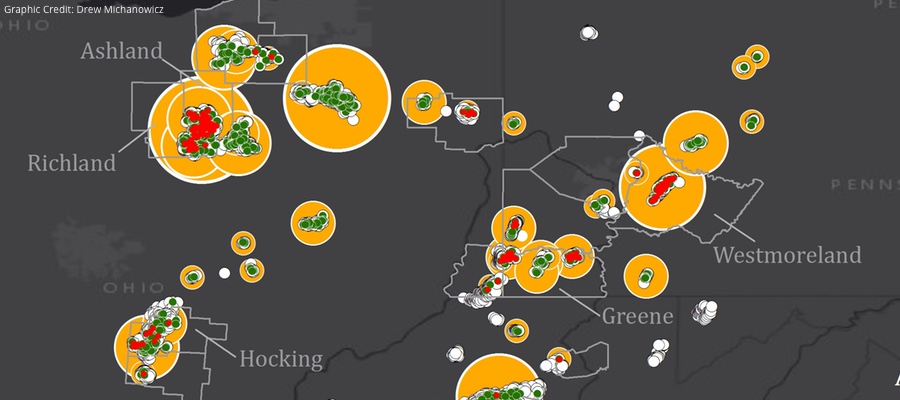
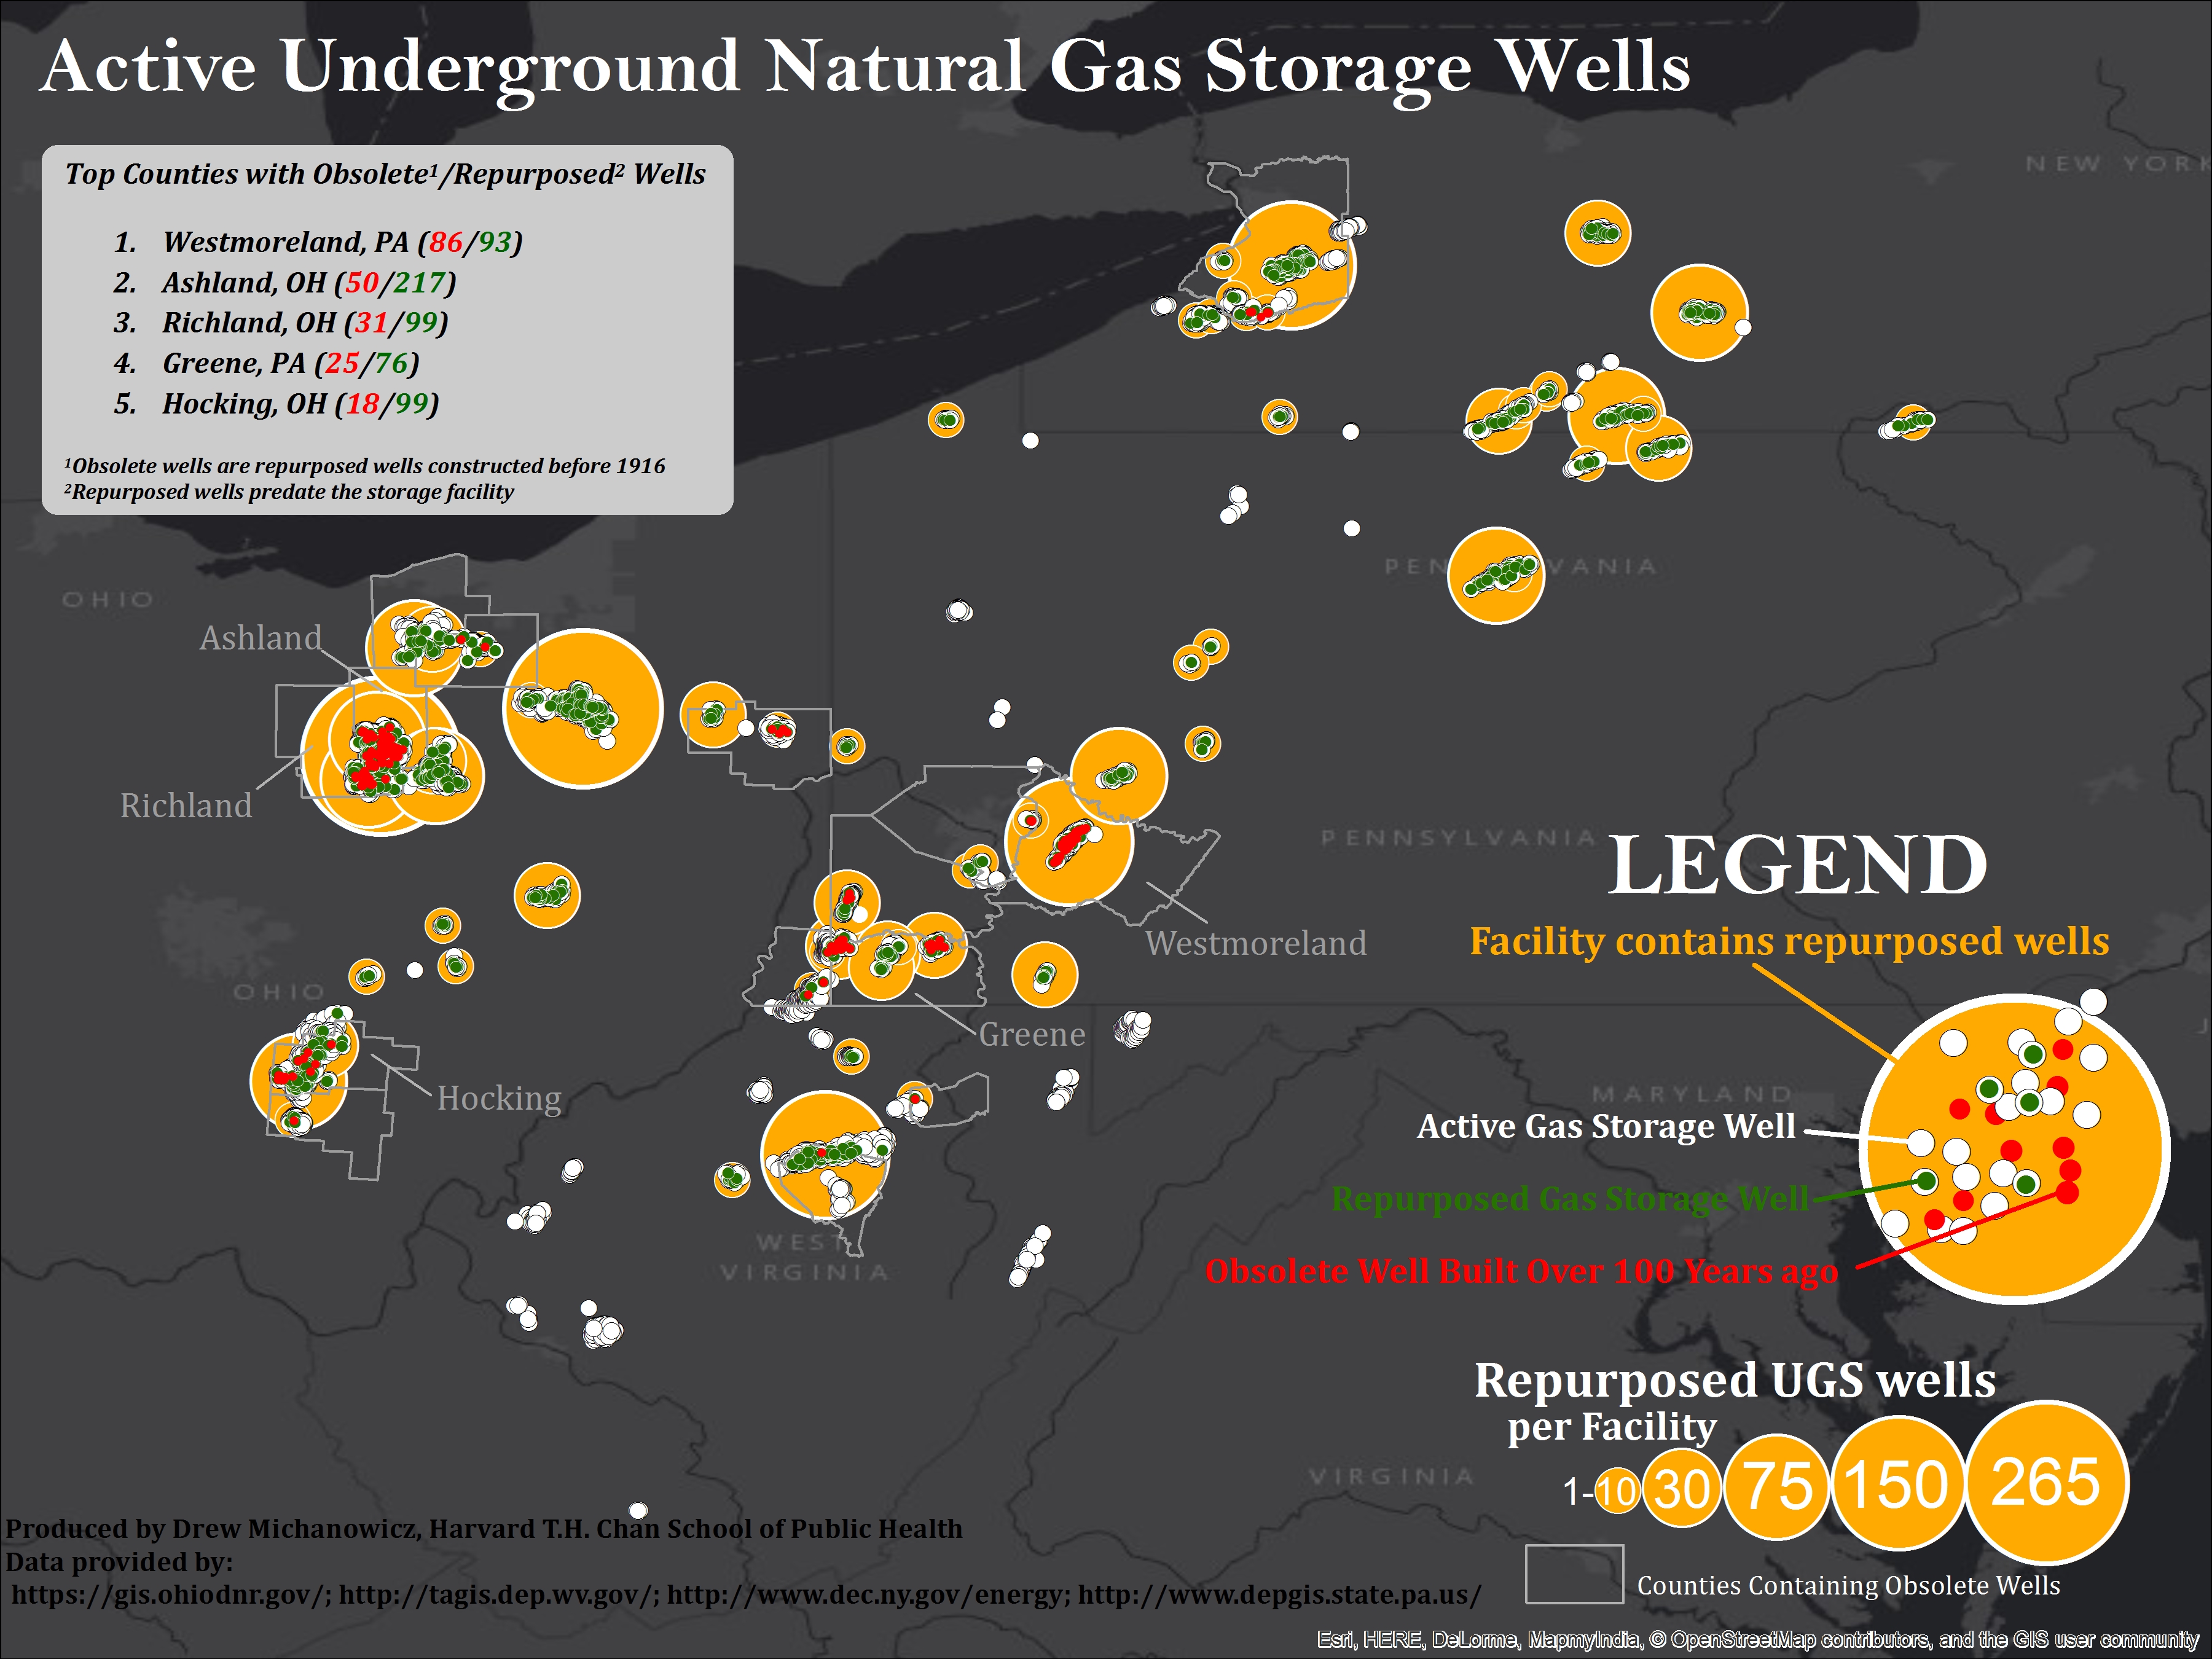
Drew put together a map to highlight where some of these active storage wells are in PA, OH, NY, and WV:
This area map of PA, WV, OH, and NY displays where active underground natural gas storage operations are located. The small white points represent active storage wells that have a completion, SPUD, or permit date that occurs after the field was designated for storage indicating that these wells are more likely to have been designed for storage operations. The green points are active storage wells that predate storage operations, indicating that these wells may not have been designed for storage.
There are 121 storage fields connected to at least 6,624 active gas storage wells across these four states. A portion of wells in this region were not included in this final count because they did not contain sufficient status or date information. Pennsylvania has the most individual storage fields of any state with 47, while Ohio boasts the most active storage wells of any state in the country with 3,318 across its 22 active fields. Of the 6,624 active UGS wells across these four states, 1,753 predate storage designation indicating that these wells were likely not originally designed for storage. These ‘repurposed’ wells have a median age of 84 years, with 210 wells constructed over 100 years ago (red points). The 100 year cutoff is not arbitrary, as the year 1917 marks the advent of cement zonal isolation techniques, indicating that these wells may be of the highest priority in terms of design deficiencies related to well integrity, and they are primarily located across the four states pictured above.
Top Counties with Obsolete1/Repurposed2 Wells
Westmoreland, PA (86/93)
Ashland, OH (50/217)
Richland, OH (31/99)
Greene, PA (25/76)
Hocking, OH (18/99)
1Obsolete wells are repurposed wells constructed before 1916 2Repurposed wells predate the storage facility
The well that failed at Aliso Canyon was originally drilled in 1954 for oil production. In 1972, it was repurposed for underground gas storage, which entails both production and injection cycles in a single well. The problem seems to be that because it was not originally constructed to store natural gas, only a single steel pipe separated the flow of gas and the outside rock formation. That meant the well’s passive structural integrity was vulnerable to a single point-of-failure along a portion of its casing. When part of the subsurface well casing failed, there were no redundancies or safety valves in place to prevent or minimize the blow out.
More information related to the Aliso Canyon incident and this study is available here.
More info on the Center for Health and the Global Environment can be found here.
https://www.fractracker.org/a5ej20sjfwe/wp-content/uploads/2017/05/UGS-Map-Feature.jpg400900FracTracker Alliancehttps://www.fractracker.org/a5ej20sjfwe/wp-content/uploads/2025/09/2025-Wordmark-Logo.pngFracTracker Alliance2017-05-23 13:12:102021-04-15 15:03:04Underground Gas Storage Wells – An Invisible Risk in the Natural Gas Supply Chain
Air quality in the California Bay Area has been steadily improving over the last decade, and the trend can even be seen over just the course of the last few years. In this article we explore data from the ambient air quality monitoring networks in the Bay Area, including a look at refinery emissions.
From the data and air quality reports we find that that many criteria pollutants such as fine particulate matter (PM2.5) and oxides of nitrogen (NOX) have decreased dramatically, and areas that were degraded are now in compliance.
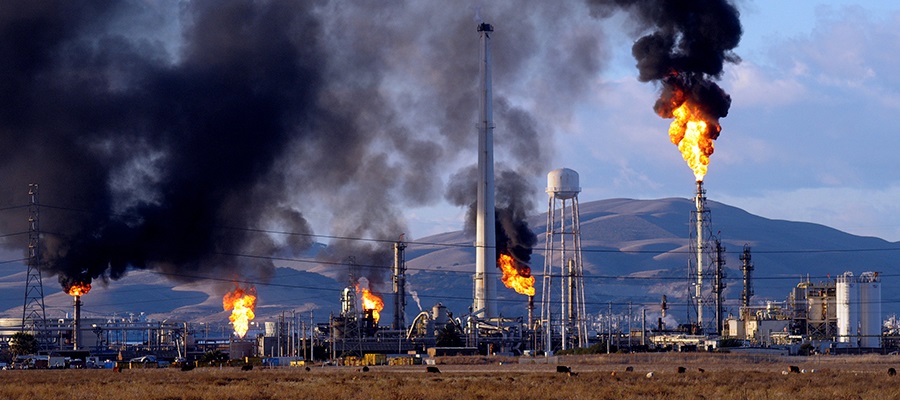
While air pollution from certain sectors such as transportation have been decreasing, the north coast of the East Bay region is home to a variety of petrochemical industry sites. This includes five petroleum refineries. The refineries not only contribute to these criteria pollutants, but also emit a unique cocktail of toxic and carcinogenic compounds that are not monitored and continue to impact cardiovascular health in the region. This region, aptly named the “refinery corridor” has a petroleum refining capacity of roughly 800,000 BPD (barrels per day) of crude oil.
Petroleum refineries in California’s East Bay have always been a contentious issue, and several of the refineries date back to almost the turn of the 20th century. The refineries have continuously increased their capacities and abilities to refine dirtier crude oil through “modernization projects.” As a result, air quality and health impacts became such a concern that in 2006 and again in 2012, Gayle McLaughlin, a Green Party candidate, was elected as Mayor of the City of Richmond. Richmond, CA became the largest city in the U.S. with a Green Party Mayor. While there have been many strides in the recent decade to clean up these major sources of air pollution, health impacts in the region including cardiovascular disease and asthma, as well as cancer rates, are still disproportionately high.
Regulations
To give additional background on this issue, let’s discuss some the regulations tasked with protecting people and the environment in California, as well as climate change targets.
However – a current proposal will actually allow the refineries to process more crude oil by setting a standard for emissions by volume of crude/petroleum refined, rather than an actual cap on emissions. The current regulatory approach focuses on “source-by-source” regulations of individual equipment, which ignores the overall picture of what’s spewing into nearby communities and the atmosphere. Even the state air resources board has supported a move to block the refineries from accepting more heavy crude from the Canadian tar sands.
New regulatory proposals incentivize refineries to continue expanding operations to refine more oil, resulting in a larger burden on the health of these already disproportionately impacted environmental justice communities. Chevron, in particular, is upgrading their Richmond refinery in a way as to allow it to process dirtier crude in larger volumes from the Monterey Shale and Canada’s Tar Sands. Since the production volumes of lighter crudes are shrinking, heavier dirtier crudes are becoming a larger part of the refinerys’ feedstocks. Heavier crudes require more energy to refine and result in larger amounts of hazardous emissions.
Upgrades are also being implemented to address greenhouse gas emissions. While the upgrades address the carbon emissions, regulatory standards without strict caps for other pollutants will allow emissions of criteria and toxic air pollutants such as VOC’s, nitrosamines, heavy metals, etc… to increase. In fact, newly proposed emissions standards for refineries will make it easier for the refineries to increase their crude oil volumes by regulating emissions on per-barrel standards. Current refining volumes can be seen below in Table 1, along with their maximum capacity.
Table 1. Bay Area refineries average oil processed and total capacity
Refinery
Location
Ave. oil processed Barrels Per Day (2012 est.)
Max. capacity (BPD)
Chevron U.S.A. Inc. Richmond Refinery
Richmond
245,271
>350,000
Tesoro Refining & Marketing, Golden Eagle Refinery
The Bay Area, and in particular the city of Richmond, have been noted in the literature as a place where environmental racism and environmental health disparity exist. The city’s residents of color disproportionately live near the refineries and chemical plants, which is noted in early works on environmental racism by pioneers of the idea, such as Robert Bullard (Bullard 1993a,b).
Since the issue has been brought to national attention by environmental justice groups like West County Toxics Coalition, progress has been made to try to bring justice, but it has been limited. People of color are still disproportionately exposed to toxic, industrial pollution in that area. A recent study showed 93% of respondents in Richmond were concerned about the link between pollution and health, and 81% were concerned about a specific polluter, mainly the Chevron Refinery (Brody et al. 2012). Recent health reports continue to show the trend that these refinery communities suffer disproportionately from cases of asthma and cardiovascular disease and higher mortality rates from a variety of cancers.
Health Impact Studies
Manufacturing and refining are known to produce particularly toxic pollution. Additionally, there has been research done on the specific makeup of pollution in the refinery corridor. The best study to do this is the Northern California Household Exposure Study (Brody et al. 2009). They examined indoor and outdoor air in Richmond, a refinery corridor community, and Bolinas, a nearby but far more rural community. They found 33% more compounds in Richmond, along with higher concentrations of each compound. The study also found very high concentrations of vanadium and nickel in Richmond, some of the highest levels in the state. Vanadium and nickel have been shown to be some of the most dangerous PM2.5 components as we previously stated, which gives reason to believe the air pollution in Richmond is more toxic than in surrounding areas.
Another very similar study compared the levels of endocrine disrupting compounds in Richmond and Bolinas homes, and found 40 in Richmond homes and only 10 in Bolinas (Rudel et al. 2010). This supports the idea that a large variety of pollutants with synergistic effects may be contributing to the increased mortality and hospital visits for communities in this region. This small body of research on pollution in Richmond suggests that the composition of air pollution may be more toxic and thus trigger more pollution-related adverse health outcomes than in surrounding communities.
Air Quality Monitoring
As discussed above and in FracTracker’s previous reports on the refinery corridor, the refinery emissions are a unique cocktail whose synergistic effects may be driving much of the cardiovascular disease, asthma, and cancer risk in the region. Therefore, the risk drivers in the Bay Area need to be prioritized, in particular the compounds of interest emitted by the petrochemical facilities.
The targets for emissions monitoring are compounds associated with the highest risk in the neighboring communities. An expert panel was convened in 2013 to develop plans for a monitoring network in the refinery corridor. Experts found that measurements should be collected at 5 minute intervals and displayed to the public real-time. The gradient of ambient air concentrations is determined by the distance from refinery, so a network of three near-fence-line monitors was recommended. Major drivers of risk are supposed to be identified by air quality monitoring conducted as a part of Air District Regulation 12m Rule 15: Petroleum Refining Emissions tracking. According to the rule, fence-line monitoring plans by refinery operators:
… must measure benzene, toluene, ethyl benzene, and xylenes (BTEX) and HS concentrations at refinery fence-lines with open path technology capable of measuring in the parts per billion range regardless of path length. Open path measurement of SO2, alkanes or other organic compound indicators, 1, 3-butadiene, and ammonia concentrations are to be considered in the Air Monitoring Plan.
The following analysis found that the majority of hazardous pollutants emitted from refineries are not monitored downwind of the facility fence-lines, much less the list explicitly named in the regulations above.
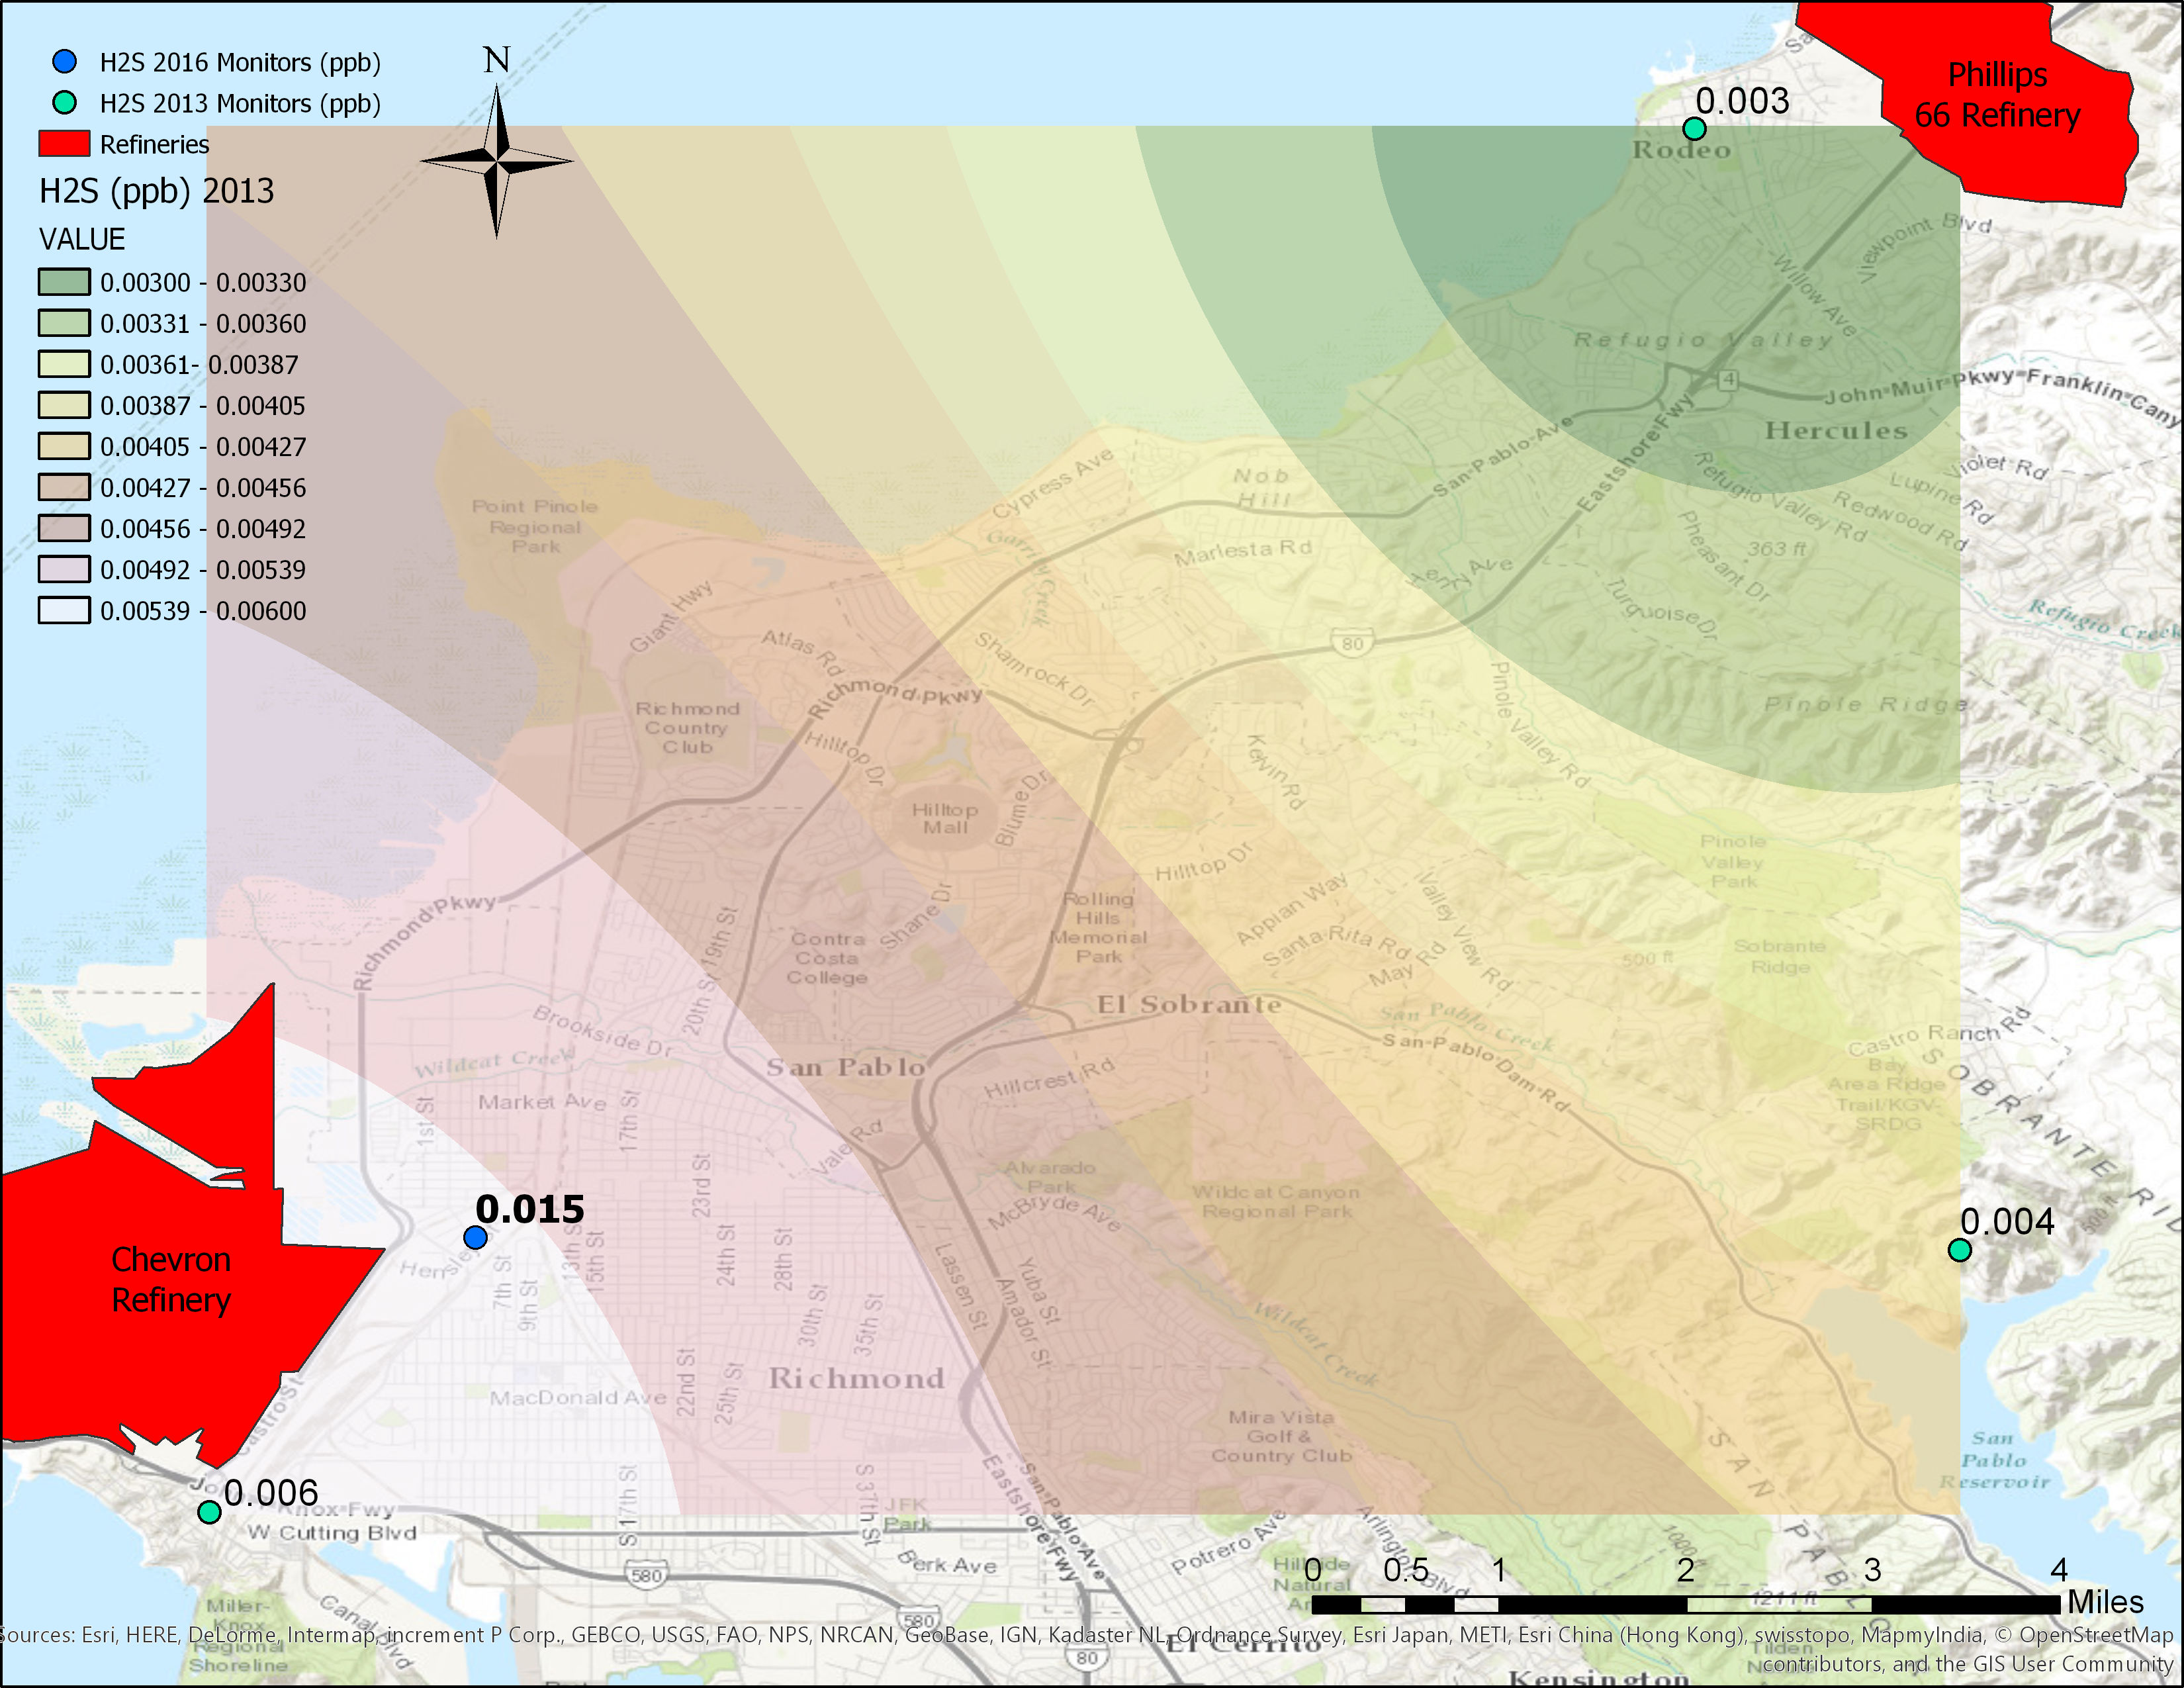
As shown below in Figure 1, the most impacted communities are in those directly downwind of the facility. According to the BAAQMD, each petroleum refinery is supposed to have fence-line monitoring. Despite this regulation developed by air quality and health experts, only two out of the five refineries have even one fence-line monitor. Real-time air monitoring data at the Chevron Richmond fence-line monitor and the Phillips 66 Rodeo fence-line monitor can be found on fenceline.org. Data from these monitors are also aggregated by the U.S. EPA, and along with the other local monitors, can be viewed on the EPA’s interactive mapping platform.
Figure 1. Map of Hydrogen Sulfide Emissions from the Richmond Chevron Refinery
Hazardous Emissions and Ambient Pollution
Since the majority of hazardous chemicals emitted from the refineries are not measured at monitoring sites, or there are not any monitoring sites at the fence-line or downwind of the facility, our mapping exercises instead focus on the hazardous air pollution for which there is data.
As shown in the map of hydrogen sulfide (H2S) above, the communities immediately neighboring the refineries are subjected to the majority of hazardous emissions. The map shows the rapidly decreasing concentration gradient as you get away from the facility. H2S would have been a good signature of refinery emissions throughout the region if there were more than three monitors. Also, those monitors only existed until 2013, when they were replaced with a singular monitor in a much better location, as shown on the map. The 2016 max value is much higher because it is more directly downwind of Chevron Refinery.
The interpolated map layer was created using 2013 monitoring data from three monitors that have since been removed. The 2016 monitoring location is in a different location and has a maximum value more than twice what was recorded at the 2013 location.
Table 2. Inventory of criteria pollutant emissions for the largest sectors in the Bay Area
Annual average tons per day
PM10
PM2.5
ROG
NOX
SOX
CO
Area wide
175.51
52.90
87.95
19.92
0.62
161.86
Mobile
20.33
16.27
183.12
380.52
14.93
1541.50
Total Emissions
16.30
12.14
106.58
50.59
45.95
44.31
Table adapted from the BAAQMD Refinery Report. PM10 = particulate matter less than 10 microns in diameter (about the width of a human hair); PM2.5 = PM less than 2.5 microns in diameter; ROG = reactive organic gases; NOX = nitrogen oxides; SOX = sulfur oxides; CO = carbon monoxide.
Additionally, exposure assessment can also rely on using surrogate emissions to understand where the plumes from the refineries are interacting with the surrounding communities. It is particularly important to also discriminate between different sources of pollution. As we see in Table 2 above, the largest volume of particulate matter (PM), NOX, and CO emissions actually come from mobile sources, whereas the largest source of sulfur dioxide and other oxides (SOX) is from stationary sources. Since the relationship between PM2.5 and health outcomes is most established, the response to ambient levels of PM2.5 in the refinery corridor gives insight into the composition of PM as well as the presence of other species of hazardous air pollution. On the other hand, SO2 can be used as a surrogate for the footprint of un-monitored air toxics.
Pollutants’ Fingerprints
Particulate Matter
Figure 2. Map of fine particulate matter (PM2.5) for the Bay Area Air Quality Management District
Figure 2 above displays ambient levels of PM2.5, and as the map shows, the highest levels of particulate matter surround the larger metro area of downtown Oakland and also track with the larger commuting corridors. The map shows evidence that the largest contributor to PM2.5 is truly the transportation (mobile) sector. PM2.5 is one hazardous air pollutant which negatively impacts health, causing heart attack, or myocardial infarction (MI), among other conditions. PM2.5 is particulate matter pollution, meaning small particles suspended in the air, specifically particles under 2.5 microns in diameter. Exposure to high levels of PM2.5 increases the risk of MI within hours and for the next 1-2 days (Brooks et al. 2004; Poloniecki et al. 1997).While refineries may not be the largest source of PM in the Bay Area, they are still large point sources that contribute to high local conditions of smog.
The chemical make-up of the particulate matter also needs to be considered. In addition, the toxicity of PM from the refineries is of particular concern. Since particulate matter acts like small carbon sponges, the source of PM affects its toxicity. The cocktail of hazardous air toxics emitted by refineries absorb and adsorb to the surfaces of PM. When inhaled with PM, these toxics including heavy metals and carcinogens are delivered deep into lung tissue.
Pooled results of many studies showed that for every 10 micrograms per meter cubed increase in PM2.5 levels, the risk of MI increases 0.4-1% (Brooks et al. 2010). However, this relationship has not been studied in the context of EJ communities. EJ communities are generally low income communities of color (Bullard 1993), which have higher exposures to pollution, more sources of stress, and higher biological markers of stress (Szanton et al. 2010; Carlson and Chamberlein 2005). All of these factors may affect the relationship between PM2.5 and MI, and increase the health impact of pollution in EJ communities relative to what has been found in the literature.
Sulfur Dioxide
Figure 3 below shows the fingerprint of the refinery emissions on the refinery corridor, using SO2 emissions as a surrogate for the cocktail of toxic emissions. The relationship between SO2 and health endpoints of cardiovascular disease and asthma have also been established in the literature (Kaldor et al. 1984).
In addition to assessing SO2 as a direct health stressor, it is also the most effective tracer of industrial emissions and specifically petroleum refineries for a number of reasons. Petroleum refineries are the largest source of SO2 in the BAAQMD by far (Table 1), and there are more monitors for SO2 than any of the other emitted chemical species that can be used to fingerprint the refineries. The distribution of SO2 is therefore representative of the cocktail of a combination of the hazardous chemicals released in refinery emissions.
Figure 3. Map of Sulfur Dioxide for the Bay Area Air Quality Management District
The next step for FracTracker Alliance is to further explore the relationship between health effects in the refinery communities and ambient levels of air pollution emitted by the refineries. Our staff is currently working with the California Department of Public Health to analyze the response of daily emergency room discharges for a variety of health impacts including cardiovascular disease and asthma.
References
Brody, J. G., R. Morello-Frosch, A. Zota, P. Brown, C. Pérez, and R. A. Rudel. 2009. Linking Exposure Assessment Science With Policy Objectives for Environmental Justice and Breast Cancer Advocacy: The Northern California Household Exposure Study. American Journal of Public Health 99:S600–S609.
Brook, R. D., B. Franklin, W. Cascio, Y. Hong, G. Howard, M. Lipsett, R. Luepker, M. Mittleman, J. Samet, S. C. Smith, and I. Tager. 2004. Air Pollution and Cardiovascular Disease. Circulation 109:2655–2671.
Brooks, R. D., S. Rajagopalan, C. A. Pope, J. R. Brook, A. Bhatnagar, A. V. Diez-Roux, F. Holguin, Y. Hong, R. V. Luepker, M. A. Mittleman, A. Peters, D. Siscovick, S. C. Smith, L. Whitsel, and J. D. Kaufman. 2010. Particulate Matter Air Pollution and Cardiovascular Disease. Circulation 121:2331–2378.
Bullard, R. D. 1993a. Race and Environmental Justice in the United States Symposium: Earth Rights and Responsibilities: Human Rights and Environmental Protection. Yale Journal of International Law 18:319–336.
Bullard, R. D. 1993b. Confronting Environmental Racism: Voices from the Grassroots. South End Press.
Carlson, E.D. and Chamberlain, R.M. (2005), Allostatic load and health disparities: A theoretical orientation. Res. Nurs. Health, 28: 306–315. doi:10.1002/nur.20084
Kaldor, J., J. A. Harris, E. Glazer, S. Glaser, R. Neutra, R. Mayberry, V. Nelson, L. Robinson, and D. Reed. 1984. Statistical association between cancer incidence and major-cause mortality, and estimated residential exposure to air emissions from petroleum and chemical plants. Environmental Health Perspectives 54:319–332.
Poloniecki, J. D., R. W. Atkinson, A. P. de Leon, and H. R. Anderson. 1997. Daily Time Series for Cardiovascular Hospital Admissions and Previous Day’s Air Pollution in London, UK. Occupational and Environmental Medicine 54:535–540.
Rudel, R. A., R. E. Dodson, L. J. Perovich, R. Morello-Frosch, D. E. Camann, M. M. Zuniga, A. Y. Yau, A. C. Just, and J. G. Brody. 2010. Semivolatile Endocrine-Disrupting Compounds in Paired Indoor and Outdoor Air in Two Northern California Communities. Environmental Science & Technology 44:6583–6590.
Szanton SL, Thorpe RJ, Whitfield KE. Life-course Financial Strain and Health in African-Americans. Social science & medicine (1982). 2010;71(2):259-265. doi:10.1016/j.socscimed.2010.04.001.
By Daniel Menza, Data & GIS Intern, and Kyle Ferrar, Western Program Coordinator, FracTracker Alliance
Cover photo credit: Claycord.com
https://www.fractracker.org/a5ej20sjfwe/wp-content/uploads/2017/05/tesoro-refinery_re.jpg400900Kyle Ferrar, MPHhttps://www.fractracker.org/a5ej20sjfwe/wp-content/uploads/2025/09/2025-Wordmark-Logo.pngKyle Ferrar, MPH2017-05-10 09:48:052021-04-15 15:03:07Tracking Refinery Emissions in California’s Bay Area Refinery Corridor
The Susquehanna River is a 444-mile long waterway extending from the area around Cooperstown, New York to the Chesapeake Bay. In Pennsylvania, the basin includes more than 37,000 miles of streams that feed into the river, which capture the precipitation of more than 20,000 square miles of land, and is home to over 3.3 million people.
The region has been heavily impacted by oil and natural gas extraction in recent years; more than 5,500 unconventional wells and roughly 13,500 conventional wells have been drilled in the PA segment of the basin since 2000. Unconventional wells, in particular, have brought industrial-scaled activity, pollution, and waste products to a wide area of the basin, with especially heavy development occurring in three counties along Pennsylvania’s northern tier – Bradford, Susquehanna, and Tioga.
Several governmental agencies are involved with monitoring impacts to this massive watershed. This article focuses on the Pennsylvania portion of the basin, and examines how capable agency-run monitoring efforts are in capturing oil and gas (O&G) related pollution events. The Pennsylvania Department of Environmental Protection (DEP), the US Geological Survey (USGS), and the Susquehanna River Basin Commission (SRBC) maintain a combined network of 274 monthly “grab sample” monitoring sites and 58 continuous data loggers in the Pennsylvania portion of the river basin. Meanwhile, between January 1, 2000 and February 7, 2017, the DEP logged 6,522 on the O&G violations compliance report within the same region. More than three out of every four of these violations have been assessed to unconventional wells, even though only one out of every four active wells in the basin is categorized as such.
Map of O&G Monitoring & Violations in PA’s Susquehanna River Basin
Grab samples obtained from official monitoring locations are the preferred method for regulatory purposes in understanding the long-term health of the river system. Researchers can test for any number of analytes from samples that are collected in-stream, but analyzed in certified laboratories. However, samples from these locations are collected periodically – usually once per month – and therefore are very likely to miss the effects of a significant spill or issue that may impact surface water chemistry for a number of hours or days before being diluted and washing downstream.
Continuous data loggers give regulators a near real-time assessment of what is happening in selected points in the basin, usually at 15-minute intervals. While there are numerous events that contribute to fluctuations in these measurements, these data loggers would be the most likely instruments available to register an event impacting the surface water within the basin. However, there are unique issues with data loggers. For instance, available data from these data loggers are much more limited in scope, as temperature, pH, and conductivity are typically the only available analytes. In addition, because the analysis occurs on site, the results carry less weight than laboratory results would. Finally, even though data loggers collect data at rapid intervals, only some are equipped to send data real-time to agency offices. Some data loggers must be manually collected on a periodic basis by program managers.
Perhaps the greatest challenge for monitoring in the Susquehanna River Basin is that it is simply not practical to monitor in all places likely to be impacted by oil and gas operations. Testing within the jurisdiction of the Susquehanna River Basin is actually fairly extensive when compared to other regions, such as the Ohio River Basin. The Ohio River Valley Water Sanitation Commission – the equivalent of the SRBC for the Ohio River Basin – only monitors basic analytes like total dissolved solids at 29 locations, all at or near the main stem of the river. However, none of the agencies monitoring water quality in the Susquehanna River Basin have capacity to test everywhere. On average, there is one testing location for every 111 miles of rivers and streams within the basin.
Case Studies
If agency-based monitoring is so limited, then the important question is: How well do these efforts capture oil and gas-related impacts? Some violations are more likely to impact surface water quality than others. This article takes a closer look at some of the bigger problem areas within the basin, including the Dimock region in Susquehanna County, Leroy Township in Bradford County, and Bell Township in Clearfield County.
Dimock
O&G violations and water monitoring near Dimock, PA. Note that multiple violations can occur at the same location. Click to expand map.
The highest concentration of oil and gas violations in the Susquehanna Basin is located in the townships of Dimock and Springville, in Susquehanna County, PA, with a total of 591 incidents reported on the compliance report. This makes the region the highest concentration of O&G violations in the entire state. Many of these violations are related to the systemic failure of well integrity, resulting in the contamination of numerous groundwater supplies. In terms of how these might affect surface water, 443 of the violations are in areas that drain into the Thomas Creek-Meshoppen Creek subwatershed by the southern edge of Springville Township, while most of the rest of the violations drain into the parallel West Branch of Meshoppen Creek.
The USGS operates a monthly monitoring location in the middle of the cluster of violations, at the confluence of Burdick and Meshoppen creeks, just north of the Dimock’s southern border. While this location might seem ideal at first, only 180 of the 443 violations in the subwatershed are upstream of the grab sample site. There is another water monitoring location that captures all of these violations in the Meshoppen subwatershed, but it is more than 15 miles downstream. (link to EJ article about Dimock)
Leroy Township
O&G Violations and monitoring near Leroy Township, PA. Click to expand map.
Compared to the huge amount of oil and gas violations throughout the Dimock area, Leroy Township in Bradford County looks relatively quiet. It also appears to be well covered by monitoring locations, including a data logger site near the western edge of the township, a centrally located monthly monitoring location, as well as another monthly grab sample site upstream on Towanda Creek, just beyond the eastern boundary in Franklin Township.
And yet, this area was hit hard in the early part of the decade by two significant spills. On April 19, 2011, Chesapeake Appalachia lost control of the Atlas 2H well, with thousands of gallons of flowback fluid spilling onto the countryside and into the nearby Towanda Creek.
A little over a year later on July 4, 2012, a second major spill in the township saw 4,700 gallons of hydrochloric acid hit the ground. According to the DEP compliance report, this did not make it into the waterways, despite the gas well being located only about 550 feet from Towanda Creek, and less than 300 feet from another unnamed tributary.
Both incidents were within a reasonable distance of downstream monitoring locations. However, as these are grab sample sites that collect data once per month, they can only offer a limited insight into how Towanda Creek and its tributaries were impacted by these notable O&G related spills.
Bell Township
O&G violations and monitoring near Bell Township, PA. Click to expand map.
Bell Township is a small community in Clearfield County along the banks of the West Branch Susquehanna River. The northwestern portion of the township ultimately drains to the Ohio River, but all of the violations in Bell Township are within the Susquehanna River Basin.
Two significant incidents occurred in the township in 2016. On February 18, 2016, Alliance Petroleum Corp lost control of the McGee 11 OG Well, located less than 250 feet from Deer Run. According to the oil and gas compliance report, control of the well was regained five days later, after releasing unspecified quantities of gas, produced fluid, and crude oil. On December 5th of the same year, Exco Resources was cited for allowing 30 barrels (1,260 gallons) of produced fluid to spill at the Clyde Muth M-631 Wellpad in Bell Township.
A United States Geological Survey monthly monitoring location along the West Branch Susquehanna in nearby Greenwood Township is upstream, and could capture the effects of spills throughout much of Bell Township. However, the incident at the Clyde Muth well pad occurred in the Curry Run subwatershed, which meets up with the West Branch Susquehanna downstream of the monitoring location, so any pollution events in that area will not be reflected by monitoring efforts.
Conclusions
In the case of Dimock and Springville townships, we see how official water monitoring efforts capture only a fraction of the notorious cluster of wells that have resulted in hundreds of violations over the past decade. There could scarcely be a better candidate for systematic observation, and yet only a single grab sample site covers the immediate vicinity. Leroy Township does not have the same quantity of impacts as Dimock, but it did see one the worst blowouts in the recent history of O&G operations in Pennsylvania. The area is relatively well covered by grab samples sites, but due to the monthly sampling schedule, these locations would still be unlikely to capture significant changes in water quality. In Bell Township, much of the area is upstream of a monthly grab sample site, but the nearest downstream monitoring location to a major spill of produced fluid that occurred here is more than 17 miles away from the incident as the crow flies.
It should be noted that there are a number of industries and activities that contribute to water pollution in Pennsylvania, and as a result, the monitoring efforts are not specifically designed to capture oil and gas impacts. However, the compliance record shows heavy impacts from oil and gas wells in the basin, particularly from modern unconventional wells.
While the network of government-operated manual monitoring locations and data logger sites are fairly extensive in Susquehanna River Basin, these efforts are not sufficient to capture the full extent of oil and gas impacts in the region. Finding evidence of a small to medium sized spill at a site with monthly testing is unlikely, as contaminated water doesn’t stay in place in a dynamic river system. Data loggers also have a limited capacity, but are a useful tool for identifying substantial changes in water chemistry, and could therefore be employed to identify the presence of substantial spills. As such, it might be beneficial for additional data loggers to be distributed throughout the basin, particularly in areas that are heavily affected by the oil and gas industry. Furthermore, given resource gaps and staff cuts within agencies tasked with protecting the river basin, agencies should strongly consider utilizing networks of volunteers to augment their limited monitoring networks.
By Matt Kelso, Manager of Data and Technology, FracTracker Alliance
https://www.fractracker.org/a5ej20sjfwe/wp-content/uploads/2017/05/Susquehanna-2-Feature-WP.jpg400900Matt Kelso, BAhttps://www.fractracker.org/a5ej20sjfwe/wp-content/uploads/2025/09/2025-Wordmark-Logo.pngMatt Kelso, BA2017-05-02 13:17:582021-04-15 15:03:08Violations and Monitoring in Pennsylvania’s Susquehanna River Basin
By Alison Grass, Senior Researcher at Food & Water Watch
Over the past decade, the natural gas industry has experienced a renaissance that has been a boon to energy company profits. But it has altered the quality of life for the rural communities where most new gas wells have been drilled. Now, fracking is fueling a gas-fired power plant boom in Pennsylvania, with 47 new facilities. Most have already been approved, with a handful in commercial operation (see map below).
New research by Pennsylvanians Against Fracking shows, in vivid detail, the scale of this buildout, and the impacts it will have on Pennsylvania communities.
Current & Potential PA Gas-Fired Power Plants & their Emissions
Approximately half of the new gas power plants are located in northeastern region of Pennsylvania, a part of the state already overburdened by the lingering environmental maladies of coal mining and the more recent dangers associated with fracking. These rural communities may see increased drilling, fracking and pipeline construction to support the power plants — and the siting could be strategic. In a StateImpact Pennsylvania article about the first Marcellus shale gas power plant, for example, a company representative admitted that the location was chosen specifically due to its convenient access to shale gas. “This plant was sited precisely where it is because of its access to the abundant, high-quality natural gas that’s found a mile to two miles beneath our feet.”
Drilling Trends
The first modern Marcellus well was drilled in Pennsylvania by Range Resources in 2003, and commercial production began in 2005. Although fracking expanded rapidly in several areas across the country, Pennsylvania has been ground zero of the fracking boom, with just over 10,000 shale gas wells drilled between 2005 and 2016. Since then, however, there has been a rapid downturn in new wells drilled. After the early and dramatic increase in drilling – from 9 shale wells in 2005 to 1,957 shale wells in 2011 – the number dropped to 504 in 2016.
According to Natural Gas Intelligence, natural gas from the Appalachian Basin “…hit a roadblock in 2016, as pipeline projects struggled to move forward and a storage glut slowed the region’s previously rapid production growth.” Thus, it appears that in order to maintain fracking’s profitability, the gas industry is relying on new gas-fired power plants to alleviate the storage glut, while potentially increasing demand for shale gas (which could propagate more drilling and fracking).
Gas-Fired Power Plant Siting
The siting of these power plants also enables companies to use Pennsylvanian fracked gas to generate power for larger regional markets. This is because northeastern Pennsylvania is close to dense populations, including New York City. In Luzerne County, for instance, the new Caithness Moxie Freedom Generating Station gas-fired power plant will supply electricity to not just Pennsylvania residents, but also to New Jersey and New York State. And in the more central region of the state in Snyder County, the Panda Hummel Station will send “much of its power to the New York City market.”
Siting gas-fired power plants in the northeast may also increase drilling and fracking in the region, where gas is predominantly “dry” and less profitable than the “wet” gas found in southwest PA. This trend is largely due to a resurgence in North American petrochemical markets and increased ethane exports that rely on wet gas. (Dry natural gas contains primarily methane and smaller amounts of other hydrocarbons, while wet natural gas has higher concentrations of natural gas liquids. Natural gas liquids — predominantly ethane but also propane, butane, isobutane and pentanes — are the raw materials for manufacturing petrochemicals.)
Well Integrity and Other Risks
However, increased drilling and fracking mean more pollution for the Marcellus shale region of Pennsylvania, where shale gas wells have proven to be more prone to well construction “impairments” and well integrity problems, compared to conventional wells. This risk is especially true in the northeastern part of the state, where over nine percent of shale gas wells have indications of compromised well integrity.
Overall, fracking causes many public health and environmental problems. Methane, fracking fluids, and wastewater can pollute water supplies and imperil the livelihoods of farmers, who rely on clean water. Increased truck traffic and drilling emissions reduce air quality, and methane leaks contribute to global warming. Meanwhile, the proliferation of natural gas derricks and associated infrastructure destroys pristine landscapes (and related tourism and recreation industries).
The last thing that Pennsylvanians need is another way for the oil and gas industry to capitalize on shale at the expense of residents’ health and well-being.
https://www.fractracker.org/a5ej20sjfwe/wp-content/uploads/2017/03/Power-Plants-PA-Feature.jpg400900Guest Authorhttps://www.fractracker.org/a5ej20sjfwe/wp-content/uploads/2025/09/2025-Wordmark-Logo.pngGuest Author2017-04-21 13:34:192021-04-15 15:03:09Wanted: More Places to Burn Natural Gas
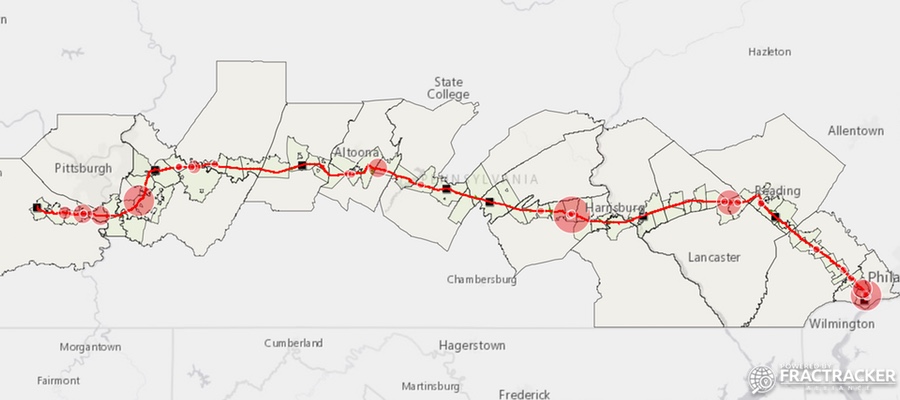

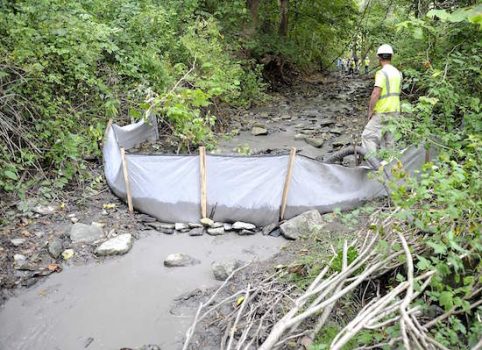
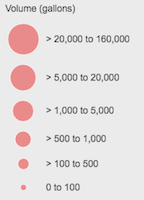 The Pennsylvania Department of Environmental Protection (DEP) posted information on potential regulatory violations associated with these IRs on the PA Pipeline Portal website on July 24, 2017. This original file listed 49 spill locations. Our original map was based on those locations. As part of their legal filing, volunteer at the Clean Air Council (CAC) have parsed through DEP documents to discover 90 unique spills at these and other locations. On July 31, 2017, the DEP posted a new file that now lists 61 spills, which account for some of these discrepancies but not all.
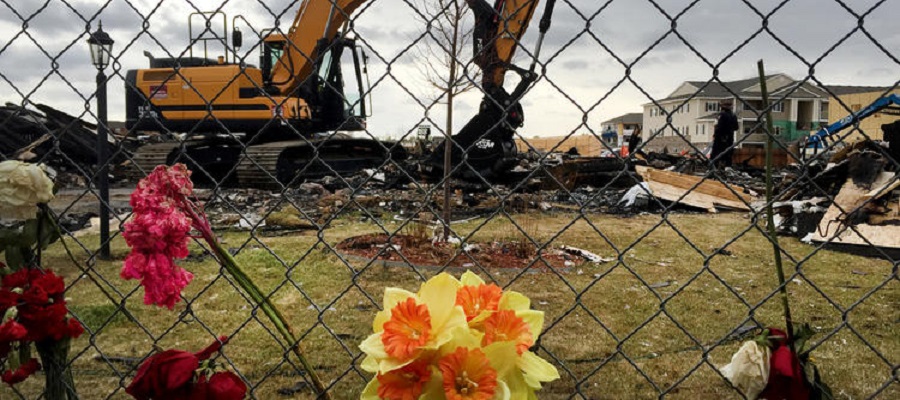
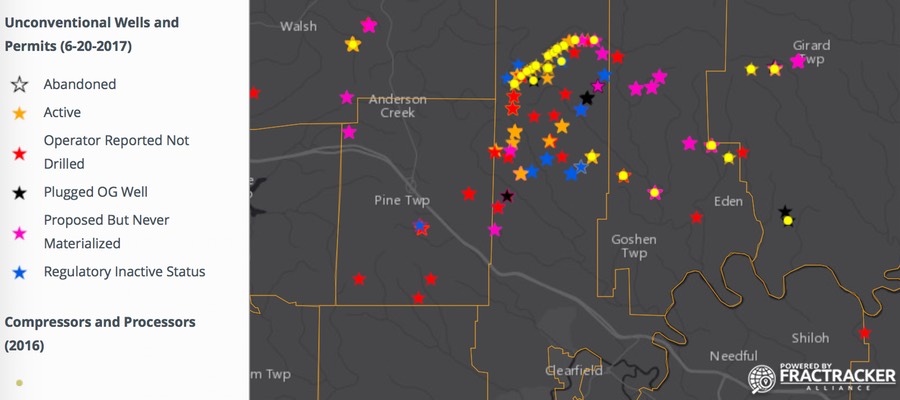
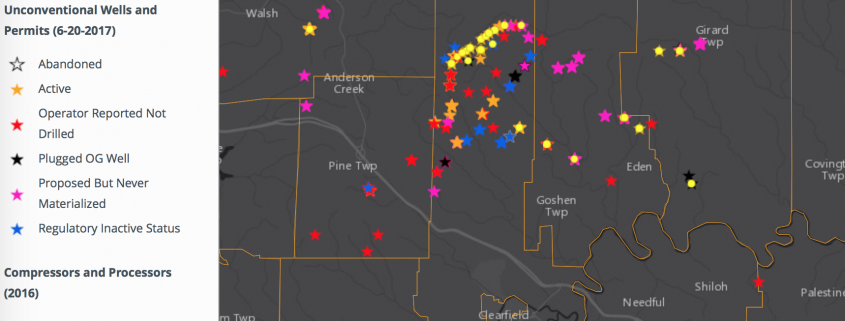
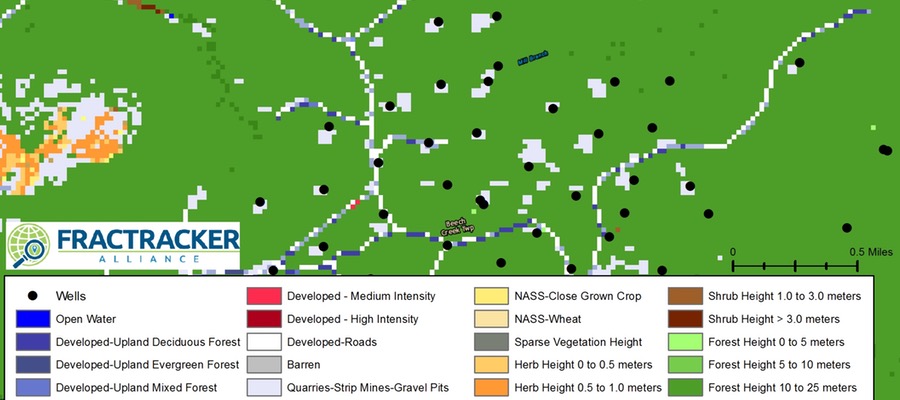
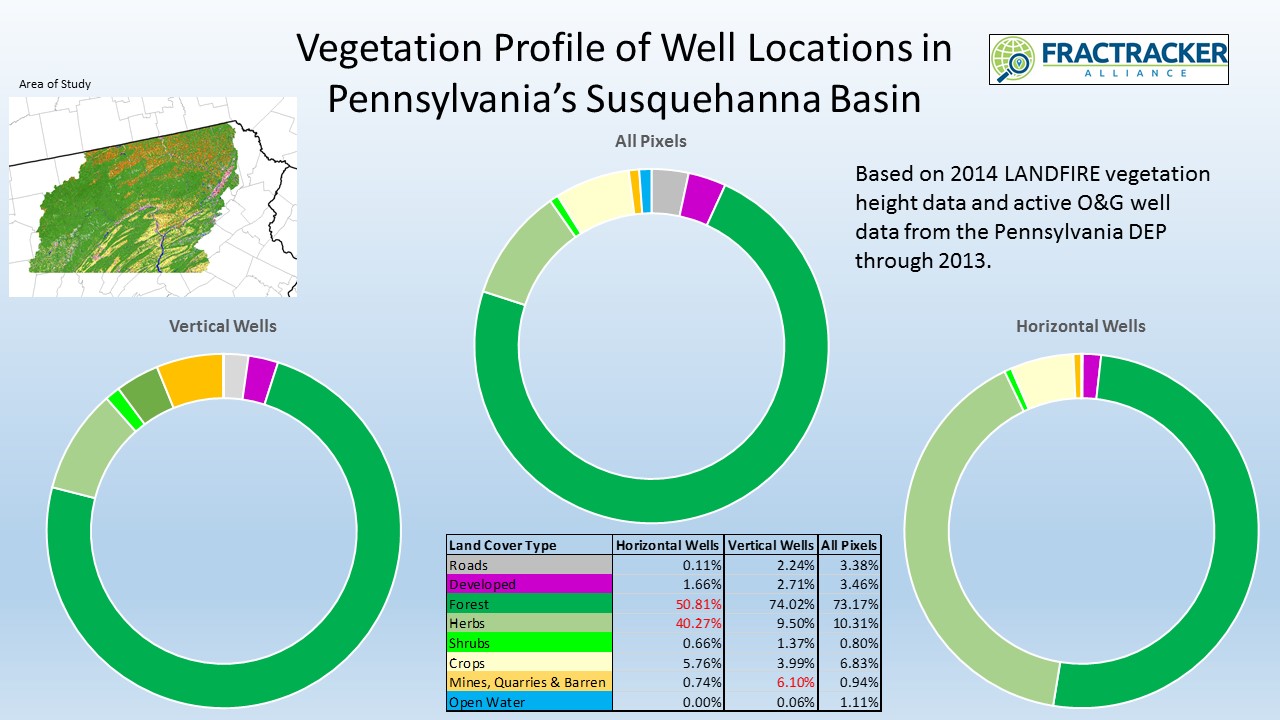
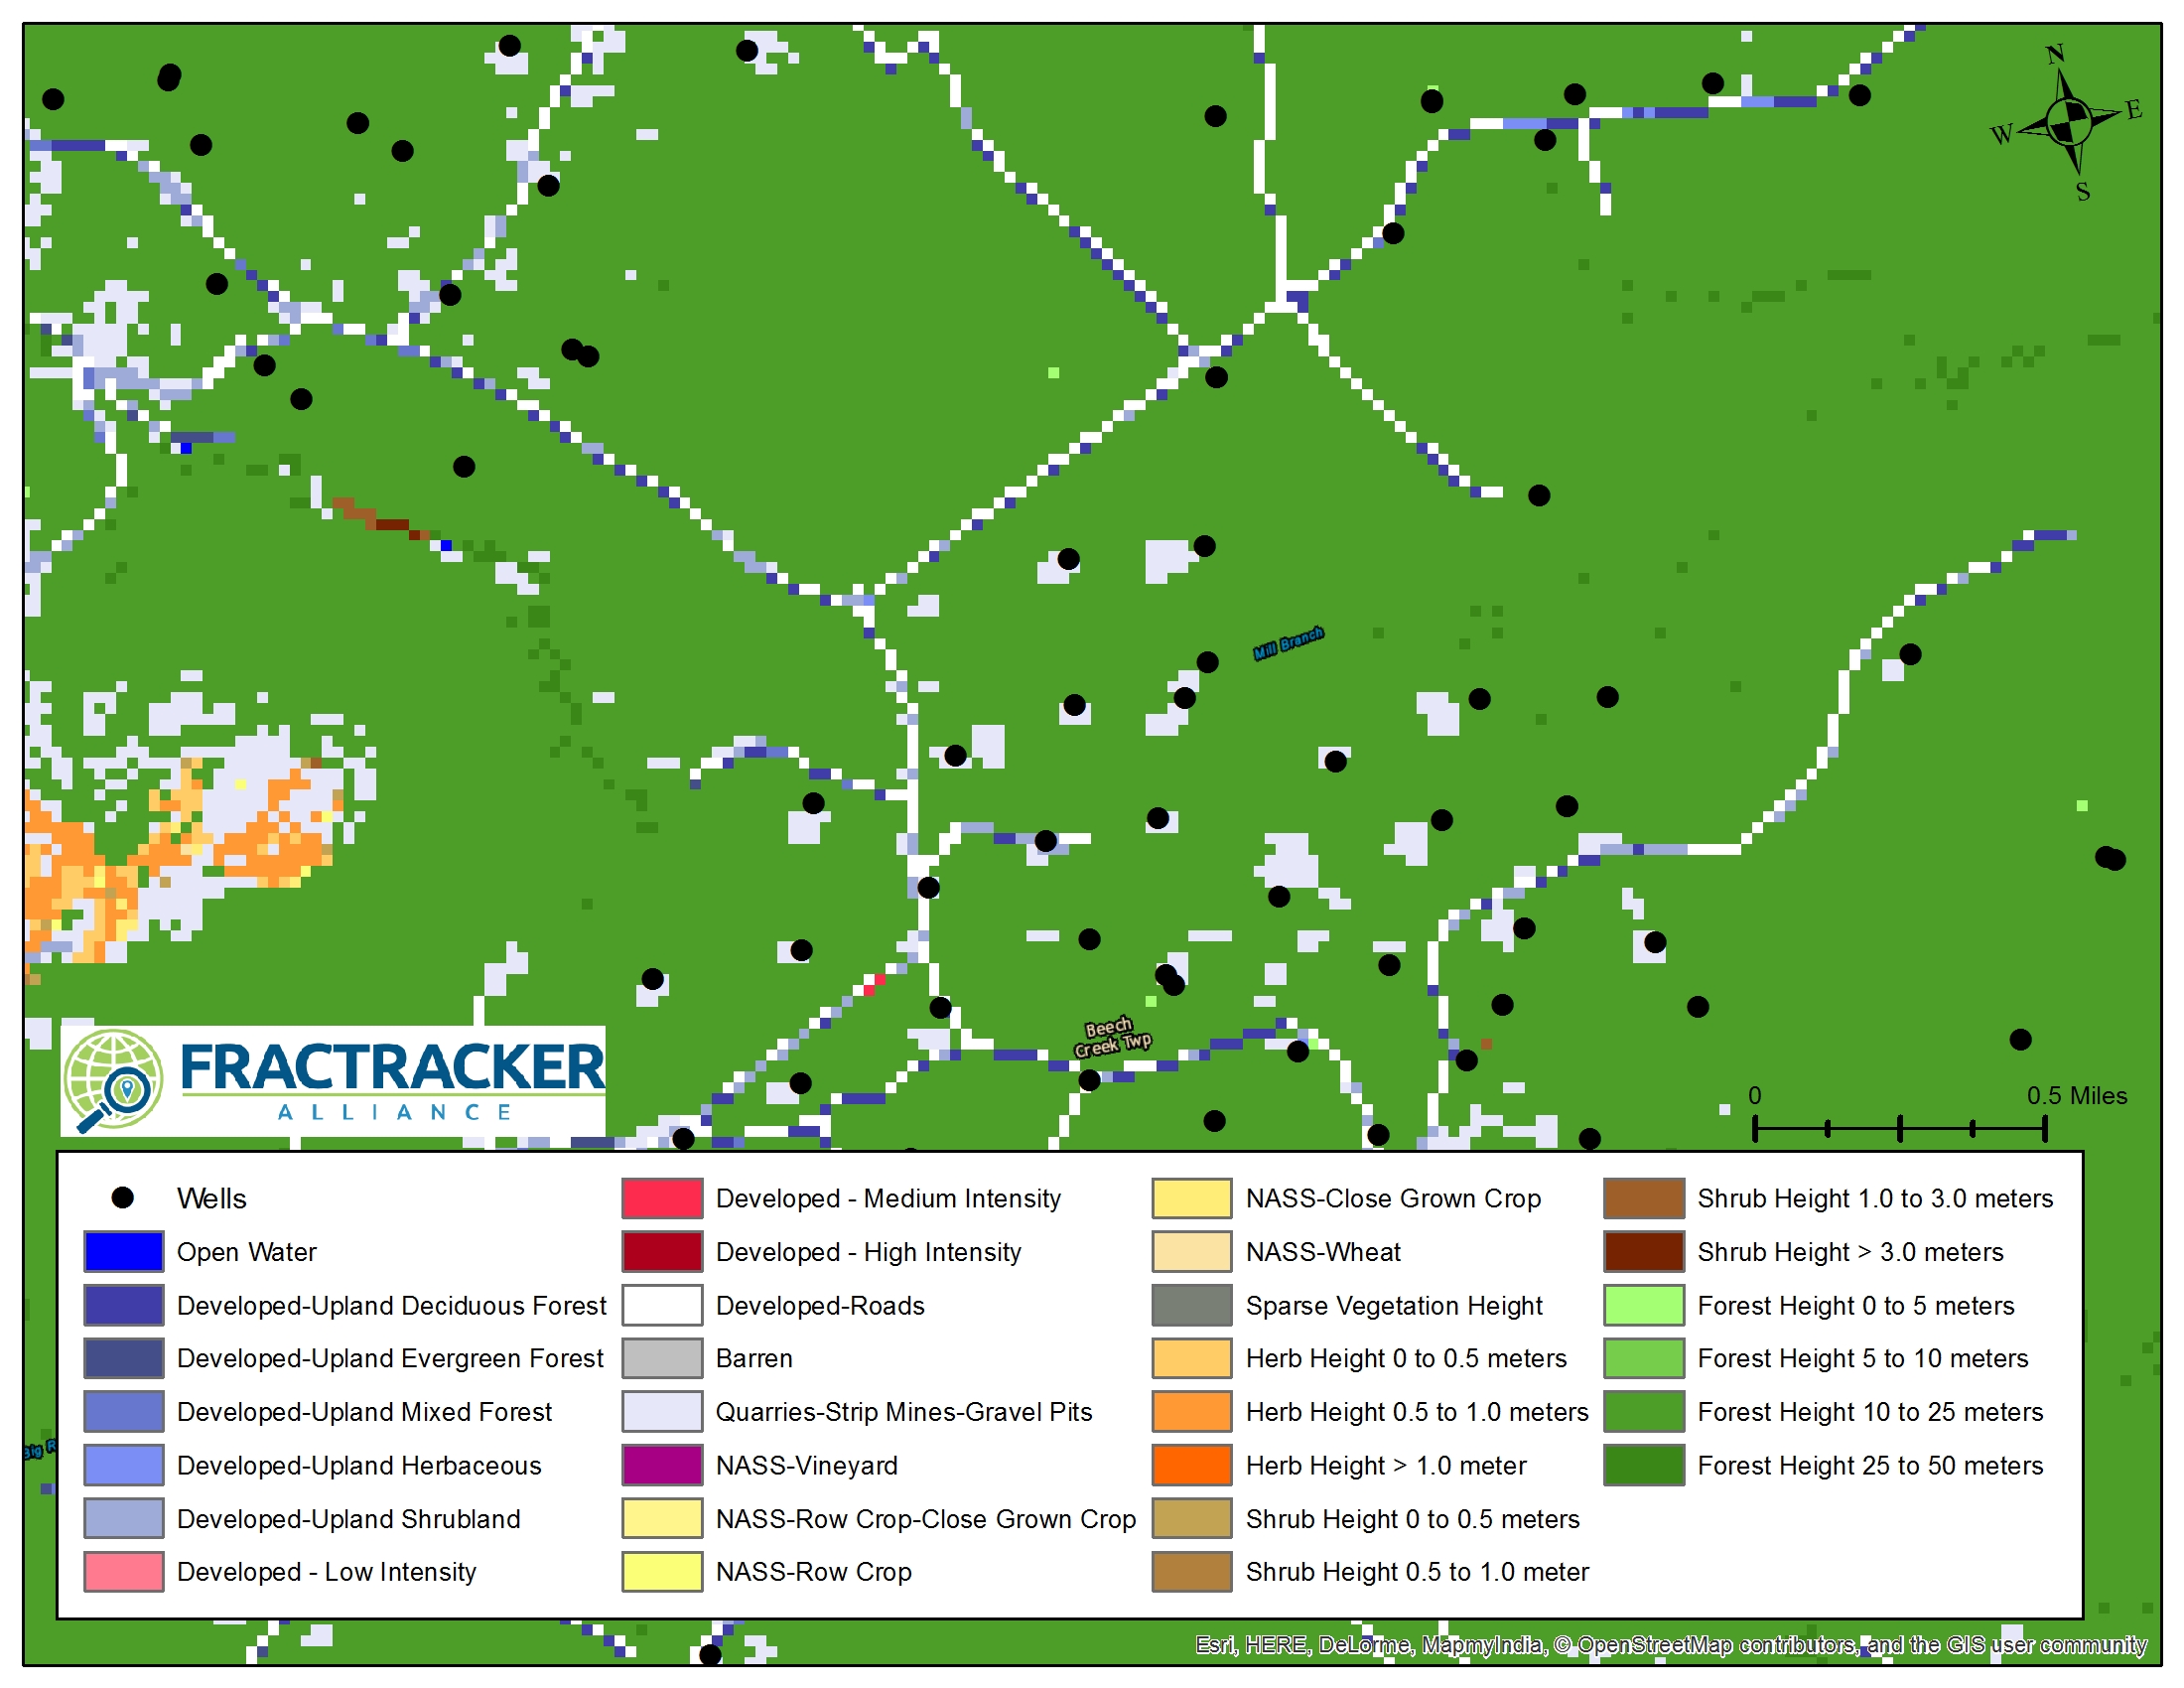
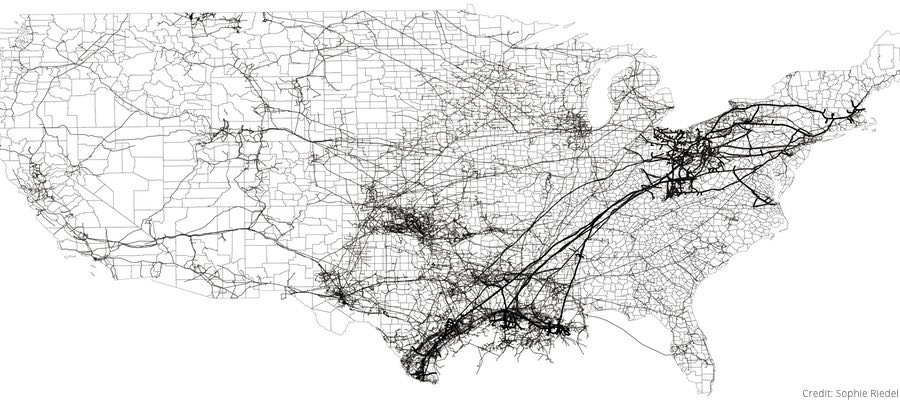

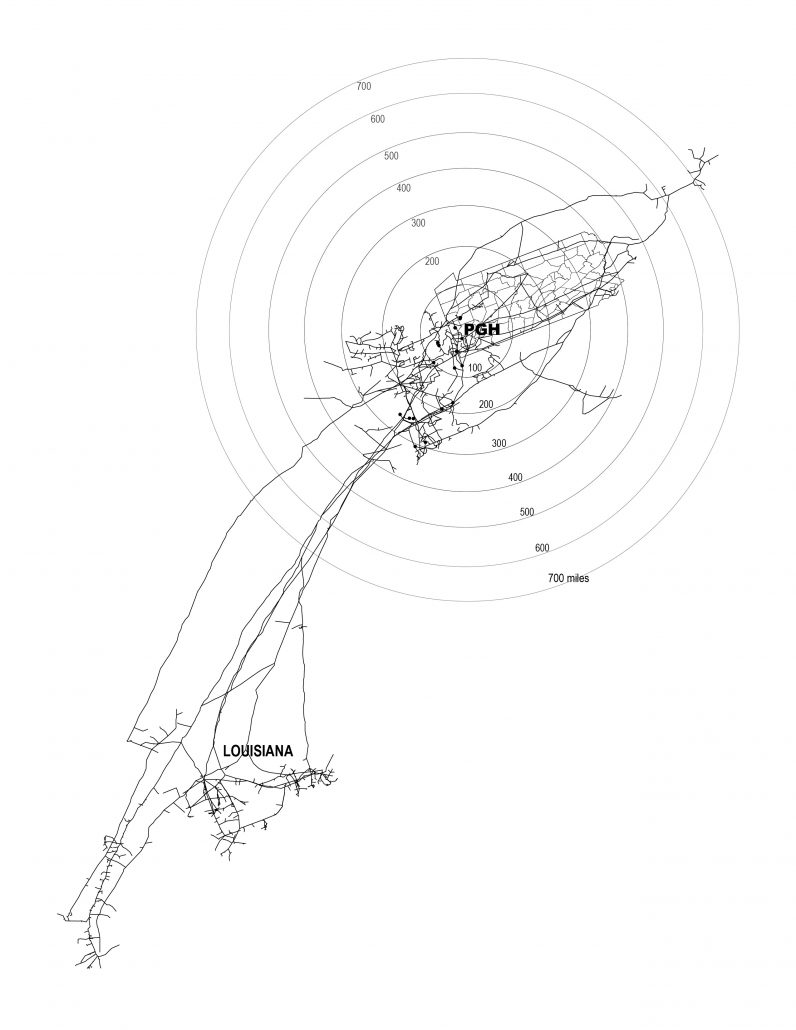
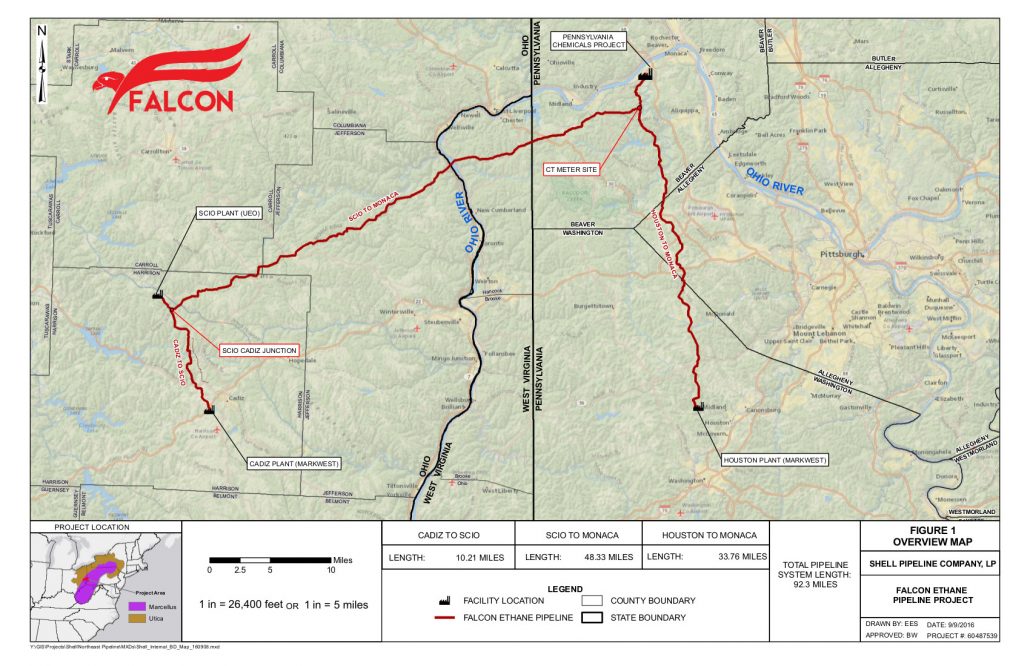
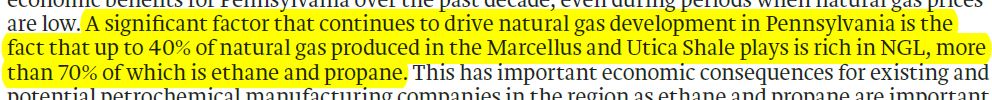

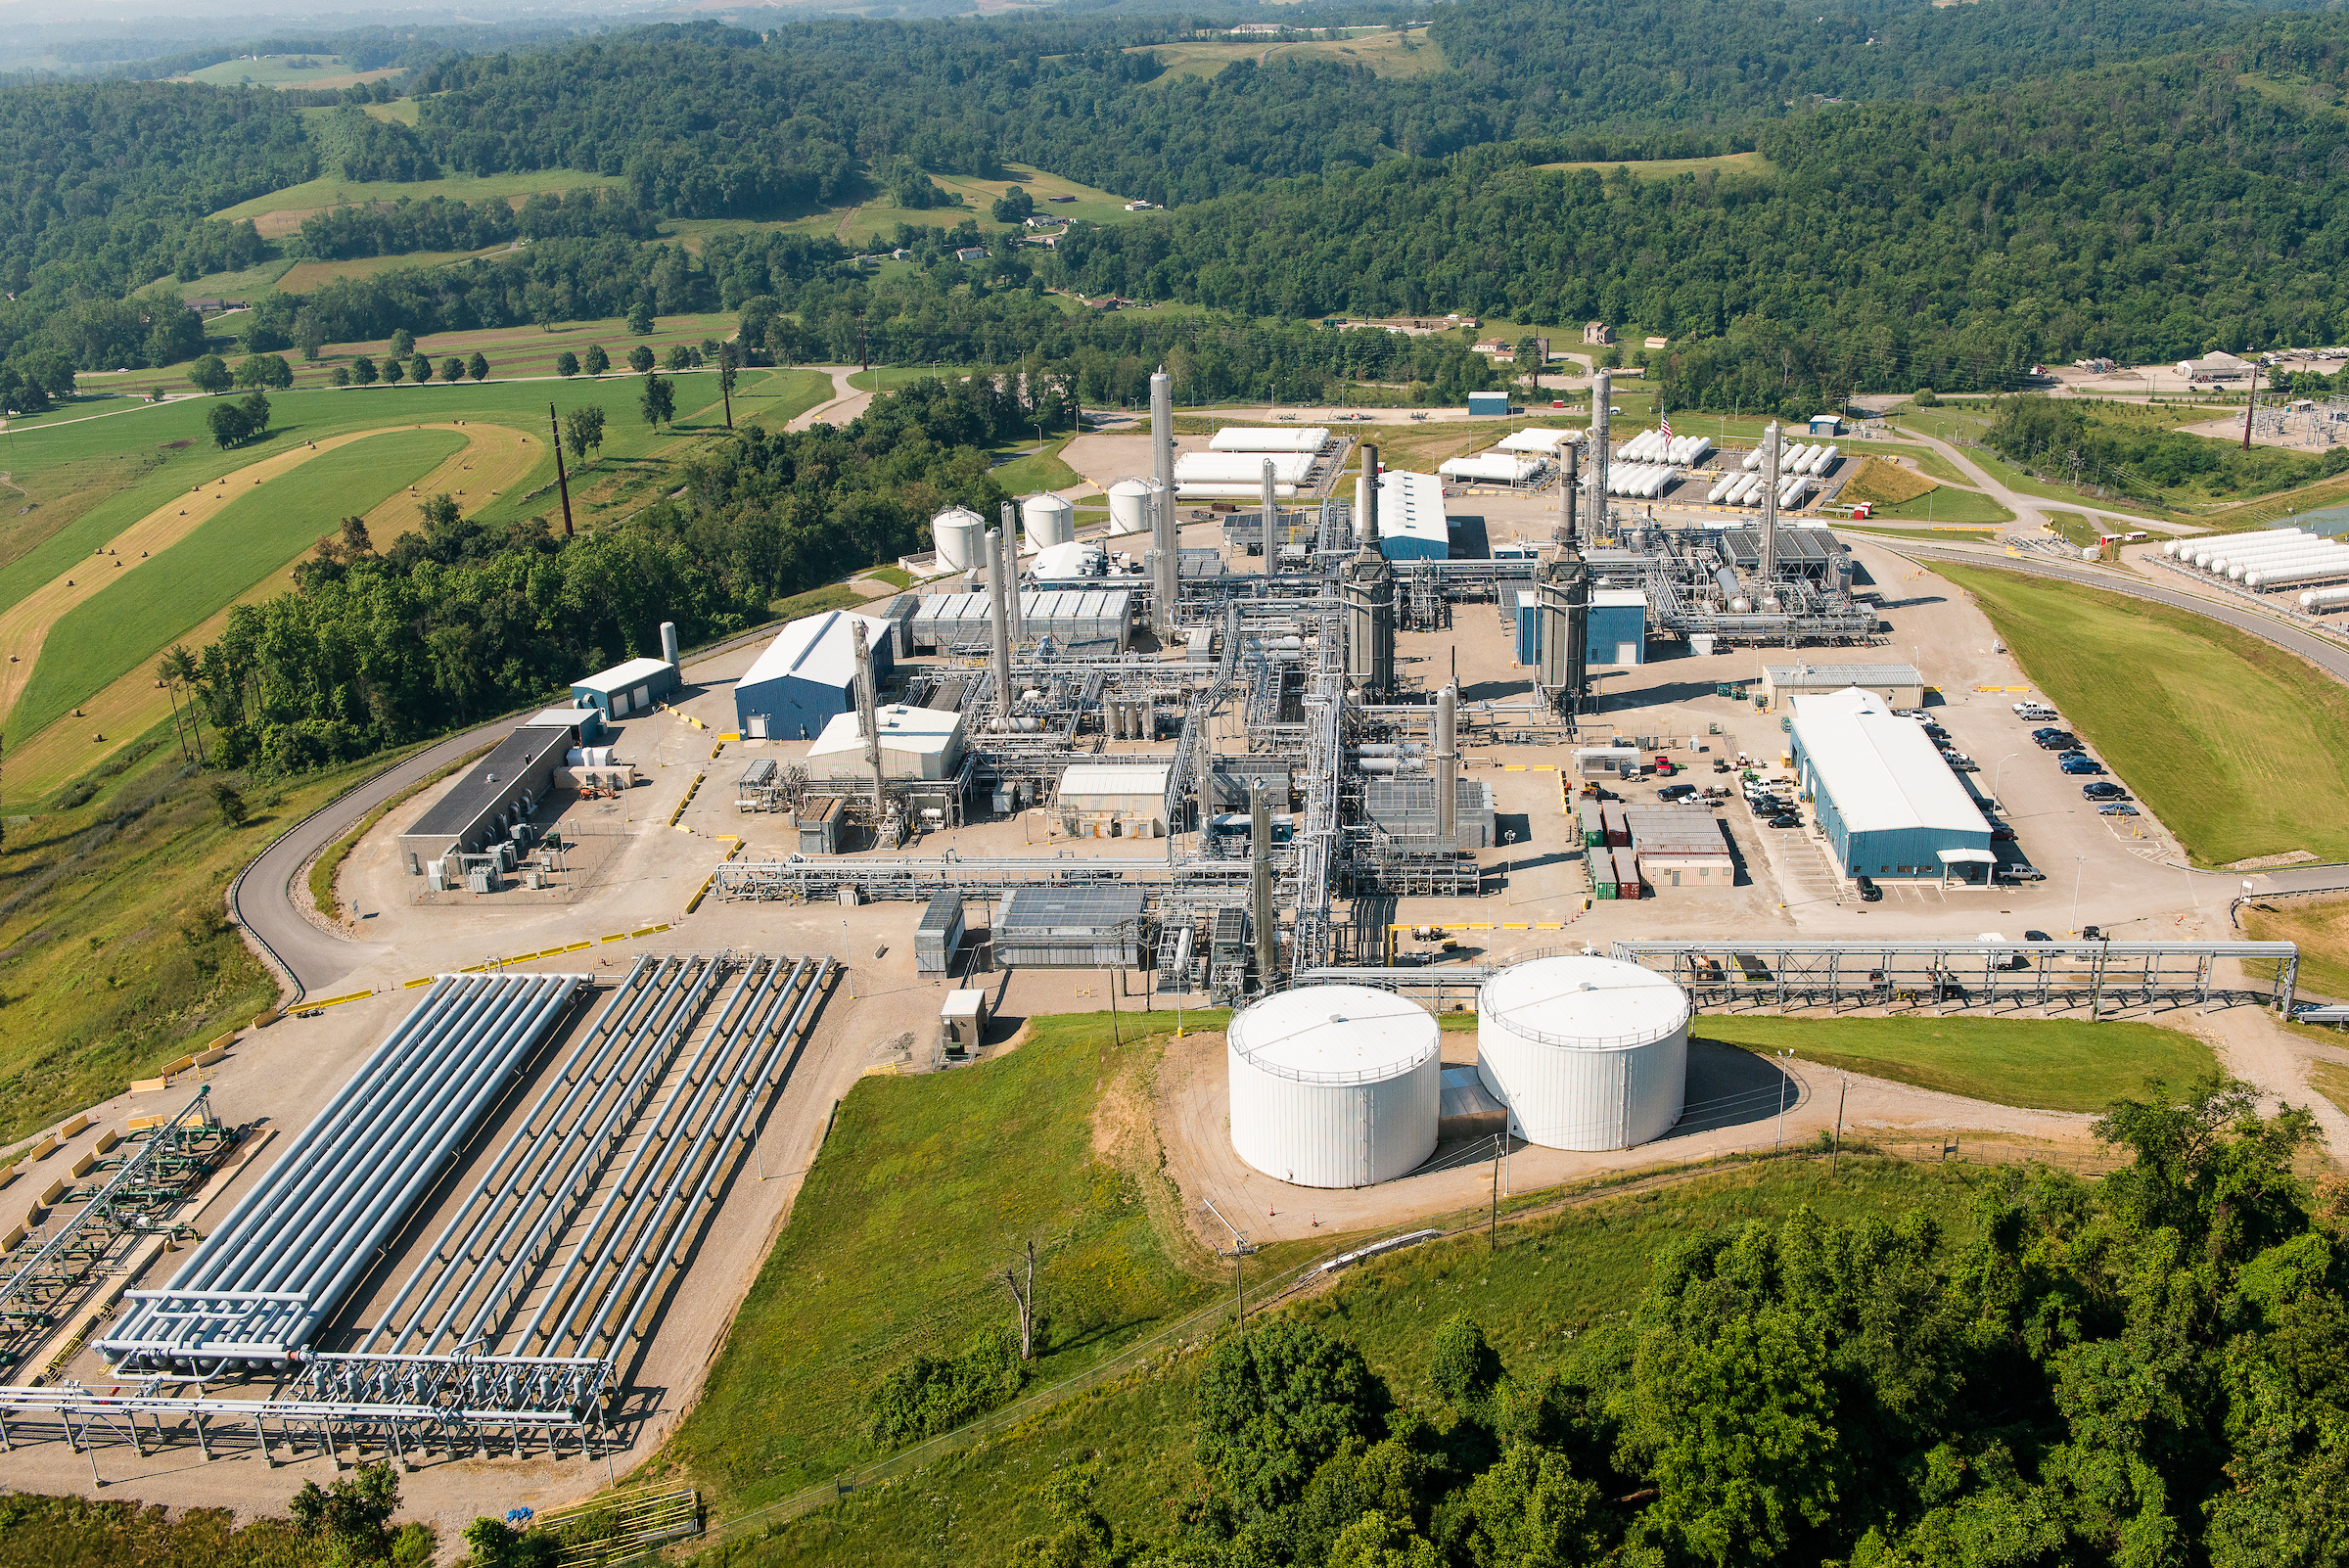
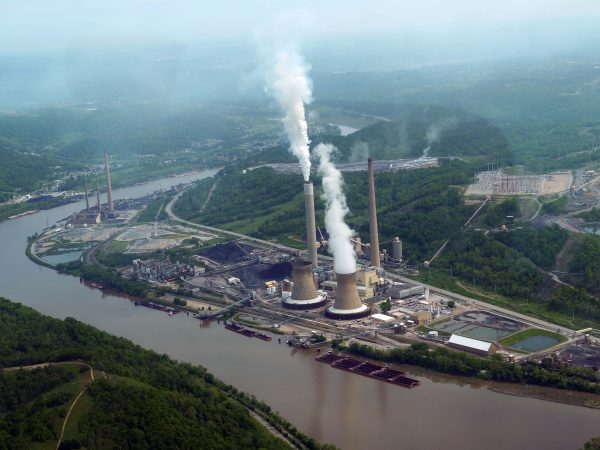


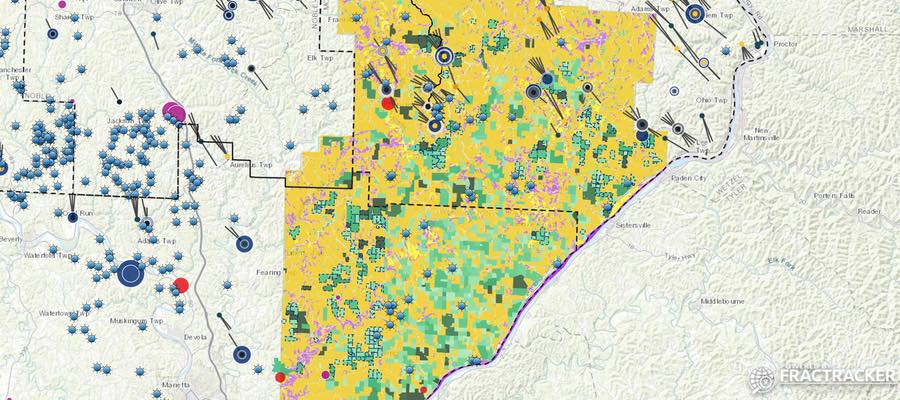


")
")
")
")
")
")

")

")


")
")