Tracking Refinery Emissions in California’s Bay Area Refinery Corridor
Air quality in the California Bay Area has been steadily improving over the last decade, and the trend can even be seen over just the course of the last few years. In this article we explore data from the ambient air quality monitoring networks in the Bay Area, including a look at refinery emissions.
From the data and air quality reports we find that that many criteria pollutants such as fine particulate matter (PM2.5) and oxides of nitrogen (NOX) have decreased dramatically, and areas that were degraded are now in compliance.
While air pollution from certain sectors such as transportation have been decreasing, the north coast of the East Bay region is home to a variety of petrochemical industry sites. This includes five petroleum refineries. The refineries not only contribute to these criteria pollutants, but also emit a unique cocktail of toxic and carcinogenic compounds that are not monitored and continue to impact cardiovascular health in the region. This region, aptly named the “refinery corridor” has a petroleum refining capacity of roughly 800,000 BPD (barrels per day) of crude oil.
Petroleum refineries in California’s East Bay have always been a contentious issue, and several of the refineries date back to almost the turn of the 20th century. The refineries have continuously increased their capacities and abilities to refine dirtier crude oil through “modernization projects.” As a result, air quality and health impacts became such a concern that in 2006 and again in 2012, Gayle McLaughlin, a Green Party candidate, was elected as Mayor of the City of Richmond. Richmond, CA became the largest city in the U.S. with a Green Party Mayor. While there have been many strides in the recent decade to clean up these major sources of air pollution, health impacts in the region including cardiovascular disease and asthma, as well as cancer rates, are still disproportionately high.
Regulations
To give additional background on this issue, let’s discuss some the regulations tasked with protecting people and the environment in California, as well as climate change targets.
New proposals for meeting California’s progressive carbon emissions standards were proposed in January of 2017. A vote to decide on the plan to meet the aggressive new climate target and reduce greenhouse gas emissions 40% across all sectors of the economy will happen this month, May 2017! Over the last ten years the refineries have invested in modernization projects costing more than $2 billion to reduce emissions.
However – a current proposal will actually allow the refineries to process more crude oil by setting a standard for emissions by volume of crude/petroleum refined, rather than an actual cap on emissions. The current regulatory approach focuses on “source-by-source” regulations of individual equipment, which ignores the overall picture of what’s spewing into nearby communities and the atmosphere. Even the state air resources board has supported a move to block the refineries from accepting more heavy crude from the Canadian tar sands.
New regulatory proposals incentivize refineries to continue expanding operations to refine more oil, resulting in a larger burden on the health of these already disproportionately impacted environmental justice communities. Chevron, in particular, is upgrading their Richmond refinery in a way as to allow it to process dirtier crude in larger volumes from the Monterey Shale and Canada’s Tar Sands. Since the production volumes of lighter crudes are shrinking, heavier dirtier crudes are becoming a larger part of the refinerys’ feedstocks. Heavier crudes require more energy to refine and result in larger amounts of hazardous emissions.
Upgrades are also being implemented to address greenhouse gas emissions. While the upgrades address the carbon emissions, regulatory standards without strict caps for other pollutants will allow emissions of criteria and toxic air pollutants such as VOC’s, nitrosamines, heavy metals, etc… to increase. In fact, newly proposed emissions standards for refineries will make it easier for the refineries to increase their crude oil volumes by regulating emissions on per-barrel standards. Current refining volumes can be seen below in Table 1, along with their maximum capacity.
Table 1. Bay Area refineries average oil processed and total capacity
| Refinery | Location | Ave. oil processed Barrels Per Day (2012 est.) |
Max. capacity (BPD) |
| Chevron U.S.A. Inc. Richmond Refinery | Richmond | 245,271 | >350,000 |
| Tesoro Refining & Marketing, Golden Eagle Refinery | Martinez | 166,000 | 166,000 |
| Shell Oil Products US, Martinez Refinery | Martinez | 156,400 | 158,000 |
| Valero Benicia Refinery | Benicia | 132,000 | 150,000 |
| Phillips 66, Rodeo San Francisco Refinery | Rodeo | 78,400 | 100,000 |
Source: California Energy Commission. One barrel of oil = 42 U.S. gallons.
Environmental Health Inequity
The Bay Area, and in particular the city of Richmond, have been noted in the literature as a place where environmental racism and environmental health disparity exist. The city’s residents of color disproportionately live near the refineries and chemical plants, which is noted in early works on environmental racism by pioneers of the idea, such as Robert Bullard (Bullard 1993a,b).
Since the issue has been brought to national attention by environmental justice groups like West County Toxics Coalition, progress has been made to try to bring justice, but it has been limited. People of color are still disproportionately exposed to toxic, industrial pollution in that area. A recent study showed 93% of respondents in Richmond were concerned about the link between pollution and health, and 81% were concerned about a specific polluter, mainly the Chevron Refinery (Brody et al. 2012). Recent health reports continue to show the trend that these refinery communities suffer disproportionately from cases of asthma and cardiovascular disease and higher mortality rates from a variety of cancers.
Health Impact Studies
Manufacturing and refining are known to produce particularly toxic pollution. Additionally, there has been research done on the specific makeup of pollution in the refinery corridor. The best study to do this is the Northern California Household Exposure Study (Brody et al. 2009). They examined indoor and outdoor air in Richmond, a refinery corridor community, and Bolinas, a nearby but far more rural community. They found 33% more compounds in Richmond, along with higher concentrations of each compound. The study also found very high concentrations of vanadium and nickel in Richmond, some of the highest levels in the state. Vanadium and nickel have been shown to be some of the most dangerous PM2.5 components as we previously stated, which gives reason to believe the air pollution in Richmond is more toxic than in surrounding areas.
Another very similar study compared the levels of endocrine disrupting compounds in Richmond and Bolinas homes, and found 40 in Richmond homes and only 10 in Bolinas (Rudel et al. 2010). This supports the idea that a large variety of pollutants with synergistic effects may be contributing to the increased mortality and hospital visits for communities in this region. This small body of research on pollution in Richmond suggests that the composition of air pollution may be more toxic and thus trigger more pollution-related adverse health outcomes than in surrounding communities.
Air Quality Monitoring
As discussed above and in FracTracker’s previous reports on the refinery corridor, the refinery emissions are a unique cocktail whose synergistic effects may be driving much of the cardiovascular disease, asthma, and cancer risk in the region. Therefore, the risk drivers in the Bay Area need to be prioritized, in particular the compounds of interest emitted by the petrochemical facilities.
The targets for emissions monitoring are compounds associated with the highest risk in the neighboring communities. An expert panel was convened in 2013 to develop plans for a monitoring network in the refinery corridor. Experts found that measurements should be collected at 5 minute intervals and displayed to the public real-time. The gradient of ambient air concentrations is determined by the distance from refinery, so a network of three near-fence-line monitors was recommended. Major drivers of risk are supposed to be identified by air quality monitoring conducted as a part of Air District Regulation 12m Rule 15: Petroleum Refining Emissions tracking. According to the rule, fence-line monitoring plans by refinery operators:
… must measure benzene, toluene, ethyl benzene, and xylenes (BTEX) and HS concentrations at refinery fence-lines with open path technology capable of measuring in the parts per billion range regardless of path length. Open path measurement of SO2, alkanes or other organic compound indicators, 1, 3-butadiene, and ammonia concentrations are to be considered in the Air Monitoring Plan.
The following analysis found that the majority of hazardous pollutants emitted from refineries are not monitored downwind of the facility fence-lines, much less the list explicitly named in the regulations above.
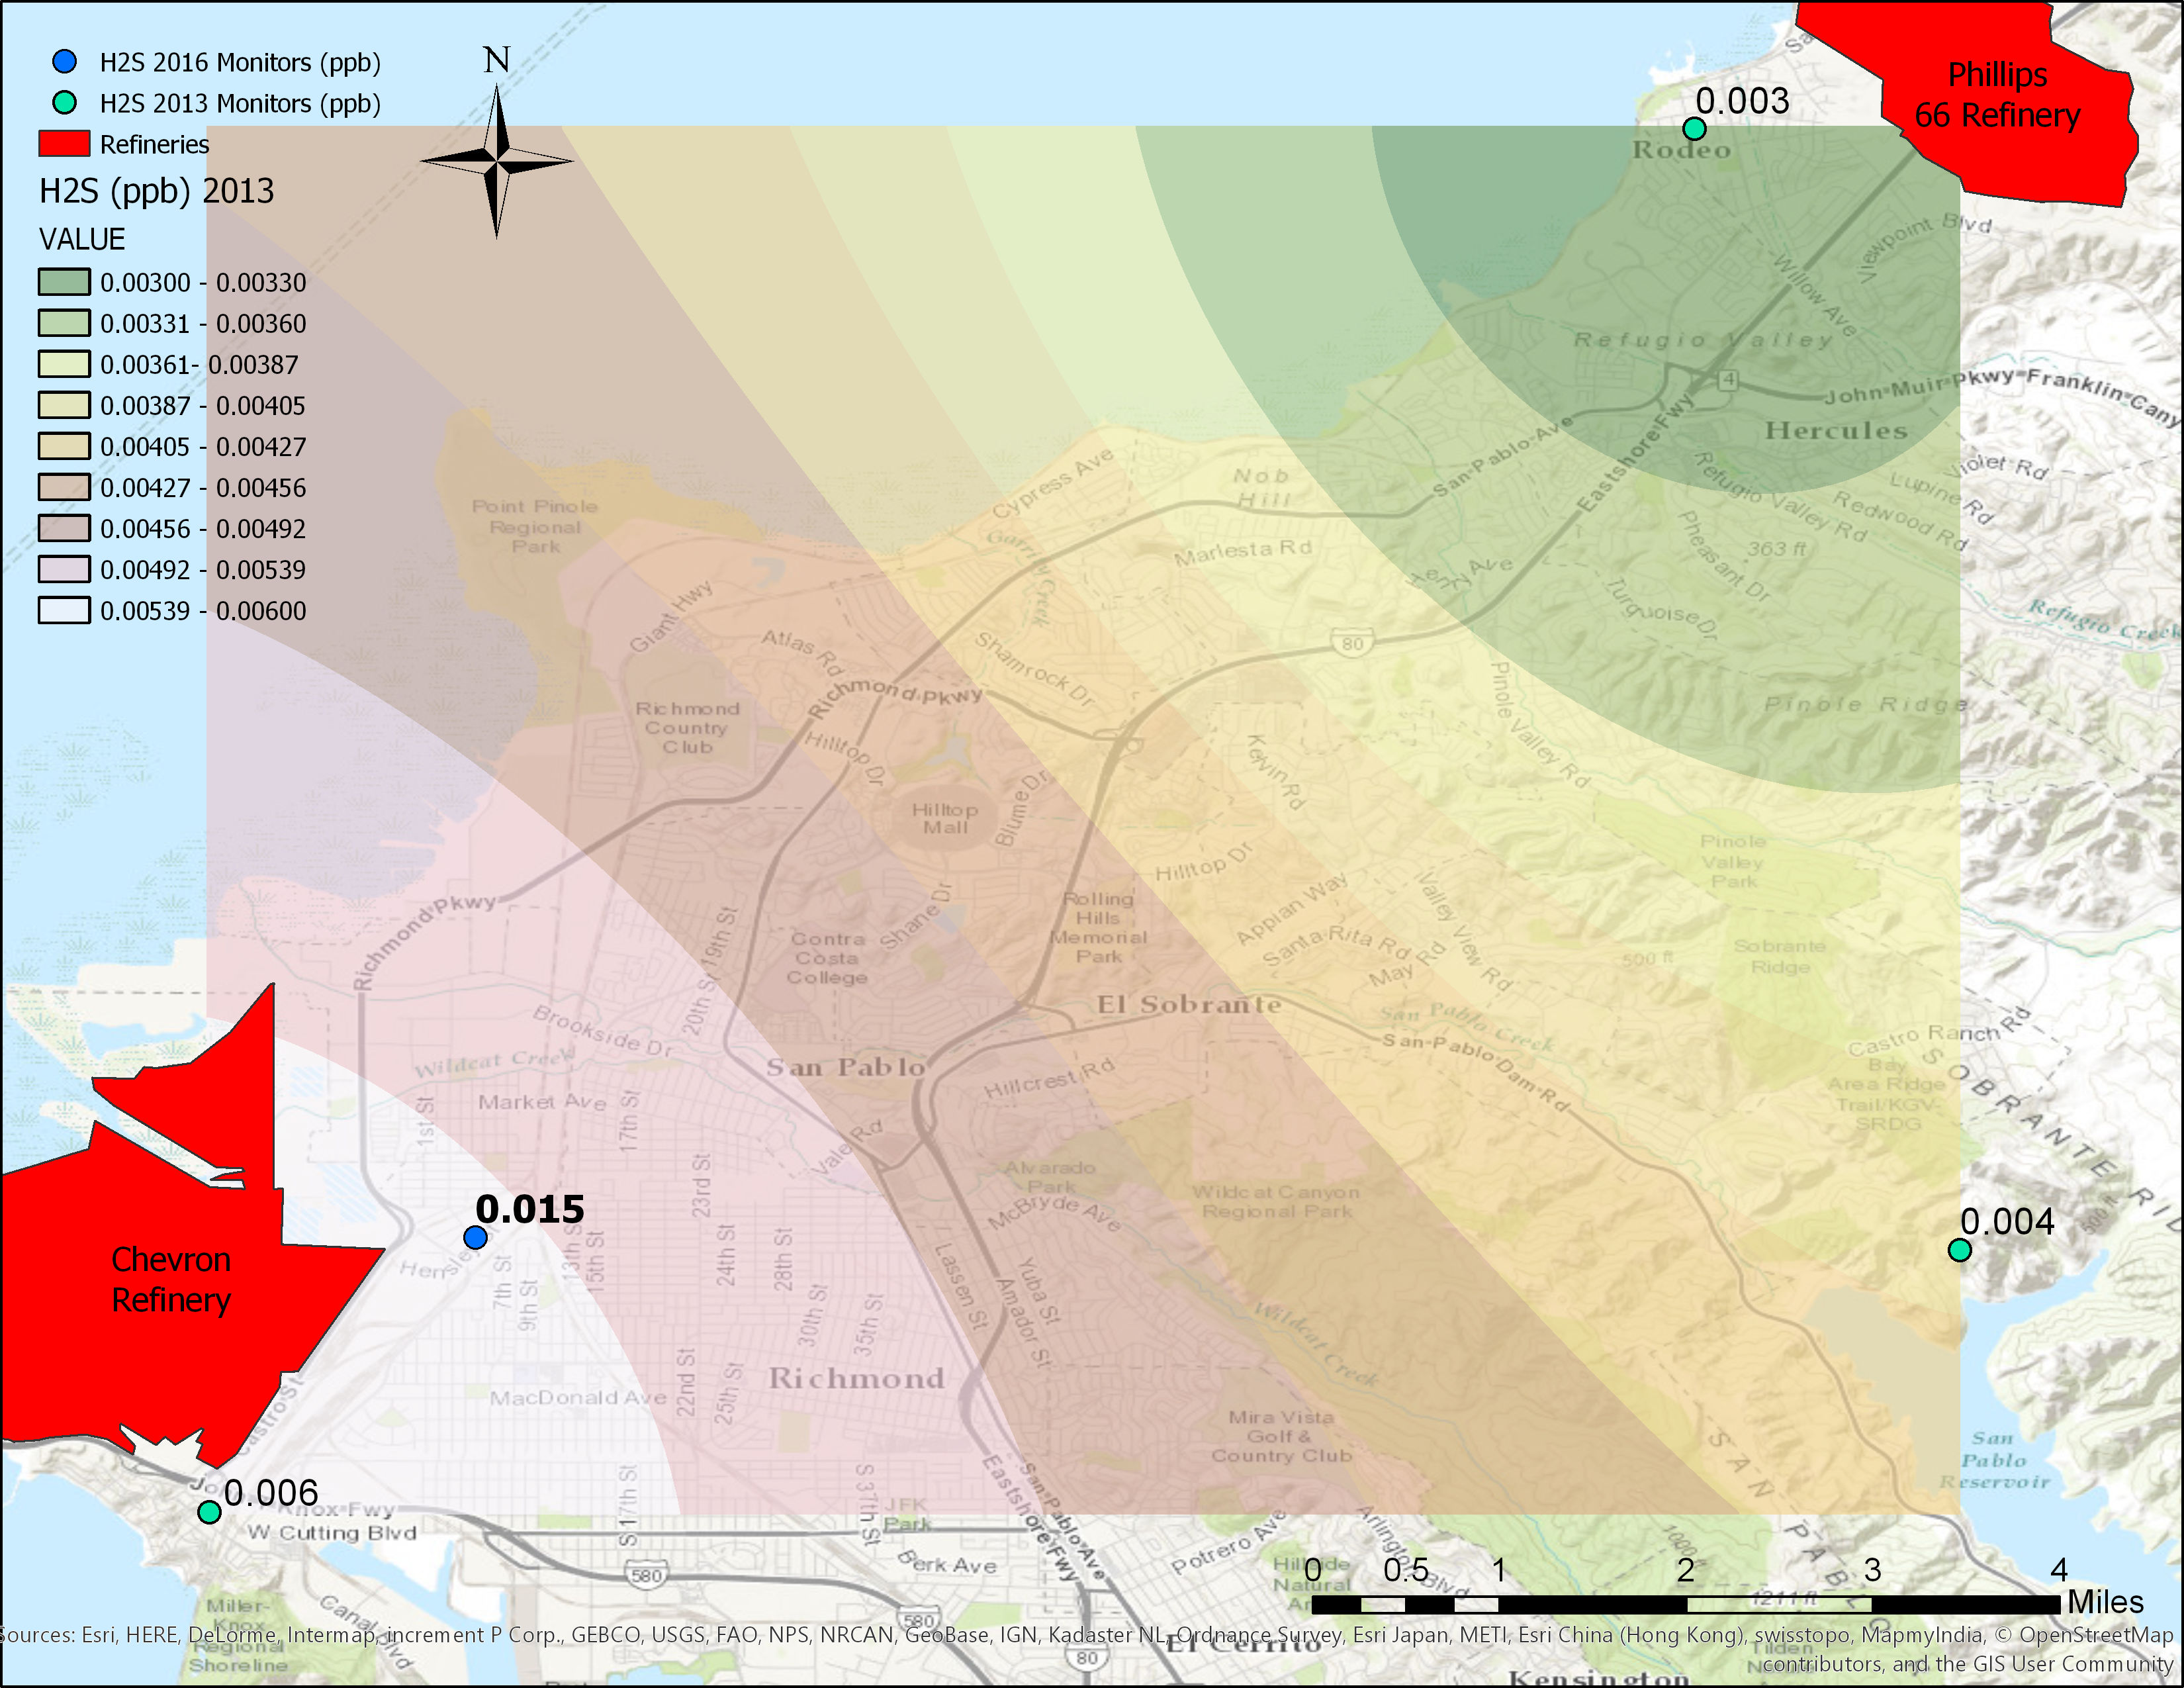
As shown below in Figure 1, the most impacted communities are in those directly downwind of the facility. According to the BAAQMD, each petroleum refinery is supposed to have fence-line monitoring. Despite this regulation developed by air quality and health experts, only two out of the five refineries have even one fence-line monitor. Real-time air monitoring data at the Chevron Richmond fence-line monitor and the Phillips 66 Rodeo fence-line monitor can be found on fenceline.org. Data from these monitors are also aggregated by the U.S. EPA, and along with the other local monitors, can be viewed on the EPA’s interactive mapping platform.
Figure 1. Map of Hydrogen Sulfide Emissions from the Richmond Chevron Refinery
Hazardous Emissions and Ambient Pollution
Since the majority of hazardous chemicals emitted from the refineries are not measured at monitoring sites, or there are not any monitoring sites at the fence-line or downwind of the facility, our mapping exercises instead focus on the hazardous air pollution for which there is data.
As shown in the map of hydrogen sulfide (H2S) above, the communities immediately neighboring the refineries are subjected to the majority of hazardous emissions. The map shows the rapidly decreasing concentration gradient as you get away from the facility. H2S would have been a good signature of refinery emissions throughout the region if there were more than three monitors. Also, those monitors only existed until 2013, when they were replaced with a singular monitor in a much better location, as shown on the map. The 2016 max value is much higher because it is more directly downwind of Chevron Refinery.
The interpolated map layer was created using 2013 monitoring data from three monitors that have since been removed. The 2016 monitoring location is in a different location and has a maximum value more than twice what was recorded at the 2013 location.
Table 2. Inventory of criteria pollutant emissions for the largest sectors in the Bay Area
| Annual average tons per day | ||||||
| PM10 | PM2.5 | ROG | NOX | SOX | CO | |
| Area wide | 175.51 | 52.90 | 87.95 | 19.92 | 0.62 | 161.86 |
| Mobile | 20.33 | 16.27 | 183.12 | 380.52 | 14.93 | 1541.50 |
| Total Emissions | 16.30 | 12.14 | 106.58 | 50.59 | 45.95 | 44.31 |
Table adapted from the BAAQMD Refinery Report. PM10 = particulate matter less than 10 microns in diameter (about the width of a human hair); PM2.5 = PM less than 2.5 microns in diameter; ROG = reactive organic gases; NOX = nitrogen oxides; SOX = sulfur oxides; CO = carbon monoxide.
Additionally, exposure assessment can also rely on using surrogate emissions to understand where the plumes from the refineries are interacting with the surrounding communities. It is particularly important to also discriminate between different sources of pollution. As we see in Table 2 above, the largest volume of particulate matter (PM), NOX, and CO emissions actually come from mobile sources, whereas the largest source of sulfur dioxide and other oxides (SOX) is from stationary sources. Since the relationship between PM2.5 and health outcomes is most established, the response to ambient levels of PM2.5 in the refinery corridor gives insight into the composition of PM as well as the presence of other species of hazardous air pollution. On the other hand, SO2 can be used as a surrogate for the footprint of un-monitored air toxics.
Pollutants’ Fingerprints
Particulate Matter
Figure 2. Map of fine particulate matter (PM2.5) for the Bay Area Air Quality Management District
View map fullscreen | How FracTracker maps work
Figure 2 above displays ambient levels of PM2.5, and as the map shows, the highest levels of particulate matter surround the larger metro area of downtown Oakland and also track with the larger commuting corridors. The map shows evidence that the largest contributor to PM2.5 is truly the transportation (mobile) sector. PM2.5 is one hazardous air pollutant which negatively impacts health, causing heart attack, or myocardial infarction (MI), among other conditions. PM2.5 is particulate matter pollution, meaning small particles suspended in the air, specifically particles under 2.5 microns in diameter. Exposure to high levels of PM2.5 increases the risk of MI within hours and for the next 1-2 days (Brooks et al. 2004; Poloniecki et al. 1997).While refineries may not be the largest source of PM in the Bay Area, they are still large point sources that contribute to high local conditions of smog.
The chemical make-up of the particulate matter also needs to be considered. In addition, the toxicity of PM from the refineries is of particular concern. Since particulate matter acts like small carbon sponges, the source of PM affects its toxicity. The cocktail of hazardous air toxics emitted by refineries absorb and adsorb to the surfaces of PM. When inhaled with PM, these toxics including heavy metals and carcinogens are delivered deep into lung tissue.
Pooled results of many studies showed that for every 10 micrograms per meter cubed increase in PM2.5 levels, the risk of MI increases 0.4-1% (Brooks et al. 2010). However, this relationship has not been studied in the context of EJ communities. EJ communities are generally low income communities of color (Bullard 1993), which have higher exposures to pollution, more sources of stress, and higher biological markers of stress (Szanton et al. 2010; Carlson and Chamberlein 2005). All of these factors may affect the relationship between PM2.5 and MI, and increase the health impact of pollution in EJ communities relative to what has been found in the literature.
Sulfur Dioxide
Figure 3 below shows the fingerprint of the refinery emissions on the refinery corridor, using SO2 emissions as a surrogate for the cocktail of toxic emissions. The relationship between SO2 and health endpoints of cardiovascular disease and asthma have also been established in the literature (Kaldor et al. 1984).
In addition to assessing SO2 as a direct health stressor, it is also the most effective tracer of industrial emissions and specifically petroleum refineries for a number of reasons. Petroleum refineries are the largest source of SO2 in the BAAQMD by far (Table 1), and there are more monitors for SO2 than any of the other emitted chemical species that can be used to fingerprint the refineries. The distribution of SO2 is therefore representative of the cocktail of a combination of the hazardous chemicals released in refinery emissions.
Figure 3. Map of Sulfur Dioxide for the Bay Area Air Quality Management District
View map fullscreen | How FracTracker maps work
Further Research
The next step for FracTracker Alliance is to further explore the relationship between health effects in the refinery communities and ambient levels of air pollution emitted by the refineries. Our staff is currently working with the California Department of Public Health to analyze the response of daily emergency room discharges for a variety of health impacts including cardiovascular disease and asthma.
References
Brody, J. G., R. Morello-Frosch, A. Zota, P. Brown, C. Pérez, and R. A. Rudel. 2009. Linking Exposure Assessment Science With Policy Objectives for Environmental Justice and Breast Cancer Advocacy: The Northern California Household Exposure Study. American Journal of Public Health 99:S600–S609.
Brook, R. D., B. Franklin, W. Cascio, Y. Hong, G. Howard, M. Lipsett, R. Luepker, M. Mittleman, J. Samet, S. C. Smith, and I. Tager. 2004. Air Pollution and Cardiovascular Disease. Circulation 109:2655–2671.
Brooks, R. D., S. Rajagopalan, C. A. Pope, J. R. Brook, A. Bhatnagar, A. V. Diez-Roux, F. Holguin, Y. Hong, R. V. Luepker, M. A. Mittleman, A. Peters, D. Siscovick, S. C. Smith, L. Whitsel, and J. D. Kaufman. 2010. Particulate Matter Air Pollution and Cardiovascular Disease. Circulation 121:2331–2378.
Bullard, R. D. 1993a. Race and Environmental Justice in the United States Symposium: Earth Rights and Responsibilities: Human Rights and Environmental Protection. Yale Journal of International Law 18:319–336.
Bullard, R. D. 1993b. Confronting Environmental Racism: Voices from the Grassroots. South End Press.
Carlson, E.D. and Chamberlain, R.M. (2005), Allostatic load and health disparities: A theoretical orientation. Res. Nurs. Health, 28: 306–315. doi:10.1002/nur.20084
Kaldor, J., J. A. Harris, E. Glazer, S. Glaser, R. Neutra, R. Mayberry, V. Nelson, L. Robinson, and D. Reed. 1984. Statistical association between cancer incidence and major-cause mortality, and estimated residential exposure to air emissions from petroleum and chemical plants. Environmental Health Perspectives 54:319–332.
Poloniecki, J. D., R. W. Atkinson, A. P. de Leon, and H. R. Anderson. 1997. Daily Time Series for Cardiovascular Hospital Admissions and Previous Day’s Air Pollution in London, UK. Occupational and Environmental Medicine 54:535–540.
Rudel, R. A., R. E. Dodson, L. J. Perovich, R. Morello-Frosch, D. E. Camann, M. M. Zuniga, A. Y. Yau, A. C. Just, and J. G. Brody. 2010. Semivolatile Endocrine-Disrupting Compounds in Paired Indoor and Outdoor Air in Two Northern California Communities. Environmental Science & Technology 44:6583–6590.
Szanton SL, Thorpe RJ, Whitfield KE. Life-course Financial Strain and Health in African-Americans. Social science & medicine (1982). 2010;71(2):259-265. doi:10.1016/j.socscimed.2010.04.001.
By Daniel Menza, Data & GIS Intern, and Kyle Ferrar, Western Program Coordinator, FracTracker Alliance
Cover photo credit: Claycord.com