Getting Rid of All of that Waste – Increasing Use of Oil and Gas Injection Wells in Pennsylvania
Oil and gas development generates a lot of liquid waste.
Some of the waste comes that comes out of a well is from the geologic layer where the oil and gas resources are located. These extremely saline brines may be described as “natural,” but that does not make them safe, as they contain dangerous levels of radiation, heavy metals, and other contaminants.
Additionally, a portion of the industrial fluid that was injected into the well to stimulate production, known as hydraulic fracturing fluid, returns to the surface. Some of these substances are known carcinogens, while others remain entirely secret, even to the personnel in the field who are employed to use the additives.
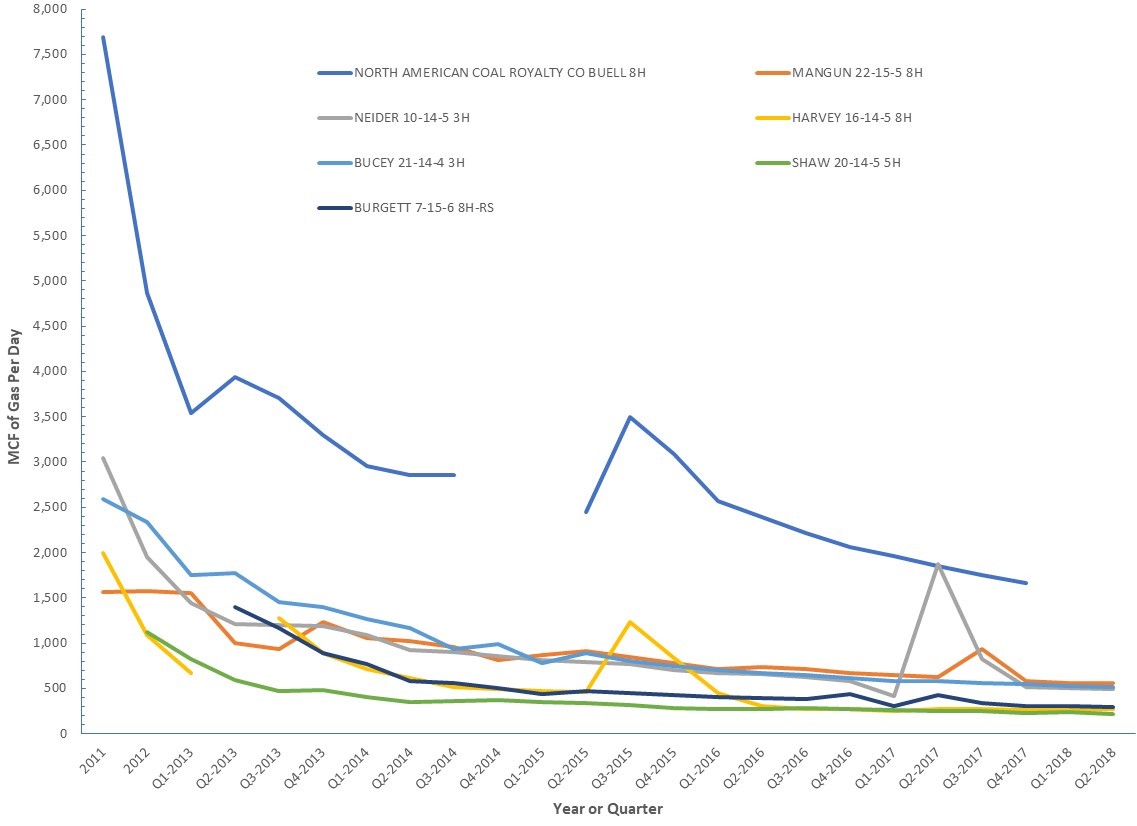
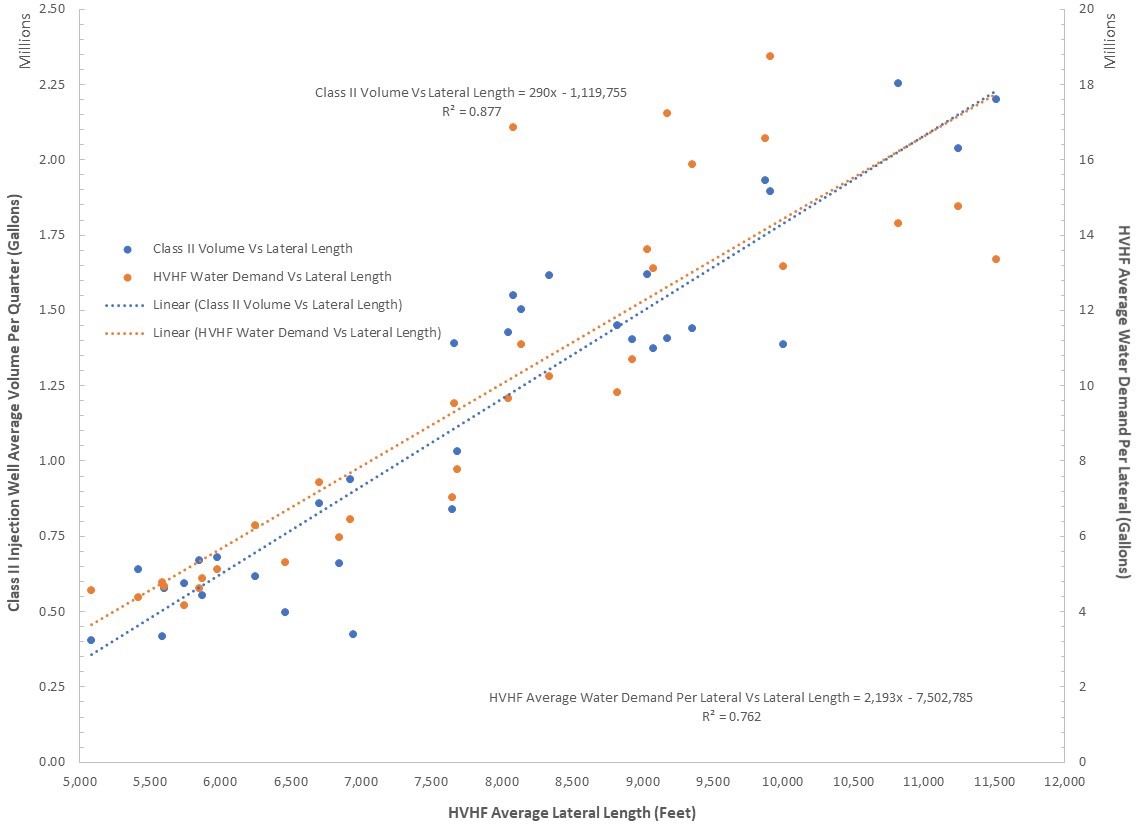
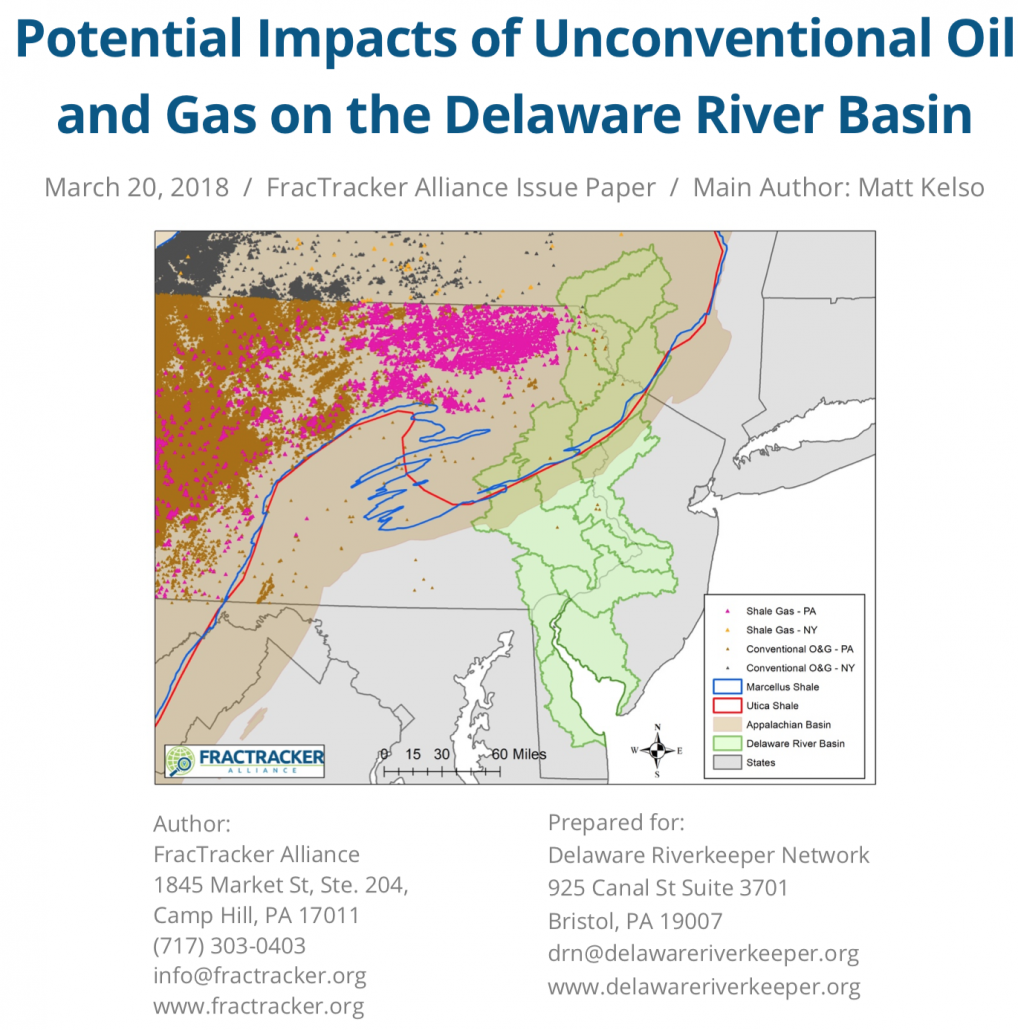
The industry likes to remind residents that they have used this technique for more than six decades, which is true. What separates “conventional” fracking from developing unconventional formations such as the Marcellus Shale is really a matter of scale. Conventional formations are often stimulated with around 10,000 gallons of fluid, while unconventional wells now average more than 10 million gallons per well.
In 2017 alone, Pennsylvania oil and gas wells generated 57,653,023 barrels (2.42 billion gallons) of liquid waste.
Managing the waste stream
Liquid waste can be reused to stimulate other oil and gas wells, but reuse concentrates the contaminant load in the fluid. There is a limit to this concentration that operators can use, even for this industrial purpose.
Another strategy is to decrease the volume of the waste through evaporation and other treatment methods. This also increases the contaminant concentration. Pennsylvania used to permit “treatment” of wastewater at sewage treatment facilities, before being forced to concede that the process was completely ineffective, and resulted in contaminating streams and rivers throughout the Commonwealth.
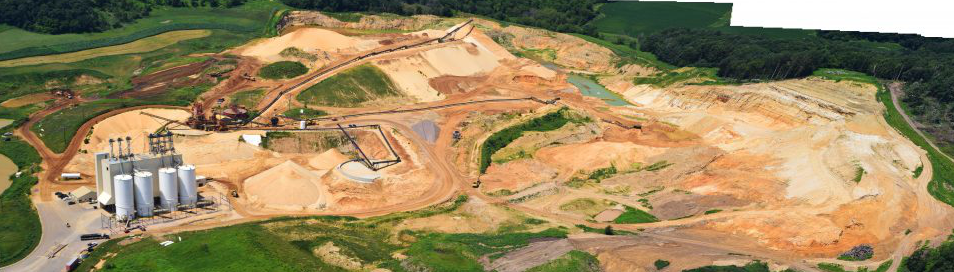
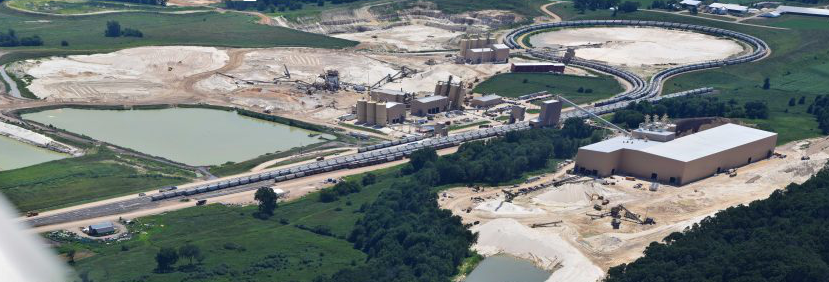
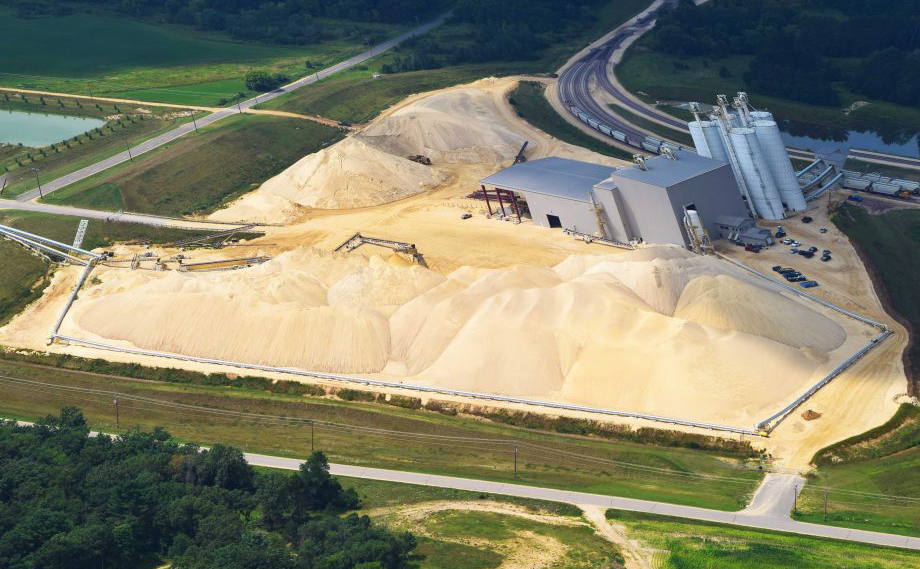
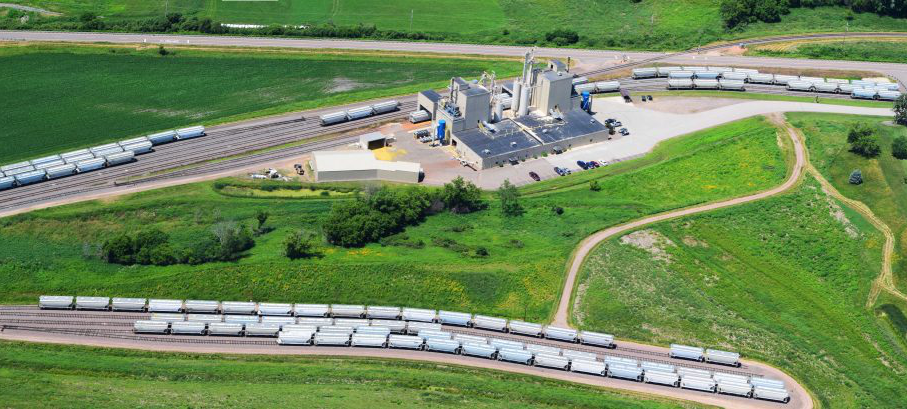
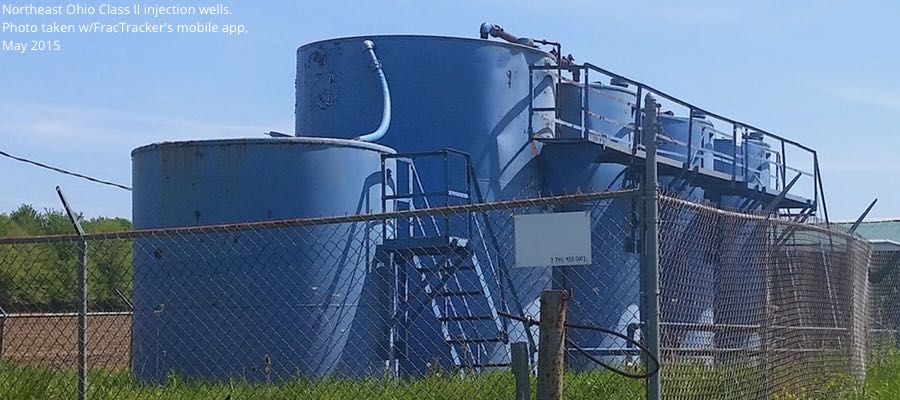
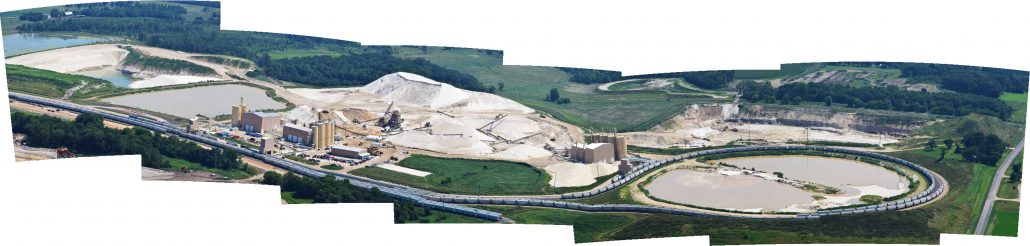
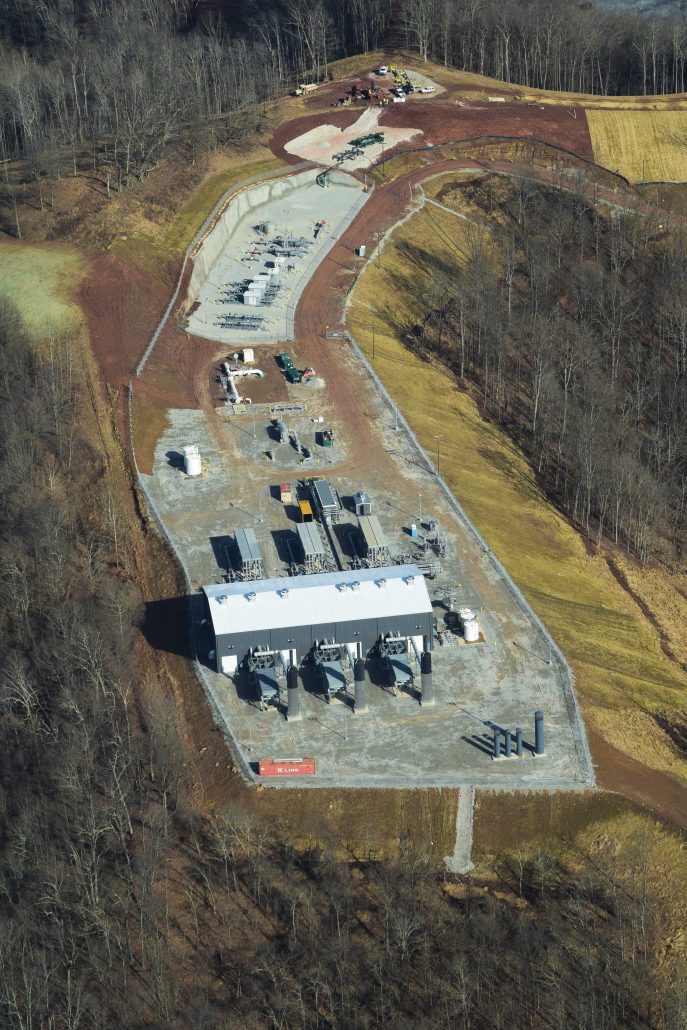
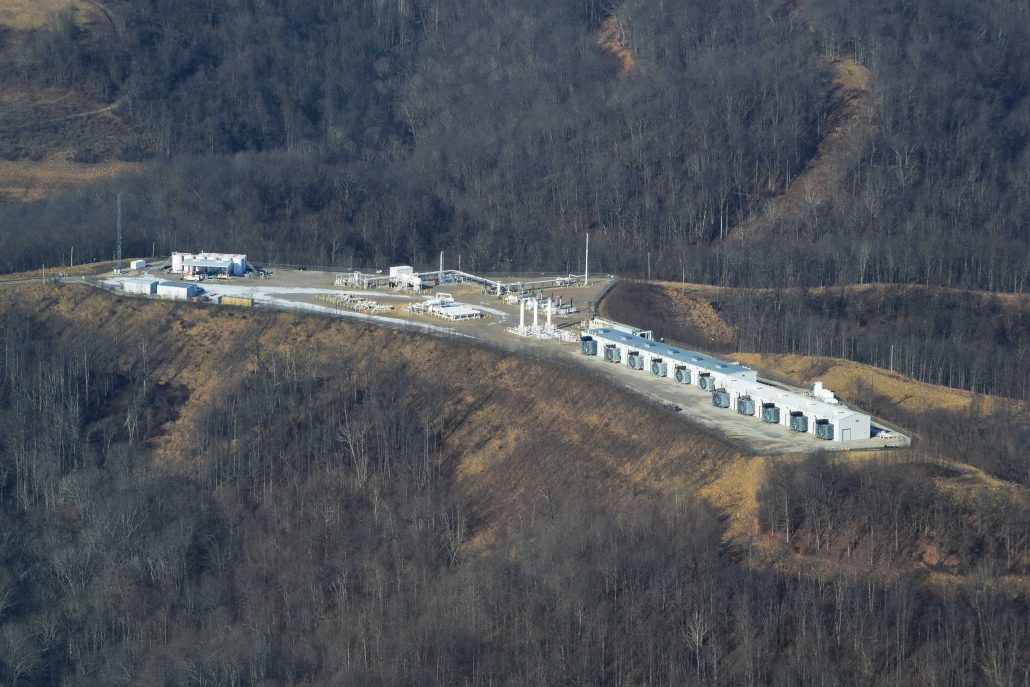
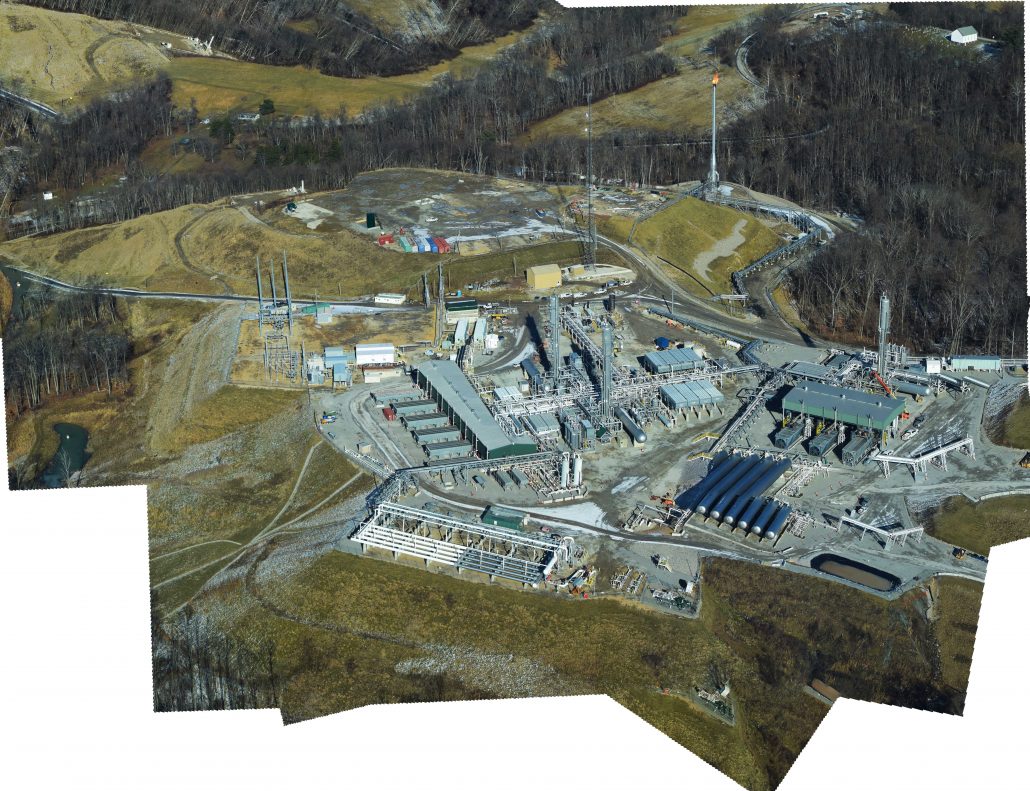
In many states, much of this waste is disposed of in facilities known as salt water disposal (SWD) wells, a specific type of injection well. These waste facilities fall under the auspices of the US Environmental Protection Agency’s Underground Injection Control (UIC) program. Such wells are co-managed with states’ oil and gas regulatory agencies, although the specifics vary by state.


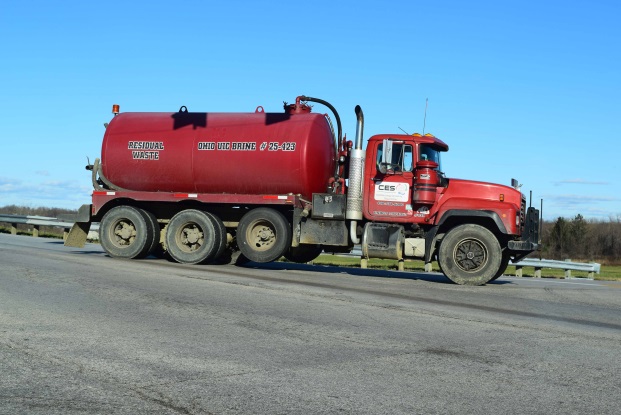

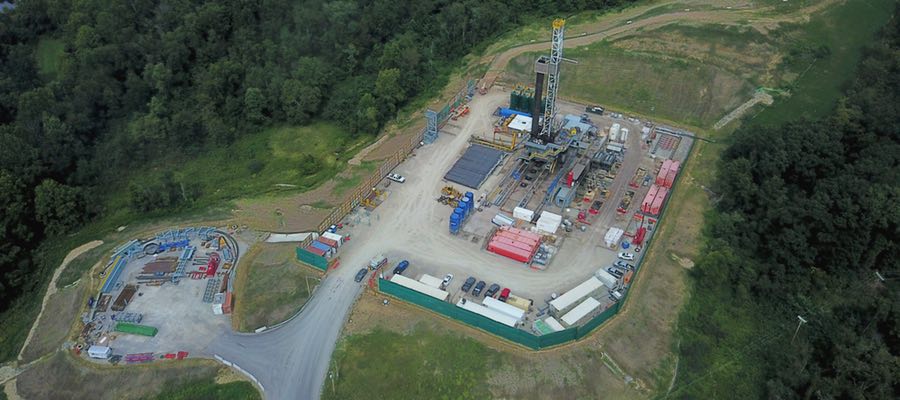
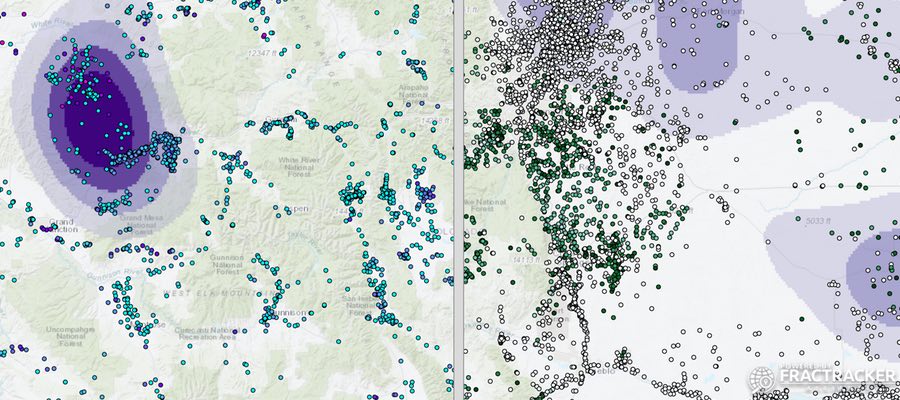
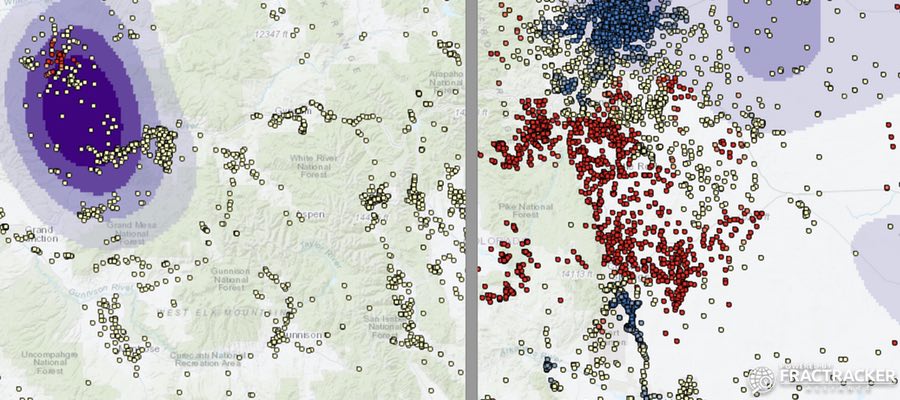
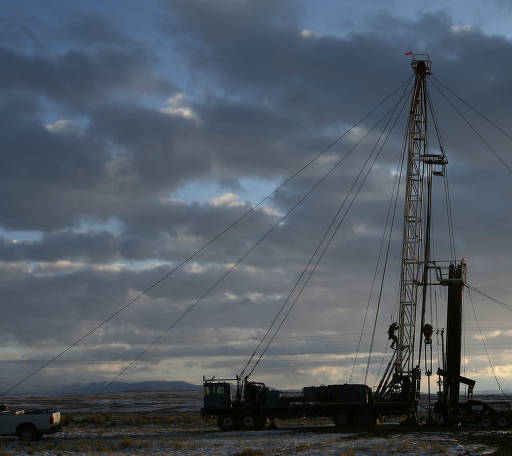
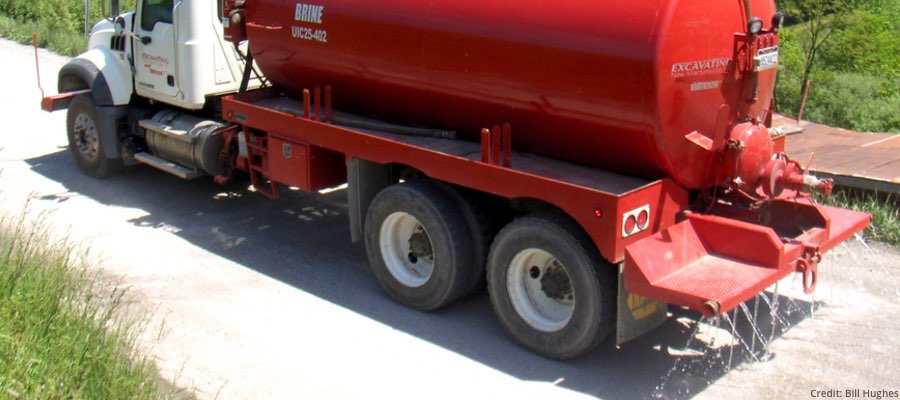
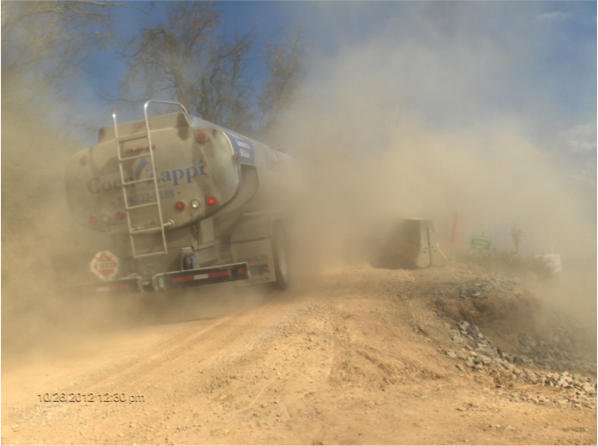
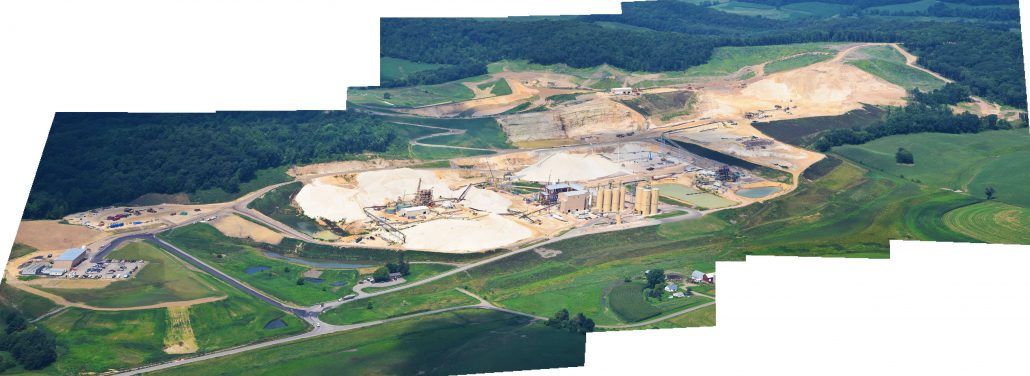
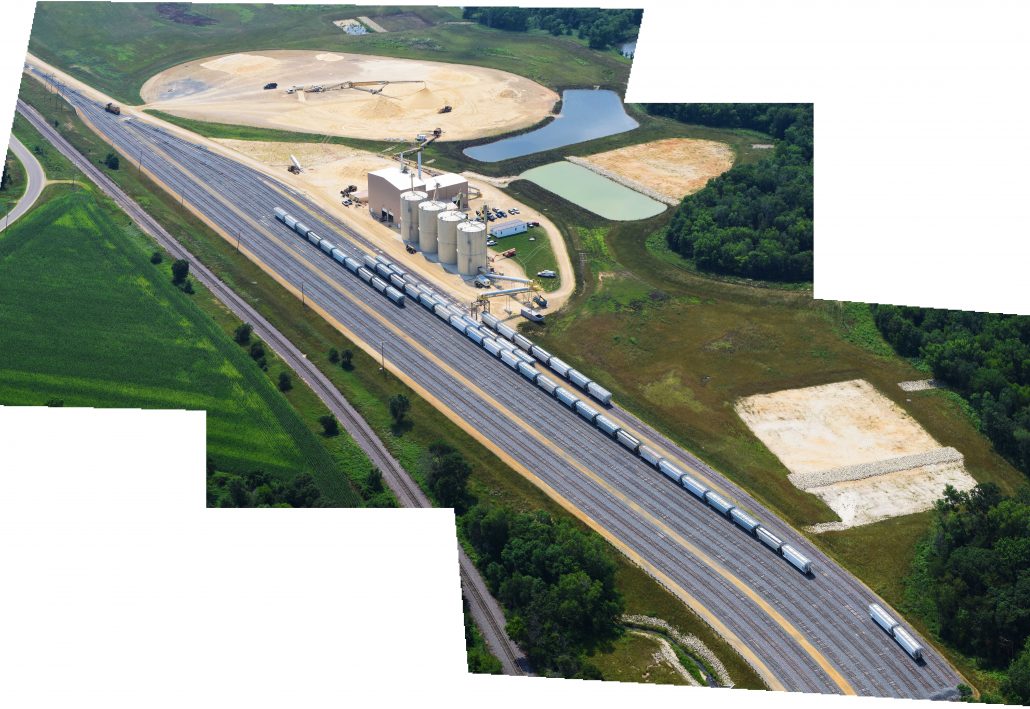
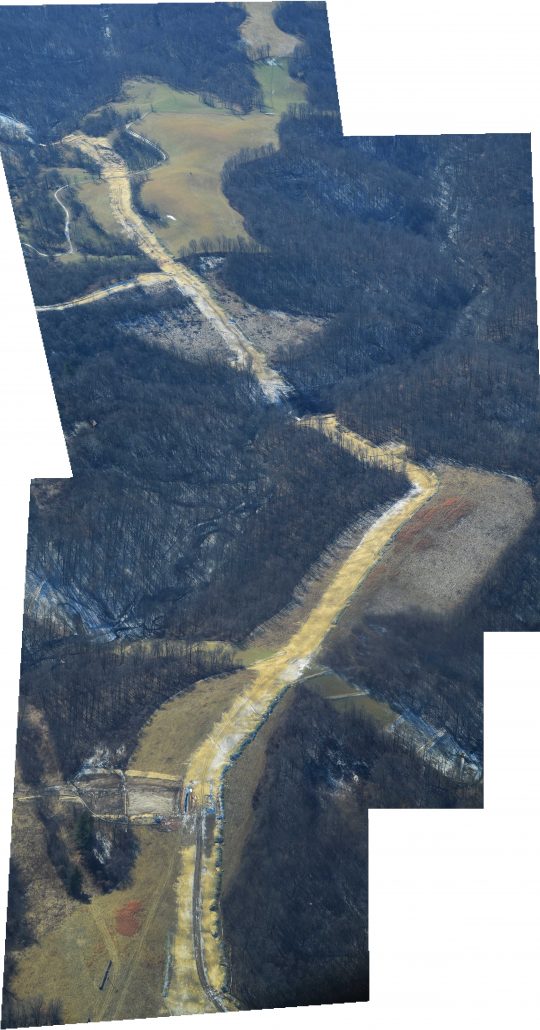
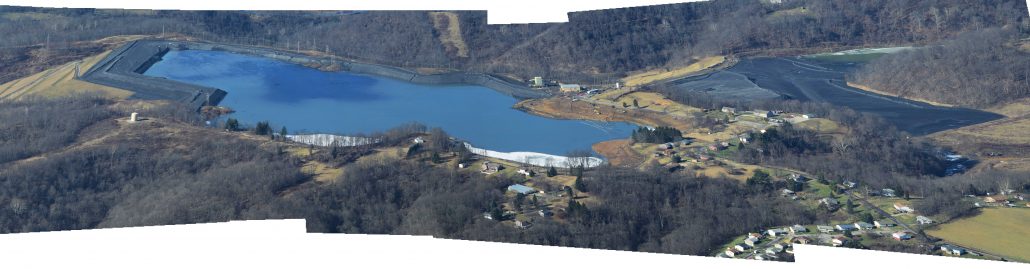
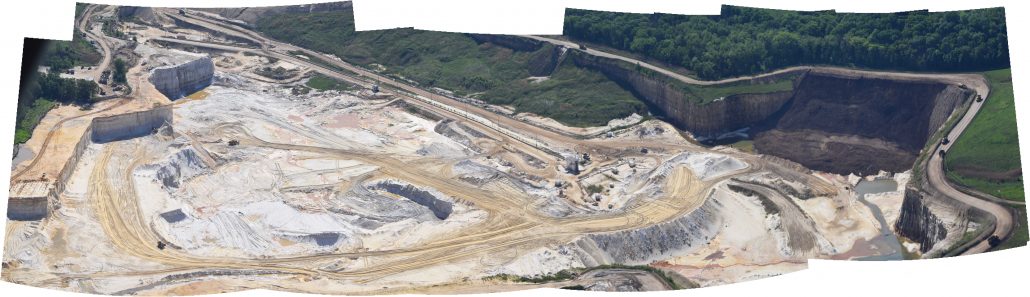
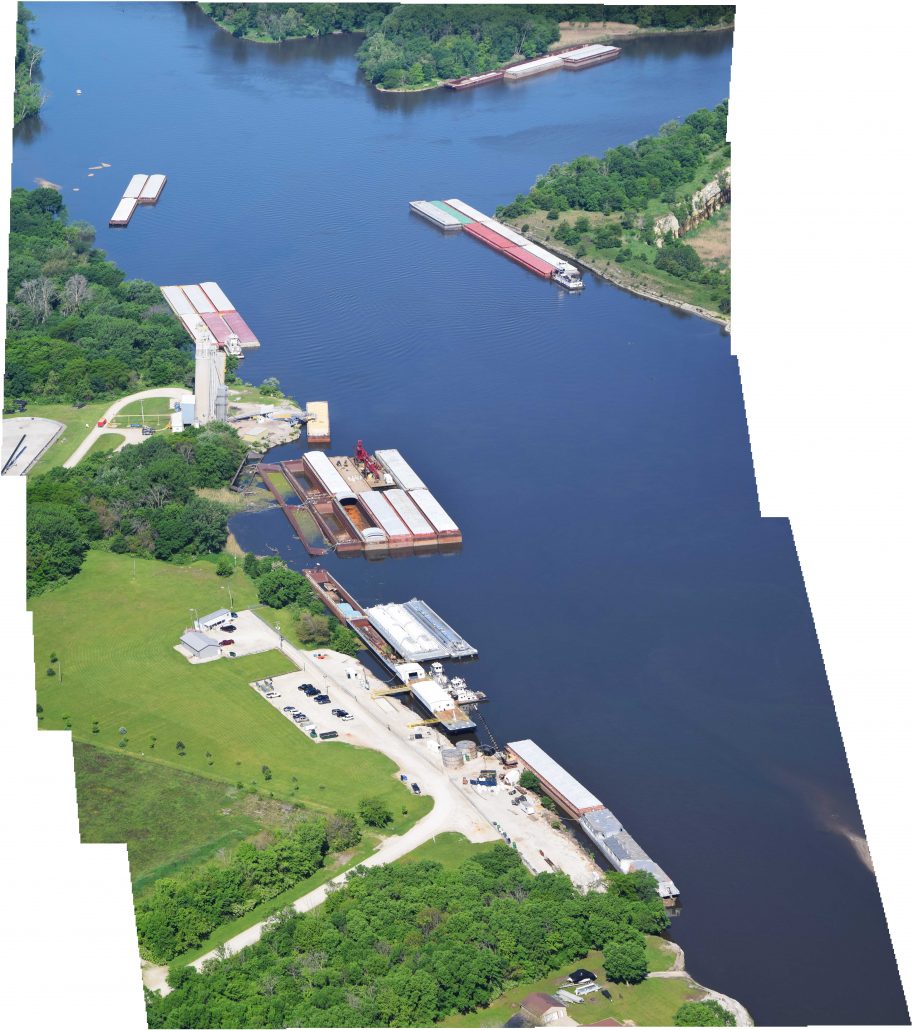
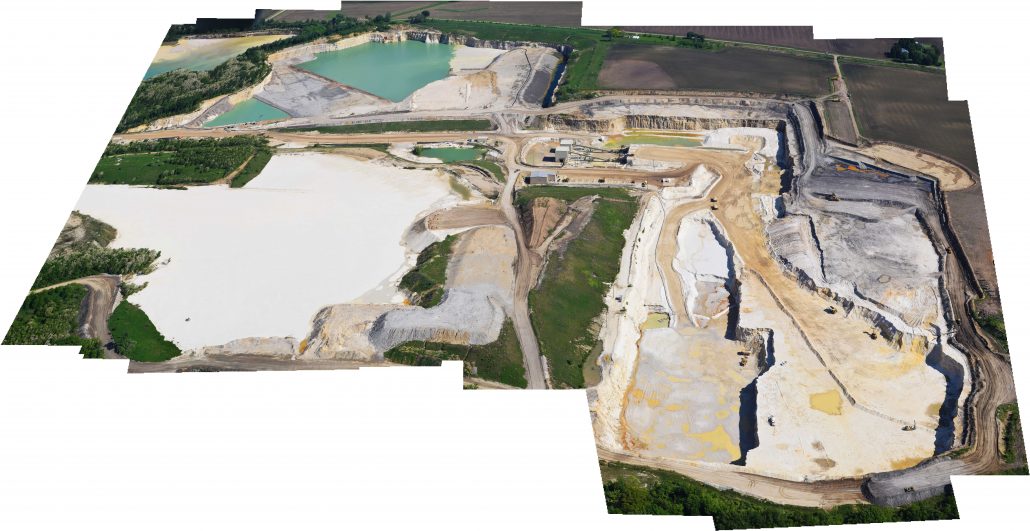
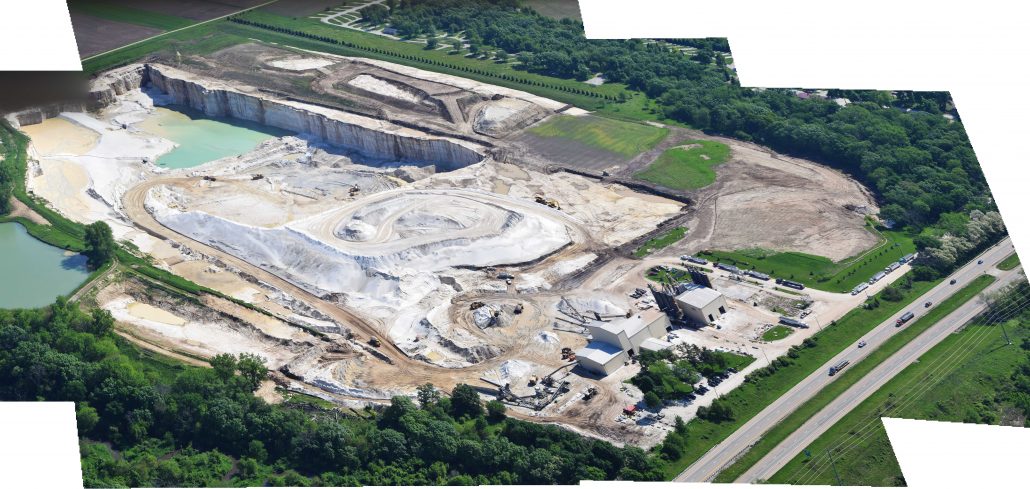
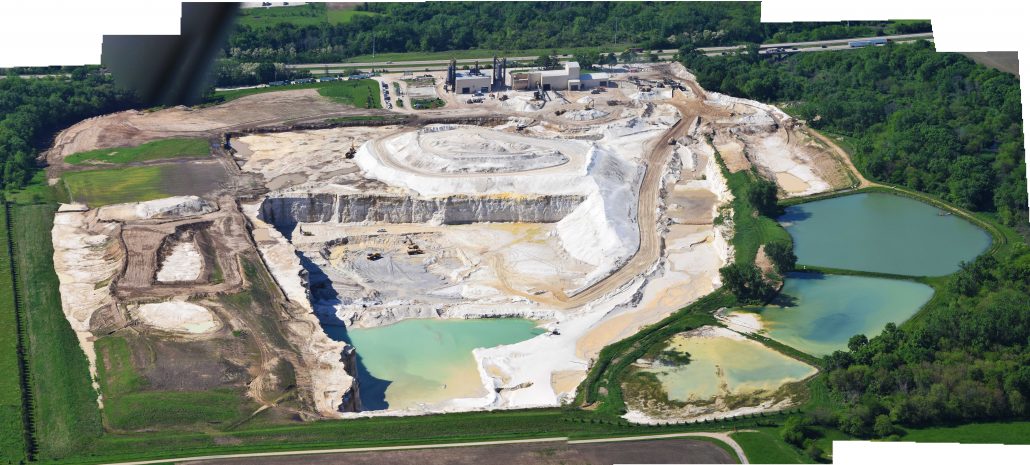
These photos show SWD wells in other states, but what about in Pennsylvania?
The oil and gas industry in Pennsylvania has not used SWD wells as a primary disposal method, as the state’s geology has been considered unsuitable for this process. For example, on page 67 of this 2009 industry report, the authors saw treatment of flowback fluid at municipal facilities as a viable option (before the process was banned in 2011), but underground injection as less likely (emphasis added):
The disposal of flowback and produced water is an evolving process in the Appalachians. The volumes of water that are being produced as flowback water are likely to require a number of options for disposal that may include municipal or industrial water treatment facilities (primarily in Pennsylvania), Class II injection wells [SWDs], and on-site recycling for use in subsequent fracturing jobs. In most shale gas plays, underground injection has historically been preferred. In the Marcellus play, this option is expected to be limited, as there are few areas where suitable injection zones are available.
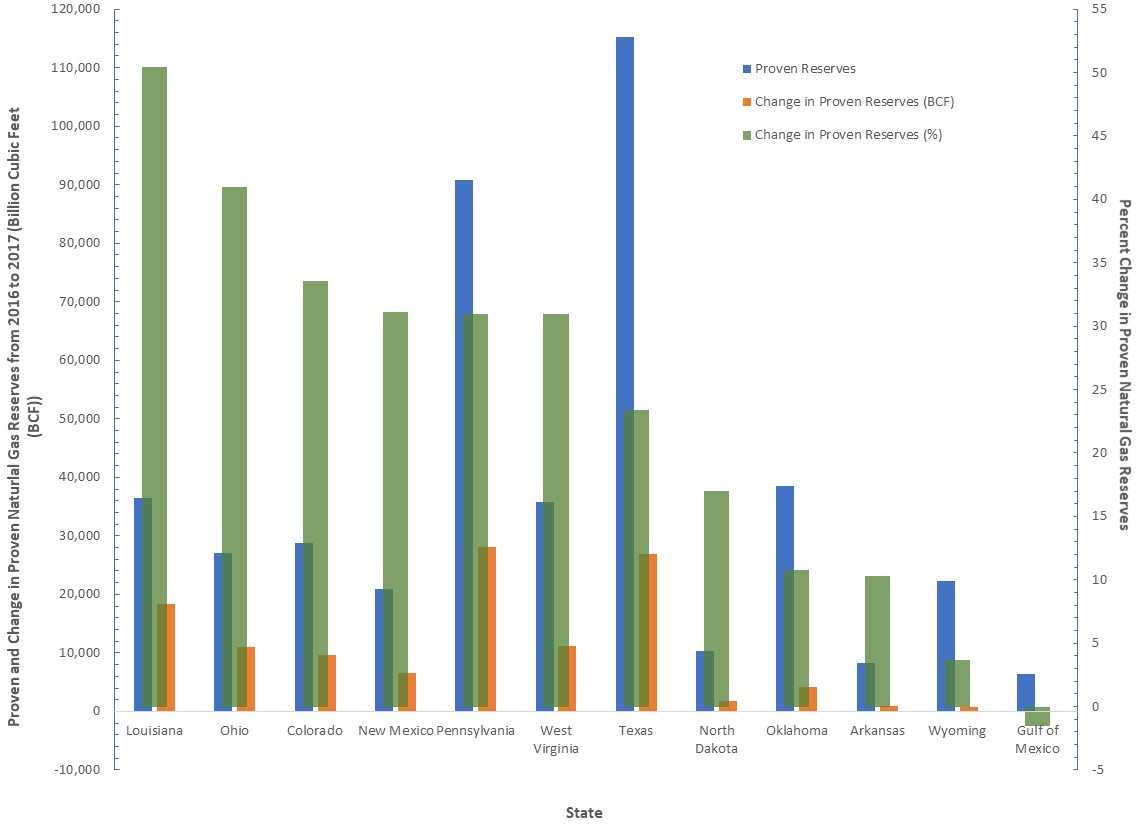
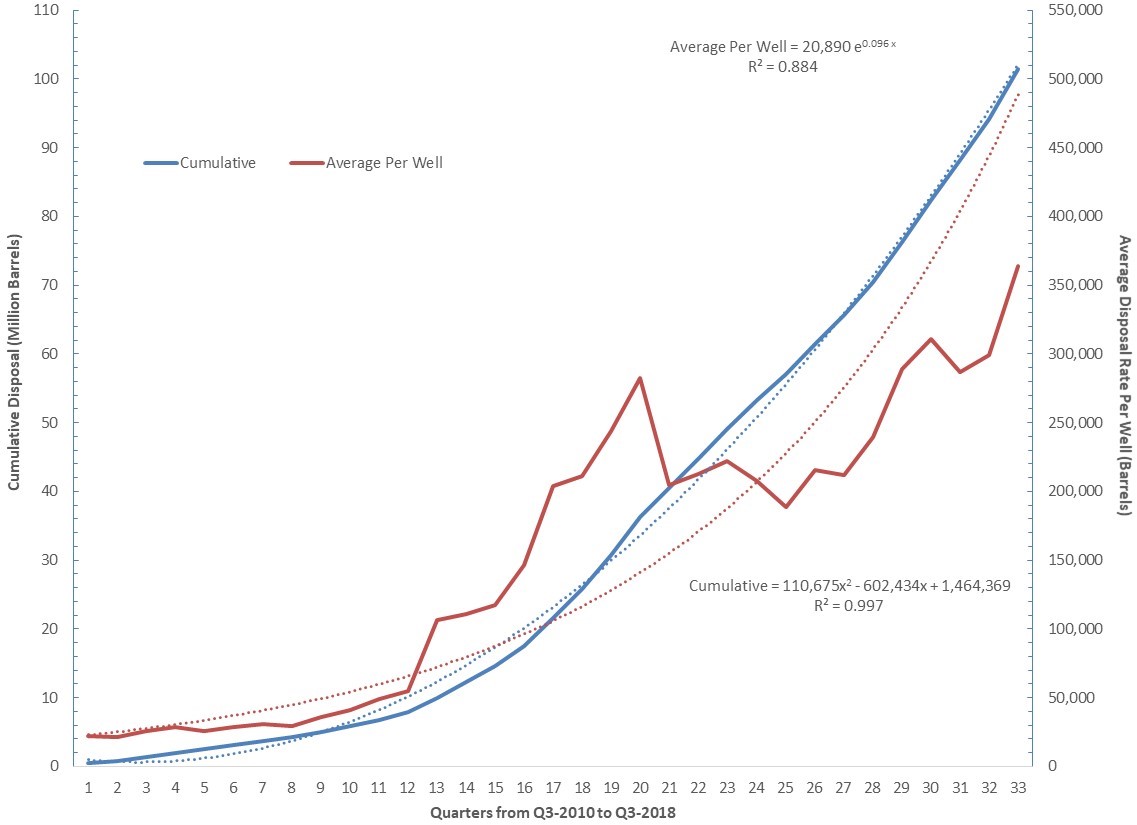
The ban on surface “treatment” being discharged into Pennsylvania waters has increased the pressure for finding new solutions for brine disposal. This is compounded by the fact that the per-well volume of fluid injected into shale gas wells in the region has nearly tripled in that time period. Much of what is injected comes back up to the surface and is added to the liquid waste stream.
Chemically-similar brine from conventional wells has been spread on roadways for dust suppression. This practice was originally considered a “beneficial use” of the waste product, but the Pennsylvania Department of Environmental Protection (DEP) halted that practice in May 2018.
None of these waste management decisions make the geology in Pennsylvania suddenly suitable for underground injection, however, they do increase the pressure on the state to find a disposal solution.
Concerns with SWD wells
There are numerous concerns with salt water disposal wells. In October 2018, the DEP held a hearing in Plum Borough, on the eastern edge of Allegheny County, where there is a proposal to convert the Sedat 3A conventional well to an injection well. Some of the concerns raised by residents include:
- Fluid and/or gas migration- There are numerous routes for fluids and gas to migrate from the injection formation to drinking water aquifers or even surface water. Potential conduits include coal mines, abandoned gas wells, water wells, and naturally occurring fissures in crumbling sedimentary formations.
- Induced seismicity- SWD wells have been linked to increased earthquake activity, either by lubricating or putting pressure on old faults that had been dormant. Earthquakes can occur miles away from the injection location, and in sedimentary formations, not just igneous basement rock.
- Noise, diesel pollution, loss of privacy, and road degradation caused by a constant stream of industrial waste haulers to the well location.
- Complicating existing issues- Plum Borough and surrounding communities are heavily undermined, and in fact the well bore goes right through the Renton Coal Mine (another part of which has been on fire for decades). Mine subsidence is already a widespread issue in the region, and many fear that even small seismic events could exacerbate this.
- Possibility of surface spill- Oil and gas is, sadly, a sloppy industry, with unconventional operations having accumulated more than 13,000 violations in Pennsylvania since 2008. If a major spill were to happen at this location, there is the possibility of release into Pucketa Creek, which drains into the Allegheny River, the source of drinking water for multiple communities.
- Radioactivity and other contaminants- Flowback fluids are often highly radioactive, contain heavy metals, and other contaminants that are challenging to effectively clean. The migration of radon gas into homes above the injection formation is also a possibility.
The current state of SWDs in Pennsylvania
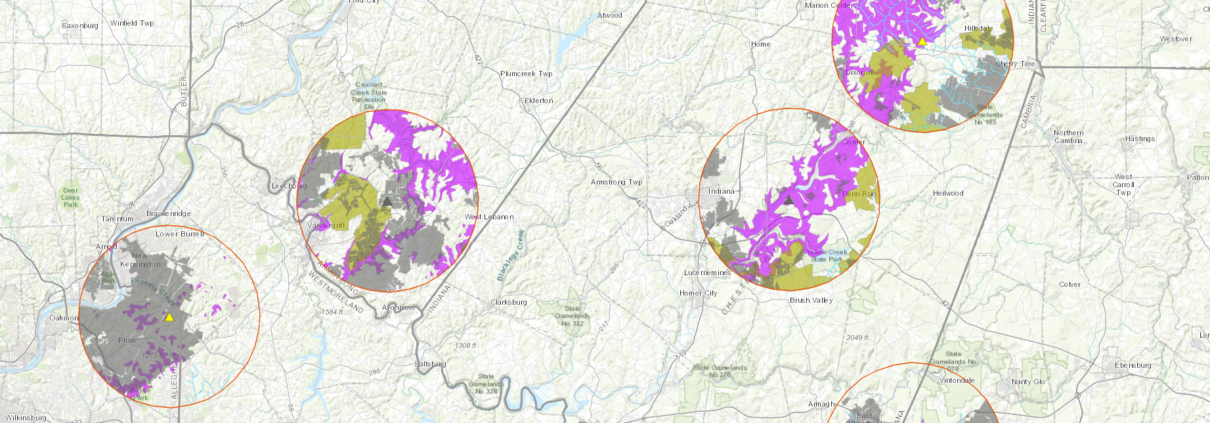
Pennsylvania has numerous data sources for oil and gas, but they are not always in agreement. To account for this, we have mapped SWDs (and a five mile buffer around them) from two different data sources in the map below. The first source is a subset of SWD wells from a larger dataset of oil and gas locations from the DEP’s mapping website. The second source is from a Waste Facility Report, represented in pink triangles that are offset at an angle to allow users to see both datasets simultaneously in instances where they overlap.
Map of existing, proposed, and plugged salt water disposal (SWD) injection wells in Pennsylvania.
View map fullscreen | How FracTracker maps work
According to the first data set of DEP’s oil and gas locations, Pennsylvania contains 13 SWDs with an active status, one SWD with a regulatory inactive status, and eight that are plugged. The Waste Facility Report shows 10 SWD wells total, including one well that was left out of the other data set in Annin Township, McKean County.
It is worth noting that Pennsylvania’s definition for an “active” well status is confusing, to put it charitably. It does not mean that a well is currently in operation, nor does it even mean that it is currently permitted for the activity, whether that is waste disposal or gas production, or some other function. An active status means that the well has been proposed for a given use, and the well hasn’t been plugged, or assigned some other status.
The Sedat 3A well in Plum, for example, has an active status, although the DEP has not yet granted it a permit to operate as a SWD well. Another status type is “regulatory inactive,” which is given to a well that hasn’t been used for its stated purpose in 12 months, but may potentially have some future utility.
Karst, coal mines, and streams
While there are numerous factors worthy of consideration when siting SWD wells, this map focuses on three: the proximity of karst formations, coal mines and nearby streams that the state designates as either high quality or exceptional value.
Karst formations are unstable soluble rock formations like limestone deposits which are likely to contain numerous subsurface voids. These voids are concerning in this context. For one reason, there’s the possibility of contaminated fluids and gasses migrating into underground freshwater aquifers. Also, the voids are inherently structurally unstable, which could compound the impacts of artificially-induced seismic activity caused by fluid injections in the well.
Our analysis found over 78,000 acres (123 square miles) of karst geology within five miles of current, proposed, or plugged SWD wells in Pennsylvania.
Coal mines, while a very different sedimentary formation, have similar concerns because of subsurface voids. Mine subsidence is already a widespread problem in many of the communities surrounding SWD well sites. Pennsylvania has several available data sets, including active underground mine permits and digitized mined areas, which are used in this map. Active mine permits show current permitted operations, while digitized mine areas offer a highly detailed look at existing mines, including abandoned mines, although the layer is not complete for all regions of the state.
In Pennsylvania, there are 56,542 acres (88 square miles) of active mines within five miles of SWD wells. Our analysis found 97,902 acres (153 square miles) of digitized mined areas within five miles of SWD wells. Combined, there are 139,840 acres (219 square miles) of existing and permitted mines within the 5 mile buffer zone around SWDs in Pennsylvania.
Streams with the designation “high quality” and “exceptional value” are the best streams Pennsylvania has to offer, in terms of recreation, fishing, and biological diversity. In this analysis, we have identified such streams within a five mile radius of SWD wells, irrespective of the given watershed of the well location.
While the rolling topography of Western Pennsylvania sheds rainwater in a complicated network of drainages, groundwater is not subject to that particular geography. Furthermore, groundwater regularly interacts with surface water through water wells, abandoned O&G wells, and natural seeps and springs. Therefore, it is possible for SWDs to contaminate these treasured streams, even if they are not located within the same watershed.
Altogether, there are 716 miles of high quality streams and 110 miles of exceptional value streams within 5 miles of the SWDs in this analysis.
Conclusion
For decades, geologists have concluded that the subsurface strata in Pennsylvania were not suitable for oil and gas liquid waste disposal in underground injection wells. The fact that vast quantities of this waste are now being produced in Pennsylvania has not suddenly made it a suitable location for the practice. If anything, additional shallow and deep wells have further fractured the sedimentary strata, thereby increasing the risk of contamination.
The only factor that has changed is the volume of waste being produced in the region. SWD wells in nearby Ohio and West Virginia have capacity issues from their own production wells, and it is not clear that the geologic formations across the border are that much better than in Pennsylvania. But as new wells are drilled and volumes of hydraulic fracturing fluid continue to spiral into the tens of millions of gallons per well, the pressure to open new SWD wells in the state will only increase.
Perhaps because of these pressures, DEP has become quite bullish on the technology:
Several successful disposal wells are operating in Pennsylvania and options for more sites are always being considered. The history of underground disposal shows that it is a practical, safe and effective method for disposing of fluids from oil and gas production.
The Department of Environmental Protection’s mission is to protect Pennsylvania’s air, land and water from pollution and to provide for the health and safety of its citizens through a cleaner environment. We will work as partners with individuals, organizations, governments and businesses to prevent pollution and restore our natural resources.
By Matt Kelso, Manager of Data and Technology, FracTracker Alliance
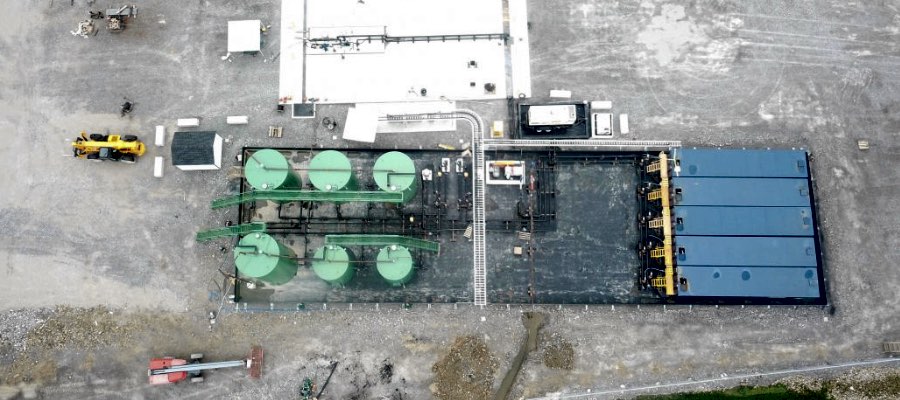


 Injection Well under construction, Brookfield, Ohio")
 Injection Well construction entrance, Brookfield, Ohio")
 Injection Well under construction, Brookfield, Ohio")


 Injection Well under construction, Brookfield, Ohio")
 Injection Well under construction, Brookfield, Ohio")


