A successful 2019 Community Sentinel Award Reception- a full summary
There are many courageous and determined individuals to be grateful for within the environmental movement. At the 2019 Community Sentinel Awards for Environmental Stewardship, we were graced with the presence of many such leaders, and celebrated four in particular as this year’s award winners. From those fighting LNG export terminals on the West Coast, to those resisting fracking expansion in the Marcellus Shale and other formations, to those shutting down petrochemical expansion in the Gulf Coast – thank you, Sentinels.
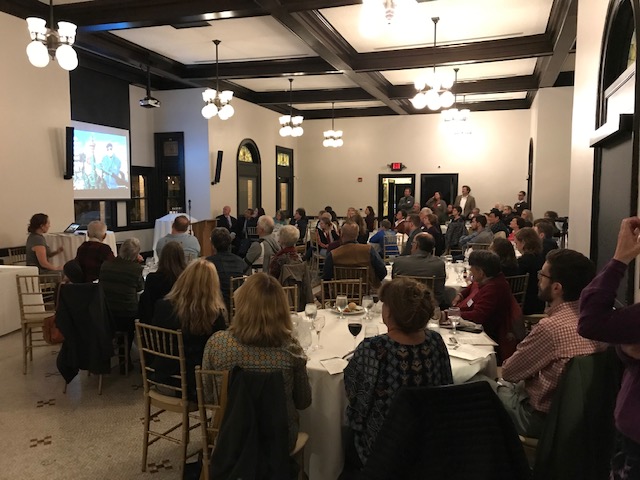
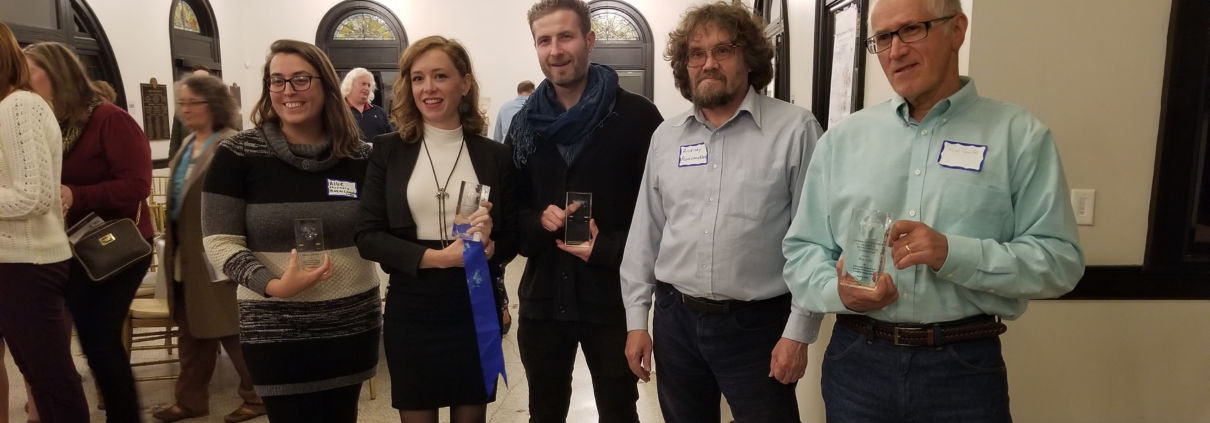
2019 Community Sentinel Award Reception
The Program on October 22nd
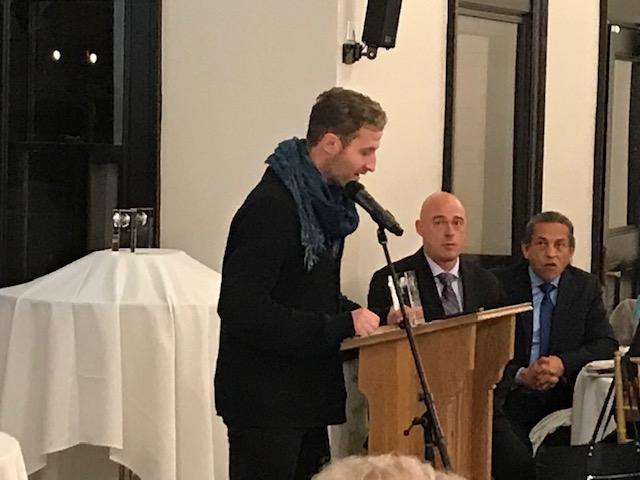
The 2019 reception and ceremony coincided with the oil and gas industry’s three-day Shale Insight Conference. The fighters and victims of dirty energy and petrochemical development were recognized as we opposed the nearby perpetrators of these harms. The event featured the keynote speaker Andrey Rudomakha, Director of Environmental Watch on North Caucasus, and inspirational emcee David Braun of Rootskeeper.
You can watch the full 2019 Awards Reception here:
More About the Awardees
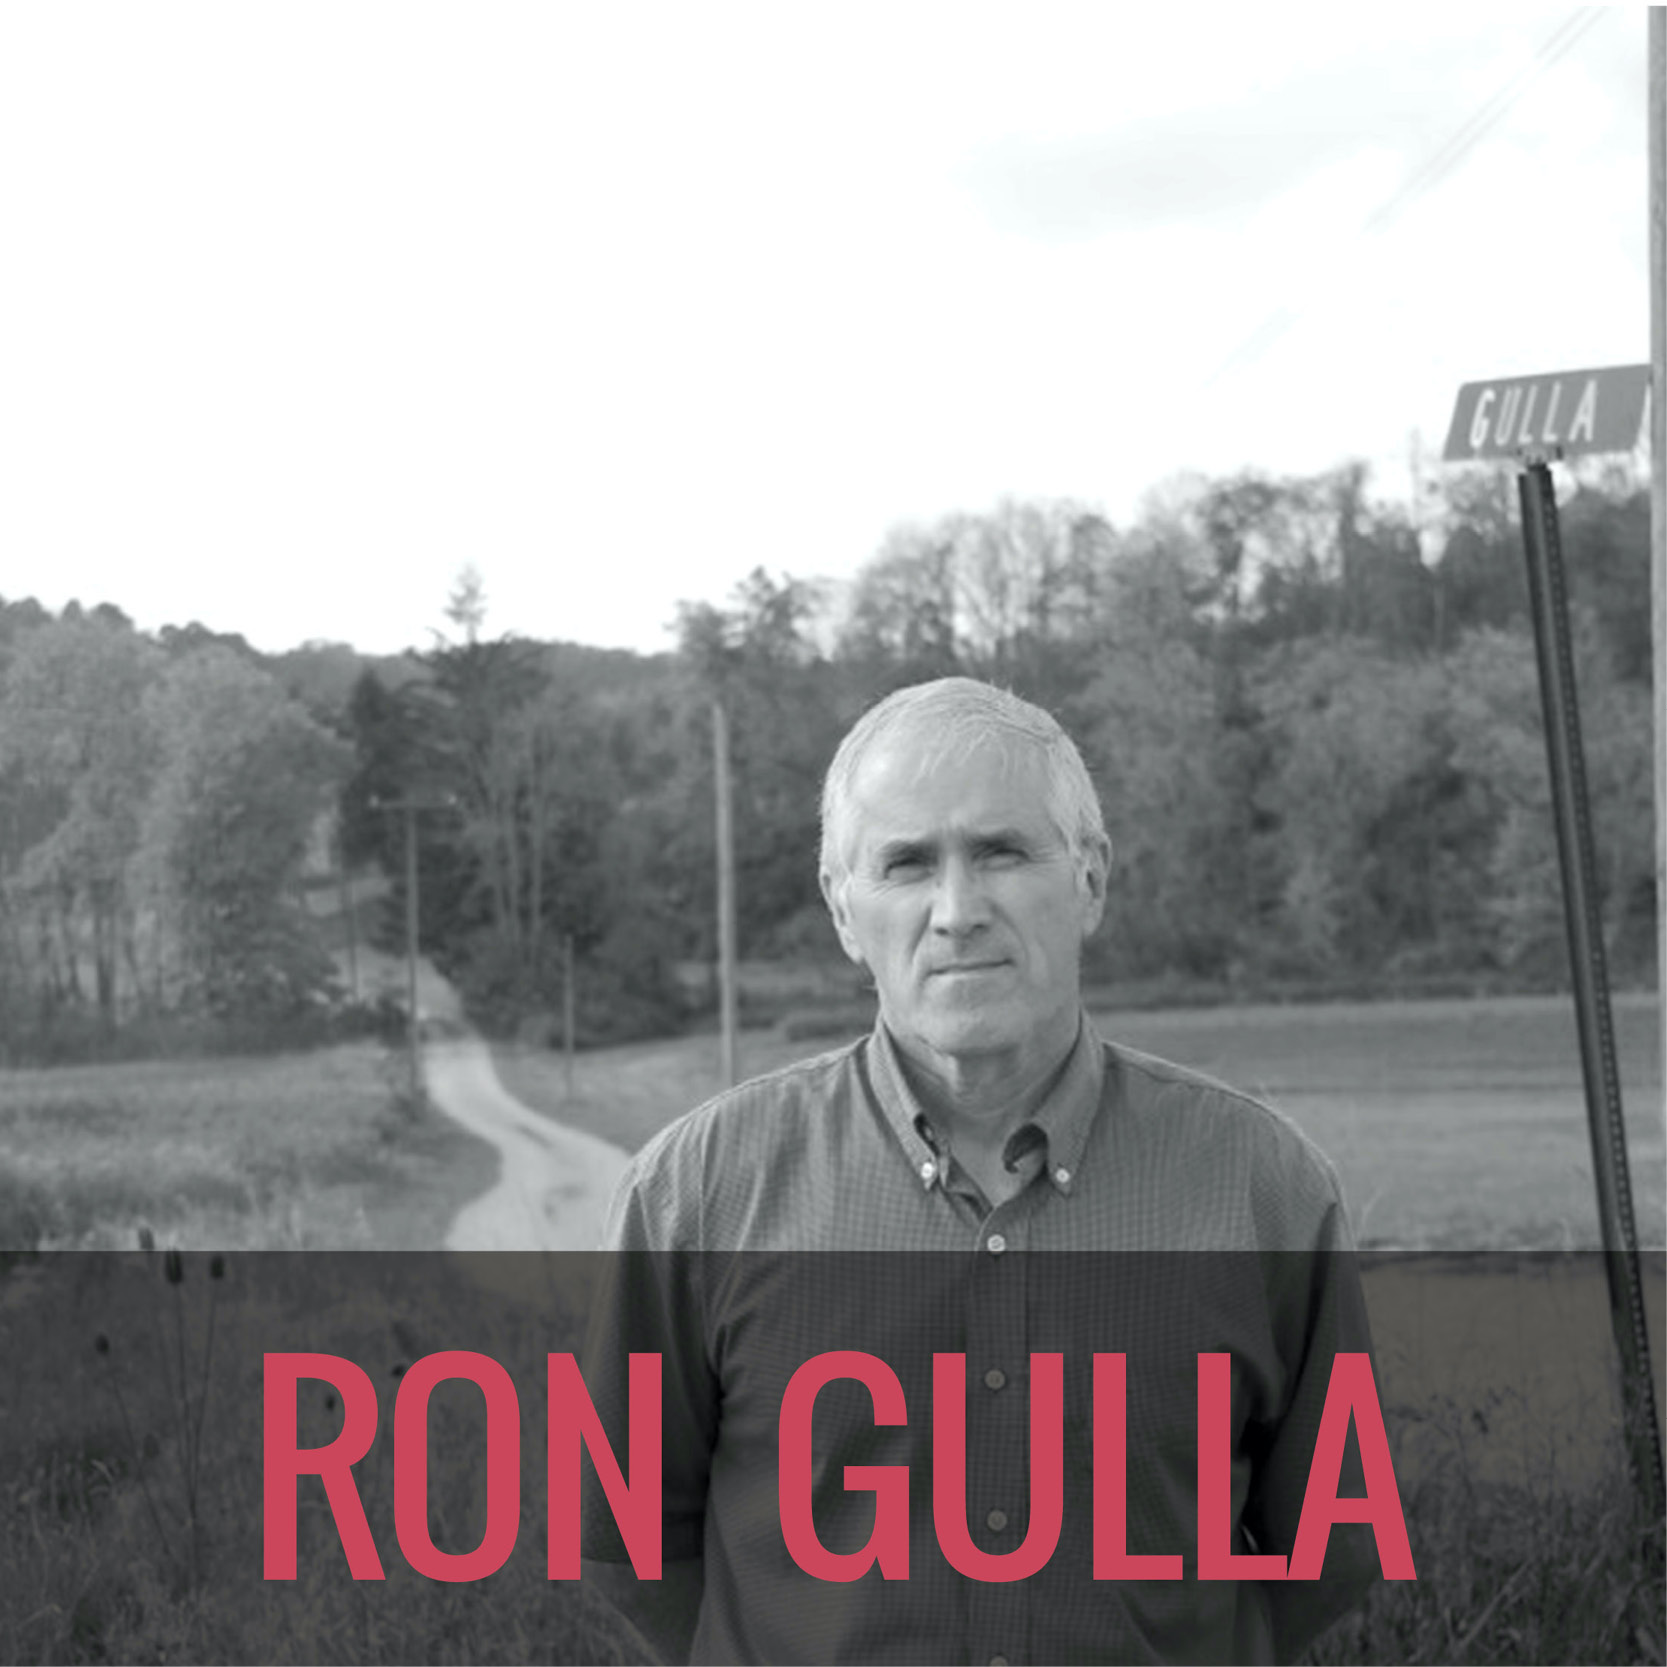
- Ron Gulla
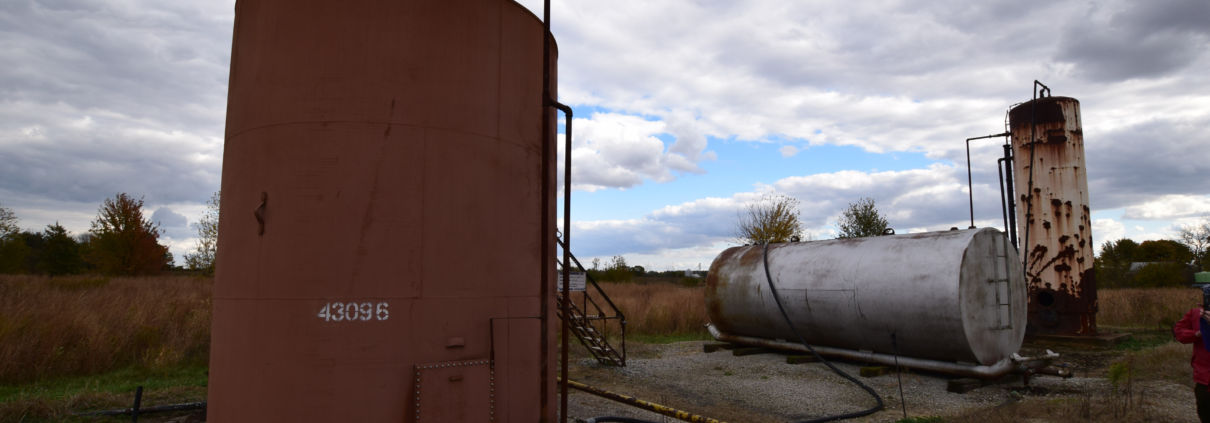
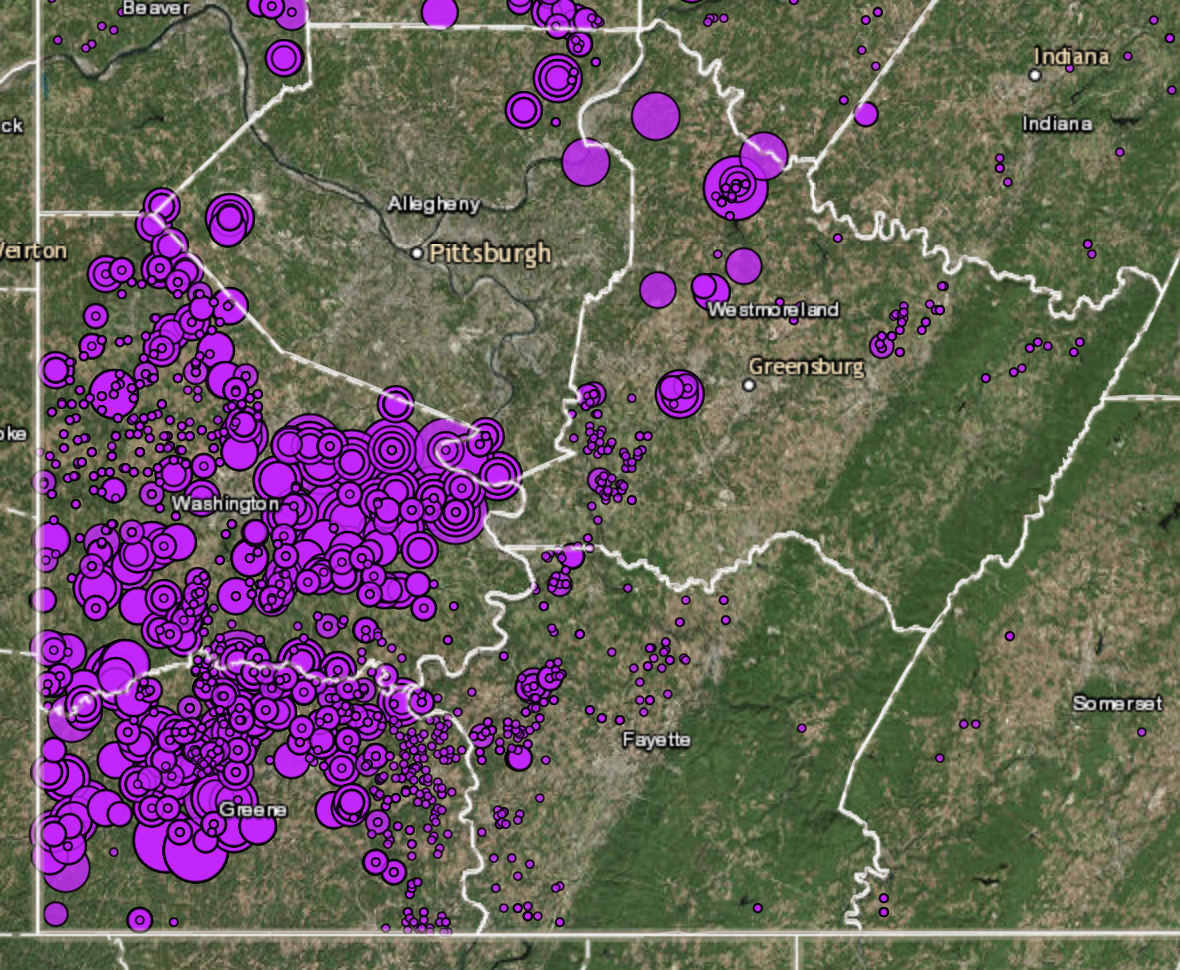
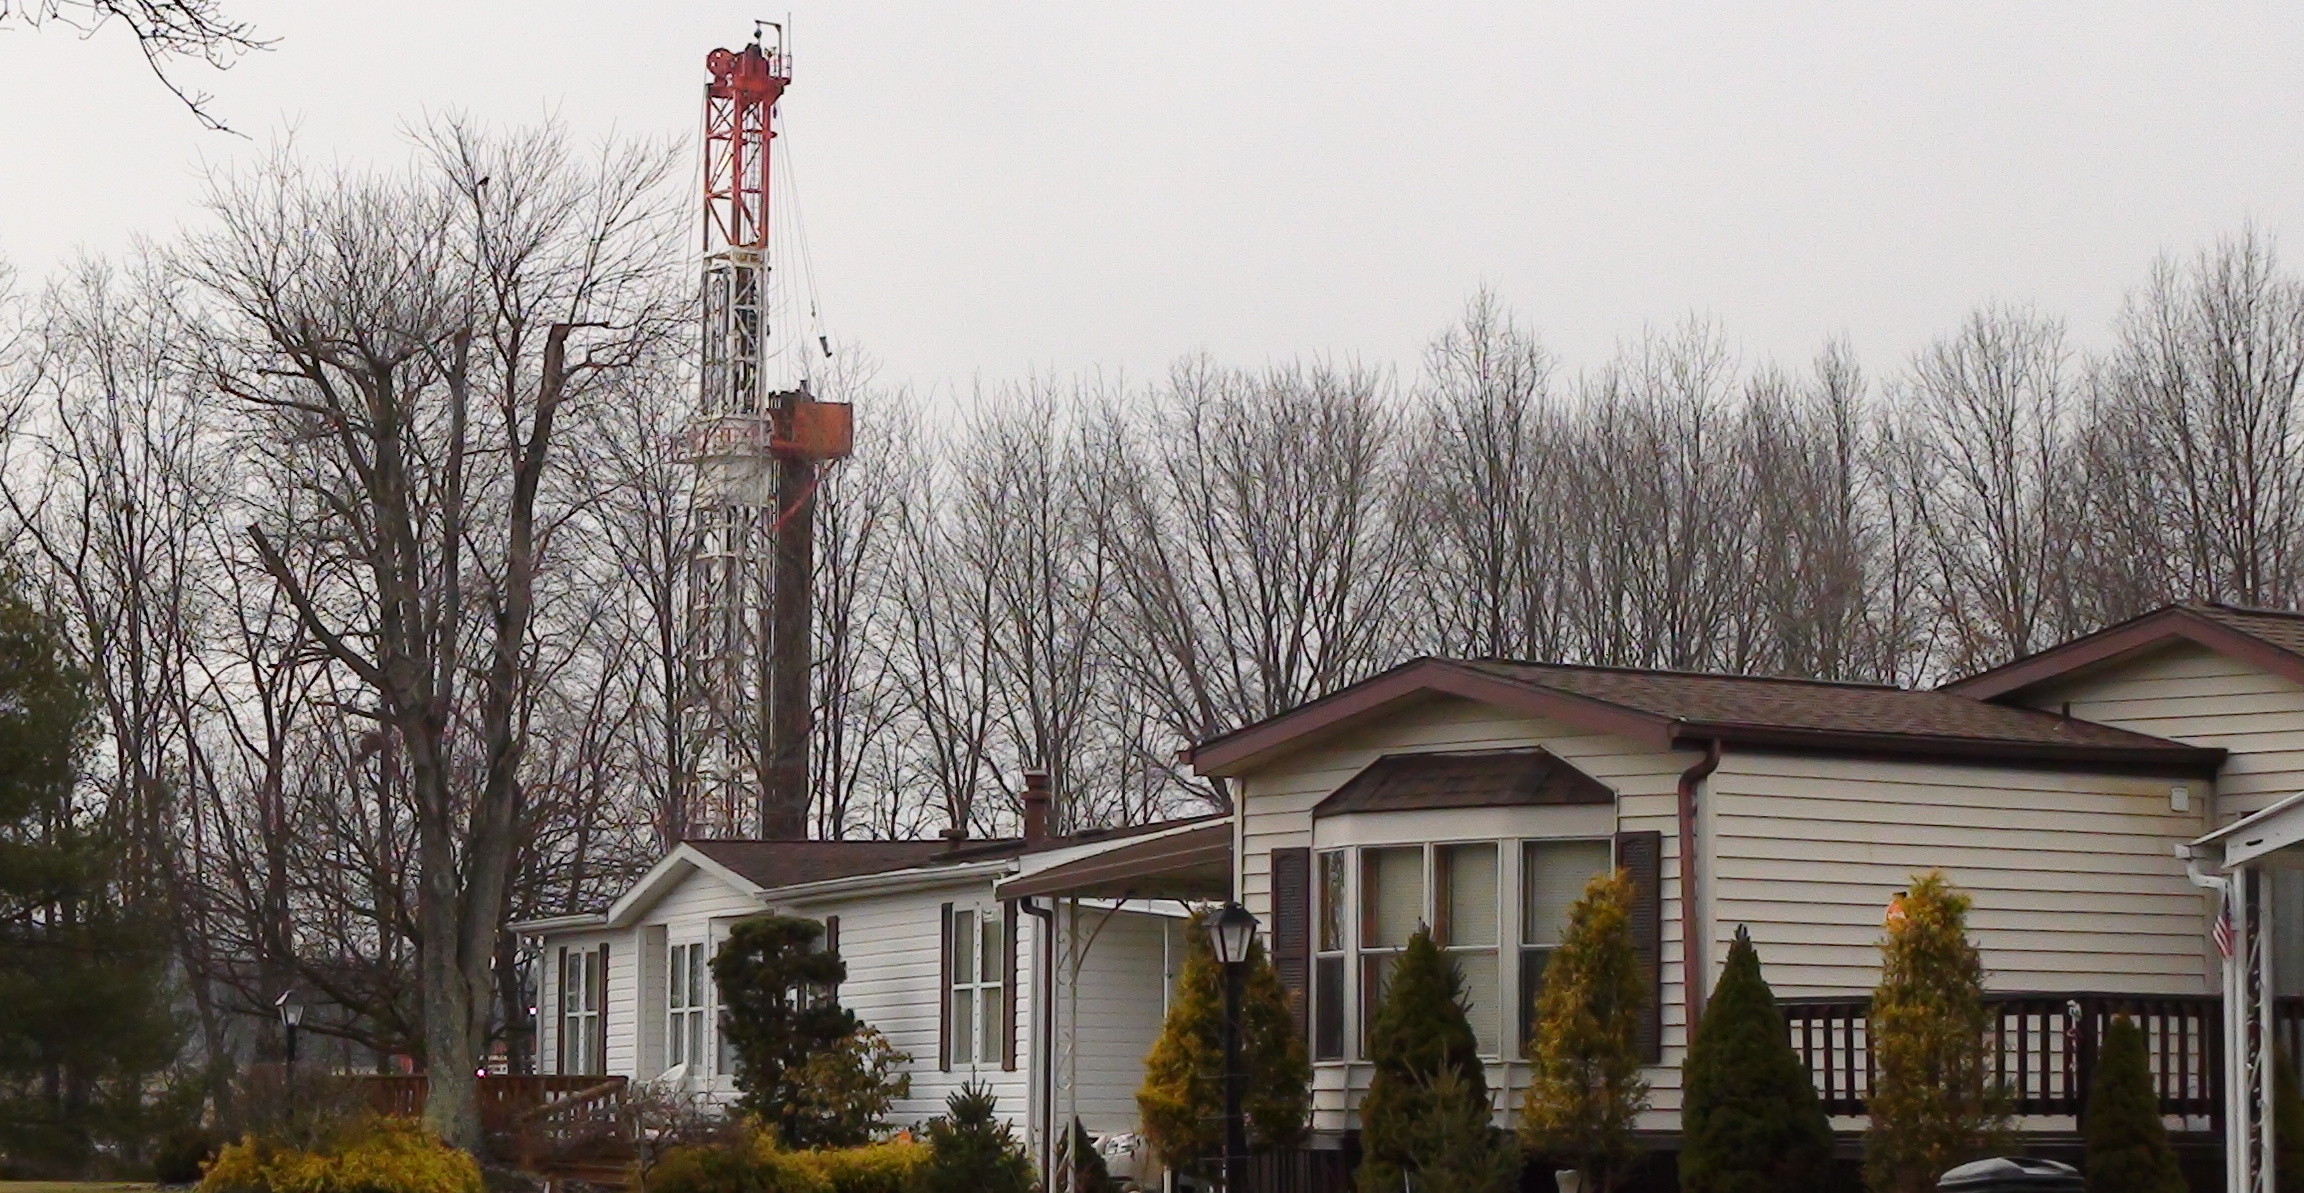
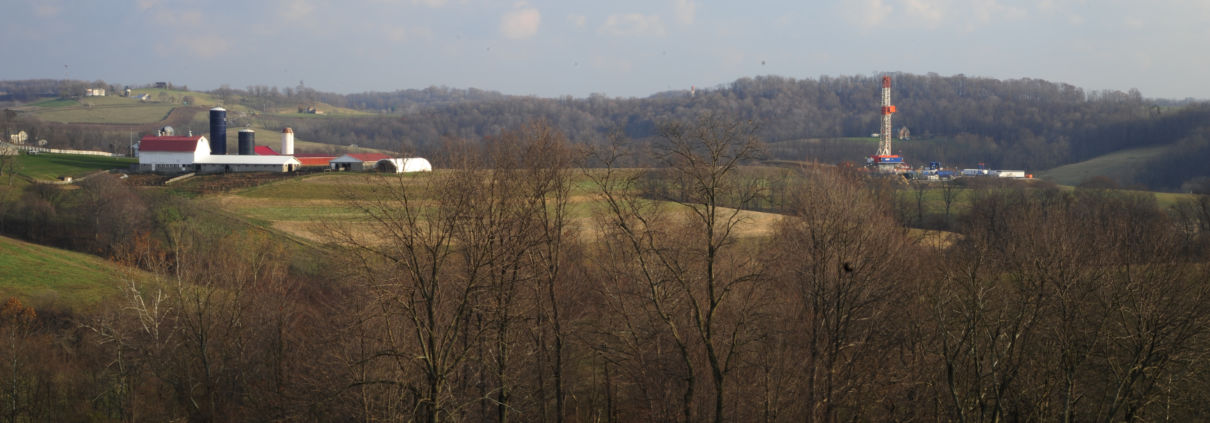
 Mr. Ron Gulla has been a pivotal voice in fighting unconventional oil and gas development in Pennsylvania and beyond. After natural gas development destroyed his property in Canonsburg, PA in 2005, Mr. Gulla became an outspoken advocate for citizens and landowners facing the many harms of fracking.
Mr. Gulla knows the industry well, having worked as an equipment supplier for various oil and gas operations. Like so many, he believed the industry crusade that touted energy independence and its promise of becoming a “shalionaire.”
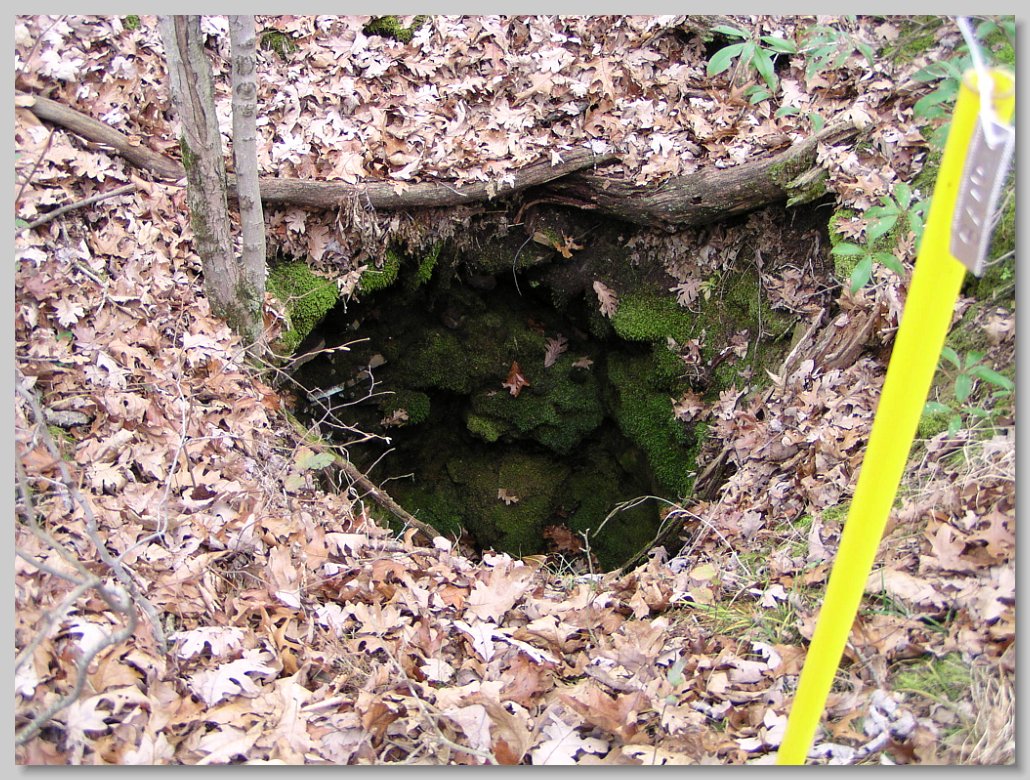
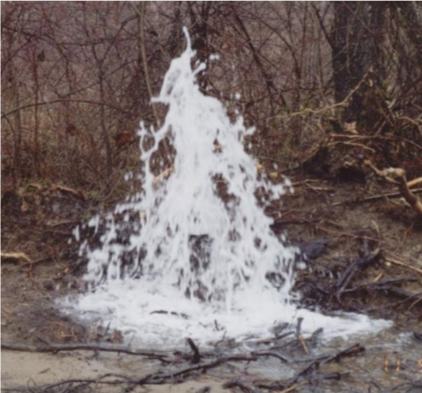
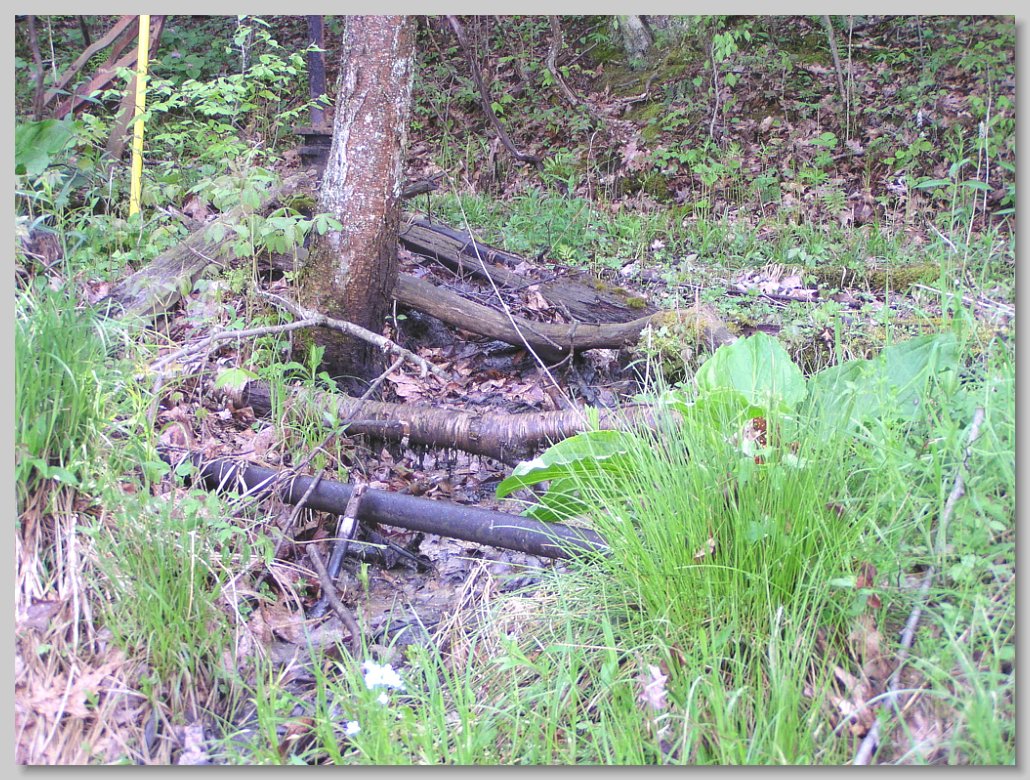
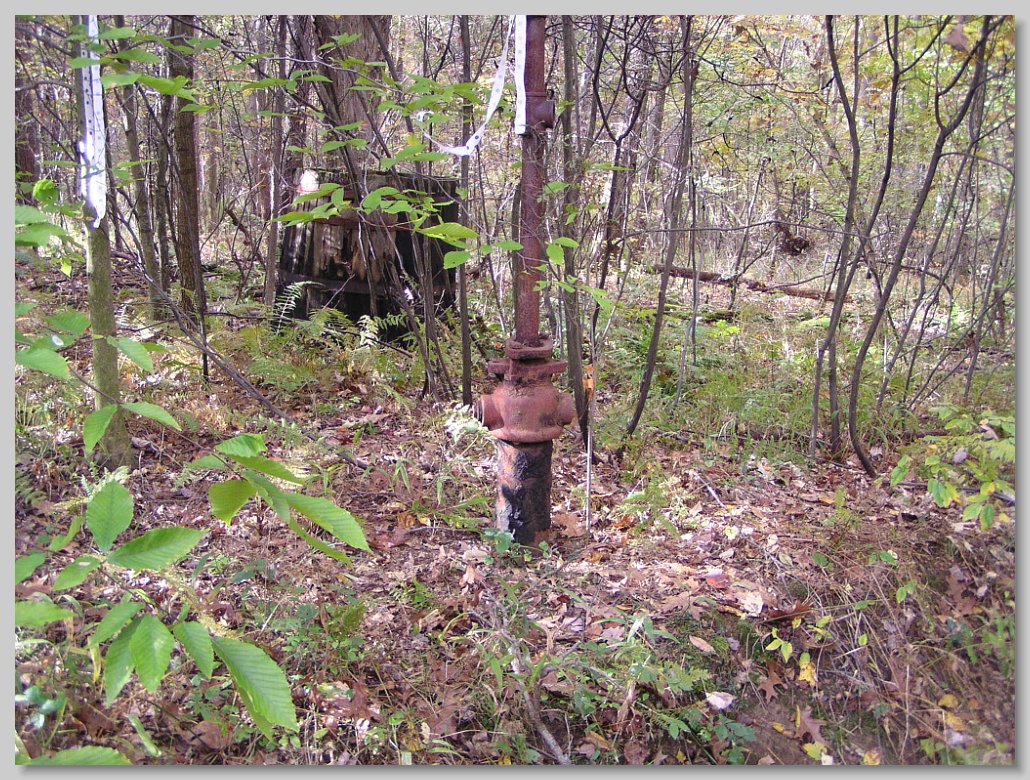
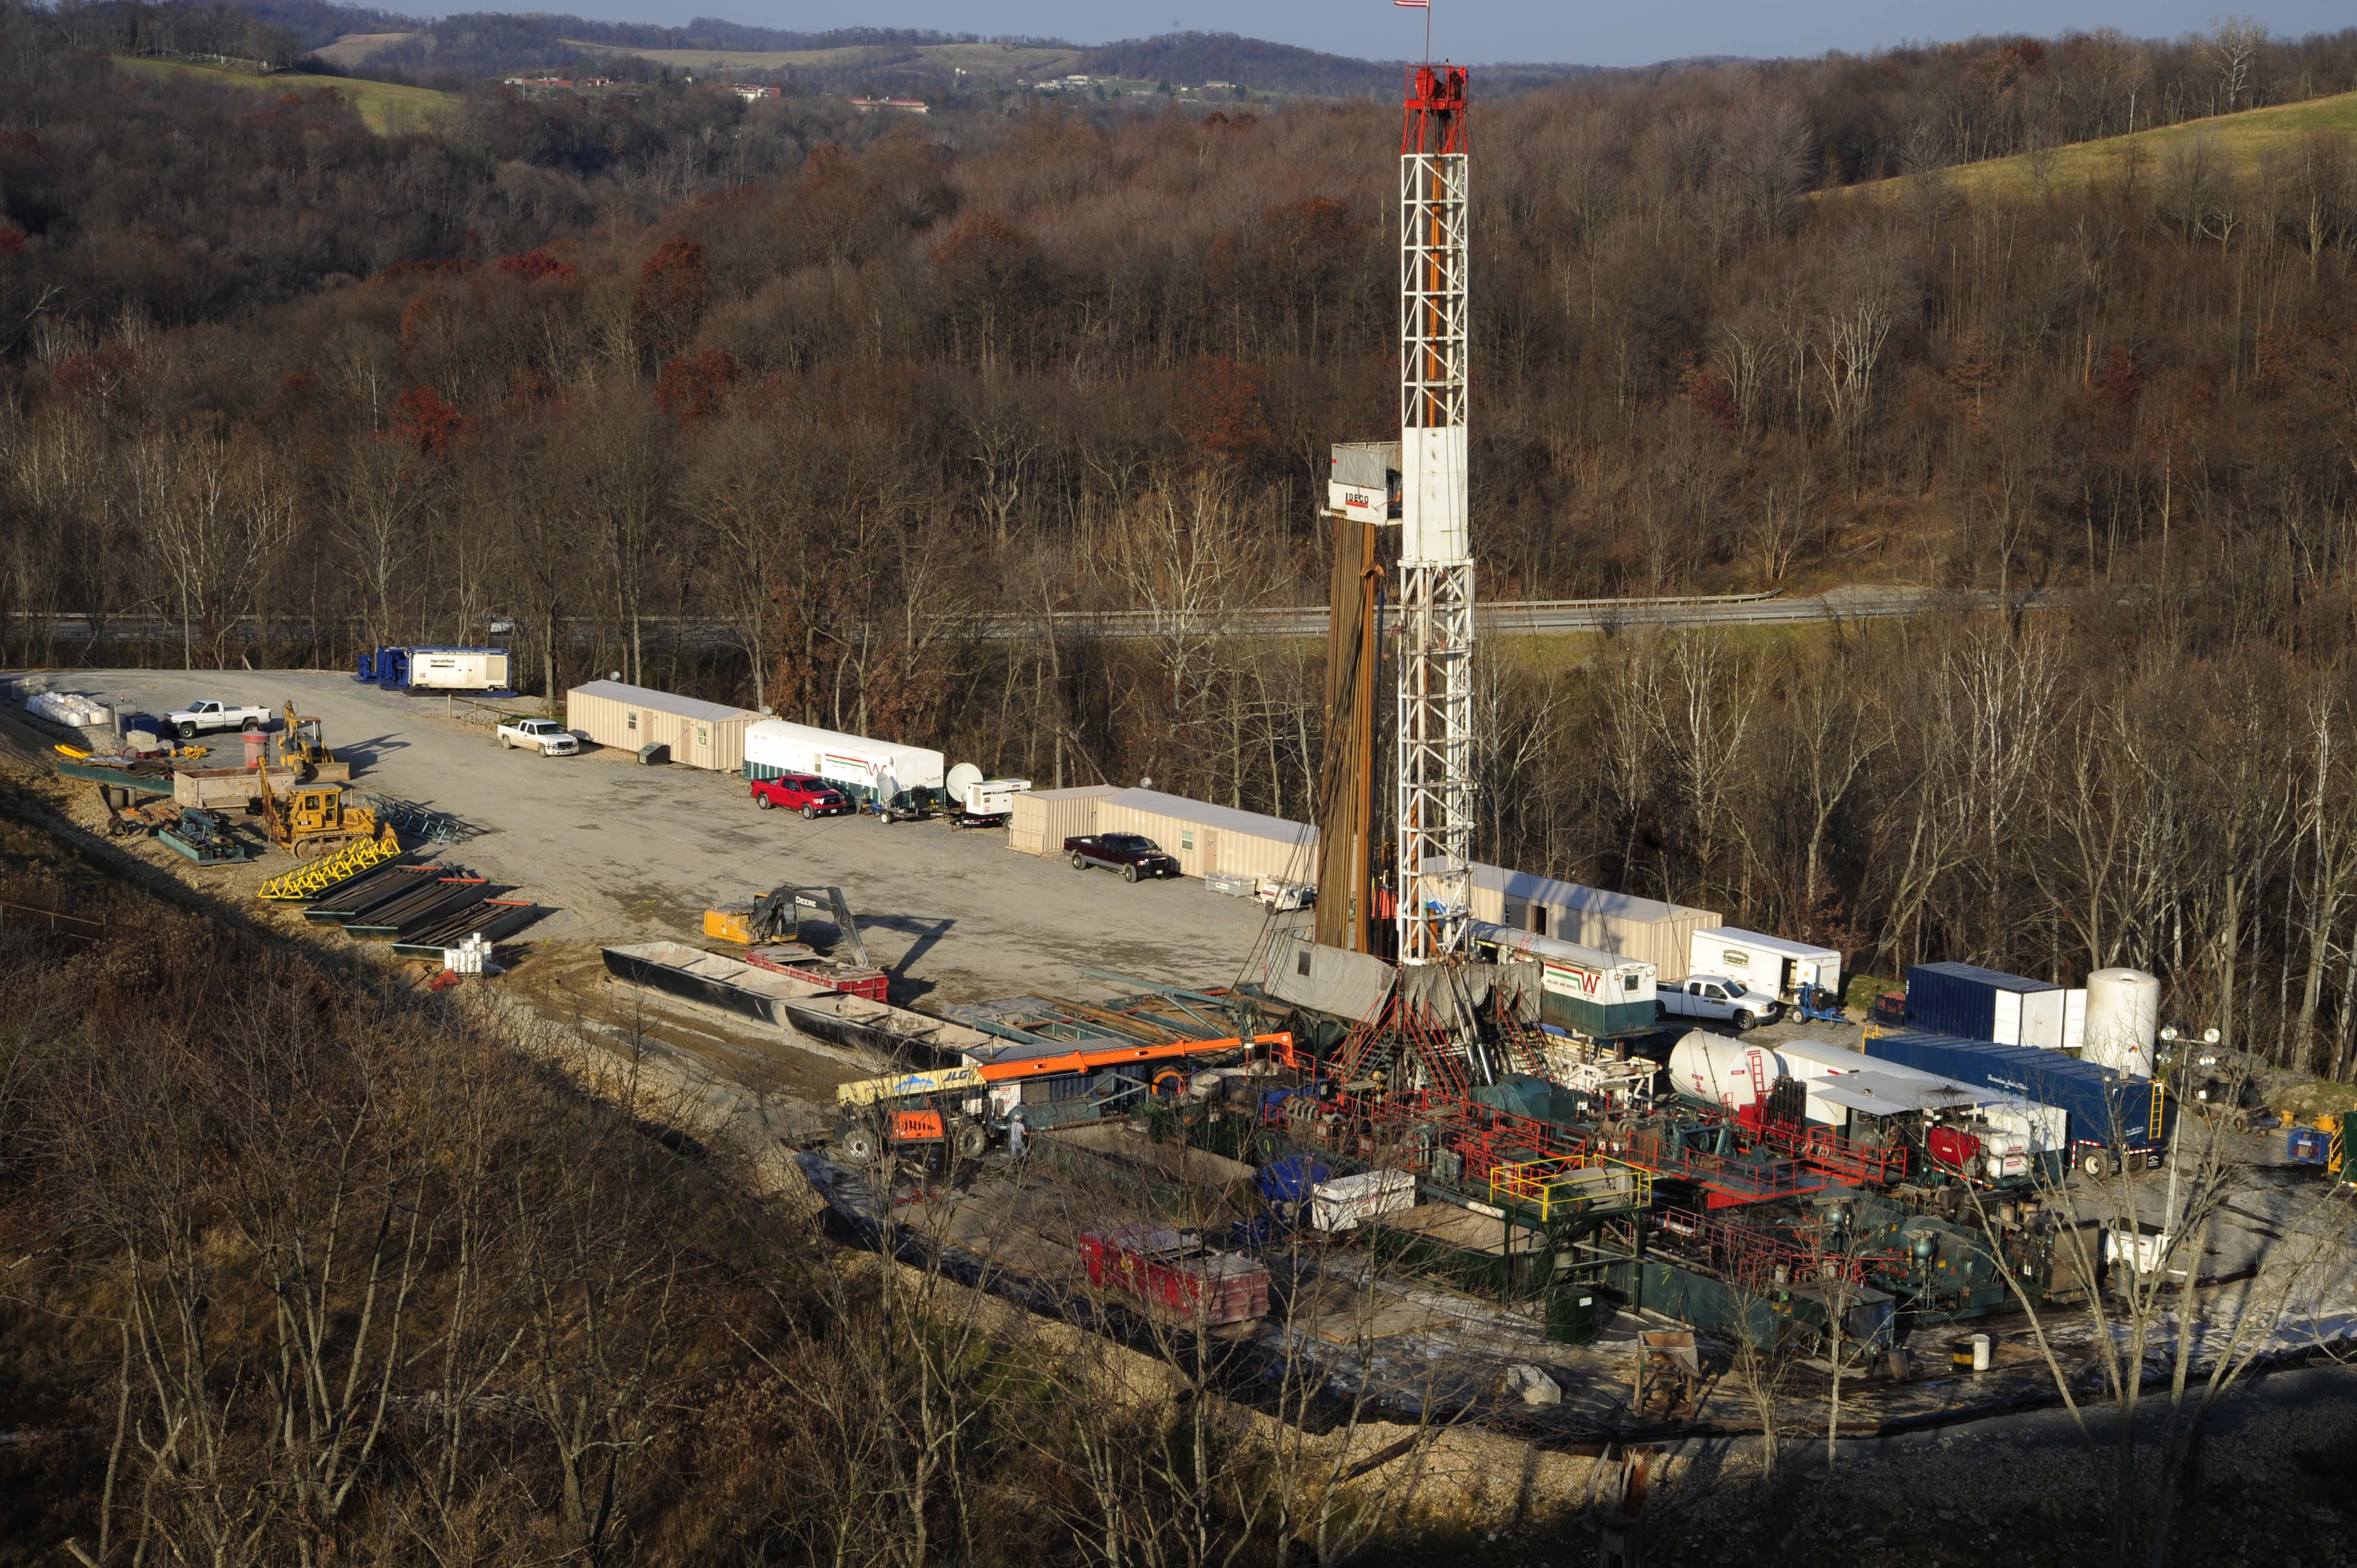
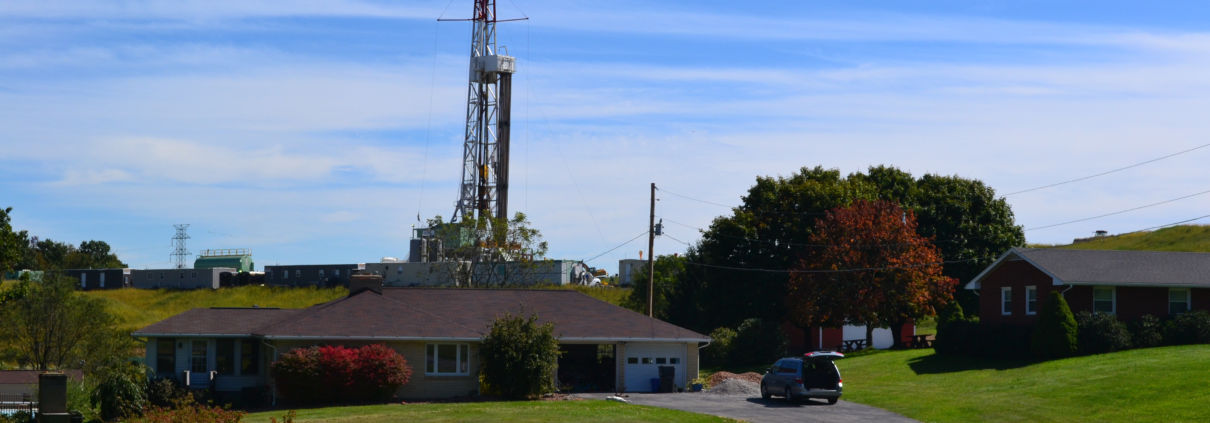
Four unconventional gas wells were installed on Mr. Gulla’s property from 2005 to 2008. As a result, his water source and soil were contaminated, as well as a nearby stream and pond. He immediately began speaking out about his experiences and warning people of the potential dangers of fracking. Soon, people from all over the state were reaching out to him to share their stories.
Mr. Gulla became a central figure in informing and connecting people who were desperately looking for help. He has documented individuals’ stories for health studies and appropriate regulatory agencies, testified in front of the PA Department of Health and other official bodies, and he was instrumental in organizing letter campaigns with other affected landowners addressed to local district attorneys. These efforts resulted in a statewide investigation into many of these cases. He also has coordinated with local, state, and national news agencies to expose these critical issues.
Mr. Gulla proactively engaged the media and brought like-minded people together to tell their stories. Without his relentless efforts, much of the progress made in exposing the oil and gas industry in Pennsylvania would not have been possible.
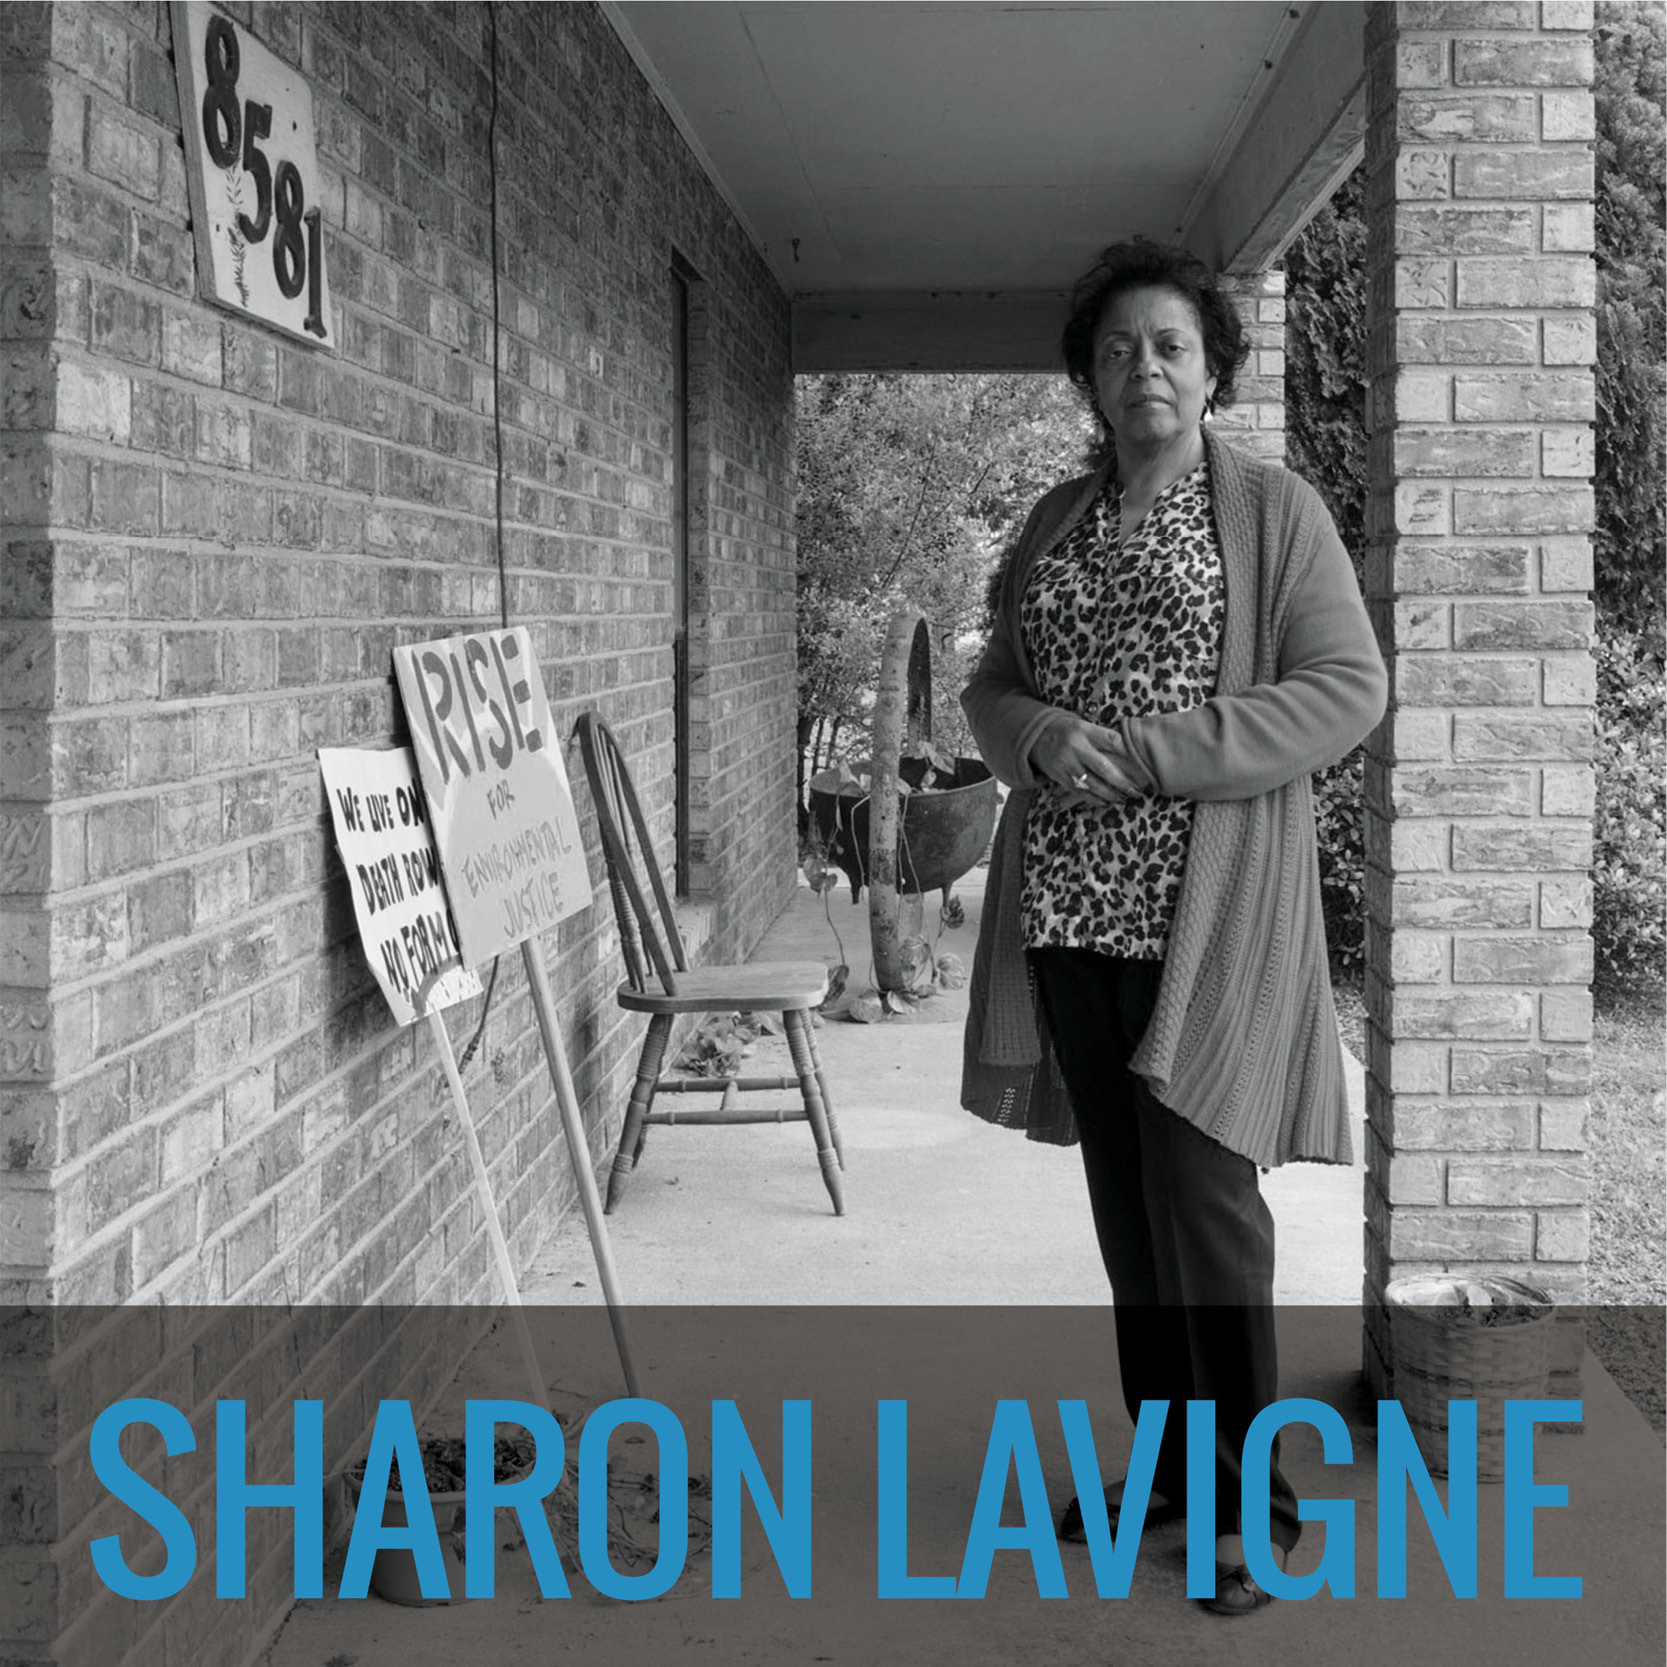
- Sharon LavigneMs. Sharon Lavigne lives in the epicenter of the oil, gas, and petrochemical facilities in Louisiana. She is the founder of RISE St. James, a faith-based environmental and social justice organization dedicated to protecting St. James Parish from these toxic, cancer- causing industries. Her work is a matter of life or death — the 20 acres of land that Ms. Lavigne inherited from her grandfather is dead center of what is known today as “Cancer Alley.”
The 4th and 5th Districts of St. James Parish are majority Black neighborhoods, and they were the only districts to be covertly rezoned from residential to “residential/future industrial.” The environmental racism could not be more pronounced. Ms. Lavigne is fighting to protect the health of all residents living along the 85-mile long Cancer Alley, from those in New Orleans to those in Baton Rouge. Industry and elected officials are intent on wiping historic Black communities off the map, but with Ms. Lavigne’s leadership, residents are rising up to protect their health, their home, and their future.
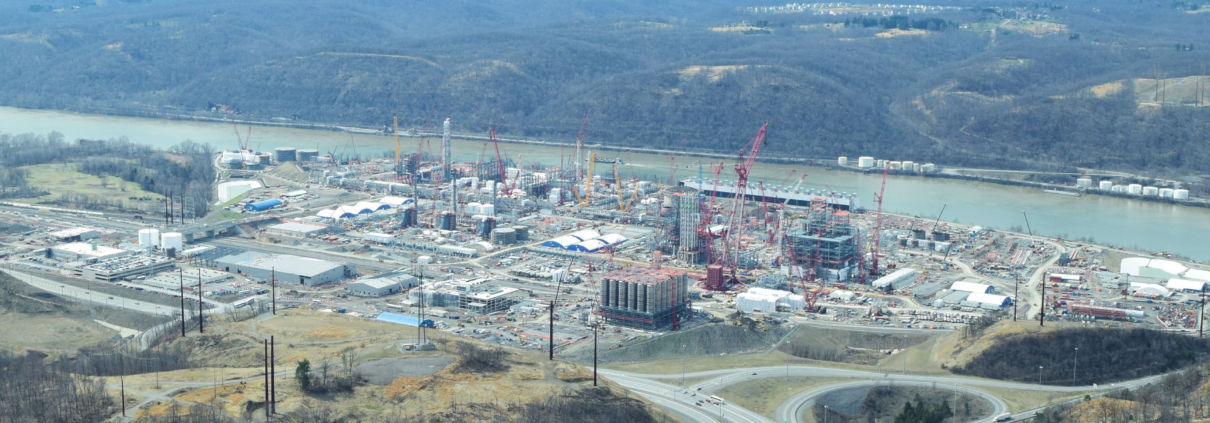
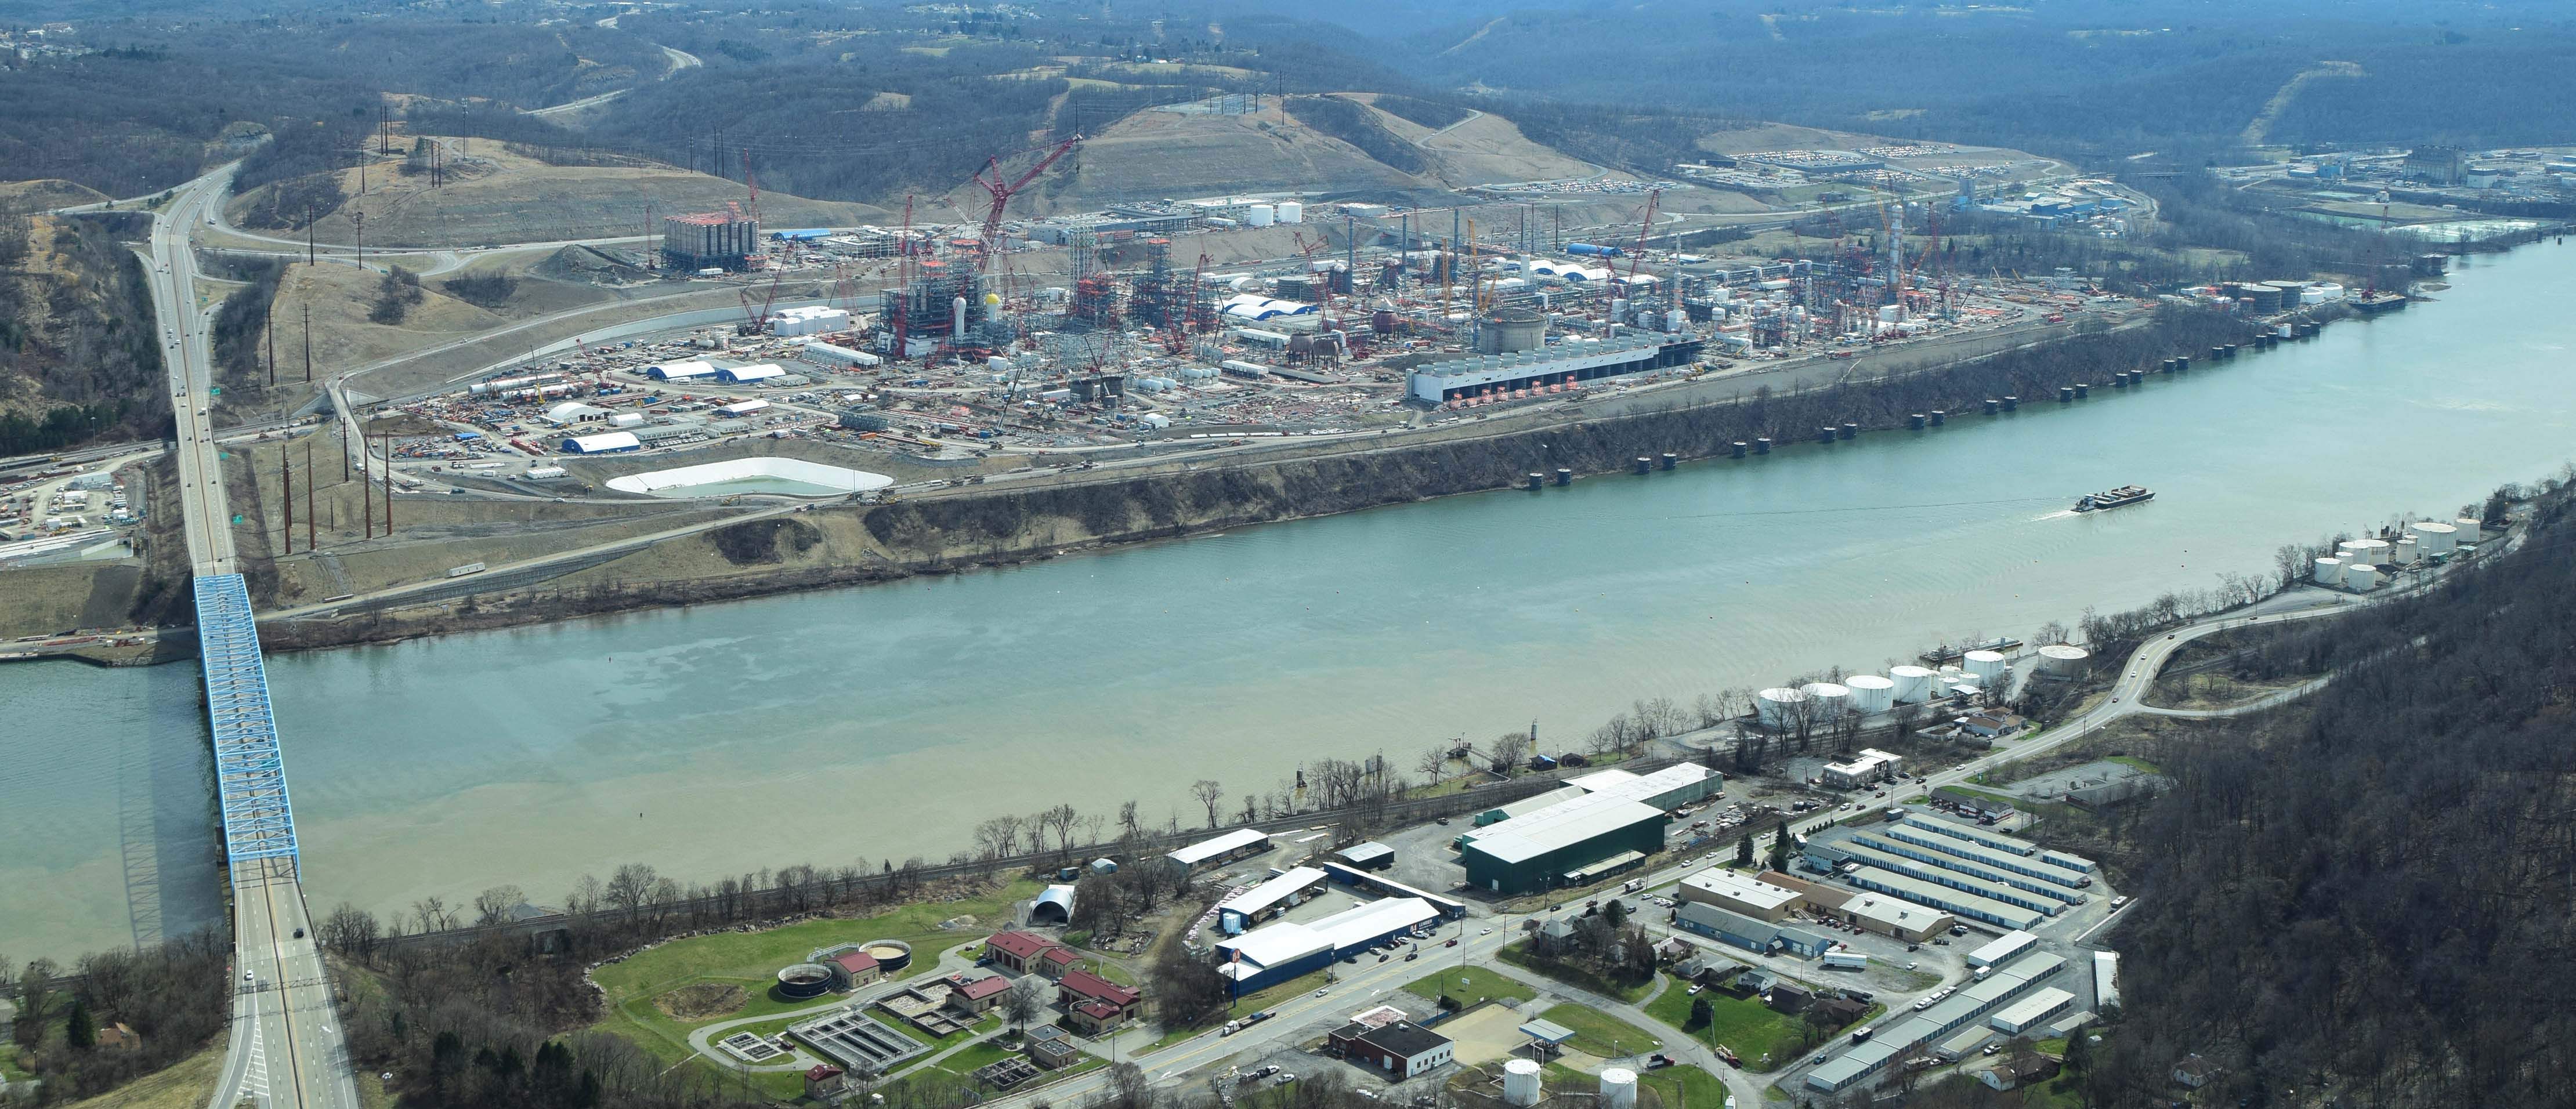
At the heart of Ms. Lavigne’s work with RISE St. James is the demand for a moratorium on oil, gas, and petrochemical industry in St. James Parish. The district where Sharon lives has 2,822 people and 12 petrochemical plants — one plant for every 235 residents. Despite these staggering ratios, Formosa Plastics is trying to build a 14-plant petrochemical complex less than two miles from Ms. Lavigne’s home.
After working tirelessly over the last year to educate and mobilize other residents, Ms. Lavigne and RISE St. James members recently celebrated their biggest victory yet: blocking a $1.5B Wanhua petrochemical plant from moving into St. James Parish and operating within a mile of residents’ homes. In Ms. Lavigne’s words, “This is our land, this is our home, and we are standing up together to defend it. St. James is rising.”
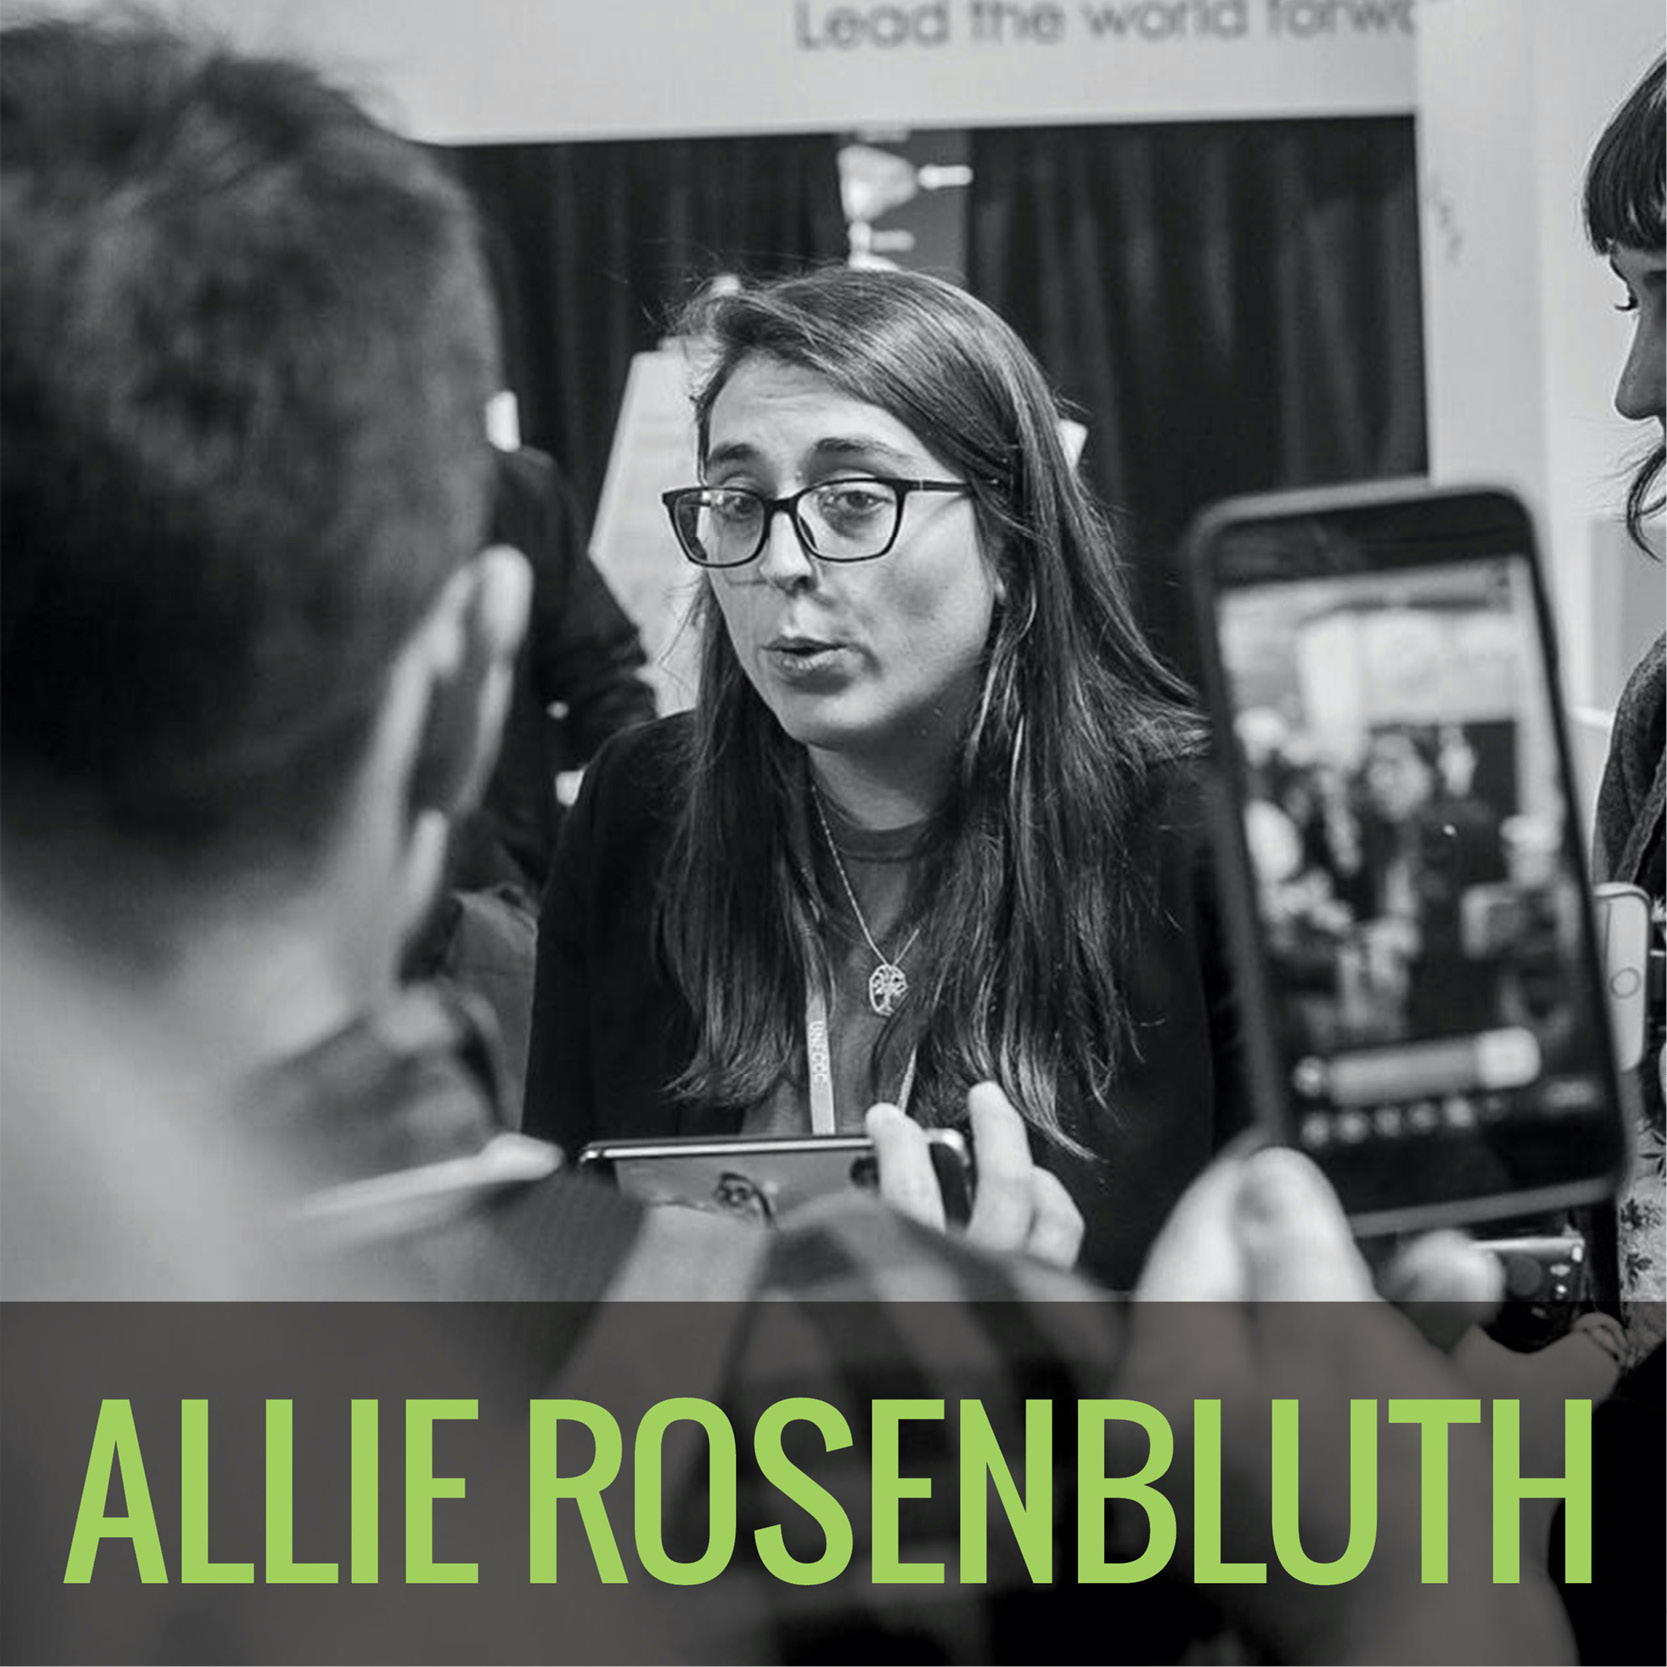
- Allie RosenbluthMs. Allie Rosenbluth is a dedicated community activist who has spent years coordinating a huge grassroots rural coalition opposing Pembina’s proposed Jordan Cove LNG export terminal and Pacific Connector fracked gas pipeline in southern Oregon. She also recently traveled to Poland as a COP 24 delegate with SustainUS, a youth-led justice and sustainability advocacy group.
For over a decade, the Jordan Cove LNG project has been threatening southern Oregonians with the prospect of a 36-inch pipeline stretching across four rural counties, 229 miles, and over 180 state waterways, ending in a massive methane liquefaction and export terminal in Coos Bay. Ms. Rosenbluth has worked incredibly hard to ensure that all those opposed to the project gets a chance to speak with their elected representatives about the project and make their voice heard in local, state, and federal permitting processes. She has coordinated efforts to generate tens of thousands of comments in state and federal agency comment periods to review the various environmental impacts of the project. This turnout has surpassed public participation records in such permitting processes.
Ms. Rosenbluth’s efforts helped lead to a May 2019 denial from the Oregon Department of Environmental Quality on a Clean Water Act permit needed to build the project, underlining the importance of state authority to defend water quality under Section 401 of the Clean Water Act, which the Trump Administration was simultaneously trying to weaken. She also helped mobilize over 3,000 rural Oregonians to attend four public hearings on the State Lands review of the project. Ms. Rosenbluth’s masterful coalition-building has helped unify people of all political persuasions, races, and ethnicities across the state to unify their opposition to fracked gas infrastructure in Oregon.
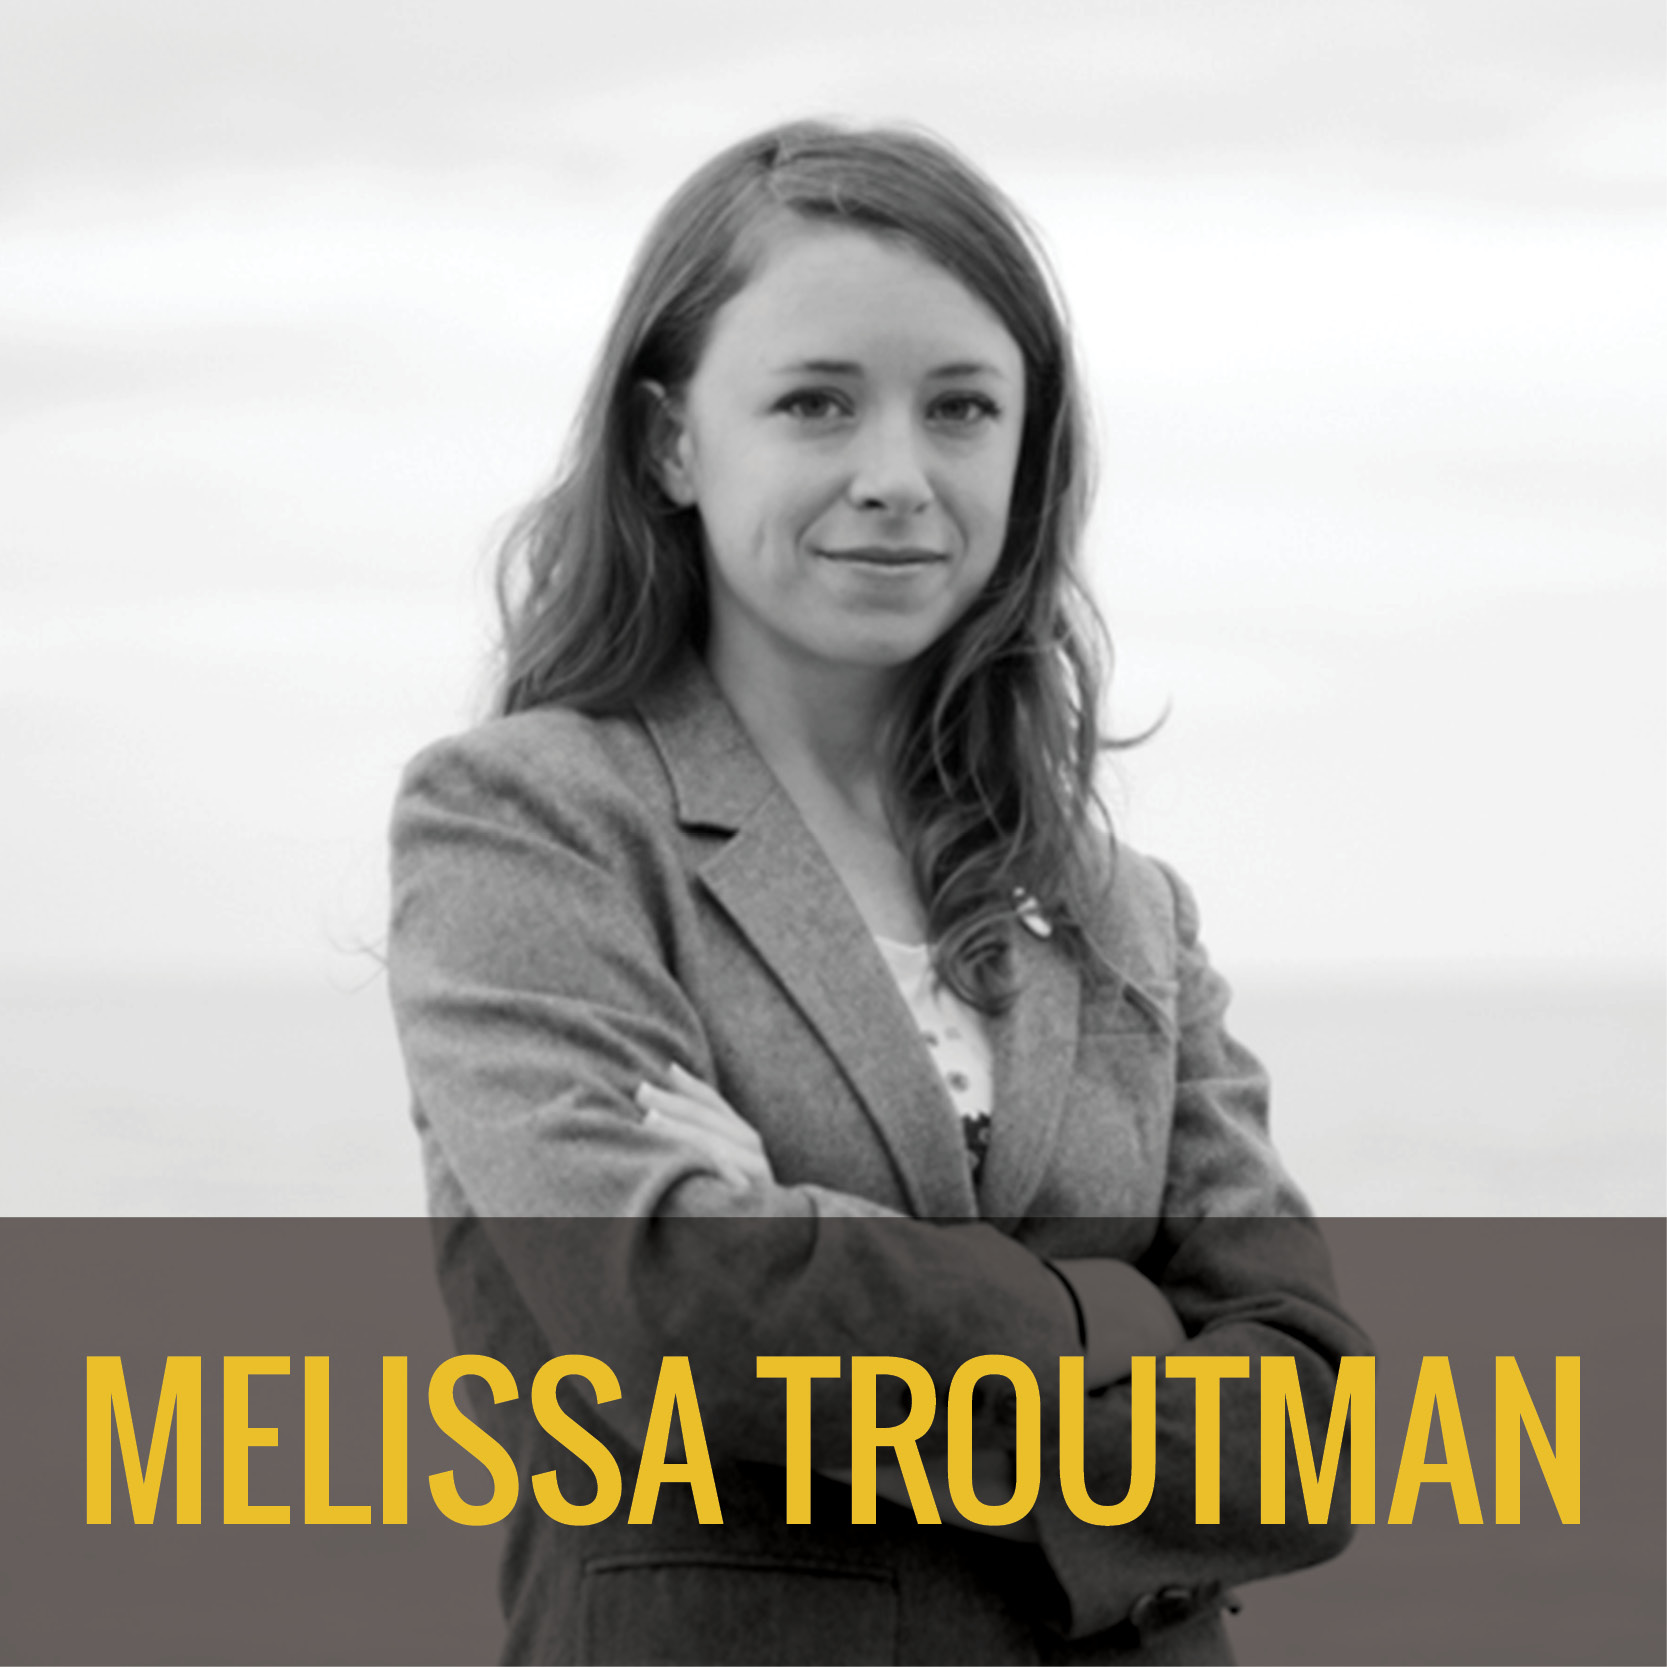
- Melissa TroutmanMs. Melissa Troutman is co-founder of the investigative news nonprofit Public Herald as well as a research and policy analyst for Earthworks. Her work as a film director and journalist has redefined the landscape and narrative around fracking w, and her community organizing has led to major wins against the industry.
Ms. Troutman’s Public Herald publications have seen widespread coverage. Her work has been referenced in the books Amity and Prosperity: One Family and the Fracturing of America by Eliza Griswald; Legal Rights for Rivers: Competition, Collaboration and Water Governance by Erin O’Donnell; and Sustainability and the Rights of Nature: An Introduction by Cameron La Follette and Chris Maser. Her work has been cited in over 20 academic studies to date. Furthermore, Ms. Troutman has produced three award-winning documentary films on fracking: Triple Divide (2013), TRIPLE DIVIDE [REDACTED] (2017), and INVISIBLE HAND (2019). Her films continue to play an important role in the narrative surrounding fracking and democracy.
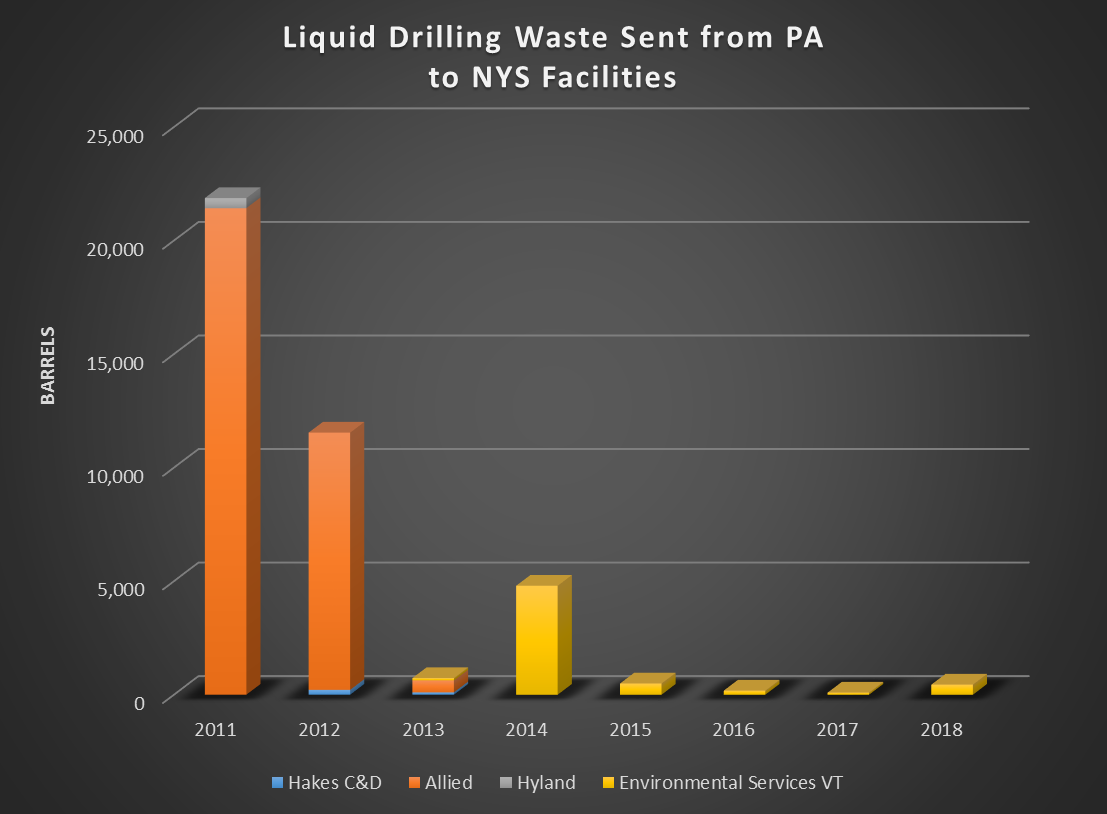
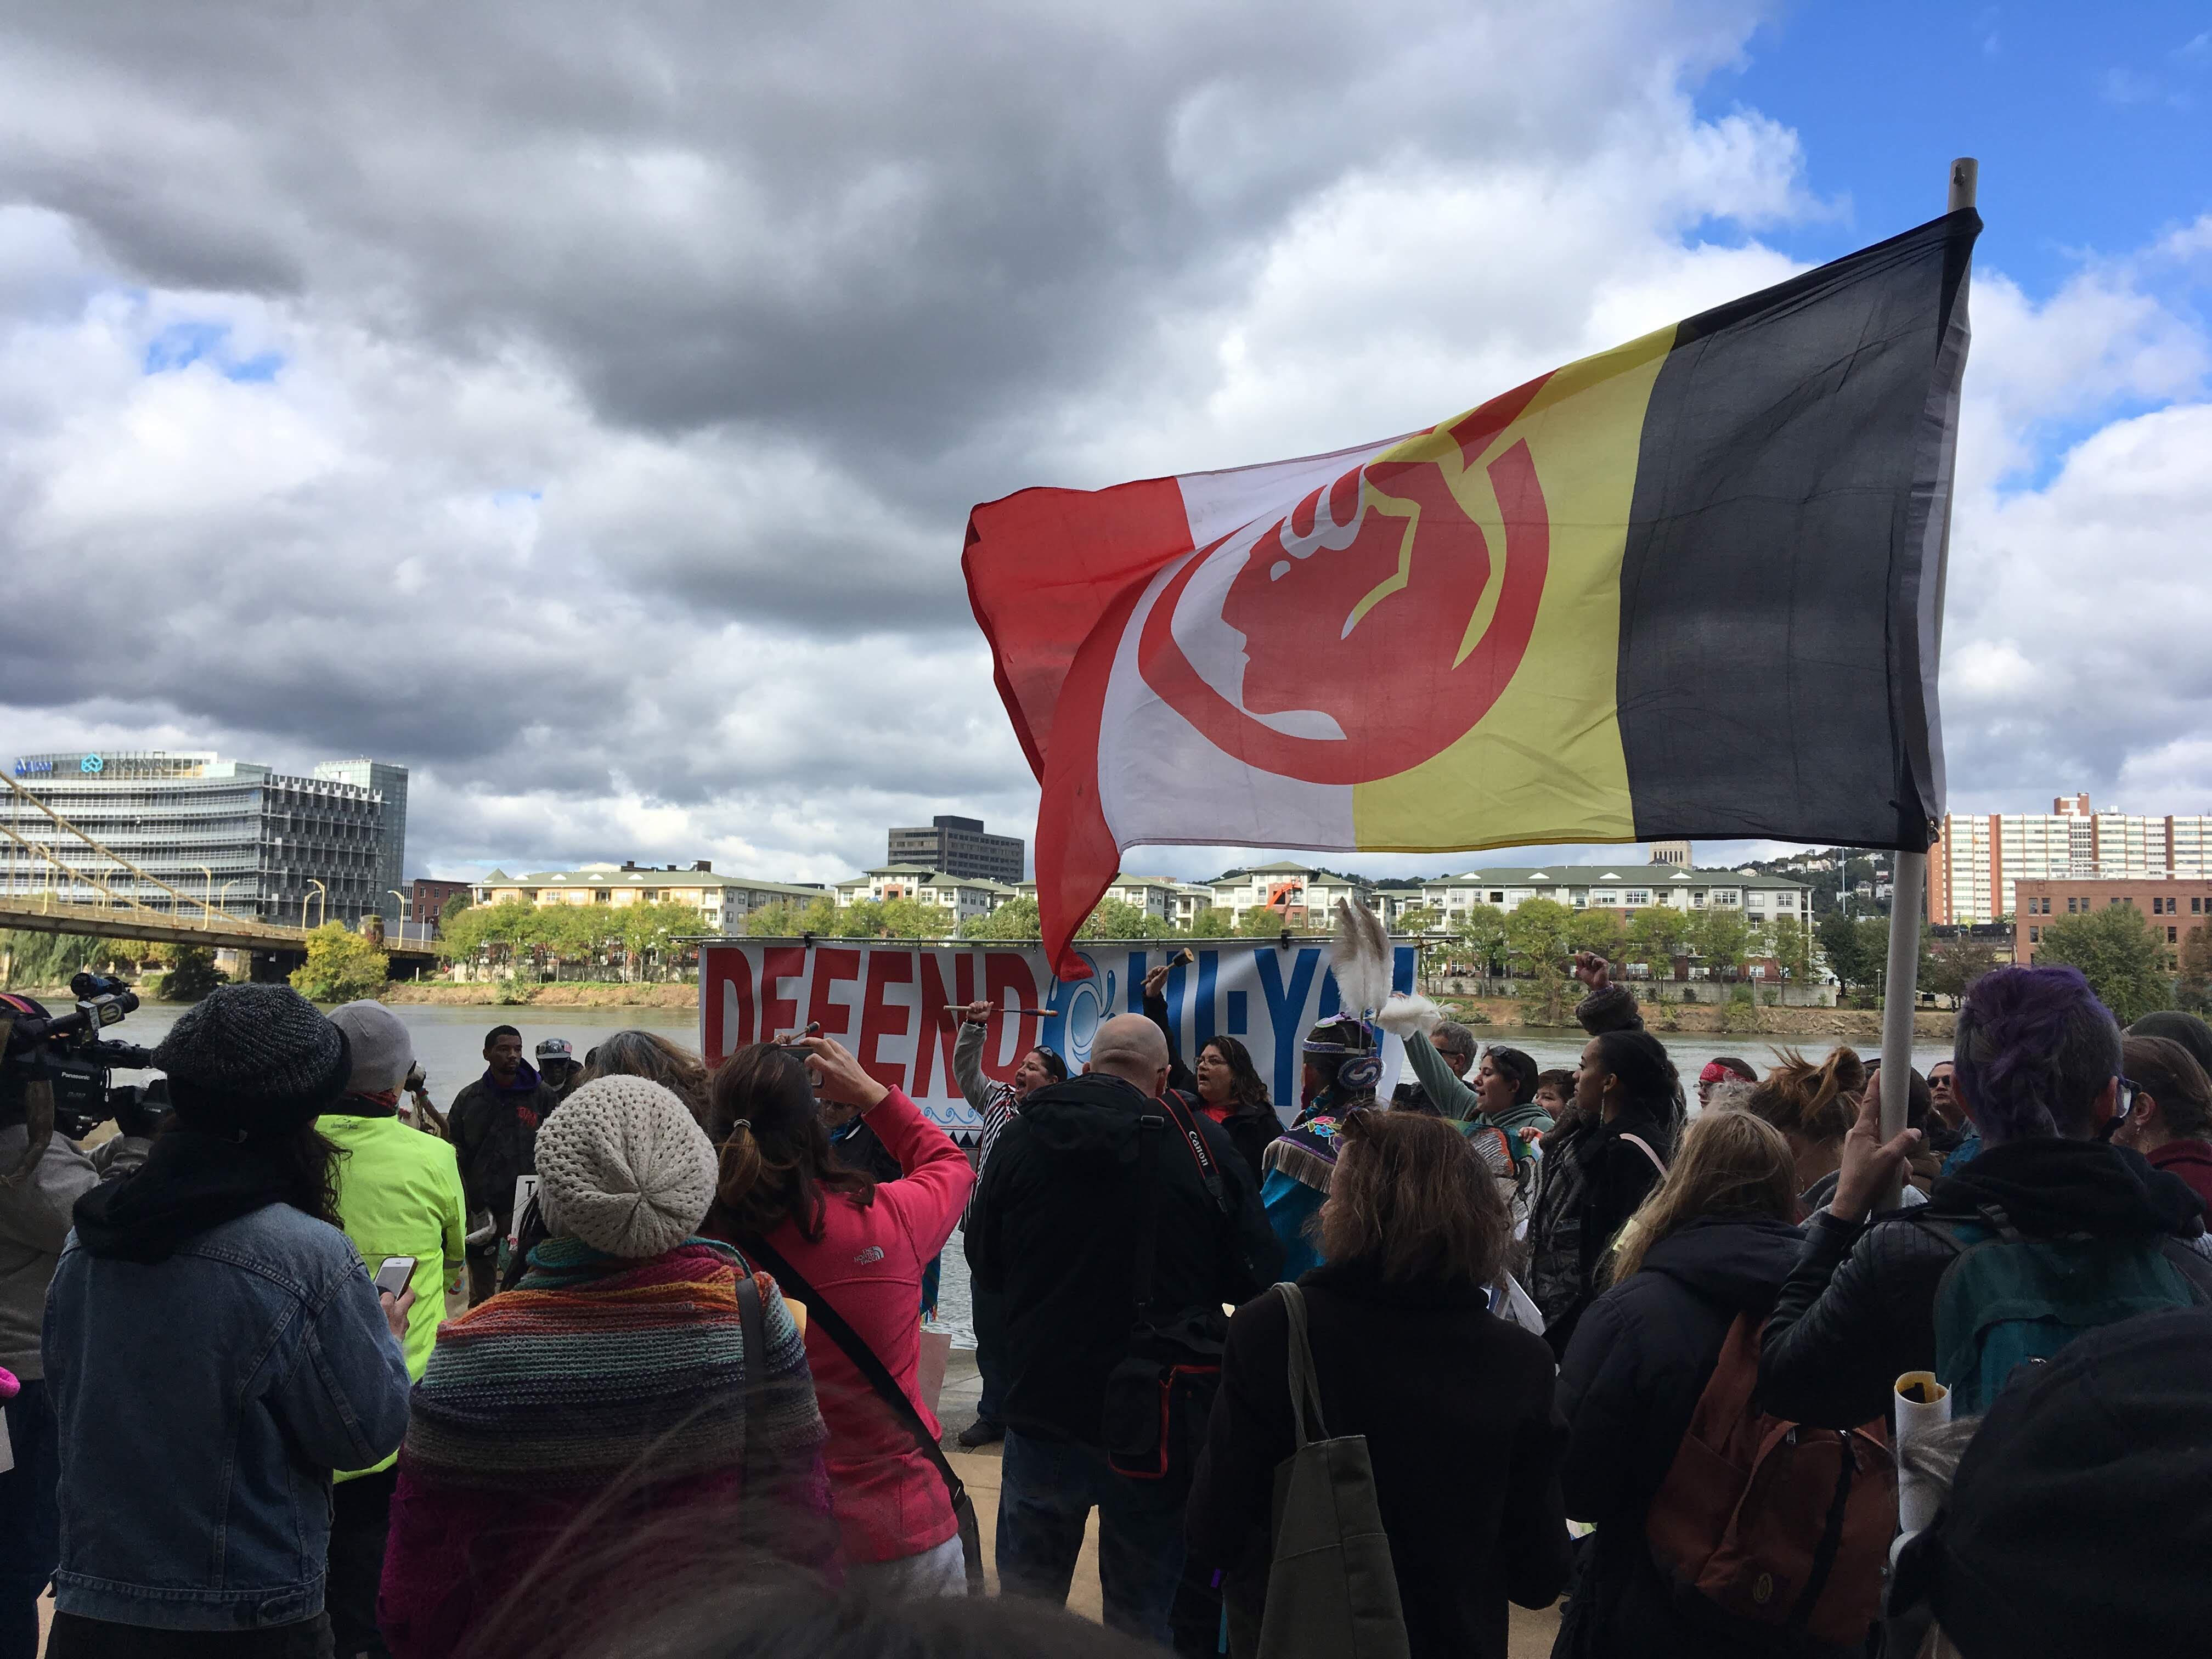
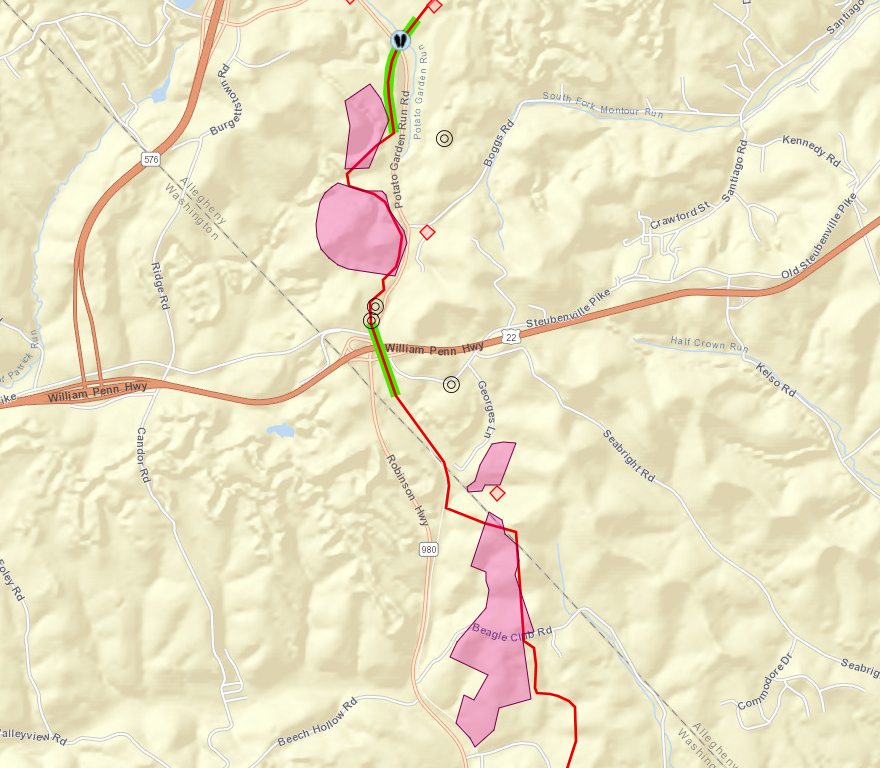
In 2017, Ms. Troutman uncovered that 9,442 complaints related to oil and gas operations were never made public by the state. Her analysis of drinking water complaints revealed official misconduct by state officials that left families without clean water for months, even years. Consequently, Public Herald called for a criminal and civil investigation of the Pennsylvania Dept. of Environmental Protection. In 2018, Ms. Troutman’s reporting on an untested fracking wastewater treatment facility at the headwaters of the Allegheny River was used by the Seneca Nation of Indians to shut down the project.
Ms. Troutman’s tireless efforts are an inspiration to the environmental movement in Pennsylvania, across the country, and beyond.
Legacy of Heroes Recognition
- Bill Hughes
On March 25, 2019, Bill Hughes of Wetzel County, West Virginia, passed away at age 74. Mr. Hughes, an environmental defender extraordinaire and former FracTracker colleague, served on the County solid waste authority, where he consistently pushed back on accepting the radioactive waste of the fracking industry. For nearly a decade, Mr. Hughes documented and disseminated photographic evidence of the activities and effects of shale gas development, and in turn educated thousands of people on the negative impacts of this industry. Mr. Hughes also shared information via gas field tours, PowerPoint presentations to groups in five states, op-ed pieces written for news media, and countless responses to questions and inquiries.
His legacy lives through the multitude of lives he enriched – from students, to activists, to everyday people. Bill was an omnipresent force for good, always armed with facts and a pervasive smile.
- April Pierson-Keating
April Pierson-Keating of Buckhannon, West Virginia, passed away on September 28, 2019, at age 52. Mrs. Pierson-Keating was the founder and director of Mountain Lakes Preservation Alliance, and a founding member of Preserve Our Water Heritage and Rights (POWHR). She was a board member of the Buckhannon River Watershed Association, the cancer research group ICARE, and the WV Environmental Council, and she was also a member of the Sierra Club, the WV Highlands Conservancy, and Ohio Valley Environmental Coalition (OVEC). When one met Mrs. Pierson-Keating, one could not help noticing and absorbing her passion for environmental preservation.
Mrs. Pierson-Keating received the Buckhannon BEST Award on May 14, 2019 in recognition of her commitment. Mayor David McCauley stated: “Mrs. Keating is a supreme protector of our environment. She is a lobbyist for clean water at both our state and federal governments, a participant in Buckhannon’s Community Unity & Kindness Day, the Equality March, the Science March, and other awareness activities… April Keating has helped us all in our B-U community to be happier and healthier in many ways.”
- Ricky Allen Roles
Ricky Allen Roles passed away at age 61 at his ranch in Silt, Colorado, on November 22, 2018. Mr. Roles was an adamant anti-fracking activist and spent many years fighting for safer oil and gas drilling and fracking regulations. He tirelessly fought to protect our earth’s sacred water and soil for the health and wellness of all living creatures. He is featured in books such as Fractivism and Collateral Damage, and documentaries including the Emmy Award winning film Split Estate and Oscar-nominated and Emmy-Award winning Gasland. He also bravely testified before Colorado’s Congress on the dangers of fracking.
Mr. Roles shared how his and his livestock’s health precipitously declined with the drilling of 19 wells on his property. He experienced respiratory, immune, and nervous system problems. Despite his health problems,
he strove to create awareness of the harmful impacts of fracking in his community and beyond. With those publications, his voice, beliefs and legacy will be heard forever. - John A. Trallo Sr.
John A. Trallo, Sr., 67, of Sonestown, Pennsylvania passed away on August 13, 2019. Mr. Trallo was a dedicated environmental activist who contributed to several groups working on pressing environmental issues such as hydraulic fracturing. He was a brilliant man who earned three college degrees and a teaching certificates in two states. He asked hard questions and was adamant in keeping government officials accountable. Some of the groups he was involved with were: Responsible Drilling Alliance (RDA), Shale Justice, The Community Environmental Legal Defense Fund (CELDF), PA Community Rights Network, and Organizations United for the Environment. Mr. Trallo left this planet a better place for future generations, and we honor his spirit by continuously working towards his noble vision.
Sponsors and Partners
The Sentinels’ program and reception requires financial support—for monetary awards, awardee travel, and many
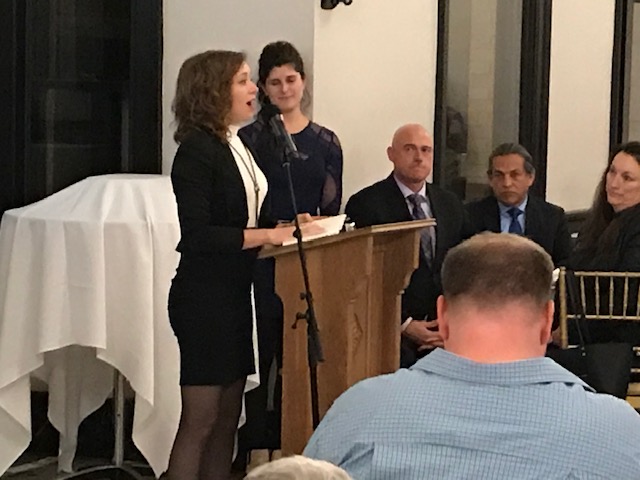
Michele Fetting of the Breathe Project and and FracTracker Board Member introducing 2019 Sentinel Award Winner Sharon Lavigne
other costs. As such, each year we call upon dedicated sponsors and partners for resources to enable this endeavor to continue. The daily, often-thankless jobs of Community Sentinels working to protecting our health and the environment deserve no less. Thank you to this year’s incredible award sponsors: The Heinz Endowments, 11th Hour Project, Center for Coalfield Justice, and Foundation for PA Watersheds.
We extend a big thank you to the following award partners: Viable Industries, Indigenous Environmental Network, Oxfam, Rootskeeper, Food & Water Watch, STAND.earth, Halt the Harm Network, Sierra Club, Ohio Valley Environmental Coalition, Choose Clean Water Coalition, Beaver County Marcellus Awareness Community, Mountain Watershed Association, Southwest Pennsylvania Environmental Health Project, Earthworks, and FracTracker Alliance.
Nominees
The following 18 people were nominated by their peers to receive this distinguished award:
- Laurie Barr – Coudersport, PA

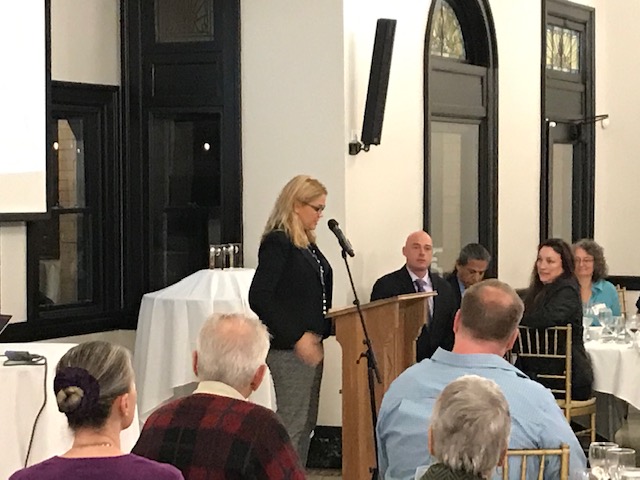
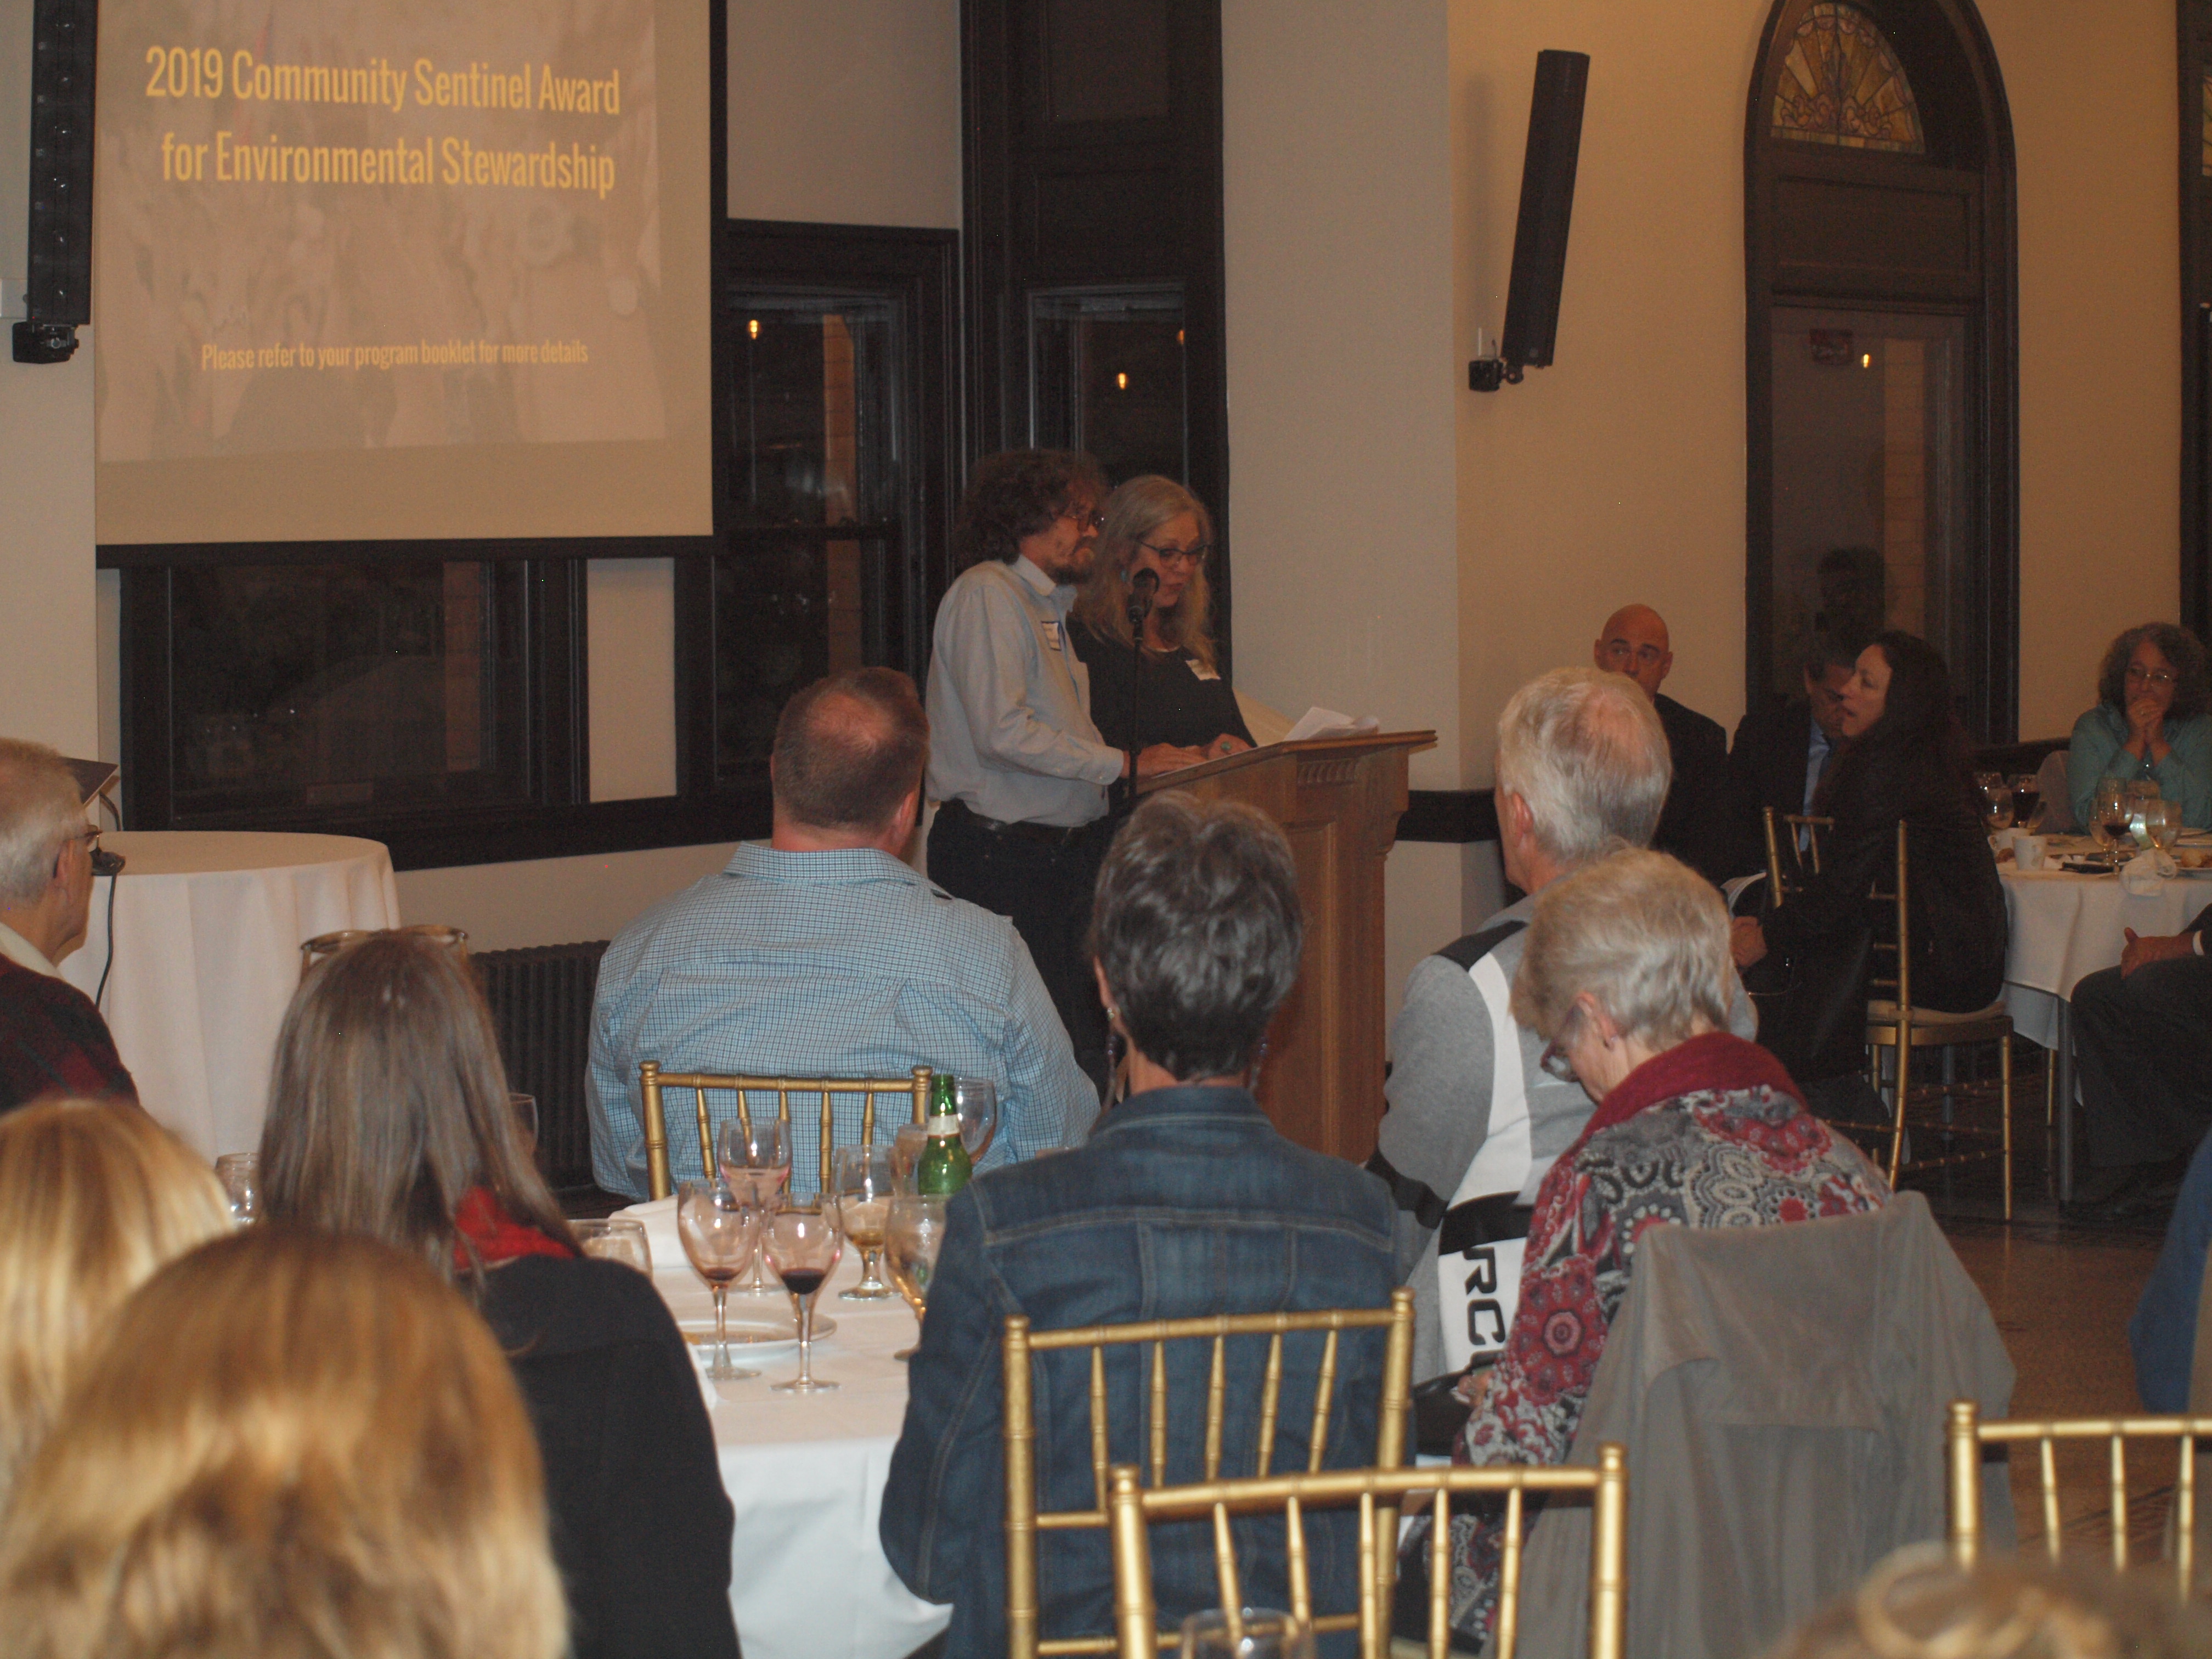
2019 Sentinel Award Winner Melissa Troutman with introducer Leanne Leiter of Earthworks
- Kim Bonfardine – Elk County, PA
- Kim Fraczek – New York, NY
- Lisa Graves – Marcucci Washington, DC
- Ron Gulla – Canonsburg, PA*
- Leatra Harper – Bowling Green, OH
- Maury Johnson – Greenville, WV
- Theresa Landrum – Detroit, MI
- Sharon Lavigne – St. James, Louisiana*
- Sara Loflin – Erie, CO
- Ann Pinca – Lebanon, PA
- Randi Pokladnik – Uhrichsville, OH
- Patricia Popple – Chippewa Falls, WI
- Bev Reed – Bridgeport, OH
- Allie Rosenbluth – Medford, OR*
- Bob Schmetzer – South Heights, PA
- Yvonne Taylor – Watkins Glen, NY
- Melissa Troutman – Pittsburgh, PA*
* Denotes 2018 award recipient
Judges
Many thanks to the following judges for giving their time to review all of the nominations.
- Mariah Davis – Choose Clean Water Coalition
- Brenda Jo McManama – Indigenous Environmental Network
- Kathleen Brophy – Oxfam
- Dr. Pamela Calla – New York University
- Matt Krogh – STAND.earth
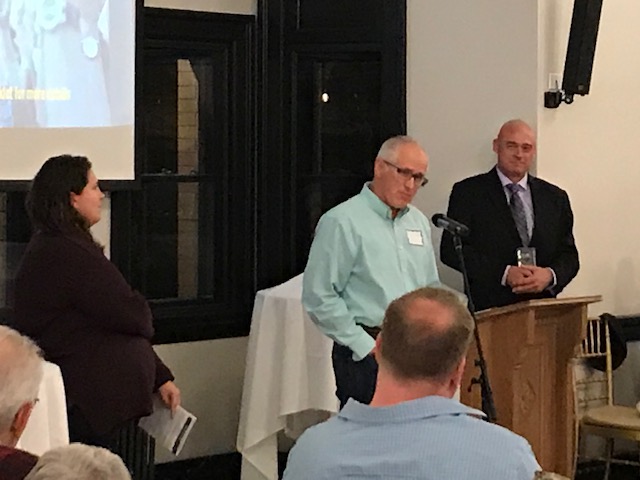
2019 Sentinel Award Winner Ron Gulla
Ethan Buckner of Earthworks introducing 2019 Sentinel Award Winner Sharon Lavigne
Keynote Speaker Andrey Rudomakha, Director of Environmental Watch on North Caucasus, with translator Kate Watters, Co-founder & Executive Director