
By Karen Edelstein, Eastern Program Coordinator, FracTracker Alliance
In an apparent move to step around compliance with comprehensive regulations outlined in the Endangered Species Act (ESA), a coalition of nine oil and gas corporations has filed a draft plan entitled the Oil & Gas Coalition Multi-State Habitat Conservation Plan (O&G HCP). The proposed plan, which would relax regulations on five species of bats, is unprecedented in scope in the eastern United States, both temporally and spatially. If approved, it would be in effect for 50 years, and cover oil and gas operations throughout the states of Ohio, Pennsylvania, and West Virginia—covering over 110,000 square miles. The oil and gas companies see the plan as a means of “streamlining” the permit processes associated with oil and gas exploration, production, and maintenance activities. Others outside of industry may wonder whether the requested permit is a broad over-reach of an existing loophole in the ESA.
Habitat fragmentation, air, and noise pollution that comes with oil and gas extraction and fossil fuel delivery activities have the potential to incidentally injure or kill bat species in the three-State plan area that are currently protected by the Endangered Species Act (ESA) of 1973. In essence, the requested “incidental take permit”, or ITP, would acknowledge that these companies would not be held to the same comprehensive regulations that are designed to safeguard the environment, particularly the flora and fauna at most risk to extirpation. Rather, they would simply be asked to insure that their impacts are “minimized and mitigated to the maximum extent practicable.”
Section 10(a)(2)(B) of the ESA contains provisions for issuing an ITP to a non-Federal entity for the take of endangered and threatened species, provided the following criteria are met:

The Northern Long-eared Bat is a federally-listed threatened species, also included in the ITP
The proposed plan, which would seek to exempt both upstream development activities (oil & gas wells) and midstream development activities (pipelines). Upstream activities include the creation of access roads, staging areas, seismic operations, land clearing, explosives; the development and construction of well fields, including drilling, well pad construction, disposal wells, water impoundments, communication towers; and other operations, including gas flaring and soil disturbance; and decommissioning and reclamation activities, including more land moving and excavation.
Midstream activities include the construction of gathering, transmission, and distribution pipeline, including land grading and stream construction, construction of compressor stations, meter stations, electric substations, storage facilities, and processing plants, and installation of roads, culverts, and ditches, to name just a few.
Companies involved in the proposed “Conservation Plan” represent the major players in fossil fuel extraction, refinement, and delivery in the region, and include:

Populations of federally-endangered Indiana Bats could be impacted by the proposed Incidental Take Permit (ITP)
The five species listed in the ITP include the Indiana Bat (a federally-listed endangered species) and Northern Long-eared Bat (a federally-listed threatened species), the Eastern Small-footed Bat (a threatened species protected under Pennsylvania’s Game and Wildlife Code), as well as the Little Brown Bat and Tri-colored Bat. Populations of all five species are already under dire threats due to white-nose syndrome, a devastating disease that, since 2008, has killed an estimated 5.7 million bats in North America. In some cases, entire local populations have succumbed to this deadly disease. Because bats already have a naturally low birthrate, bat populations that do survive this epidemic will be slow to rebound. Only recently, wildlife biologists have begun to see hope for a treatment in a beneficial bacterium that may save affected bats. However, production and deployment details of this treatment are still under development. Best summarized in a recent article in the Pittsburgh Post-Gazette:
This [ITP] would be a huge deal because we are dealing with species in a precipitous decline,” said Jared Margolis, an attorney with the Center for Biological Diversity, a national nonprofit conservation organization headquartered in Tucson, Ariz. “I don’t see how it could be biologically defensible. Even without the drilling and energy development we don’t know if these species will survive.
In 2012, Bat Conservation International produced a report for Delaware Riverkeeper, entitled Impacts of Shale Gas Development on Bat Populations in the Northeastern United States. The report focuses on landscape scale impacts that range from water quality threats, to disruption of winter hibernacula, the locations where bats hibernate during the winter, en masse. In addition, because bats have strong site fidelity to roosting trees or groups of trees, forest clearing for pipelines, well pads or other facilities may disproportionately impact local populations.
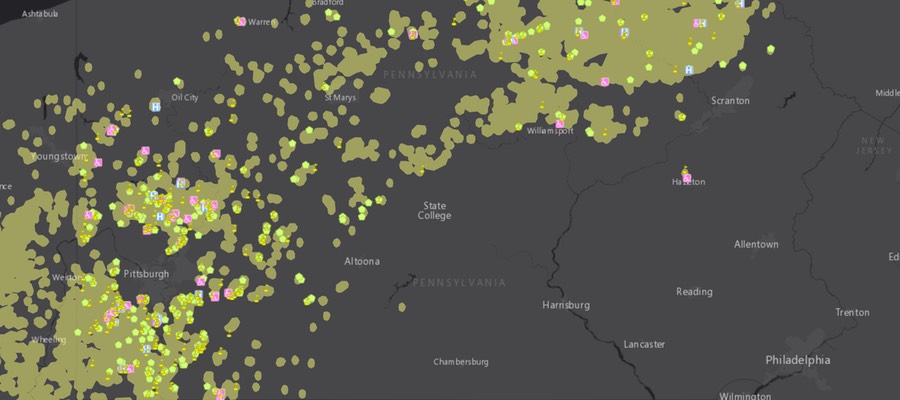
The below map, developed by FracTracker Alliance, shows the population ranges of all five bat species, as well as the current areas impacted by existing development by the oil and gas industry through well sites, pipelines, and other facilities.
View map fullscreen | How FracTracker maps work
To learn more details about the extensive oil and gas development in each of the impacted states, follow these links:
The U.S. Fish and Wildlife Service (USFWS) announced in the Federal Register in late November 2016 its intent to prepare an environmental impact statement (EIS) and hold five public scoping sessions about the permit, as well as an informational webinar. In keeping with the parameters of an environmental impact statement, USFWS is particularly interested in input and information about:
The public comment period ends on December 27, 2016. Links to more information about locations of the public hearings, as well as instructions about how to sign up for the December 20, 2016 informational webinar can be found at this website. In addition, you can electronically submit comments about the “conservation plan” by following this link.
by Kirk Jalbert, Manager of Community-Based Research & Engagement
with technical assistance from Seth Kovnant
In September, the Pennsylvania Department of Environmental Protection (DEP) rejected a number of permits for wetland crossings and sedimentation control that were required for Sunoco Pipeline’s proposed “Mariner East 2” pipeline. According to Sunoco, the proposed Mariner East 2 is a $2.5 billion, 350-mile-long pipeline that would be one of the largest pipeline construction projects in Pennsylvania’s history.
If built, Mariner East 2 could transport up to 450,000 barrels (18,900,000 gallons) per day of propane, ethane, butane, and other liquefied hydrocarbons from the shale fields of western Pennsylvania to export terminals in Marcus Hook, located just outside Philadelphia. A second proposed pipeline, if constructed, could carry an additional 250,000 barrels (10,500,000 gallons) per day of these same materials. Sunoco submitted revised permit applications to PADEP on Tuesday, December 6th.
The industry often refers to ethane, propane and butane collectively as “natural gas liquids.” They are classified by the federal government as “hazardous, highly volatile liquids,” but that terminology is also misleading. These materials, which have not been transported through densely populated southeast Pennsylvania previously, are liquid only at very high pressure or extremely cold temperatures. At the normal atmospheric conditions experienced outside the pipeline, these materials volatilize into gas which is colorless; odorless; an asphyxiation hazard; heavier than air; and extremely flammable of explosive. This gas can travel downhill and downwind for long distances while remaining combustible. It can collect (and remain for long periods of time) in low-lying areas; and things as ordinary as a cell phone, a doorbell or a light switch are capable of providing an ignition source.
Many who have followed the proposed Mariner East 2 project note that, while much has been written about the likely environmental impacts, insufficient investigation has been conducted into safety risks to those who live, work and attend schools in the proposed pipeline’s path. We address these risks in this article, and, in doing so, emphasize the importance of regulatory agencies allowing public comments on the project’s resubmitted permit applications.
Resident of Pennsylvania do not need to look far for examples of how pipeline accidents pose serious risk. For instance, the 2015 explosion of the Enterprise ATEX (Appalachia to Texas) pipeline near Follansbee, WV, provides a depiction of what a Mariner East 2 pipeline failure could look like. This 20-inch diameter pipeline carrying liquid ethane is similar in many ways to the proposed Mariner East 2. When it ruptured in rural West Virginia, close to the Pennsylvania border, it caused damage in an area that extended 2,000 feet—about ½ square mile—from the place where the pipeline failed.

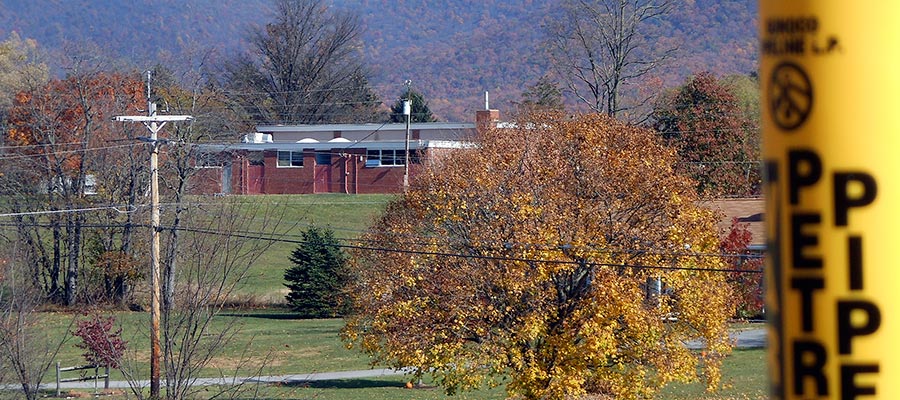
In another recent instance, the Spectra Energy Texas Eastern methane natural gas pipeline ruptured in Salem, PA, this April as a result of corroded welding. The explosion, seen above (photo by PA NPR State Impact), completely destroyed a house 200ft. away. Another house, 800ft. away, sustained major damage and its owner received 3rd degree burns. These incidents are not unique. FracTracker’s recent analysis found that there have been 4,215 pipeline incidents nation-wide since 2010, resulting in 100 reported fatalities, 470 injuries, and property damage exceeding $3.4 billion (“incident” is an industry term meaning “a pipeline failure or inadvertent release of its contents.” It does not necessarily connote “a minor event”).
It is difficult to predict the blast radius for materials like ethane, propane and butane. Methane, while highly flammable or explosive, is lighter than air and so tends to disperse upon release into the atmosphere. Highly volatile liquids like ethane, propane and butane, on the other hand, tend to concentrate close to the ground and to spread laterally downwind. A large, dispersed vapor cloud of these materials may quickly spread great distances, even under very light wind conditions. A worst-case scenario would by highly variable since gas migration and dispersion is dependent on topography, leak characteristics, and atmospheric conditions. In this scenario, unignited gas would be allowed to migrate as an unignited vapor cloud for a couple miles before finding an ignition source that causes an explosion that encompasses the entire covered area tracing back to the leak source. Ordinary devices like light switches or cell phones can serve as an ignition source for the entire vapor cloud. One subject matter expert recently testified before a Municipal Zoning Hearing board that damage could be expected at a distance of three miles from the source of a large scale release.
The federal government’s “potential impact radius” (PIR) formula, used for natural gas (methane) isn’t directly applicable because of differences in the characteristics of the material. It may however be possible to quantify an Immediate Ignition Impact Zone. This represents the explosion radius that could occur if ignition occurs BEFORE the gas is able to migrate.
The Pipeline and Hazardous Materials Safety Administration (PHMSA) provides instructions for calculating the PIR of a methane natural gas pipeline. The PIR estimates the range within which a potential failure could have significant impact on people or property. The PIR is established using the combustion energy and pipeline-specific fuel mass of methane to determine a blast radius: PIR = 0.69*sqrt(p*d^2). Where: PIR = Potential Impact Radius (in feet), p = maximum allowable operating pressure (in pounds per square inch), d = nominal pipeline diameter (in inches), and 0.69 is a constant applicable to natural gas
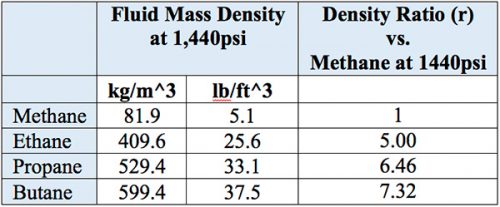
The Texas Eastern pipeline can use the PIR equation as-is since it carries methane natural gas. However, since Mariner East 2 is primarily carrying ethane, propane, and butane NGLs, the equation must be altered. Ethane, propane, butane, and methane have very similar combustion energies (about 50-55 MJ/kg). Therefore, the PIR equation can be updated for each NGL based on the mass density of the flow material as follows: PIR = 0.69*sqrt(r*p*d^2). Where: r = the density ratio of hydrocarbons with similar combustion energy to methane natural gas. At 1,440 psi, methane remains a gas with a mass density 5 times less than liquid ethane at the same pressure:
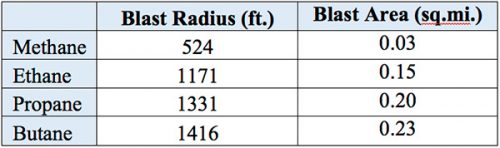
The methane density relationships for ethane, propane, and butane can be used to calculate an immediate-ignition blast radius for each hydrocarbon product. The below table shows the results assuming a Mariner East 2-sized 20-inch diameter pipe operating at Mariner East 2’s 1,440psi maximum operating pressure:
Using these assumptions, the blast radius can be derived as a function of pressure for each hydrocarbon for the same 20in. diameter pipe:
ME2 Immediate Ignition Blast Radius
Note the sharp increase in blast radius for each natural gas liquid product. The pressure at which this sharp increase occurs corresponds with the critical pressure where each product transitions to a liquid state and becomes significantly denser, and in turn, contains more explosive power. These products will always be operated above their respective critical pressures when in transport, meaning their blast radius will be relatively constant, regardless of operating pressure.
Averaging the “Immediate Ignition Blast Radius” for ethane, propane, and butane gives us a 1,300 ft (about 0.25 mile) potential impact radius. However, we must recognize that this buffer represents a best case scenario in the event of a major pipeline accident.
Additional information on these calculations can be found in the Delaware County-based Middletown Coalition for Community Safety’s written testimony to the Pennsylvania Legistlature.
FracTracker has created a new map of the Mariner East 2 pipeline using a highly-detailed GIS shapefile recently supplied by the DEP. On this map, we identify a 0.5 mile radius “buffer” from Mariner East 2’s proposed route. We then located all public and private schools, environmental justice census tracts, and estimated number of people who live within this buffer in order to get a clearer picture of the pipeline’s hidden risks.
Proposed Mariner East 2 and At-Risk Schools and Populations
View map fullscreen | How FracTracker maps work
In order to estimate the number of people who live within this 0.5 mile radius, we first identified census blocks that intersect the hazardous buffer. Second, we calculated the percentage of that census block’s area that lies within the buffer. Finally, we used the ratio to determine the percentage of the block’s population that lies within the buffer. In total, there are an estimated 105,419 people living within the proposed Mariner East 2’s 0.5 mile radius impact zone. The totals for each of the 17 counties in Mariner East 2’s trajectory can be found in the interactive map. The top five counties with the greatest number of at-risk residents are:
Environmental justice designations are defined by the DEP as any census tract where 20% or more of the population lives in poverty and/or 30% or more of the population identifies as a minority. These numbers are based on data from the U.S. Census Bureau, last updated in 2010, and by the federal poverty guidelines. Mariner East 2 crosses through four environmental justice areas:

DEP policies promise enhanced public participation opportunities in environmental justice communities during permitting processes for large development projects. No additional public participation opportunities were provided to these communities. Furthermore, no public hearings were held whatsoever in Cambria County and Delaware County. The hearing held in Westmoreland County took place in Youngwood, nine miles away from Jeanette. Pipelines are not specified on the “trigger list” that determines what permits receive additional scrutiny, however the policy does allow for “opt-in permits” if the DEP believes they warrant special consideration. One would assume that a proposed pipeline project with the potential to affect the safety of tens of thousands of Pennsylvanians qualifies for additional attention.
One of the most concerning aspects of our findings is the astounding number of schools in the path of Mariner East 2. Based on data obtained from the U.S. Department of Education on the locations of schools in Pennsylvania, a shocking 23 public (common core) schools and 17 private schools were found within Mariner East 2’s 0.5 mile impact zone. In one instance, a school was discovered to be only 7 feet away from the pipeline’s intended path. Students and staff at these schools have virtually no chance to exercise their only possible response to a large scale release of highly volatile liquids, which is immediate on-foot evacuation.
Middletown High School in Dauphin County in close proximity to ME2
One reason for the high number of at-risk schools is that Mariner East 2 is proposed to roughly follow the same right of way as an older pipeline built in the 1930s (now marketed by Sunoco as “Mariner East 1.”). A great deal of development has occurred since that time, including many new neighborhoods, businesses and public buildings. It is worth noting that the U.S. Department of Education’s data represents the center point of schools. In many cases, we found playgrounds and other school facilities were much closer to Mariner East 2, as can be seen in the above photograph. Also of note is the high percentage of students who qualify for free or reduced lunch programs at these schools, suggesting that many are located in disproportionately poorer communities.
Now that PADEP has received revised permit applications from Sunoco, presumably addressing September’s long list of technical deficiencies, the agency will soon make a decision as to whether or not additional public participation is required before approving the project. Given the findings in our analysis, it should be clear that the public must have an extended opportunity to review and comment on the proposed Mariner East 2. In fact, public participation was extremely helpful to DEP in the initial review process, providing technical and contextual information.
It is, furthermore, imperative that investigations into the potential impacts of Mariner East 2 extend to assess the safety of nearby residents and students, particularly in marginalized communities. Thus far, no indication has been made by the DEP that this will be the case. However, the Pennsylvania Sierra Club has established a petition for residents to voice their desire for a public comment period and additional hearings.
Seth Kovnat is the chief structural engineer for an aerospace engineering firm in Southeastern PA, and regularly consults with regard to the proposed Mariner East 2 pipeline. In November, Seth’s expertise in structural engineering and his extensive knowledge of piping and hazardous materials under pressure were instrumental in providing testimony at a Pennsylvania Senate and House Veterans Affairs and Emergency Preparedness Committee discussion during the Pennsylvania Pipeline Infrastructure Citizens Panel. Seth serves on the board of Middletown Coalition for Community Safety and is a member of the Mariner East 2 Safety Advisory Committee for Middletown Township, PA. He is committed to demonstrating diligence in gathering, truth sourcing, and evaluating technical information in pipeline safety matters in order to provide data driven information-sharing on a community level.
NOTE: This article was modified on 12/9/16 at 4pm to provide additional clarification on how the 1,300ft PIR was calculated, and the map was modified on 11/4/2021 to add the 1,300 ft Thermal Impact Zone Buffer, which was previously mislabeled as the half-mile Buffer
Cover of Dangerous and Close report. Click to view report
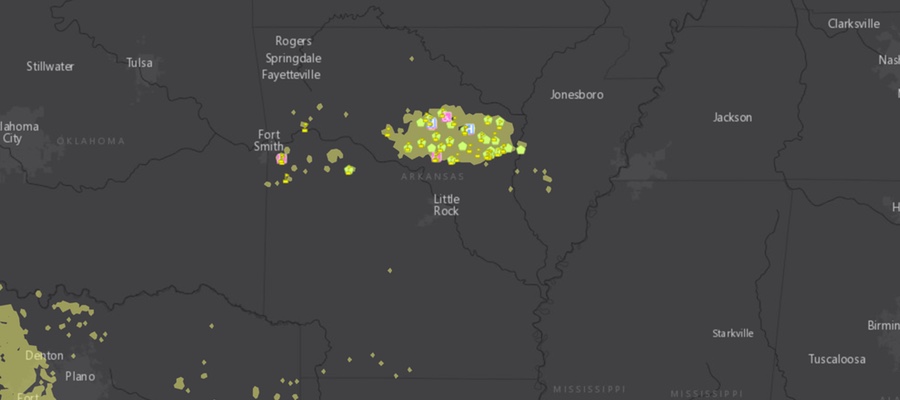
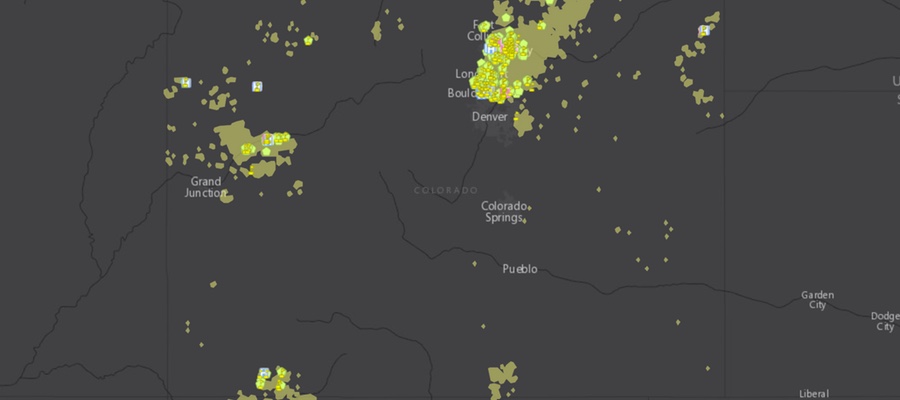
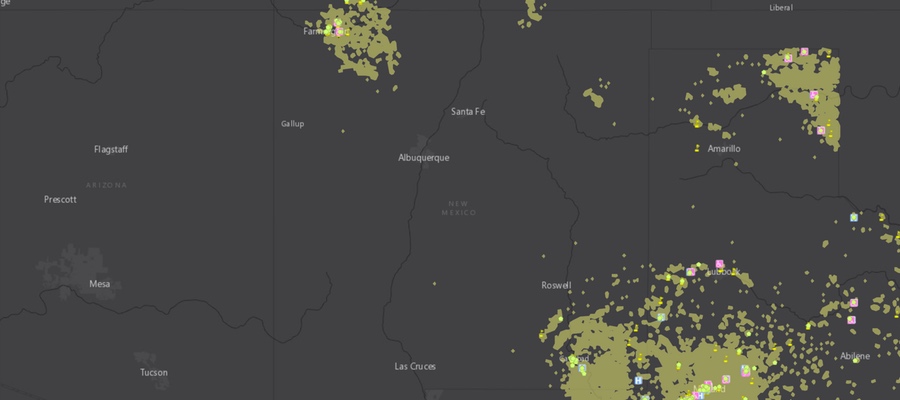
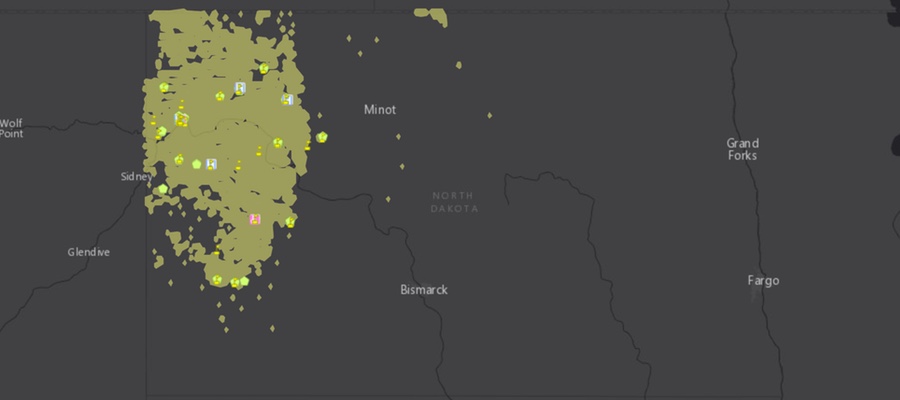
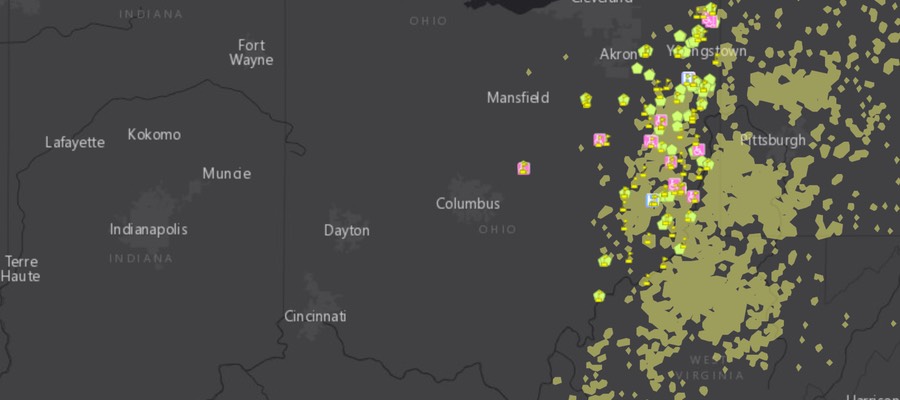
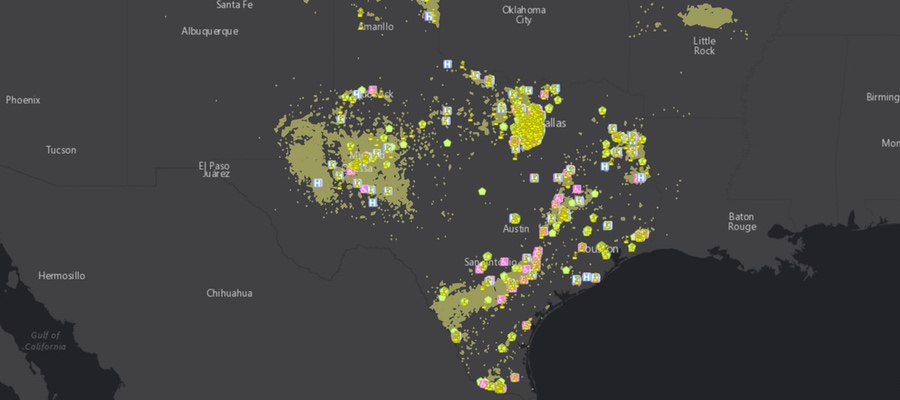
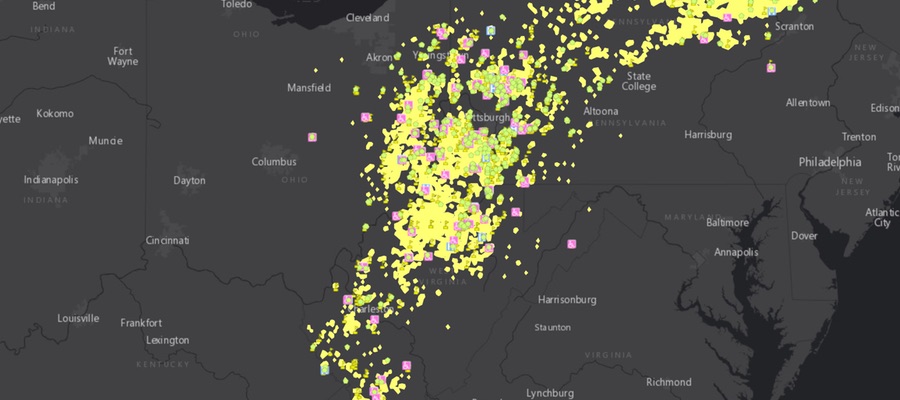
FracTracker Alliance has been working with the Frontier Group and Environment America on a nationwide assessment of “fracked” oil and gas wells. The report is titled Dangerous and Close, Fracking Puts the Nation’s Most Vulnerable People at Risk. The assessment analyzed the locations of fracked wells and identified where the fracking has occurred near locations where sensitive populations are commonly located. These sensitive sites include schools and daycare facilities because they house children, hospitals because the sick are not able to fight off pollution as effectively, and nursing homes where the elderly need and deserve clean environments so that they can be healthy, as well. The analysis used data on fracked wells from regulatory agencies and FracFocus in nine states. Maps of these nine states, as well as a full national map are shown below.
No one deserves to suffer the environmental degradation that can accompany oil and gas development – particularly “fracking” – in their neighborhoods. Fracked oil and gas wells are shown to have contaminated drinking water, degrade air quality, and sicken both aquatic and terrestrial ecosystems. Additionally, everybody responds differently to environmental pollutants, and some people are much more sensitive than others. In fact, certain sects of the population are known to be more sensitive in general, and exposure to pollution is much more dangerous for them. These communities and populations need to be protected from the burdens of industries, such as fracking for oil and gas, that have a negative effect on their environment. Commonly identified sensitive groups or “receptors” include children, the immuno-compromised and ill, and the elderly. These groups are the focus of this new research.
National interactive map of sensitive receptors near fracked wells
View Map Fullscreen | How Our Maps Work
Click to view interactive maps associated with each state
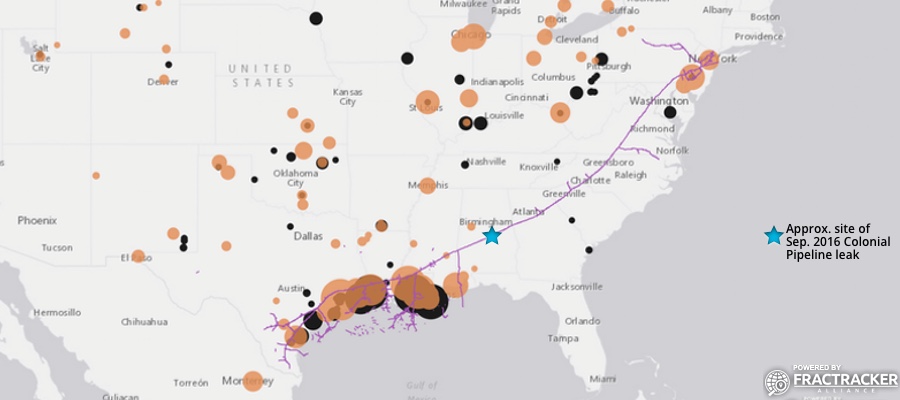
On September 9, 2016 a pipeline leak was detected from the Colonial Pipeline by a mine inspector in Shelby County, Alabama. It is estimated to have spilled ~336,000 gallons of gasoline, resulting in the shutdown of a major part of America’s gasoline distribution system. As such, we thought it timely to provide some data and a map on the Colonial Pipeline Project.
Figure 1. Dynamic map of Colonial Pipeline route and related infrastructure
View Map Fullscreen | How Our Maps Work | The Sept. 2016 leak occurred in Shelby County, Alabama
The Colonial Pipeline was built in 1963, with some segments dating back to at least 1954. Colonial carries gasoline and other refined petroleum projects throughout the South and Eastern U.S. – originating at Houston, Texas and terminating at the Port of New York and New Jersey. This ~5,000-mile pipeline travels through 12 states and the Gulf of Mexico at one point. According to available data, prior to the September 2016 incident for which the cause is still not known, roughly 113,382 gallons had been released from the Colonial Pipeline in 125 separate incidents since 2010 (Table 1).
Table 1. Reported Colonial Pipeline incident impacts by state, between 3/24/10 and 7/25/16
| State | Incidents (#) | Barrels* Released | Total Cost ($) |
| AL | 10 | 91.49 | 2,718,683 |
| GA | 11 | 132.38 | 1,283,406 |
| LA | 23 | 86.05 | 1,002,379 |
| MD | 6 | 4.43 | 27,862 |
| MS | 6 | 27.36 | 299,738 |
| NC | 15 | 382.76 | 3,453,298 |
| NJ | 7 | 7.81 | 255,124 |
| NY | 2 | 27.71 | 88,426 |
| PA | 1 | 0.88 | 28,075 |
| SC | 9 | 1639.26 | 4,779,536 |
| TN | 2 | 90.2 | 1,326,300 |
| TX | 19 | 74.34 | 1,398,513 |
| VA | 14 | 134.89 | 15,153,471 |
| Total** | 125 | 2699.56 | 31,814,811 |
| *1 Barrel = 42 U.S. Gallons
** The total amount of petroleum products spilled from the Colonial Pipeline in this time frame equates to roughly 113,382 gallons. This figure does not include the September 2016 spill of ~336,000 gallons. Data source: PHMSA |
|||
Unfortunately, the Colonial Pipeline has also been the source of South Carolina’s largest pipeline spill. The incident occurred in 1996 near Fork Shoals, South Carolina and spilled nearly 1 million gallons of fuel into the Reedy River. The September 2016 spill has not reached any major waterways or protected ecological areas, to-date.
Owners of the pipeline include Koch Industries, South Korea’s National Pension Service and Kohlberg Kravis Roberts, Caisse de dépôt et placement du Québec, Royal Dutch Shell, and Industry Funds Management.
For more details about the Colonial Pipeline, see Table 2.
Table 2. Specifications of the Colonial and/or Intercontinental pipeline
| Pipeline Segments | 1,1118 | |||||
| Mileage (mi.) | ||||||
| Avg. Length | 4.3 | |||||
| Max. Length | 206 | |||||
| Total Length | 4,774 | |||||
| Segment Flow Direction (# Segments) | ||||||
| Null | 657 | |||||
| East | 33 | |||||
| North | 59 | |||||
| Northeast | 202 | |||||
| Northwest | 68 | |||||
| South | 20 | |||||
| Southeast | 30 | |||||
| Southwest | 14 | |||||
| West | 35 | |||||
| Segment Bi-Directional (# Segments) | ||||||
| Null | 643 | |||||
| No | 429 | |||||
| Yes | 46 | |||||
| Segment Location | ||||||
| State | Number | Total Mileage | Avg. Mileage | Long | Avg. PSI | Avg. Diameter (in.) |
| Alabama | 11 | 782 | 71 | 206 | 794 | 35 |
| Georgia | 8 | 266 | 33 | 75 | 772 | 27 |
| Gulf of Mexico | 437 | 522 | 1.2 | 77 | 50 | 1.4 |
| Louisiana | 189 | 737 | 3.9 | 27 | 413 | 11 |
| Maryland | 11 | 68 | 6.2 | 9 | 781 | 30 |
| Mississippi | 63 | 56 | 0.9 | 15 | 784 | 29 |
| North Carolina | 13 | 146 | 11.2 | 23 | 812 | 27 |
| New Jersey | 65 | 314 | 4.8 | 28 | 785 | 28 |
| New York | 2 | 6.4 | 3.2 | 6.4 | 800 | 26 |
| Pennsylvania | 72 | 415 | 5.8 | 17 | 925 | 22 |
| South Carolina | 6 | 119 | 19.9 | 55 | 783 | 28 |
| Texas | 209 | 1,004 | 4.8 | 33 | 429 | 10 |
| Virginia | 32 | 340 | 10.6 | 22 | 795 | 27 |
| PSI = Pounds per square inch (pressure)
Data source: US EIA |
||||||
By Sam Rubright, Ted Auch, and Matt Kelso – FracTracker Alliance
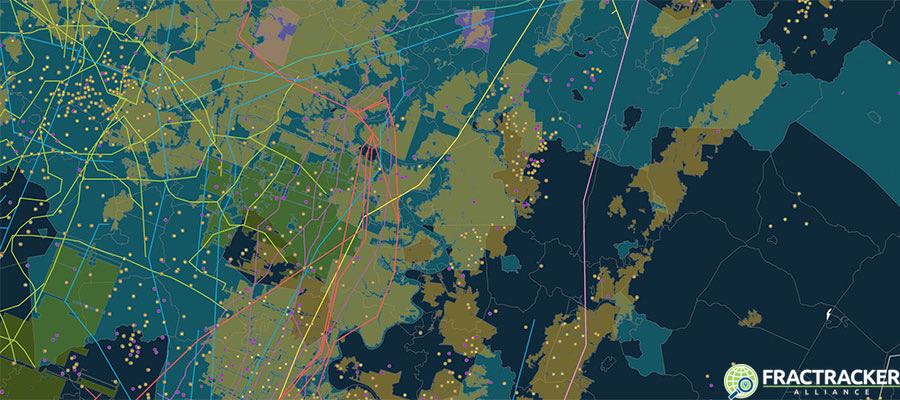
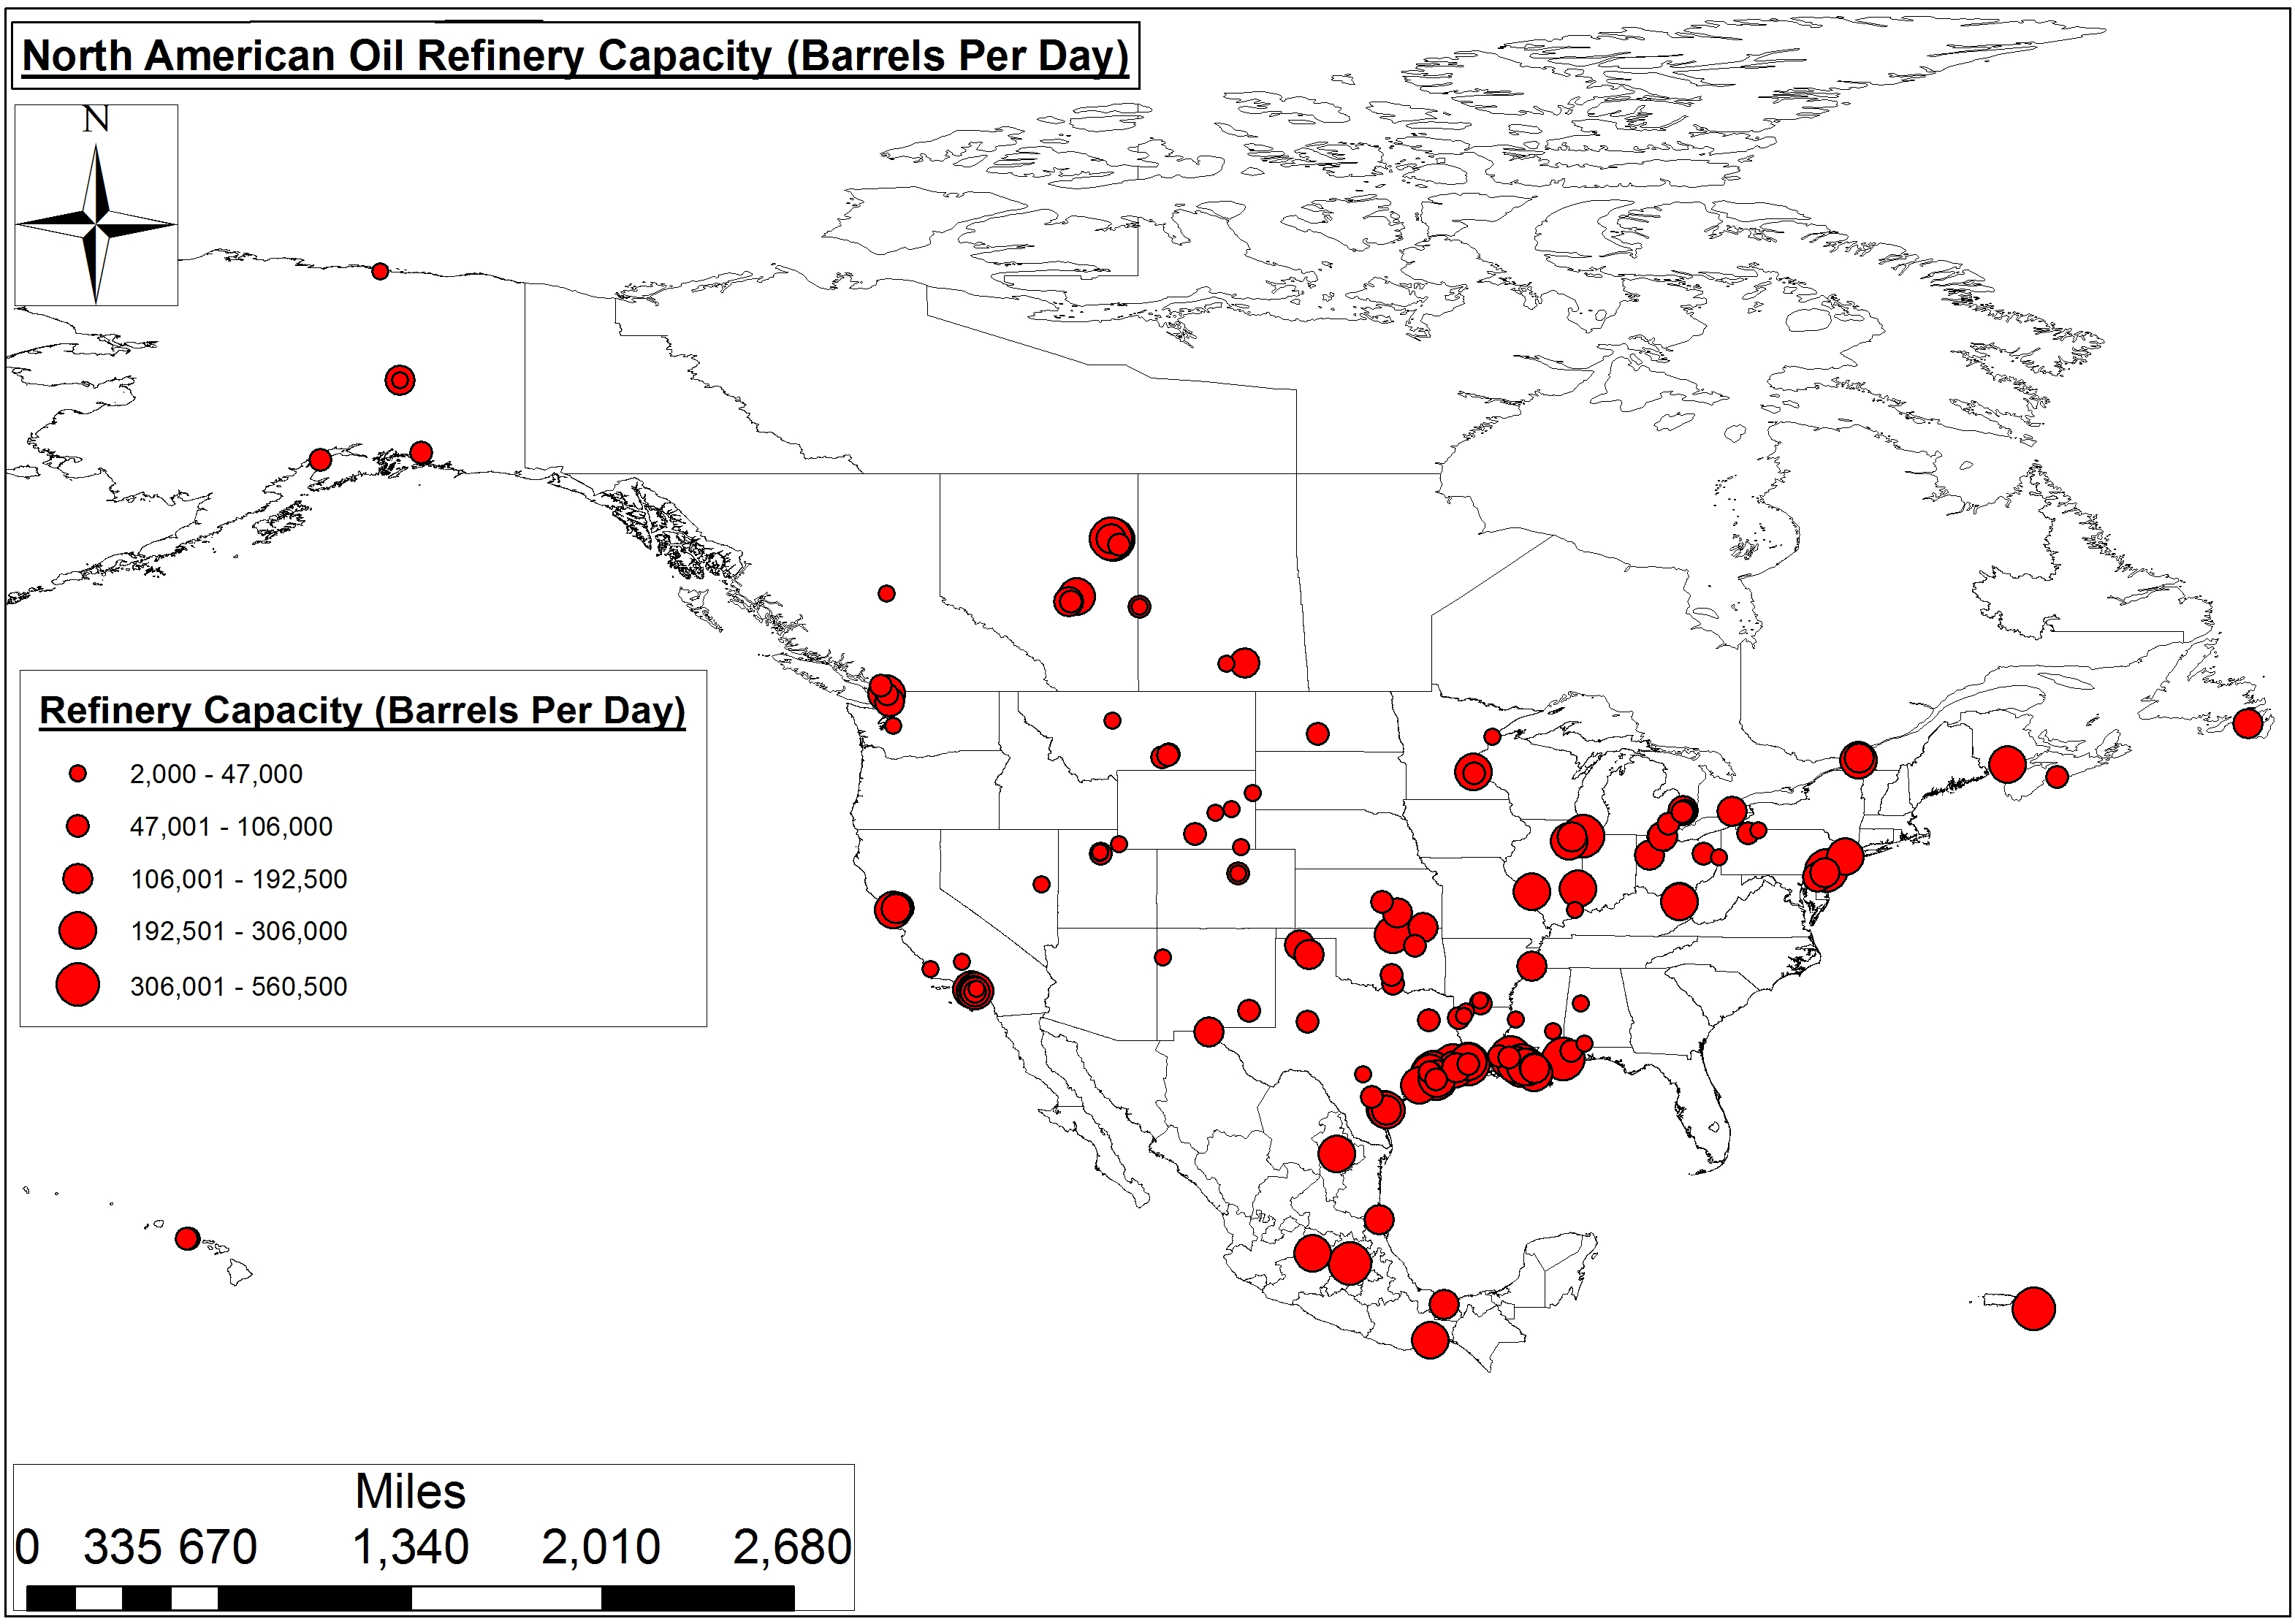
Figure 1. North American Oil Refinery Capacity
Typically, we analyze the potential economic impacts of oil refineries by simply quantifying potential and/or actual capacity on an annual or daily basis. Using this method, we find that the 126 refineries operating in the U.S. produce an average of 100,000-133,645 barrels per day (BPD) of oil – or 258 billion gallons per year.
In all of North America, there are 158 refineries. When you include the 21 and 27 billion gallons per year produced by our neighbors to the south and north, respectively, North American refineries account for 23-24% of the global refining capacity. That is, of course, if you believe the $113 dollar International Energy Agency’s 2016 “Medium-Term Oil Market Report” 4.03 billion gallon annual estimates (Table 1 and Figure 1).
Table 1. Oil Refinery Capacity in the United States and Canada (Barrels Per Day (BPD))
| United States | Canada | Mexico | Total | |
| Refinery Count | 126 | 17 | 6 | 158 |
| Average Capacity | 133,645 BPD | 104,471 BPD | 228,417 BPD | 139,619 BPD |
| Low | Foreland & Silver Eagle Refining in NV & WY, 2-3K BPD | Prince George & Moose Jaw Refining in BC and SK, 12-15K BPD | Pemex’s Ciudad Madero Refinery, 152K BPD | — |
| High | Exxon Mobil in TX & LA, 502-560K BPD | Valero and Irving Oil Refining in QC & NS, 265-300K BPD | Pemex’s Tula Refinery, 340K BPD | — |
| Median | 100,000 BPD | 85,000 BPD | 226,500 | 109,000 |
| Total Capacity | 16.8 MBPD | 1.8 MBPD | 1.4 MBPD | 22.1 MBPD |
However, we would propose that an alternative measure of a given oil refinery’s impact would be neighborhood prosperity in the census tract(s) where the refinery is located. We believe this figure serves as a proxy for economic justice. As such, we recently used the above refinery location and capacity data in combination with US Census Bureau Cartographic Boundaries (i.e., Census Tracts) and the Census’ American FactFinder clearinghouse to estimate neighborhood prosperity near refineries.
Our analysis involved merging oil refineries to their respective census tracts in ArcMAP 10.2, along with all census tracts that touch the actual census tract where the refineries are located, and calling that collection the oil refinery’s sphere of influence, for lack of a better term. We then assigned Mean Income in the Past 12 Months (In 2014 Inflation-Adjusted Dollars) values for each census tract to the aforementioned refinery tracts – as well as surrounding regional, city, and state tracts – to allow for a comparison of income disparities. We chose to analyze mean income instead of other variables such as educational attainment, unemployment, or poverty percentages because it largely encapsulates these economic indicators.
As the authors of the UN’s International Forum of Social Development paper Social Justice in an Open World wrote:
In today’s world, the enormous gap in the distribution of wealth, income and public benefits is growing ever wider, reflecting a general trend that is morally unfair, politically unwise and economically unsound… excessive income inequality restricts social mobility and leads to social segmentation and eventually social breakdown…In the modern context, those concerned with social justice see the general increase in income inequality as unjust, deplorable and alarming. It is argued that poverty reduction and overall improvements in the standard of living are attainable goals that would bring the world closer to social justice.
Environmental regulatory agencies like to separate air pollution sources into point and non-point sources. Point sources are “single, identifiable” sources, whereas non-point are more ‘diffuse’ resulting in impacts spread out over a larger geographical area. We would equate oil refineries to point sources of socioeconomic and/or environmental injustice. The non-point analysis would be far more difficult to model given the difficulties associated with converting perceived quality of life disturbance(s) associated with infrastructure like compressor stations from the anecdotal to the empirical.
Primarily, residents living in the shadow of 80% of our refineries earn nearly $16,000 less than those in the surrounding region – or, in the case of urban refineries, the surrounding Metropolitan Statistical Areas (MSAs). Only residents living in census tracts within the shadow of 25 of our 126 oil refineries earn around $10,000 more annually than those in the region.
On average, residents of census tracts that contain oil refineries earn 13-16% less than those in the greater region and/or MSAs (Figure 2). Similarly, in comparing oil refinery census tract incomes to state averages we see a slightly larger 17-21% disparity (Figure 3).
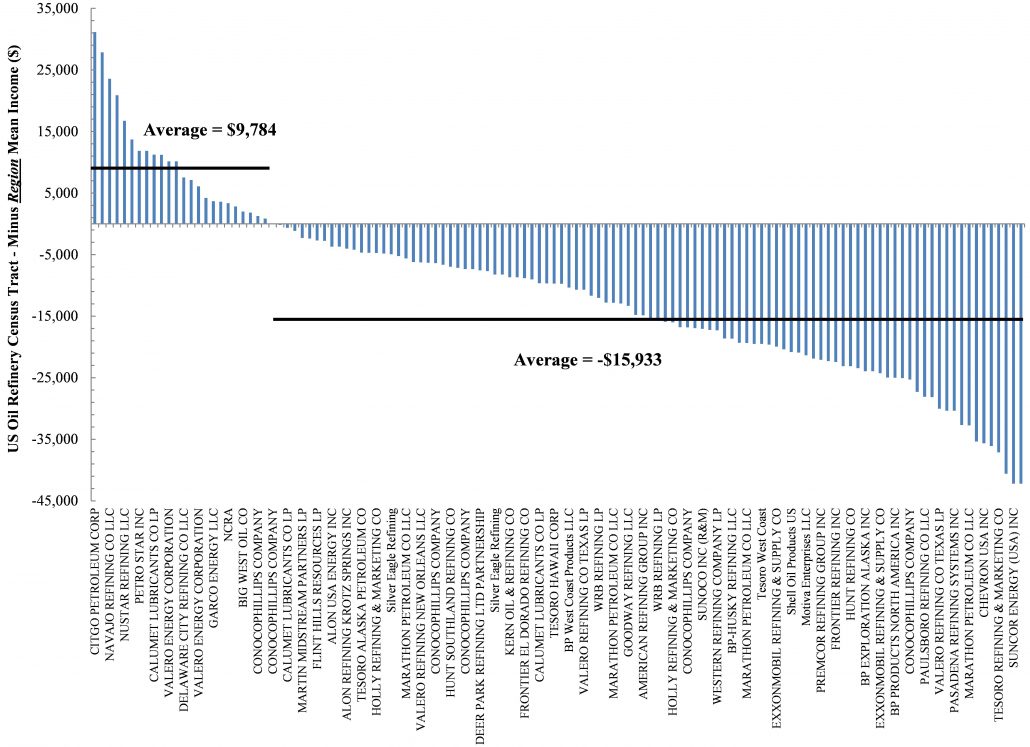
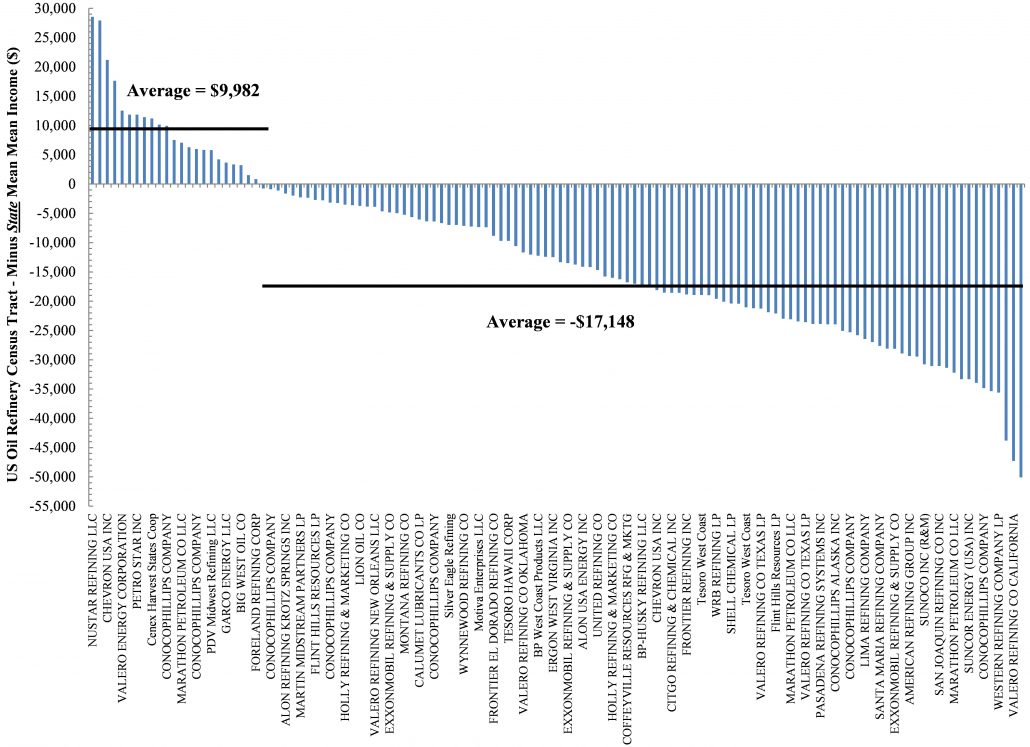
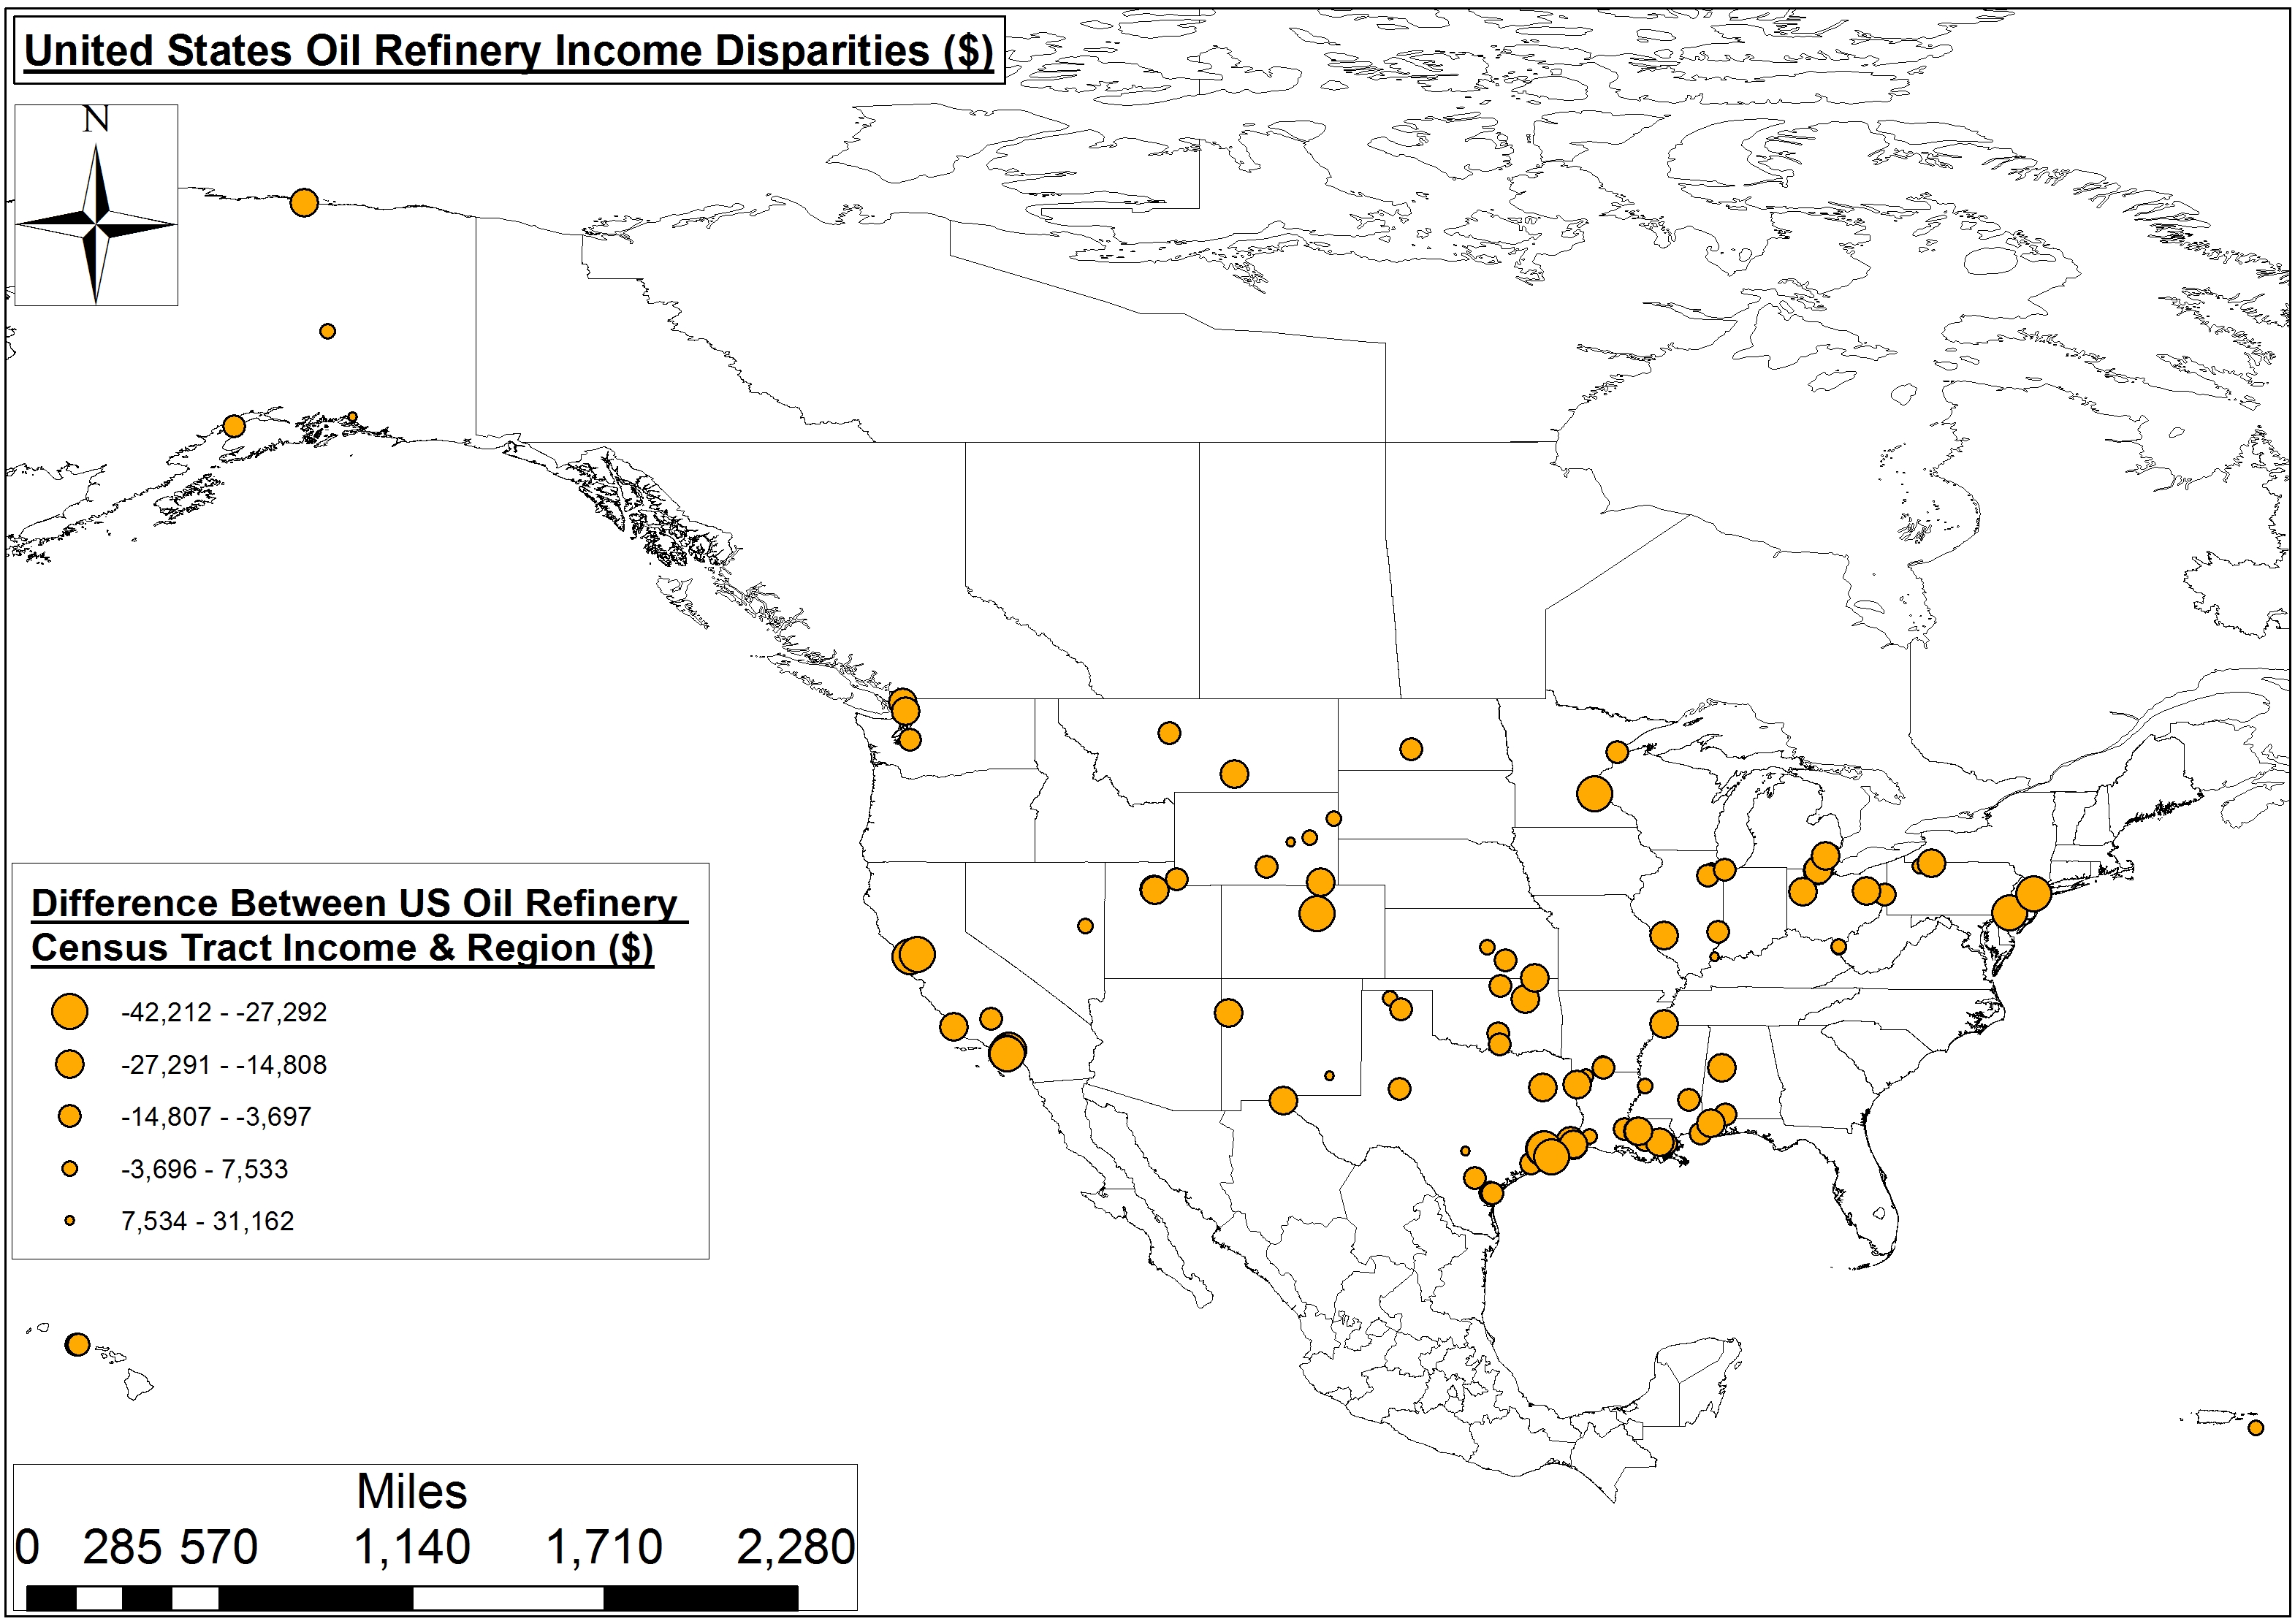
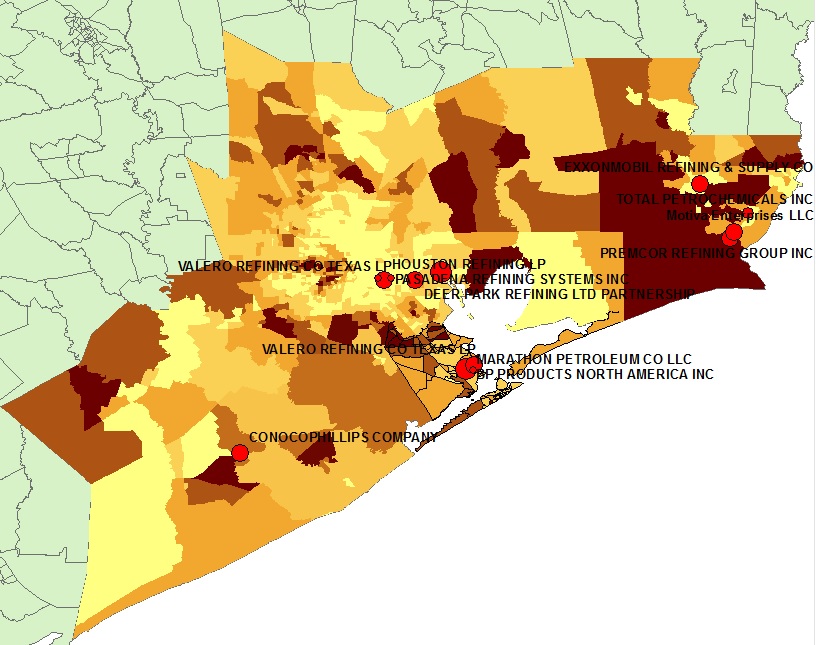
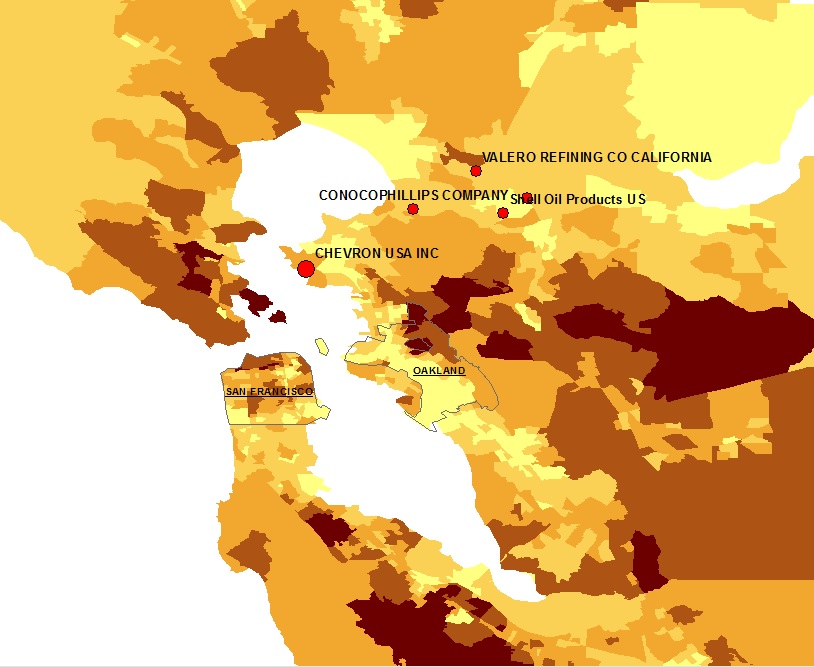
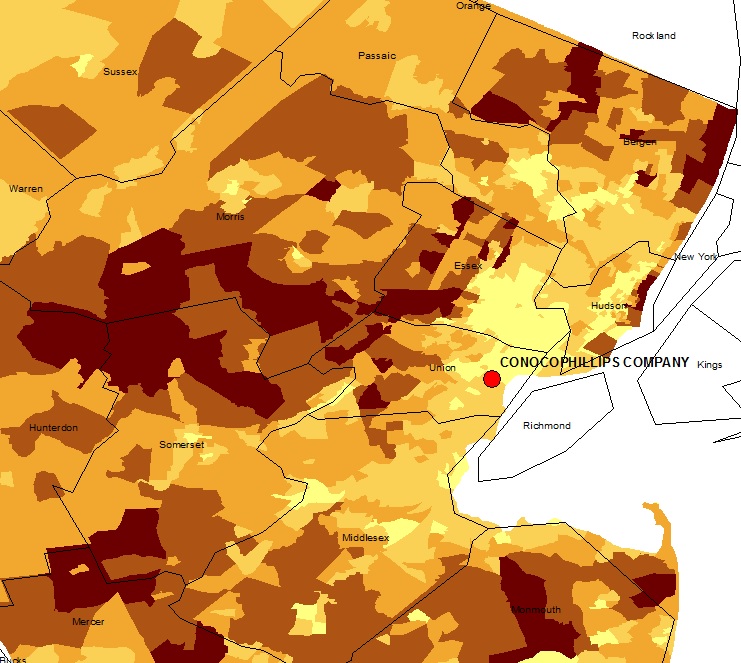
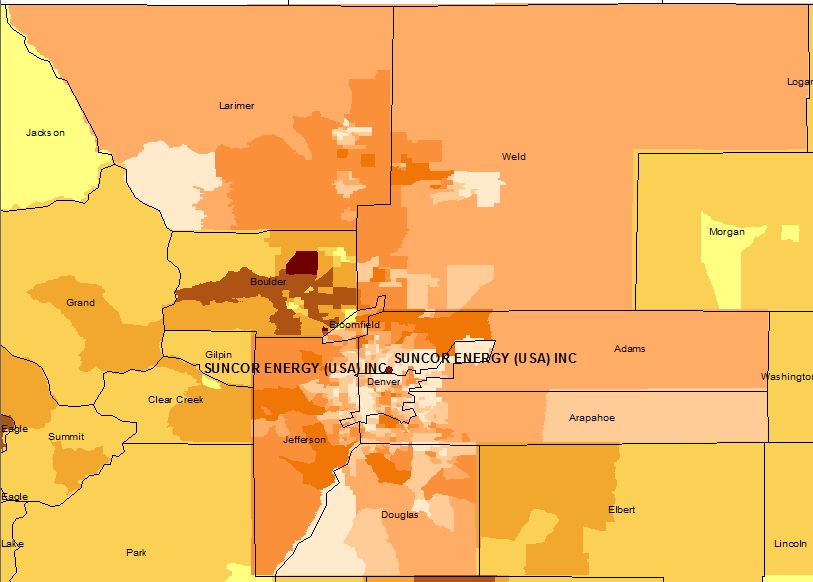
Figure 4. United States Oil Refinery Income Disparities (Note: Larger points indicate oil refinery census tracts that earn less than the surrounding region or city.)
Oil refinery income disparities seem to occur not just in one region, but across the U.S. (Figure 4).
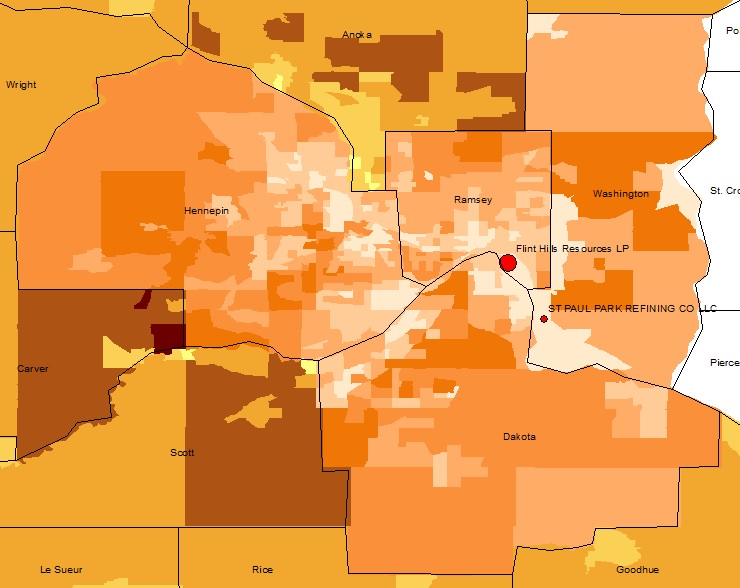
The biggest regional/MSA disparities occur in northeastern Denver neighborhoods around the Suncor Refinery complex (103,000 BPD), where the refinery’s census tracts earn roughly $42,000 less than Greater Denver residents1. California, too, has some issues near its Los Angeles’ Valero and Tesoro Refineries and Chevron’s Bay Area Refinery, with a combined daily capacity of nearly 600 BPD. There, two California census associations in the shadow of those refineries earn roughly $38,000 less than Contra Costa and Los Angeles Counties, respectively. In the Lone Star state Marathon’s Texas City, Galveston County refinery resides among census tracts where annual incomes nearly $33,000 less than the Galveston-Houston metroplex. Linden, NJ and St. Paul, MN, residents near Conoco Phillips and Flint Hills Resources refineries aren’t fairing much better, with annual incomes that are roughly $35,000 and nearly $33,000 less than the surrounding regions, respectively.
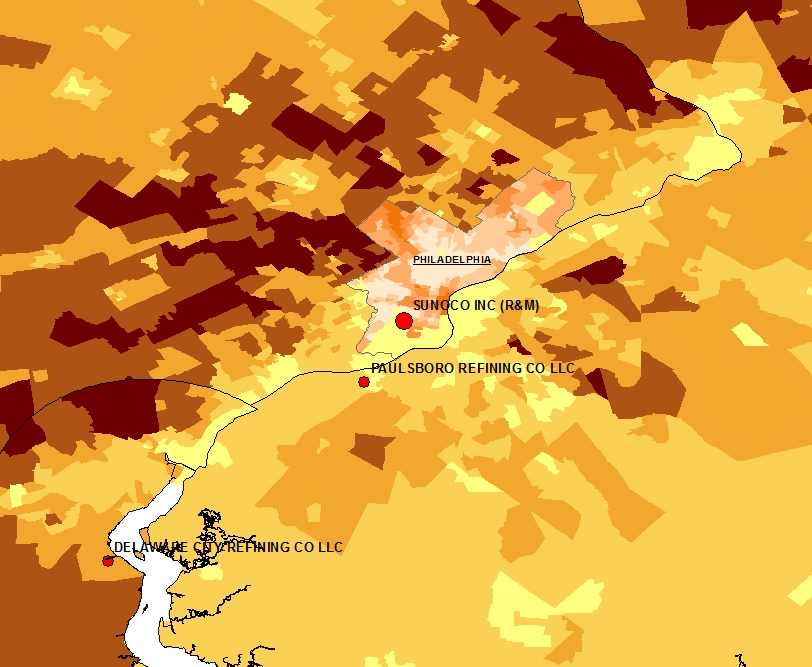
Click on the images below to explore each of the top disparate areas near oil refineries in the U.S. in more detail. Lighter shades indicate census tracks with a lower mean annual income ($).
Clearly, certain communities throughout the United States have been essentially sacrificed in the name of Energy Independence and overly-course measures of economic productivity such as Gross Domestic Product (GDP). The presence and/or construction of mid- and downstream oil and gas infrastructure appears to accelerate an already insidious positive feedback loop in low-income neighborhoods throughout the United States. Only a few places like Southeast Chicago and Detroit, however, have even begun to discuss where these disadvantaged communities should live, let alone how to remediate the environmental costs.
There exists a robust history of journalists and academics focusing on Internally Displaced People (IDP) throughout war-torn regions of Africa, the Middle East, and Southeast Asia – to name a few – and most of these 38 million people have “become displaced within their own country as a result of violence.” However, there is a growing body of literature and media coverage associated with current and potential IDP resulting from rising sea levels, drought, chronic wildfire, etc.
The issues associated with oil and gas infrastructure expansion and IDPs are only going to grow in the coming years as the Shale Revolution results in a greater need for pipelines, compressor stations, cracker facilities, etc. We would propose there is the potential for IDP resulting from the rapid, ubiquitous, and intense expansion of the Hydrocarbon Industrial Complex here in the United States.
View map fullscreen | How FracTracker maps work | Download map data
By Ted Auch, PhD – Great Lakes Program Coordinator, FracTracker Alliance
Mariner East 2 (ME 2) is a $2.5 billion, 350 mile-long pipeline that, if built, would be one of the largest pipeline construction projects in Pennsylvania’s history—carving a fifty-foot wide path through 17 counties. A project of Sunoco Logistics, ME 2 would have the capacity to transport 275,000 barrels a day of propane, ethane, butane, and other hydrocarbons from the shale fields of Western Pennsylvania and neighboring states to an international export terminal in Marcus Hook, located on the Delaware River.
ME 2 has sparked a range of responses from residents in Pennsylvania, however, including concerns about recent pipeline accidents, the ethics of taking land by eminent domain, and the unknown risks to sensitive ecosystems. Below we explore the watersheds that could be impacted by this proposed pipeline.
While some components of Sunoco’s ME 2 proposal are approved, the project requires more permits from the Pennsylvania Department of Environmental Protection (DEP) before construction can begin. Among those are permits to build through and under stream and wetlands. Many of the waters threatened by ME 2 are designated by the Commonwealth as “exceptional value” (EV) or “high quality” (HQ) and are supposed to be given greater protections from harm. Water Obstruction and Encroachment Permits, also known as “Chapter 105” permits, are required for any building activities that would disrupt any body of water, including wetlands and streams. Sunoco applied for these so-called “Chapter 105” permits in the summer of 2015, but its applications were rejected as incomplete several times.
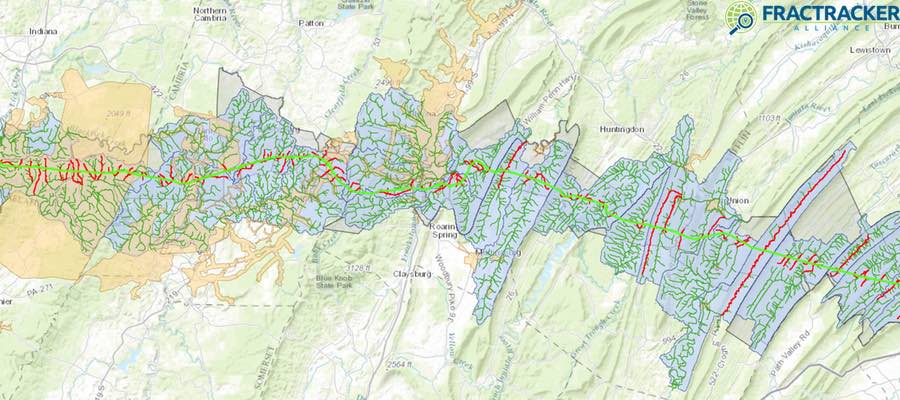
The below map shows the ME 2 route as of May 2016 relative to the watersheds and streams it will cross. Zoom into the map to see additional layers. Note that this is the most accurate representations of ME 2’s route we have seen to date. MWA provided the shapefiles for ME 2’s route to FracTracker Alliance and continues its investigations into potential watershed impacts.
Proposed ME 2 Route
View map full screen | How FracTracker maps work
In total, ME 2’s path will include 1,227 stream crossings, 570 wetland crossings, and 11 pond crossings. Of the 1,227 stream crossings, 19 are EV and 318 are HQ, meaning that 337 crossings will disturb what DEP refers to as “special protection” waters. In addition, there are 129 exceptional value wetlands being crossed. These numbers were compiled by Mountain Watershed Association (MWA) from Sunoco’s permitting applications. MWA also identified 2 HQ streams in Washington County, and 3 HQ streams in Blair County, that are proposed to be crossed that are not acknowledged as being HQ in Sunoco’s permits.
People living along the proposed route are sometimes in the best position to see what the route looks like from the ground, where wetlands and streams are, and what kinds of wetlands and streams they are. The DEP is accepting public comments on Sunoco’s ME 2 Ch. 105 permit application through Wednesday, August 24. Each DEP regional office receives separate Ch. 105 applications depending on where the pipeline routes through different counties. Those wishing to comment on the project can do so through the DEP regional office websites: DEP Southwest Region, DEP South-central Region, DEP Southeast Region. For guidance on how to write comments on permits, see MWA’s Pipeline Project Information & Talking Points.
We wish to thank Mountain Watershed Association and the Clean Air Council for helping us compile data and analysis for this article.
Written by Kirk Jalbert, PhD, MFA – Manager of Community-Based Research & Engagement, FracTracker Alliance
By Wendy Fan, 2016 Intern, FracTracker Alliance
From 2011-2013, the PA Department of Environmental Protection (DEP) required air emission data to be conducted and reported by oil and gas drillers in Pennsylvania. We have tried to look at this data in aggregate to give you a sense of the types and quantities of different pollutants. Corresponding to their degree of oil and gas drilling activity, Washington, Susquehanna, Bradford, Greene, and Lycoming counties are the highest emitters of overall pollutants between the specified years. Despite the department’s attempt to increase transparency, the data submitted by the operators severely underestimates the actual amount of pollutants released, especially with regard to methane emissions. Furthermore, gaps such as inconsistent monitoring systems, missing data, and a lack of a verification process of the self-reported data weaken the integrity and reliability of the submitted data. This article explores the data submitted and its implications in further detail.
The U.S. Energy Information Administration (EIA) estimates that U.S. natural gas production will increase from 23 trillion cubic feet in 2011 to over 33 trillion cubic feet in 2040. Pennsylvania, in particular, is one of the states with the highest amount of drilling activity at present. This statistic can be attributed to resource-rich geologic formations such as the Marcellus Shale, which extends throughout much of Appalachia. While New York has banned drilling using high-volume hydraulic fracturing (fracking), Pennsylvania continues to expand its operations with 9,775 active unconventional wells as of June 10, 2016.
Between 2000-2016, drillers in Pennsylvania incurred 5,773 violations and $47.2 million in fines. The PA DEP, which oversees drilling permits and citations, has undergone criticism for their lack of action with complaints related to oil and gas drilling, as well as poor communication to the public*. In order to increase transparency and to monitor air emissions from wells, the DEP now requires unconventional natural gas operators to submit air emission data each year. The data submitted by operators are intended to be publicly accessible and downloadable by county, emission, or well operator.
* Interestingly, PA scored the highest when we rated states on a variety of data transparency metrics in a study published in 2015.
PA’s continual growth in oil and gas drilling activity is concerning for the environment and public health. Pollutants such as methane, carbon dioxide (CO2), and nitrous oxides (NOx) are all major contributors to climate change, and these are among the more common emissions found near oil and gas activities. Long-term exposure to benzene, also commonly associated with drilling sites, can result in harmful effects on the bone marrow and the decrease in red blood cells. Vomiting, convulsions, dizziness, and even death can occur within minutes to several hours with high levels of benzene.
With such risks, it is crucial for residents to understand how many wells are within their vicinity, and the levels of these pollutants emitted.
Although the DEP collects emission data on other important pollutants such as sulfur oxides (SOx), particulate matter (PM10 and PM2.5), and toluene, this article focuses only on a few select pollutants that have shown the highest emission levels from natural gas activity. The following graphs illustrate emissions of methane, carbon dioxide (CO2), carbon monoxide (CO), nitrogen oxides (NOx), benzene, and volatile organic compounds (VOCs) for the top 10 counties with the highest amounts of natural gas activity. PA wells drilled data (often called SPUD data) will also be referenced throughout the article. Data source: PA SPUD Data.
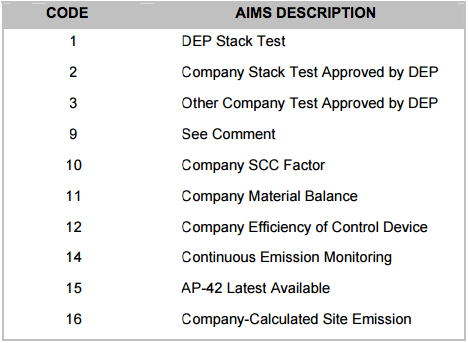
PA DEP’s Calculation Methods Codes for Emissions
Well operators self-report an estimate of total emissions in tons per year through either an online or paper reporting system. They must also indicate the method they used to generate this estimate with the Calculation Methods Codes for Emissions (table shown right).
For more information on how the data is prepared and what are the reporting requirements, refer to PA DEP’s Instruction for Completing the Annual Emissions Statement Reporting Forms.
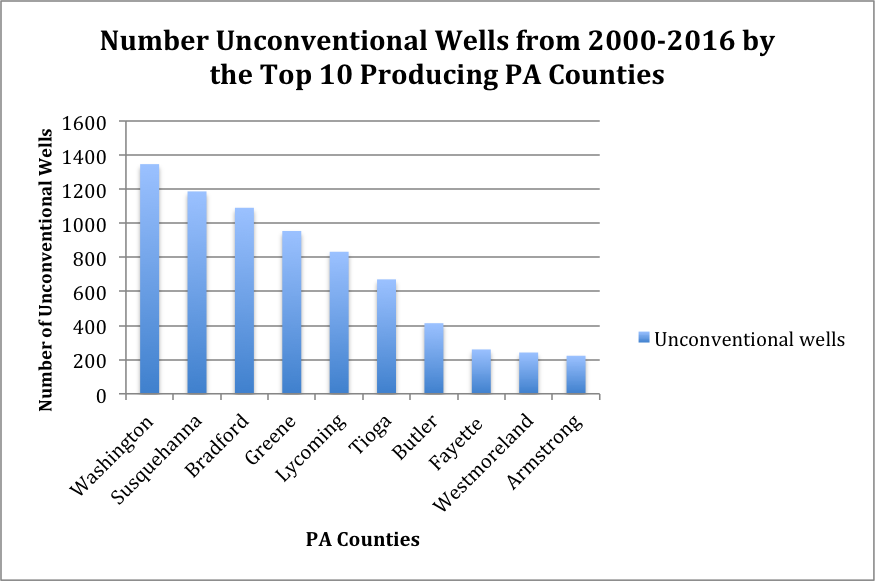
Figure 1
Overall, Washington, Susquehanna, Bradford, Greene, and Lycoming counties were the main emitters of all selected pollutants (methane, CO2, CO, NOx, VOCs, and benzene) throughout Pennsylvania based on tons per year (Fig 1). This trend may be correlated to the amount of natural gas activity that exists within each state as shown in the graph above. The top three Pennsylvania counties with the highest amount of oil and gas activity since 2000 are Washington, Susquehanna, and Bradford with 1,347; 1,187; and 1,091 unconventional active wells, respectively.
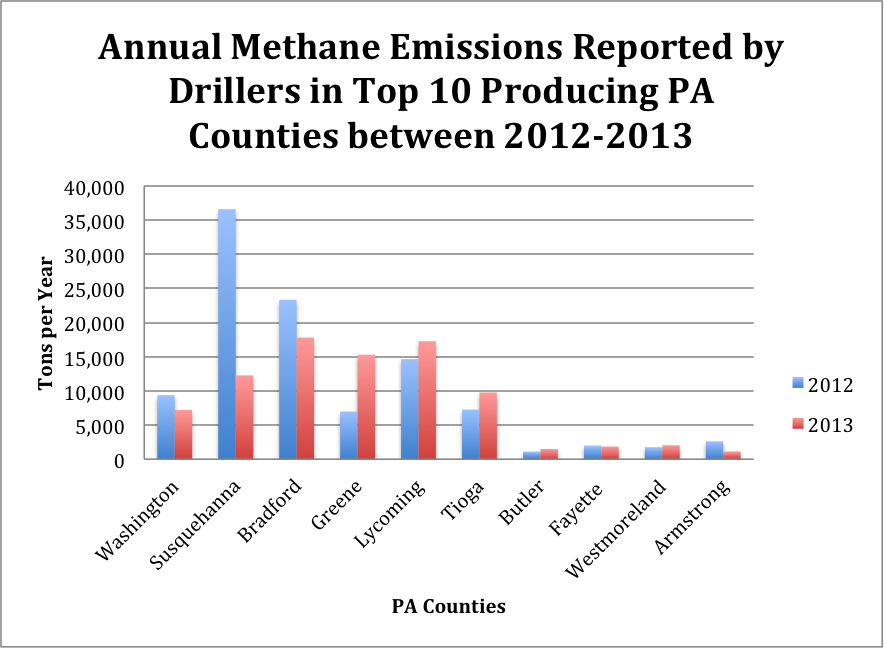
Figure 2
In 2012, Susquehanna, Bradford, and Lycoming counties reported the highest amount of methane released with levels at 36,607, 23,350, and 14,648 tons, respectively (Fig 2). In 2013, Bradford, Lycoming, and Greene counties reported the highest amount of methane released with levels at 17,805, 17,265, and 15,296 tons, respectively.
Although the overall trend of methane emission declines from 2012 to 2013, there is an unusual drop in Susquehanna County’s methane emissions from 2012 to 2013. Susquehanna’s levels went from 36,607 tons to 12,269 tons in that timeframe. However, the DEP SPUD data recorded an increase of 190 active wells to 214 active wells from 2012 to 2013 in that same county. Though the well operators did not provide details for this shift, possible reasons may be because of improved methods of preventing methane leaks over the year, well equipment may be less robust as it once was, operators may have had less of a reason to monitor for leaky wells, or operators themselves could have changed.
Lackawanna and Luzerne counties reported zero tons of methane released during the year of 2012 (not shown on graph). There are two possible reasons for this: both counties did not have any unconventional wells recorded in the 2012 SPUD data, which may explain why the two counties reported zero tons for methane emissions, or the levels submitted are a significant underestimation of the actual methane level in the counties. (While there were no new wells, there are existing wells in production in those counties.)
Considering that methane is the primary component of natural gas activity, the non-existent level of methane reported seem highly implausible even with inactive wells on site. Typically, an old or inactive gas well can either be abandoned, orphaned, or plugged. By definition, abandoned wells have been inactive for more than a year, and orphaned wells were abandoned prior to 1985. (Because of this distinction, however, no unconventional wells can be considered “orphaned.”) To plug a well, cement plugs are used to cover up wellbores in order to cease all flow of gas. The act of physically plugging up the wells paints an illusion that it is no longer functioning and has ceased all emissions.
Because of this flawed impression, systematic monitoring of air emissions is often not conducted and the wells are often ignored. Several studies have shown even abandoned and plugged wells are still spewing out small and at times large quantities of methane and CO2. One study published in 2014 in particular measured 19 abandoned wells throughout Pennsylvania, and concluded that abandoned wells were significant contributors to methane emissions – contributing 4-7% of total anthropogenic (man-made) methane emissions in PA.
View methane emissions map full screen: 2012-2013
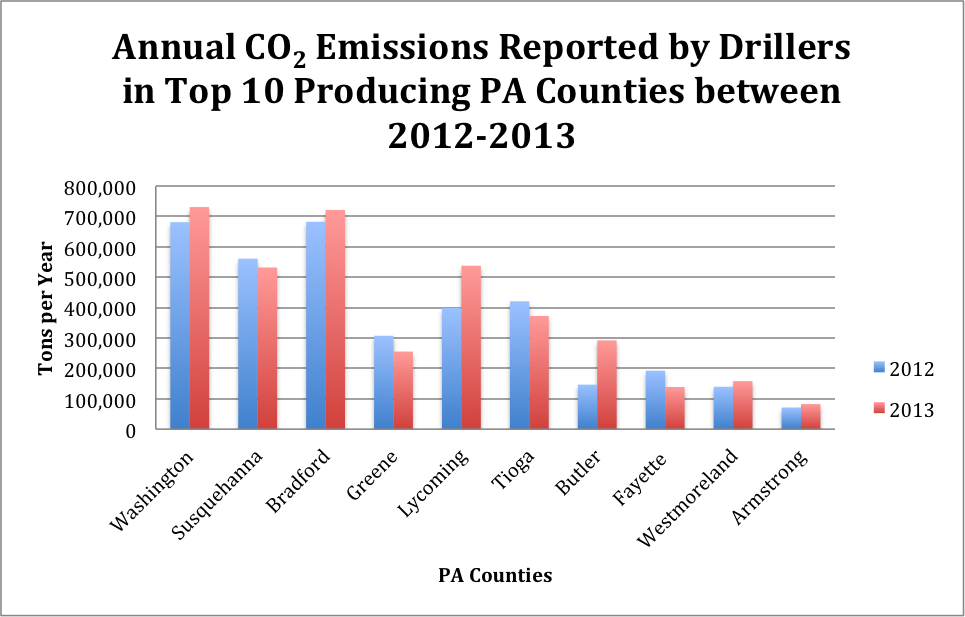
Figure 3
In 2012, Bradford County reported 682,302 tons of CO2 emitted; Washington County reported 680,979 tons; and Susquehanna reported 560,881 tons (Fig. 3). In 2013, Washington continued to lead with 730,674 tons, Bradford at 721,274 tons, and Lycoming with 537,585 tons of CO2 emitted.
What’s intriguing is according to SPUD data, Armstrong, Westmoreland, and Fayette also had considerable natural gas activity between the two years as shown on the map. Yet, their levels of CO2 emission are significantly lower compared to Lycoming or Susquehanna Counties. Greene County, in particular, had lower levels of CO2 reported. Yet, they had 106 active wells in 2012 and 117 in 2013. What is even more unusual is that Bradford County had 9 more wells than Greene County in 2013, yet, Greene County still had significantly higher CO2 levels reported.
Reasons for this difference may be that Greene County lacked the staff or resources to accurately monitor for CO2, the county may have forgotten to record emissions from compressor stations or other fugitive emission sources, or the method of monitoring may have differed between counties. Whatever the reason is, it is evident that the levels reported by Greene County may not actually be an accurate depiction of the true level of CO2 emitted.
View CO2 emissions map full screen: 2012-2013
Spudded wells in PA with reported CO emissions by county 2011-13
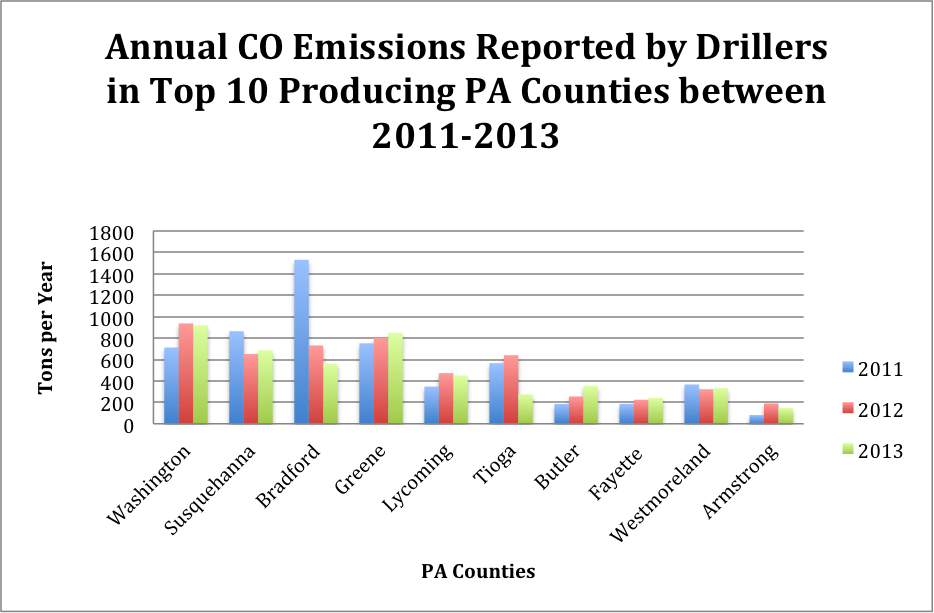
Figure 4
According to the PA SPUD data, the number of new wells drilled in Bradford County dropped from 389 in 2011 to 163 in 2012 to 108 to 2013. The diminishing number of newly drilled wells in this particular county may explain the noticeable outlier in CO emission as seen on the graph (Fig 4).
View CO emissions map full screen: 2011-2013
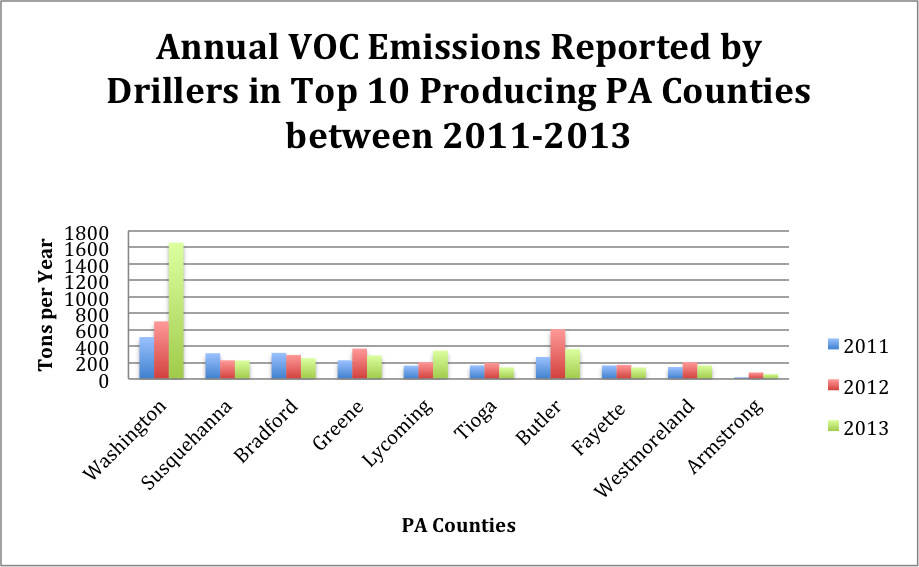
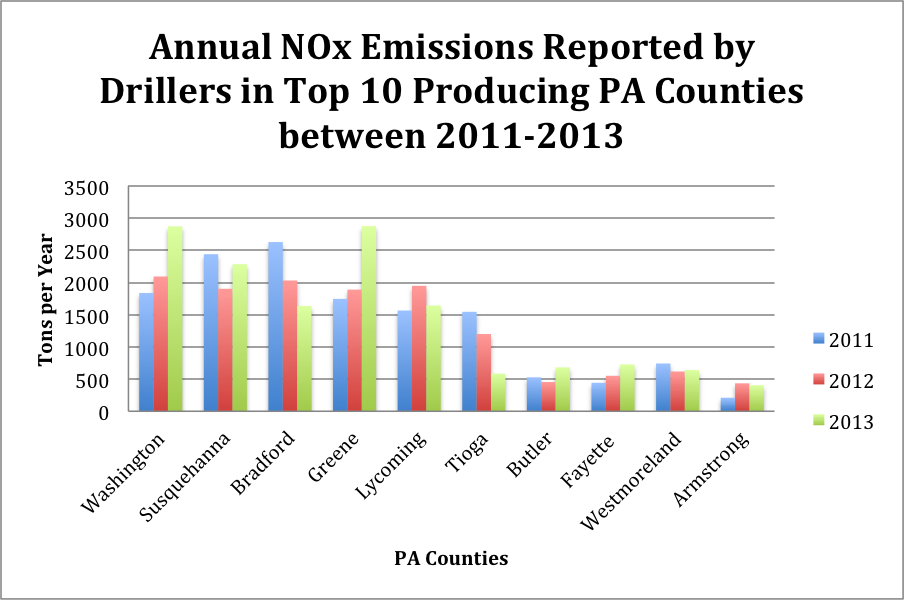
Compressor stations are also known to emit VOC, NOx, and various greenhouse gases; they run 24/7 and serve multiple wells. Compressor stations are necessary to move the natural gas along the pipelines, and thus, may still be required to function even after some wells have ceased operation. Furthermore, there can be multiple compressor stations in a region because they are installed at intervals of about 40 to 100 miles. This suggests that in addition to drilled wells, compressor stations provide additional avenues for NOx or VOC to leak into the air.
View NOx and VOC emissions maps full screen: VOC 2011-2013 | NOx 2011-2013
Spudded wells in PA with reported benzene emissions by county 2011-13
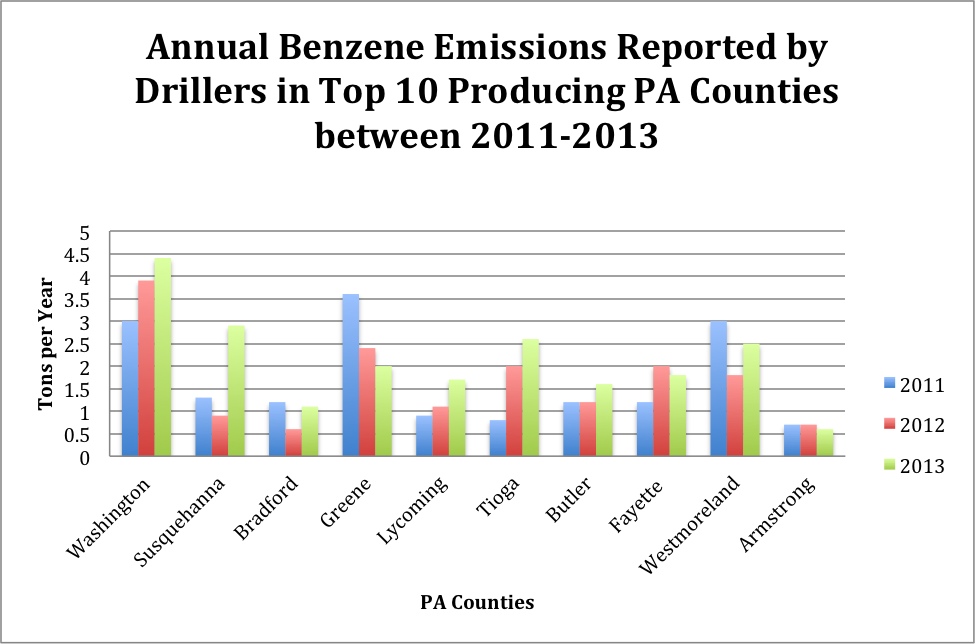
Figure 7
The levels of benzene emitted varied the most when compared to the other pollutants presented previously. Generally, the high levels of methane, CO2, and NOx emitted correlate with the high amount of natural gas activity recorded for each county’s number of drilled unconventional wells. However, it is interesting that both Westmoreland and Fayette counties had fewer active wells than Bradford County, yet, still reported higher levels of benzene (Fig 1, Fig 7).
An explanation for this may be the different monitoring techniques, the equipment used on each site which may vary by contractor or well access, or that there are other external sources of benzene captured in the monitoring process.
View benzene emissions map full screen: 2011-2013
Although the collection and monitoring of air emission from wells is a step in the right direction, the data itself reveals several gaps that render the information questionable.
Overall, PA DEP’s valiant attempt to collect air data from operators and to increase transparency is constrained by the inconsistency and inaccuracy of the dataset. The gaps in the data strongly suggest that the department’s collection process and/or the industry’s reporting protocol still require major improvements in order to better monitor and communicate this information to the public.
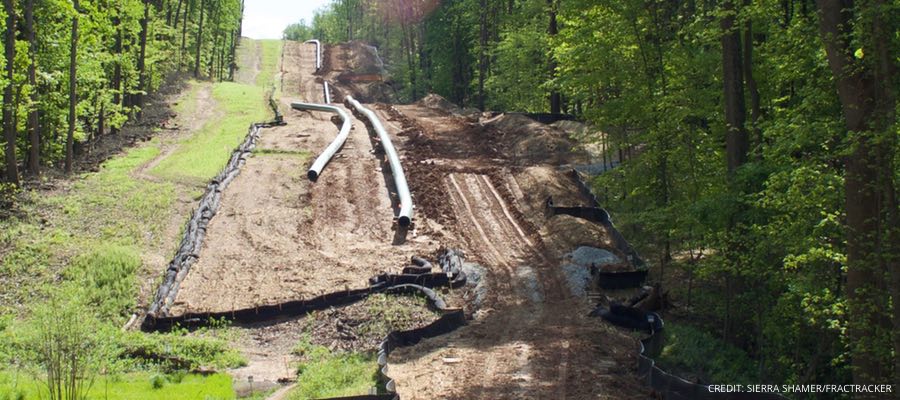
Sierra Shamer, Visiting Scholar, FracTracker Alliance
While neighboring states New York and Maryland work to regulate the natural gas industry, Pennsylvania makes way for a pipeline build-out and continued unconventional oil and gas drilling. The industry, legislature, and state agencies claim that continued natural gas development is necessary, can be carried out safely, and will provide money, jobs, and energy to Pennsylvania. However, the price is increasingly evident, and the realization of these claims is yet to come.
PA residents are quickly learning that pipelines come with a cost; their permitting, construction, and supporting facilities infringe on private property rights, cause water and air pollution, and threaten public safety. On Friday April 29th in Westmoreland County, for example, Spectra Energy’s Texas Eastern 30″ gas pipeline exploded, severely burning one man, destroying his home, and damaging homes nearby. The local fire chief recounted his awe at the explosion. For him, it was “… like you were looking down into hell.” These costs prompt communities to consider whether the advertised benefits of pipelines will actually outweigh the costs. Active grassroots resistance has emerged throughout the state, and as it grows, it is consistently met with industry aggression and state repression.
This article provides an overview of the pipeline build-out in Pennsylvania, the political and economic environment promoting it, growing community activism, and, how the industry and state respond. An interactive map of existing and proposed pipelines in PA is featured at the end of the article.
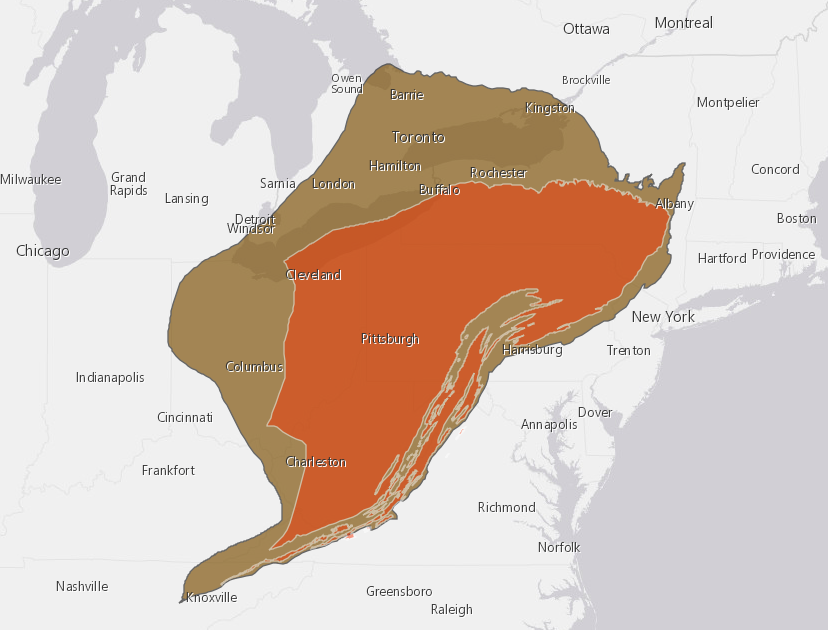
Extent of the Utica (brown) and Marcellus (orange) shale formations. Click to expand.
The existing interstate pipeline network moves domestic and imported oil and gas to consumers and markets within North America. These pipelines extend from regions of conventional drilling to domestic and foreign energy markets. The recent development and expansion of unconventional drilling provides access to energy reservoirs that could not be extracted before. Within the past five years, the US overtook Russia to become the largest producer of natural gas in the world.
The Marcellus and Utica shale formations exist below the Appalachian Mountains in the northeast U.S. and into Canada. The Marcellus lies beneath Pennsylvania, Virginia, Maryland, West Virginia, Ohio, and New York. The Marcellus is now the largest region of natural gas production in the United States. Geologists estimate that 4-8,000 ft. underground, over 600 trillion cubic ft. of natural gas is accessible. The Utica formation lies underneath the Marcellus, extending north into Ontario and New York, and south into Virginia, Kentucky, and Tennessee. Geologists estimate over 38 trillion cubic ft. of natural gas is accessible – in some locations over 10,000 feet underground.
Almost 10,000 unconventional wells in Pennsylvania produce millions of cubic feet of gas each day. This rapid extraction flooded the market, causing natural gas prices to drop dramatically. Marcellus production also outpaced the capacity of the current pipeline network. The location and flow direction of existing pipelines is not ideal for transporting Marcellus gas to markets with higher demand. Additionally, well productivity drops 70% within the first year, so new wells must be drilled to keep the gas flowing. However, the low price of gas reduced revenues, and the cost of drilling new wells remains high. Combined, these factors have paused drilling activity throughout the state. In order to overcome this, gas companies are proposing construction of new pipelines and expansions of existing ones, resulting in the current pipeline build-out.
The dominant narrative, promoted by industry and state, weaves a story of economic prosperity gained by drilling the Marcellus, eclipsing concerns of pipeline necessity and safety. Each pipeline project claims an economic impact in dollar amounts and jobs. Williams claims that their proposed Atlantic Sunrise pipeline will “increase economic activity by $1.6 billion in project regions” and create job opportunities. Sunoco Logistics claims that the Mariner East pipeline will “add $4.2 billion to Pennsylvania’s economy, supporting more than 30,000 jobs during the construction period and … 300-400 permanent jobs.” Often, the specifics of money and jobs are not explained, and when construction begins, communities are invaded by out of state workers and left with little economic benefit.
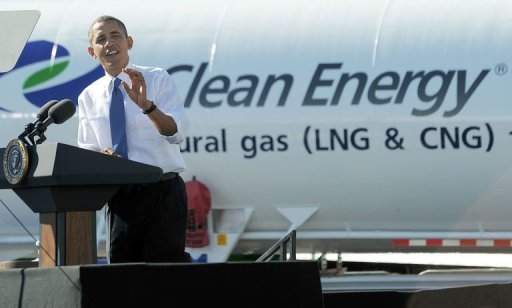
Response to this buildout arises at all levels. Support pours down from federal and state government while resistance pushes up from the grassroots. The EPA and Obama administration work to shut down coal and promote natural gas, claiming it’s a “bridge fuel” to renewable energy. Pennsylvania’s legislature and Dept. of Environmental Protection (DEP) have battled over drilling regulations, and the push for pipelines presents a different set of challenges. While some consider the build-out necessary to maintain the natural gas industry in PA, others, such as Phil Rinaldi, envision ways in which pipelines can bring money to the state.
Aware that interstate pipelines carry Pennsylvania shale to out-of-state markets, Phil Rinaldi, the CEO of Philadelphia Energy Solutions (PES) views the shale boom as an opportunity to maintain resource and revenue in state. In 2013 he established the Greater Philadelphia Energy Action Team (GPEAT), a group of over 80 industry, manufacturing, labor, and government stakeholders. Their objective is to capitalize on shale by promoting pipeline construction and bringing energy-intensive manufacturing to the Greater Philadelphia area. In March of this year, the GPEAT released a report titled, “A Pipeline for Growth: Fueling Economic Revitalization with Marcellus and Utica Shale Gas.” This reports details strategies to hasten the transformation of Philly into the “energy hub” of the East by inviting chemical manufacturing industries, and supporting pipeline projects to Philadelphia.
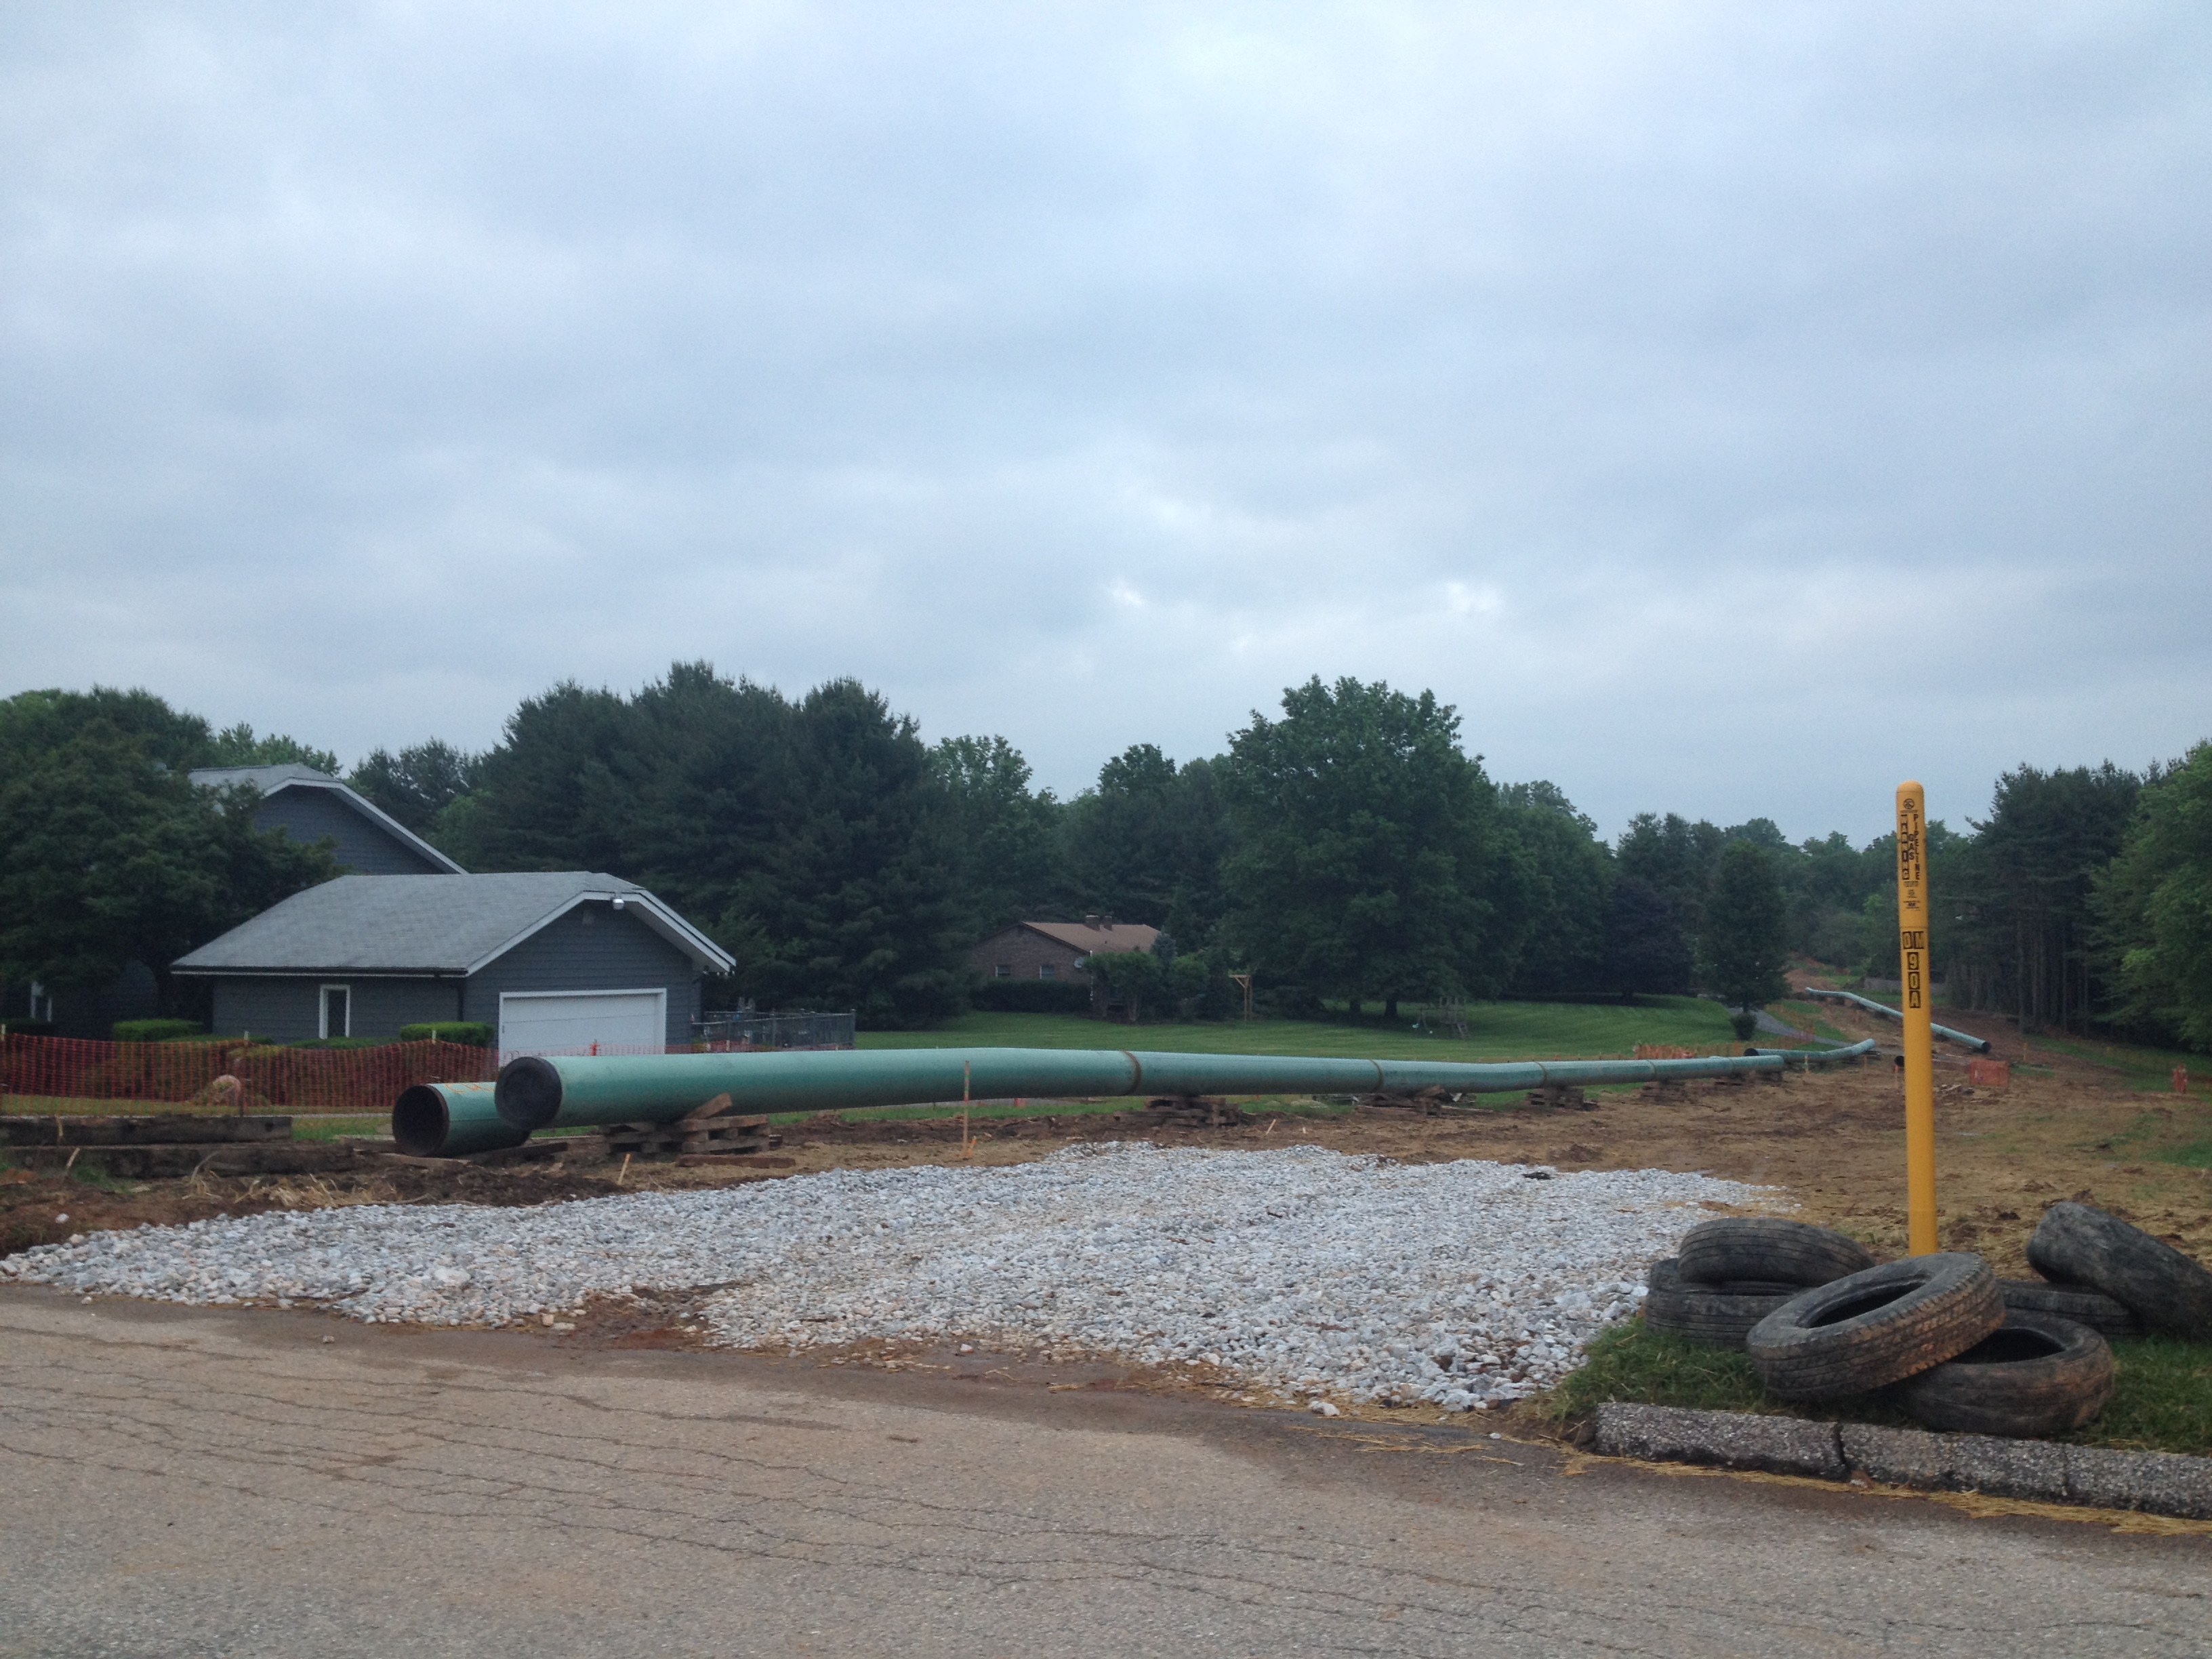
2016: Columbia 26″ pipeline construction near a home in Northern Maryland (Photo: Sierra Shamer)
At a ground level, impacted communities, public health professionals, and environmental organizations face a ravenous industry. Unaccountable for property takings, fair compensation, and pollution, it as an industry that disregards public health and ecosystems within the shalefields. As a result, grassroots and advocacy groups organize and mobilize throughout Pennsylvania to amplify the voices of impacted residents and communities and to hold the industry and government accountable to the people.
Although pipelines bring large revenues for companies, industry, and the state, the story on the ground is different. New pipelines are either constructed on existing land easements, or new ones must be purchased from landowners along the proposed right-of-way. Pipeline operators have one goal: to find the most direct and least complicated route from supply to demand. While this lower their bottom line, new pipeline routes often disregard nearness to homes, schools, and other populated areas, and cause significant damage to farmland and ecosystems.
Pipeline companies often have the power of eminent domain, the ability to take possession of land in court if the property owner refuses a contract. Negotiating fair agreements requires landowners to hire their own appraiser and lawyer, which is not an option for everyone. Unlike drilling wells, landowners do not receive royalties for the pressurized gas flowing underneath their property, facing instead declines in property values and an inability to sell their home. As a result, landowners are left undercompensated, their land forcibly taken away in an unjust process.
Landowners along the right-of-way are the most immediately impacted, but neighbors and communities are affected as well. Each pipeline has a “potential impact radius” or “hazard zone,” the area within which an explosion causes immediate destruction. Residents within this distance experience a decrease in their property values, but currently have no legal recourse for compensation. Pipelines also require numerous compressor stations, facilities that operate 24-7 to maintain the pressure of the gas within the pipeline. Compressor stations are industrial, air polluting facilities that release greenhouse gases, neurotoxins, cancer causing agents, and other pollutants that negatively impact human health and the environment. Residents living near compressor stations experience various respiratory, sinus, and nervous system health issues. These are caused by both everyday operation and periodical gas blowdowns – facility operations when large amounts of methane and other chemicals are released directly into the air for station maintenance or emergencies.

FERC holds Public Meetings for the Atlantic Sunrise Pipeline (Photo: Justin Engle/The Daily Item)
In Pennsylvania, no single agency is responsible for permitting, monitoring, or regulating pipelines. The Federal Energy Regulatory Commission (FERC) permits interstate pipelines, those that cross state boundaries or carry product that does. Pipelines within the state are under the jurisdiction of the Public Utility Commission (PUC), the DEP, and/or the Dept. of Conservation and Natural Resources (DCNR).
Typically, the PUC is responsible for pipelines that provide directly to consumers. However, in 2011 Act 127 gave the PUC authority to permit and inspect gathering lines, those that move gas from well pads to larger transmission pipelines. All gathering lines have national safety standards except Class 1, those with no more than ten buildings within 220 yards. The PUC maintains a registry of the location, size, and length of gathering lines, but is only includes length for Class 1. Over 12,000 miles of Class 1 pipelines currently exist in PA, a number expected to quadruple by 2030.
The complex regulation and unprecedented increase in proposals prompted Governor Wolf to create the Pipeline Infrastructure Task Force (PITF) in 2015. Headed by former Secretary of the DEP, John Quigley, the Task Force included regulatory agencies, industry representatives, and government officials. Their mission: to “engage stakeholders in a collaborative process to achieve a world-class pipeline infrastructure system” and to develop “policies, guidelines, and tools to assist in pipeline development.” The DEP offered live stream of meetings, provided public information, and opportunity for public input in an attempt to be transparent.
Task Force meetings eventually resulted in a final report, outlining challenges and providing suggestions for pipeline construction. First, the Task Force recommended an increase meaningful public participation and the development of long term maintenance plans to ensure safety. Second, they suggested reducing environmental impact by improving pipeline siting and construction and maximizing efficient permitting. Finally, they recommended enhancing the workforce and economic development from pipeline projects.
The Task Force openly acknowledged problems of the pipeline build-out, stating that “permits are not reviewed for the cumulative and long term impacts at a landscape level…they do not necessarily avoid sensitive lands, habitats, and natural features, nor are the impacts to natural and cultural resources, landowners, and communities…always minimized or mitigated.” Despite this, the administration and the Task Force maintain that pipelines can be built responsibly.
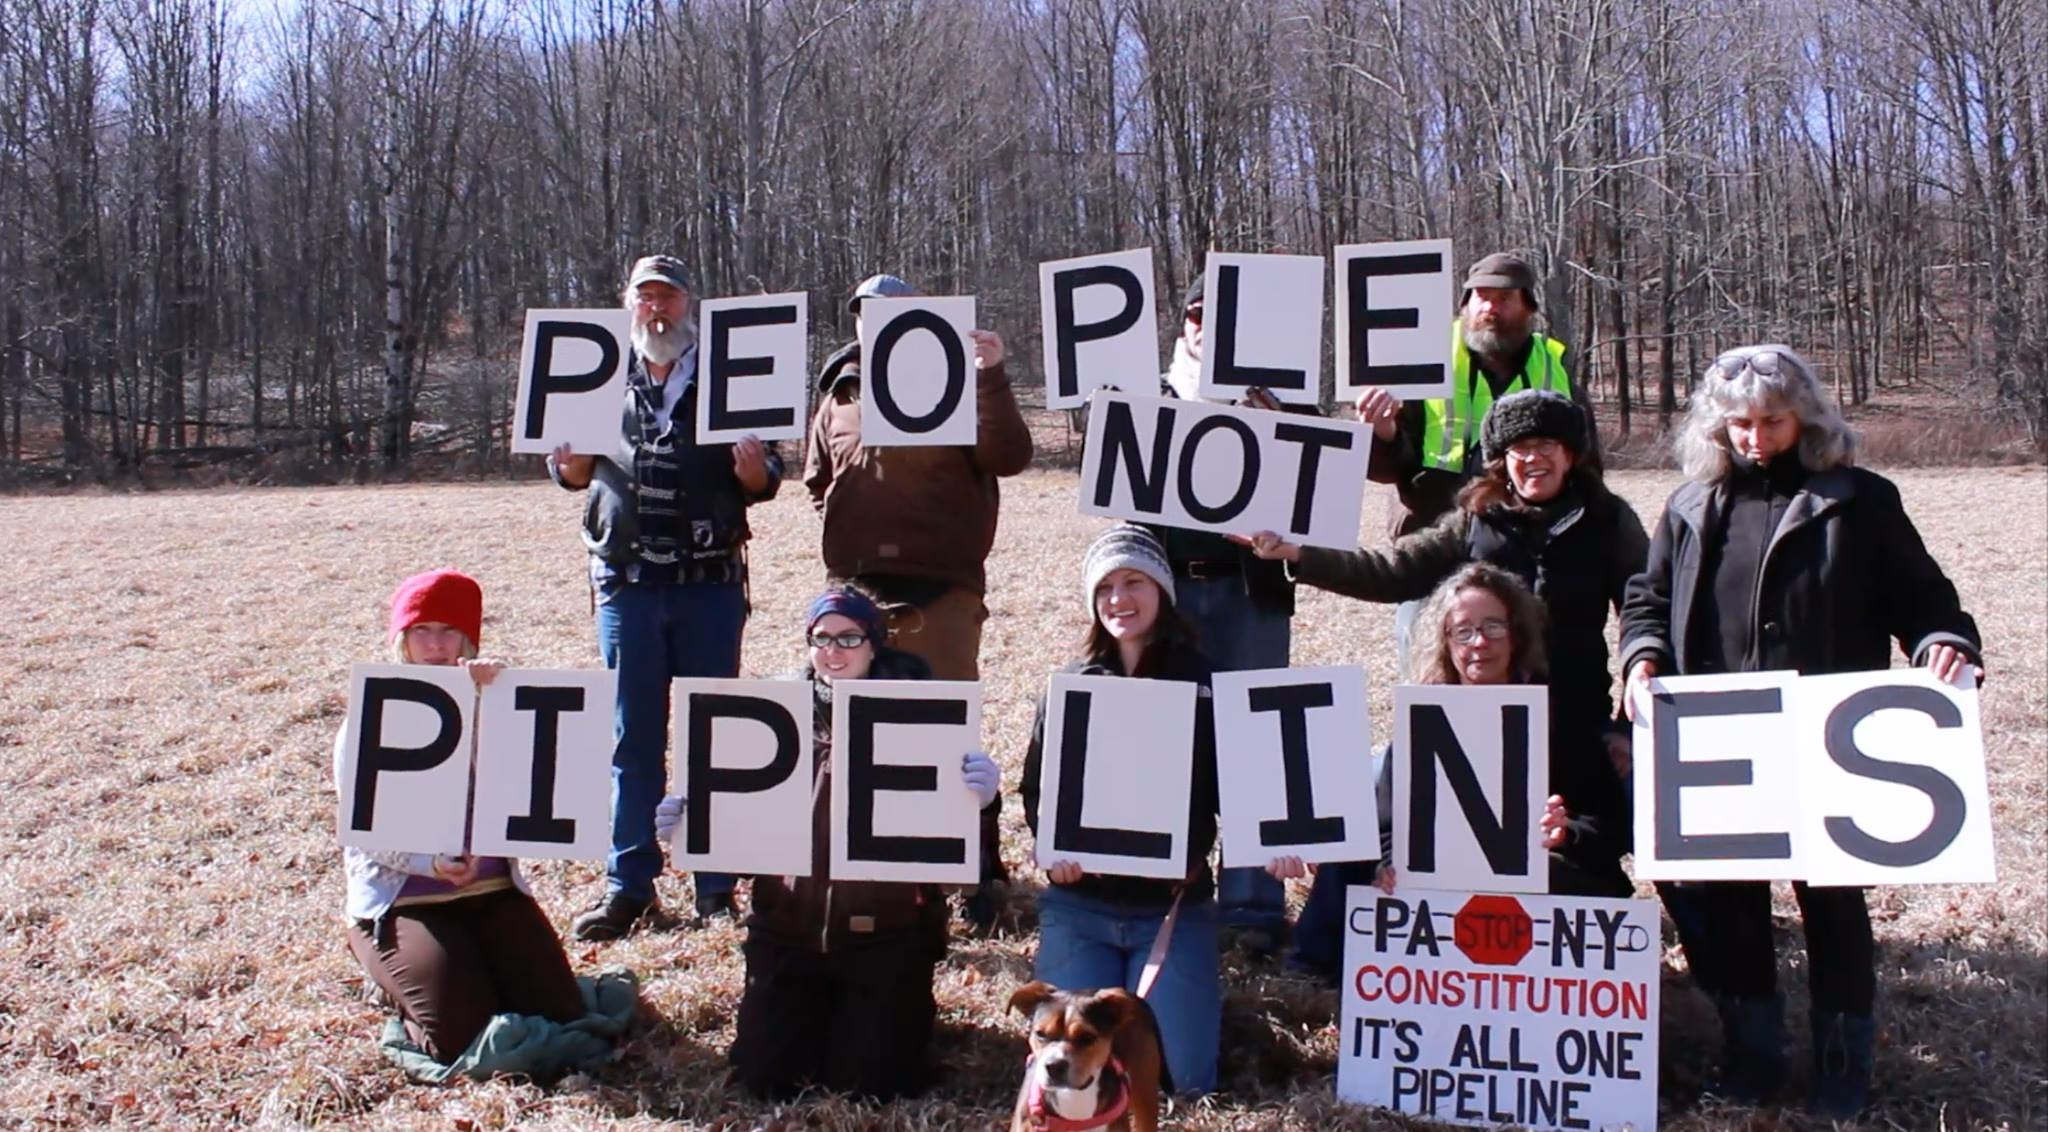
2016: Landowners and supporters protest the Constitution Pipeline in Northeast PA. (Photo: DC Media Group)
Challenges to the pipeline build-out exist in many forms. Landowners challenge the bullying, harassment, and eminent domain condemnations of pipeline companies. Communities criticize the acceptance of industry funding and pipelines by local representatives. Additionally, grassroots groups and environmental non-profits challenge the minimal regulation, permitting process, and lack of public participation allowed by the DEP, and the FERC “rubber stamp” permitting process.
Awareness and opposition grow with each proposal, condemnation, rupture, and explosion. This rapid construction is compromising pipeline quality and public safety, according to a report conducted by the Pipeline Safety Trust. They found that pipelines built after 2010 had higher rates of failure than those in decades past. Whistleblowers who worked for Spectra Energy have attested to the neglect of proper inspection in the haste to construct pipelines. Spectra’s Texas Eastern pipeline, completed in 1981, was built in a decade when pipelines failed at one-sixth the rate they do today. However, their preliminary investigation indicates that the explosion in Salem Township was likely the result of corrosion due to a “possible flaw in the coating material applied to the weld joints.”
The FERC is a regular target of criticism. Funded through fees received by the companies and industries it oversees, FERC rarely denies permits for pipelines. The Delaware Riverkeeper Network has filed a lawsuit against the FERC challenging the constitutionality of its decision-making.
The DEP’s dedication to protecting Pennsylvania’s environment from the natural gas industry at large is continuously questioned due to its infrastructure permitting, negligent response to water contamination complaints, and unwillingness to hold companies accountable. The DEP’s poor record on drilling regulation continues with regard to the pipeline build-out.
The Task Force is criticized for its overwhelming industry influence and lack of public inclusion. Of the 48 Infrastructure Task Force members, 56% are tied to the oil and gas industry. Specifically, 92% of the non-governmental members have industry ties. In fact, potential opposition to the build-out was intentionally absent. PA resident and documentary filmmaker Scott Cannon of the Gas Drilling Awareness Coalition (GDAC) was invited to the PITF, only to receive a letter rescinding his invitation a few days later. Additionally, concerned residents were allowed 2 minutes to make a statement, a limit strictly enforced by Secretary Quigley. While affected landowners recounted their fight for their livelihoods, the roundtable of apathetic Task Force members stared blankly. These problems resulted in escalating activist presence increasing from comments and protests outside the DEP building, to meeting disruptions and arrests.
Residents and activists weren’t the only ones unhappy with the PIFT. Cindy Ivey, representative for Williams, and Sarah Battisti, with SouthWest Energy, spoke of their frustrations. The fact that interstate pipeline projects are regulated by federal agencies, and state level organizations have a minor role caused tension in the group. According to Ivey, these issues are “hard things to try to explain gracefully.” Additionally, Battisti added that the 184 recommendations in the report wouldn’t “impact any of us in the near future.”
Despite recommendations of the Task Force, the DEP continues to issue permits that neglect cumulative impacts and complete environmental review. Unlike New York, which denied the 401 Water Quality certificate and prevented the construction of Constitution pipeline, the PA DEP granted the 401 certificate to the Atlantic Sunrise pipeline. As a result, it is under appeal by environmental groups, who argue that it violates the Clean Water Act and the Pennsylvania Code.
 Regulations
Unfortunately, meaningful updates to oil and gas regulations in Pennsylvania are consistently challenged. Although Act 13 passed in 2012, critical components were appealed repeatedly, specifically the issue of local zoning authority of oil and gas infrastructure. Lawmakers who oppose any restriction on the industry dominate the current legislature. Recently, the House panel voted a second time to block increased DEP oil and gas regulations, in the making since 2011.
Frustrations in the process peaked when John Quigley resigned as secretary of the DEP after sending a profane email chastising environmental groups for their lack of support. Weeks later, Governor Wolf signed a bill that eliminates current regulations, aiming to start new and in agreement with the legislature. As a result, many environmentalists feel that the Governor has consistently compromised on the environment, putting the lives of PA residents at risk.
The relationship between the state and the drilling industry is evident and problematic in Pennsylvania. The Marcellus Money project has tracked campaign contributions and lobbying expenses from the natural gas industry, revealing over $8 million in political contributions and $46 million for lobbying efforts. In 2013 the Public Accountability Initiative released a report revealing the “revolving door” between state government and the oil and gas industry. The report identifies individuals who have moved from the public sector to industry jobs or vice versa, and how often this occurs over the course of their careers.
NPR StateImpact Pennsylvania created an interactive webpage called, “Blurred Lines” that provides a visual exploration of the “revolving door.” As you scroll through the years, individuals slide back and forth between the private and public sector. Additionally, lawmakers have, for a third time, earmarked fiscal code legislation to fund an industry-supported non-profit Shale Alliance for Energy Research PA, (SAFER PA).
Financial gains from drilling support other aspect of the public sector as well. The DCNR’s annual budget became increasingly reliant upon revenues from gas leases within public lands. In 2013, oil and gas lease royalties and other payments provided one-third of the DCNR’s budget. Act 13 implemented a mandatory impact fee whereby the PUC collects money from companies based on the number of oil and gas wells in the state. This money is directed to local municipalities based on the number of wells within their boundaries. However, while 60% of the fee total goes directly to impacted counties, the remaining 40% can go anywhere in PA. While impact fees totaled over $233 billion dollars in 2014, 2016 is expected to be the lowest amount yet due to the decline in drilling activity. This statistic is one of many that highlights the risk of relying on a fluctuating resource.
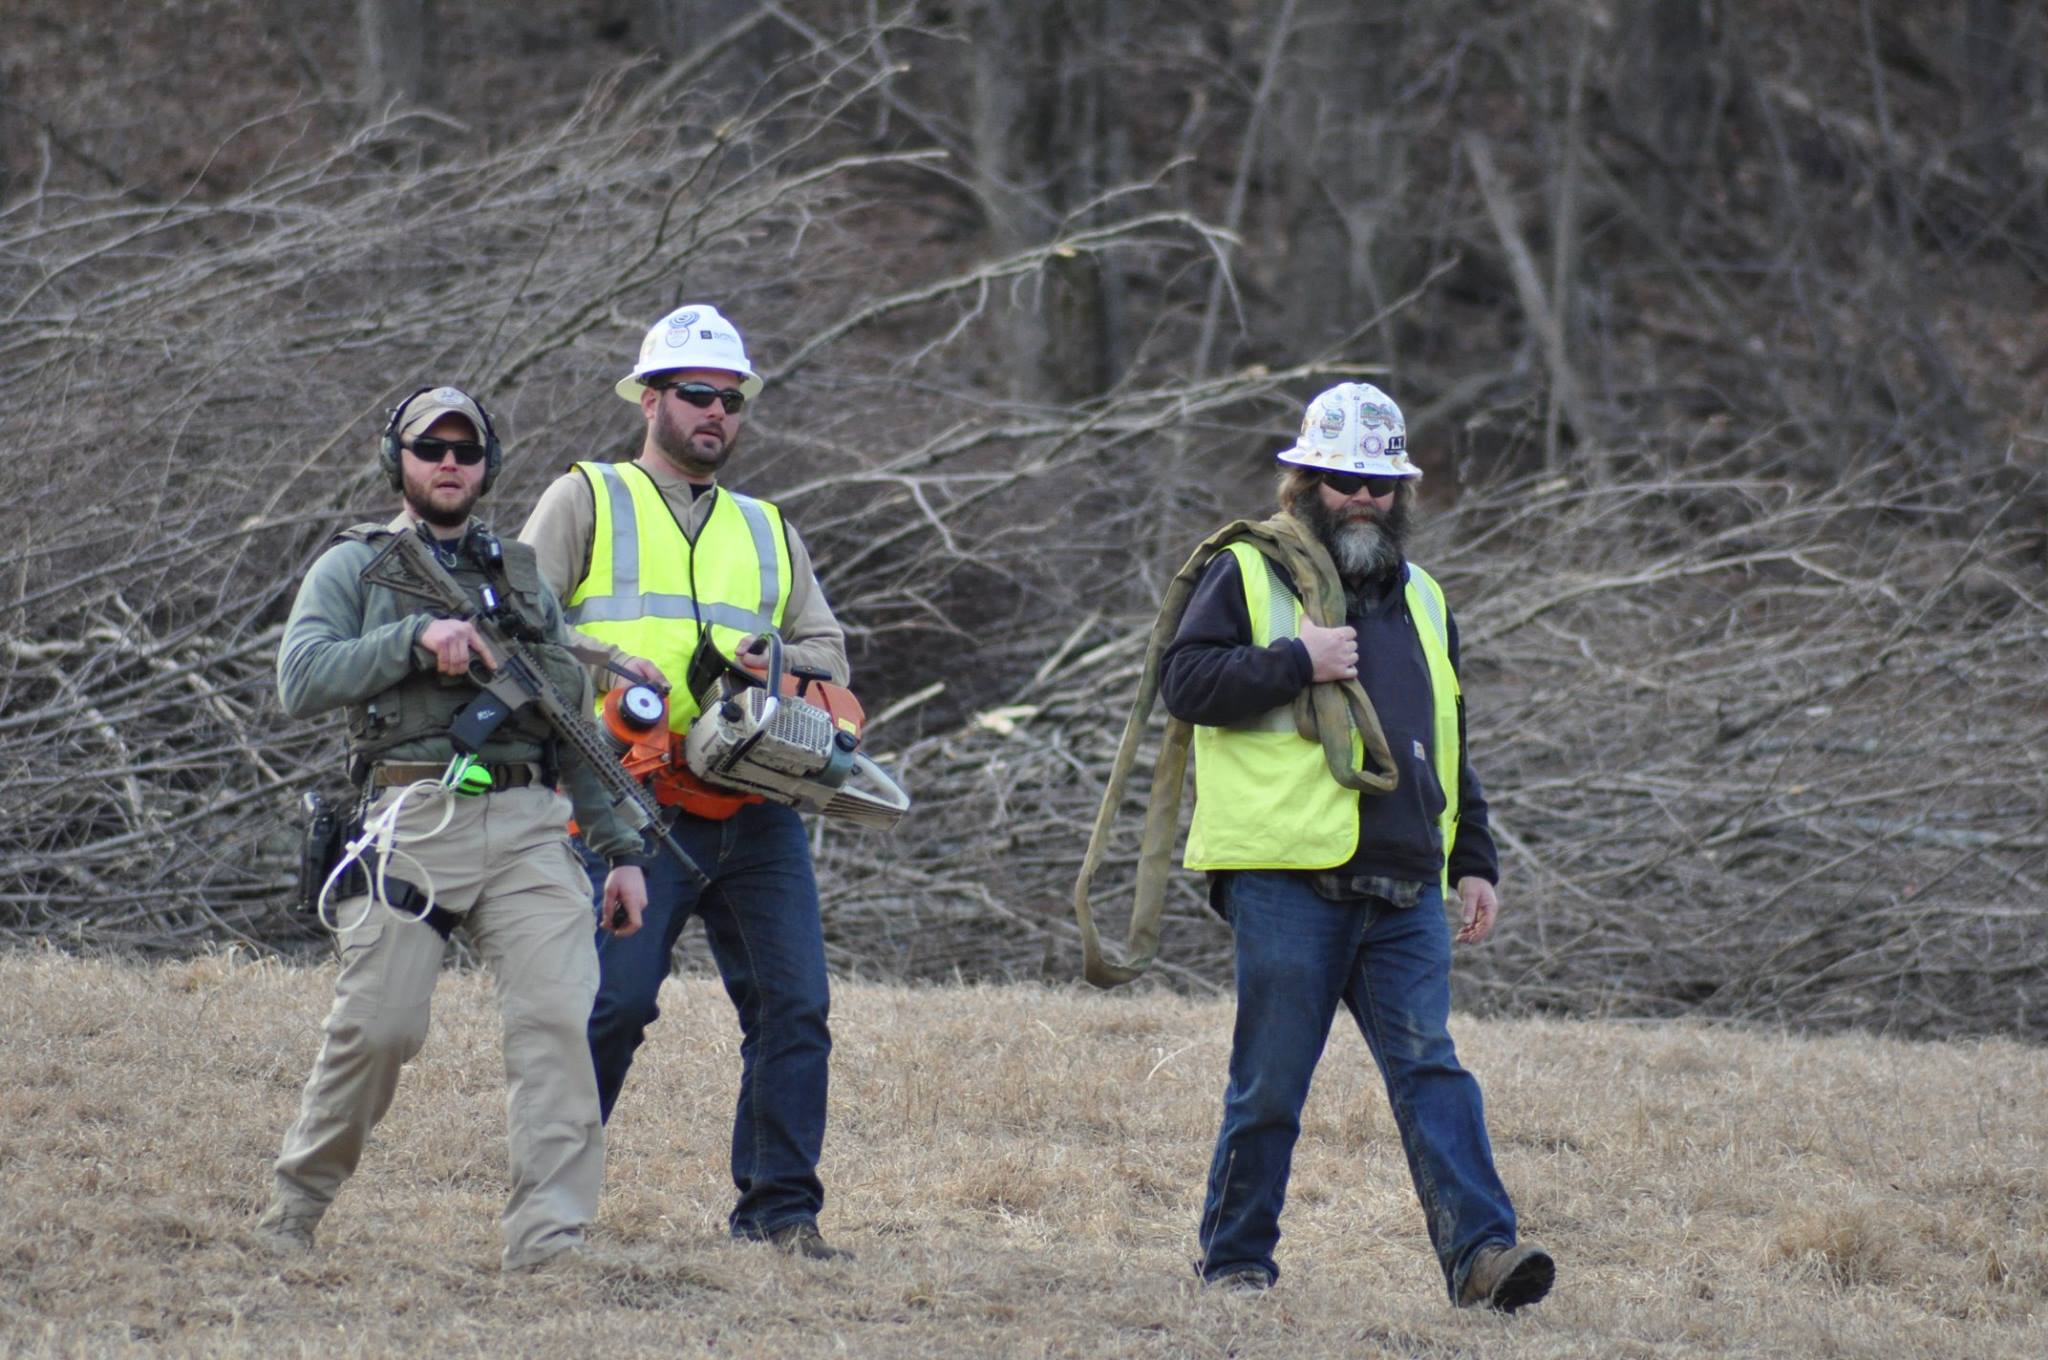
2016: Armed U.S. Marshall escort the tree cutting crew for the Constitution pipeline on Megan Holleran’s property (Photo: Alex Lotorto)
Response to community opposition of pipeline projects is often militaristic in nature and exaggerated by the industry and the state. The oil and gas industry views community opposition to infrastructure as an “insurgency.” In 2011, it was revealed that the Army/Marine Corps Counterinsurgency manual is used as a tactical reference. The Gas Drilling Awareness Coalition was classified as a terrorist threat by the PA Office of Homeland security, who hired the Institute of Terrorism Research and Response to track activists provide weekly information on a bulletin sent to law enforcement and gas companies. In 2012, state law enforcement, the FBI, the PA Office of Homeland Security, and the oil and gas industry established the Marcellus Shale Operators’ Crime Committee (MSOCC). This committee actively targeted activists and environmentalists in their homes.
Landowners who refuse to sign easements face an uphill battle against companies, law enforcement, and the state as they advocate for their rights. Megan Holleran of Susquehanna County lost her family’s maple syrup trees to Williams’ proposed Constitution pipeline. After protesting and challenging in court, the judge upheld eminent domain and prohibited the family from being within 150 feet from the right-of-way. Further, armed U.S. Marshalls escorted and guarded the tree cutting crew against peaceful protest. Additionally, in Huntingdon County, Elise and Ellen Gerhart faced tree clearing of their woods for Sunoco’s Mariner East pipeline. Once again, armed police escorted tree cutting crews and made several arrests of protesters, who faced bails of up to $200,000.
The map below shows the existing major pipeline infrastructure in Pennsylvania and proposed pipelines, with the option of also viewing the unconventional wells in the Marcellus and Utica shale. For more information on pipeline regulation and public information, please view our Intro to Pipelines resource page. It includes details about current and proposed pipeline projects in Pennsylvania and throughout the country. Additionally, the intro links to a map of all proposed pipeline projects in North America.
View map full screen | How FracTracker maps work
While it is clear that companies go to every length to construct pipelines, it is equally clear that state agencies, courts, and law enforcement support pipeline development. The direction of drilling, pipelines, and politics in the state of Pennsylvania serves the bottom line of the natural gas industry. This is evidenced by the proposed pipeline built-out, state support, and state suppression of public backlash. However, continued challenges to public health and environment will only serve to increase the resilience and strength of community opposition.
![]()
216 Franklin St, Suite 400, Johnstown, PA 15901
Phone: +1 (717) 303-0403 | info@fractracker.org
FracTracker Alliance is a 501(c)3 non-profit: Tax identification number: 80-0844297
