Producing nitrogen fertilizer for US cropland depends on cheap and unfettered access to natural gas.
Key Findings
Ammonia produced for fertilizer using the Haber-Bosch process is responsible for approximately 1.8% of carbon dioxide global emissions.
Overview
Products derived from oil and gas are ubiquitous in our lives—and so are their impacts. As society becomes increasingly aware of the risks associated with petrochemicals, one common concern centers around the production and disposal of single-use plastic products. However, there are many other issues related to the petrochemical industry. A prime example: the connection between agriculture and petrochemicals.
But how interdependent are industrial-scale agriculture and the oil and gas industry? And what are the concerns? In this article, we explore the linkages between the two industries, including the history of agricultural development in America and its connection to industrial chemical manufacturing.
Fertilizer and Fossil Fuels
There are many examples of connections between large-scale commercial agriculture and the oil, gas, and petrochemical industries. One example of this is commodities such as corn and soybeans being coated in plastics to allow for the controlled release of fungicides and insecticides. However, the most time-tested example of how reliant these two behemoths are connected: industrial agriculture’s historic reliance on nitrogen and phosphorus fertilizers.
As farming practices have eroded topsoil and depleted once-fertile grasslands of the greater Midwest, often referred to as the “breadbasket” for its role in producing high volumes of wheat and other staple food crops, reliance on fertilizer has only continued to grow in the last hundred years—which in turns drives the fossil fuel industry.
The History of Fertilizer Production
The connection between fossil fuels and fertilizer begins with production. Producing nitrogen fertilizer for US cropland depends on cheap and unfettered access to natural gas to fuel the Haber-Bosch process, an industrial chemical manufacturing process developed to synthesize ammonia.
Discovered by Nobel Prize-winning chemists Fritz Haber and Carl Bosch in the early 1900s, this process converts N2 into Ammonia (NH3) by reacting it with hydrogen (H) at extremely high temperatures (>900F) and pressures (2,200-2,900 psi). Producing the hydrogen feedstock needed for the Haber-Bosch process requires using natural gas for steam reformation to produce hydrogen and carbon monoxide.
By middle of the twentieth century, aided and abetted by the Ford and Rockefeller Foundations’ scientists like Norman Borlaug, technological advances in nitrogen production helped spur what came to be known as the “Green Revolution”, the precursor to modern industrial agriculture characterized by massive alterations of plant genetics, modern irrigation, rampant deployment of all manner of herbicides and pesticides, and the full-throated advocacy for the utility of synthetic nitrogen and phosphorus fertilizers.
Though the Green Revolution is credited for having increased yields significantly where it was implemented, even earning its architect Norman Borlaug a Nobel Prize in 1970, many others were sounding alarms about the potential ecological and socioeconomic impacts of such intensive agriculture, including Anne and Paul Ehrlich in their classic book Population Bomb (1968), and, even more famously, the venerable Rachel Carson in her classic call to arms Silent Spring (1962).
In the US, large agricultural interests didn’t need much coaxing to embrace the fertilizer revolution that was catalyzed by Haber and Bosch, and later implemented on a large scale by Borlaug, the “father of the Green Revolution”, and his fellow proselytizers.
Modern Impacts
Today, not only is using the Haber-Bosch process for fertilizer production responsible for approximately 1.8% of global carbon dioxide emissions, no matter where it’s used—whether used in the Great Plains of the US, or the rice fields of Southeast Asia—nitrogen and phosphorus applications exact a price from the environment and people that apply them.
Numerous studies to date have demonstrated the deleterious impacts of Input Intensive Agriculture (IIA) on biodiversity, water quality and quantity, small farmers, food quality, and human health.
Furthermore, whether producing a percentage of the 11.9 million tons of nitrogen used by industrial agriculture in a plant in Donaldsonville, Louisiana, or a fraction of the 3.7 million tons of phosphorus used and derived from mining phosphate rock east of Tampa, Florida, we are relying on natural gas to keep the price of both processes affordable, and therein is the longest running link between “big ag” and “big oil and gas”.

CF Industries in Donaldsonville, Louisiana. Photo by Healthy Gulf c/o SouthWings
North American Nitrogen and Phosphorus Fertilizer Producing Plants
This interactive map looks at all North American – and select international – nitrogen and phosphorus producing plants and/or mines in the case of phosphorus.
View the map “Details” tab below in the top right corner to learn more and access the data, or click on the map to explore the dynamic version of this data. Data sources are also listed at the end of this article. In order to turn layers on and off in the map, use the Layers dropdown menu. This tool is only available in Full Screen view. Items will activate in this map dependent on the level of zoom in or out.
View Full Size Map | Updated 11/1/2023 | Map Tutorial
Data
This is a map of a single data set of all North American nitrogen and phosphorus producing plants and mines, respectively. We have synthesized this data from industry reports, SEC filings, and industry associations like The Fertilizer Institute. To our knowledge, this is the most complete map of the fertilizer industry to date, however, what this map lacks is a complete inventory of each plant or mine’s annual production rates with this information inaccessible for a variety of reasons including the fact that the USGS does not share individual plant levels of production due to the proprietary way in which they receive such information from commodity producers for their annual Mineral Commodity Summaries.
We have been able to obtain reliable estimates of production, storage capacity, and/or potential capacity for 50% of the 157 facilities in this inventory but that leaves a huge “known unknown” for half of these sites, which is given even more significance given the established relationship between the fertilizer industry and environmental justice issues that run the gamut from human health impacts to algal blooms from Lake Erie to the Gulf of Mexico. What is obvious from this map is that there are significant geographic hotspots for the production of nitrogen and even more so for phosphorus. Florida is by far the largest producer of phosphorus followed by Idaho, Louisiana, Utah, New Mexico, and Saskatchewan (Table 1).
What is clear from the data we have been able to compile is that there is CF Industries in Donaldsonville, Louisiana, and then there is everyone else with this mammoth plant producing 8 million tons of nitrogen fertilizer per year which is more than the next four facilities combined. However, a closer examination of the production data for the 32 currently active nitrogen plants from 2002 to 2021 shows that while Donaldsonville is the leader in terms of percent change over that period there are other plants that have seen massive expansions including the Yara Freeport plant which has actually seen a greater expansion on a percentage basis between 2002 and 2021 than CF Industries’ Donaldsonville plant (Figure 1).
The former has expanded production by 14% per year during this period versus Donaldsonville’s 8.5%. Additionally, LSB Industries El Dorado, Arkansas, and CF Industries in Port Neal, Iowa, have experienced significant annual expansions with respective rates of growth of 8.8% and 14.8% per year albeit over a shorter time period in the case of El Dorado (2016-2021). Several plants have actually witnessed contractions in production including Dyno Nobel’s Cheyenne, Wyoming, plant (-1.6% Per Year), Nutrien’s Kenai, Alaska, plant (-4.1%), and LSB Industries’ Pryor, Oklahoma, plant (-1.4%).
Table 1. US State and Canadian Province Nitrogen and Fertilizer Plants and Mines
State or Province |
Number of Plants, Mines, or Terminals |
||
| Total | Nitrogen | Phosphorus | |
| Alabama | 4 | 4 | |
| Arizona | 1 | 1 | |
| Arkansas | 1 | 1 | |
| California | 3 | 3 | |
| Connecticut | 1 | 1 | |
| Florida | 14 | 2 | 12 |
| Georgia | 4 | 2 | 2 |
| Idaho | 7 | 1 | 6 |
| Illinois | 10 | 9 | |
| Indiana | 6 | 6 | |
| Iowa | 5 | 5 | |
| Kansas | 3 | 2 | 1 |
| Kentucky | 1 | 1 | |
| Louisiana | 8 | 3 | 5 |
| Maine | 1 | 1 | |
| Michigan | 2 | 1 | 1 |
| Minnesota | 2 | 2 | |
| Mississippi | 2 | 1 | 1 |
| Missouri | 6 | 5 | 1 |
| Nebraska | 4 | 4 | |
| Nevada | 1 | 1 | |
| New Mexico | 3 | 3 | |
| New York | 2 | 1 | 1 |
| North Carolina | 2 | 1 | 1 |
| North Dakota | 3 | 3 | |
| Ohio | 5 | 4 | 1 |
| Oklahoma | 4 | 4 | |
| Oregon | 3 | 3 | |
| Pennsylvania | 5 | 5 | |
| Tennessee | 1 | 1 | |
| Texas | 5 | 1 | 1 |
| Utah | 5 | 1 | 4 |
| Virginia | 4 | 4 | |
| Washington | 2 | 2 | |
| West Virginia | 4 | 4 | |
| Wyoming | 2 | 1 | 1 |
| Alberta | 8 | 8 | |
| Manitoba | 1 | 1 | |
| Ontario | 1 | 1 | |
| Saskatchewan | 4 | 1 | 3 |
Figure 1. Annual Percent Change in Nitrogen Production for the 32 Active Anhydrous Ammonia Plants in the United States between 2002 and 2021.

The Take Away
The information provided in this interactive map is currently incomplete due to a significant lack of basic information for many of the sites depicted above and therefore warrants further investigation. Additionally, we need to look at the relationship between production and CO2 emissions by merging this data with the EPA FLIGHT data for each site in this data set because it isn’t good enough to simply look at production when it comes to industrial actors like these we must also look at emissions to understand the inefficiencies that likely are rampant across the fertilizer landscape. These will be the updates we will be focusing on during the fall and winter of 2023-2024.
Stay Informed
What You Should Read Next
 https://www.fractracker.org/a5ej20sjfwe/wp-content/uploads/2026/03/Web-Elements-Map-thumbnails-28.png
500
750
Shannon Smith
https://www.fractracker.org/a5ej20sjfwe/wp-content/uploads/2025/09/2025-Wordmark-Logo.png
Shannon Smith2026-06-12 15:27:012026-06-12 15:41:18PA DEP Approves Unusual “Mineral Brine” Well in Erie County, Raising Concerns About New Regulatory Loophole
https://www.fractracker.org/a5ej20sjfwe/wp-content/uploads/2026/03/Web-Elements-Map-thumbnails-28.png
500
750
Shannon Smith
https://www.fractracker.org/a5ej20sjfwe/wp-content/uploads/2025/09/2025-Wordmark-Logo.png
Shannon Smith2026-06-12 15:27:012026-06-12 15:41:18PA DEP Approves Unusual “Mineral Brine” Well in Erie County, Raising Concerns About New Regulatory Loophole https://www.fractracker.org/a5ej20sjfwe/wp-content/uploads/2026/05/Untitled-design.jpg
844
1500
FracTracker Alliance
https://www.fractracker.org/a5ej20sjfwe/wp-content/uploads/2025/09/2025-Wordmark-Logo.png
FracTracker Alliance2026-04-30 17:32:352026-05-28 13:40:18From Coal Plant to AI Campus: FracTracker Documents Construction at Homer City
https://www.fractracker.org/a5ej20sjfwe/wp-content/uploads/2026/05/Untitled-design.jpg
844
1500
FracTracker Alliance
https://www.fractracker.org/a5ej20sjfwe/wp-content/uploads/2025/09/2025-Wordmark-Logo.png
FracTracker Alliance2026-04-30 17:32:352026-05-28 13:40:18From Coal Plant to AI Campus: FracTracker Documents Construction at Homer City https://www.fractracker.org/a5ej20sjfwe/wp-content/uploads/2026/05/3.jpg
628
1200
Gwen Klenke
https://www.fractracker.org/a5ej20sjfwe/wp-content/uploads/2025/09/2025-Wordmark-Logo.png
Gwen Klenke2026-04-29 16:16:562026-05-08 11:24:12An update on Southwest Detroit Industrial Impacts: The Zug Island Ruling
https://www.fractracker.org/a5ej20sjfwe/wp-content/uploads/2026/05/3.jpg
628
1200
Gwen Klenke
https://www.fractracker.org/a5ej20sjfwe/wp-content/uploads/2025/09/2025-Wordmark-Logo.png
Gwen Klenke2026-04-29 16:16:562026-05-08 11:24:12An update on Southwest Detroit Industrial Impacts: The Zug Island Ruling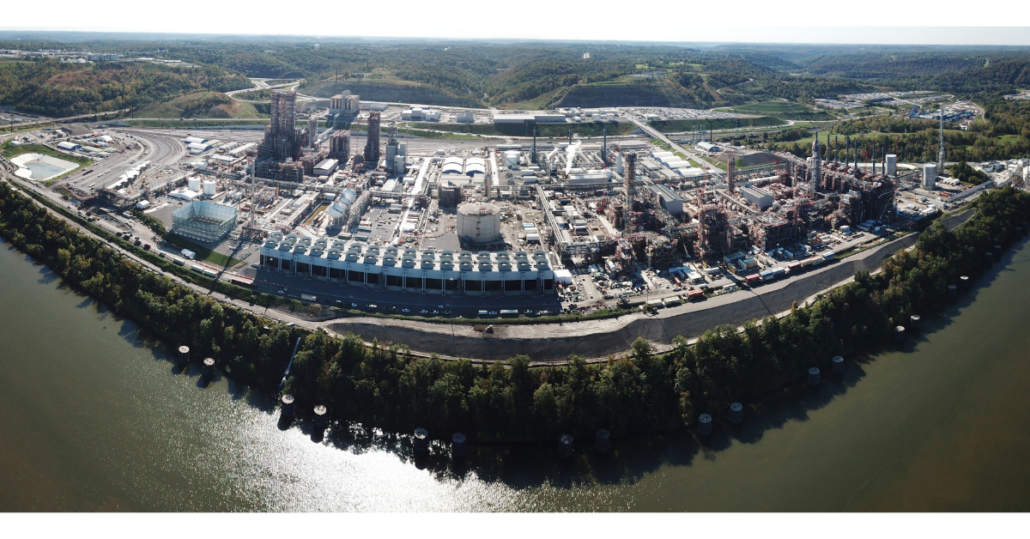 https://www.fractracker.org/a5ej20sjfwe/wp-content/uploads/2026/03/Shell-Polymers-Data-Tool-Graphics.png
628
1200
Guest Author
https://www.fractracker.org/a5ej20sjfwe/wp-content/uploads/2025/09/2025-Wordmark-Logo.png
Guest Author2026-03-26 15:42:172026-04-03 10:35:54FracTracker’s New Data Tool Visualizes Shell’s Pollution, Violations, and Malfunctions Ahead of Permit Public Hearing
https://www.fractracker.org/a5ej20sjfwe/wp-content/uploads/2026/03/Shell-Polymers-Data-Tool-Graphics.png
628
1200
Guest Author
https://www.fractracker.org/a5ej20sjfwe/wp-content/uploads/2025/09/2025-Wordmark-Logo.png
Guest Author2026-03-26 15:42:172026-04-03 10:35:54FracTracker’s New Data Tool Visualizes Shell’s Pollution, Violations, and Malfunctions Ahead of Permit Public Hearing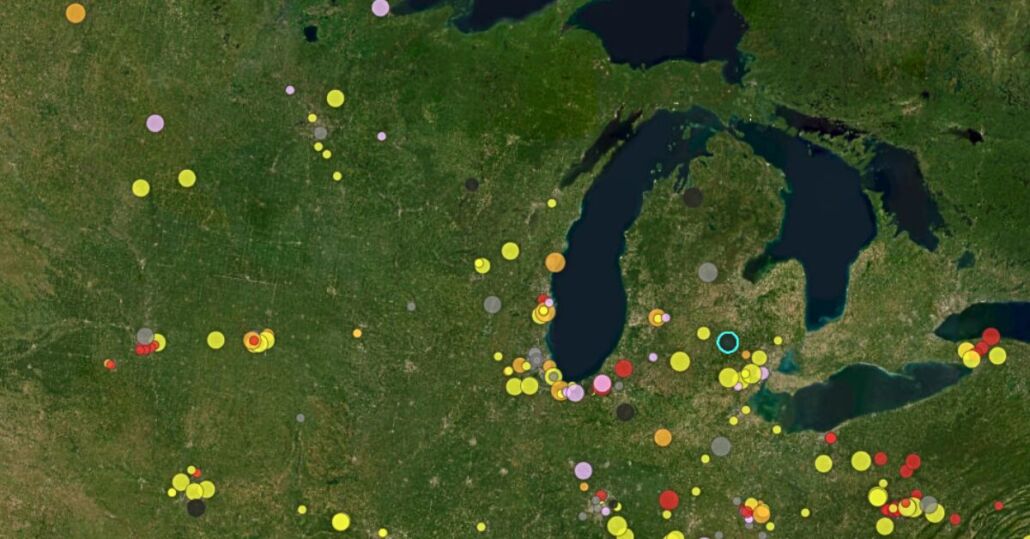 https://www.fractracker.org/a5ej20sjfwe/wp-content/uploads/2026/01/Howell-Township-Win-Article-Graphics.jpg
628
1200
Gwen Klenke
https://www.fractracker.org/a5ej20sjfwe/wp-content/uploads/2025/09/2025-Wordmark-Logo.png
Gwen Klenke2026-01-14 18:33:052026-05-06 18:11:32Howell Township Data Center Win: $1B Project Withdrawn After Community Meeting on Energy and Infrastructure Impacts
https://www.fractracker.org/a5ej20sjfwe/wp-content/uploads/2026/01/Howell-Township-Win-Article-Graphics.jpg
628
1200
Gwen Klenke
https://www.fractracker.org/a5ej20sjfwe/wp-content/uploads/2025/09/2025-Wordmark-Logo.png
Gwen Klenke2026-01-14 18:33:052026-05-06 18:11:32Howell Township Data Center Win: $1B Project Withdrawn After Community Meeting on Energy and Infrastructure Impacts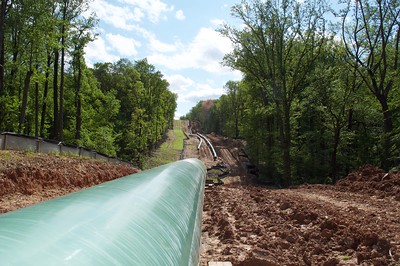 https://www.fractracker.org/a5ej20sjfwe/wp-content/uploads/2021/06/SShamer_Infrastructure-pipeline-rightofway-ColumbiaLineMB-BaltimoreCounty-MD-May2016.jpg
266
400
FracTracker Alliance
https://www.fractracker.org/a5ej20sjfwe/wp-content/uploads/2025/09/2025-Wordmark-Logo.png
FracTracker Alliance2025-09-03 16:14:462025-09-30 10:26:57Comment Opposing the Southeast Supply Enhancement Project (SSEP) – Clean Water Act Section 404 Permit Application (SAW-2024-01961)
https://www.fractracker.org/a5ej20sjfwe/wp-content/uploads/2021/06/SShamer_Infrastructure-pipeline-rightofway-ColumbiaLineMB-BaltimoreCounty-MD-May2016.jpg
266
400
FracTracker Alliance
https://www.fractracker.org/a5ej20sjfwe/wp-content/uploads/2025/09/2025-Wordmark-Logo.png
FracTracker Alliance2025-09-03 16:14:462025-09-30 10:26:57Comment Opposing the Southeast Supply Enhancement Project (SSEP) – Clean Water Act Section 404 Permit Application (SAW-2024-01961) https://www.fractracker.org/a5ej20sjfwe/wp-content/uploads/2021/07/California-oil-fields-feature.jpg
667
1500
Kyle Ferrar, MPH
https://www.fractracker.org/a5ej20sjfwe/wp-content/uploads/2025/09/2025-Wordmark-Logo.png
Kyle Ferrar, MPH2025-08-26 17:36:222025-08-27 21:56:28California’s New Oil Wells Average 13.5 Barrels/Day — Far Below State Projections
https://www.fractracker.org/a5ej20sjfwe/wp-content/uploads/2021/07/California-oil-fields-feature.jpg
667
1500
Kyle Ferrar, MPH
https://www.fractracker.org/a5ej20sjfwe/wp-content/uploads/2025/09/2025-Wordmark-Logo.png
Kyle Ferrar, MPH2025-08-26 17:36:222025-08-27 21:56:28California’s New Oil Wells Average 13.5 Barrels/Day — Far Below State Projections Photo by David Becker
https://www.fractracker.org/a5ej20sjfwe/wp-content/uploads/2025/08/david-becker-crs2vlkSe98-unsplash.jpg
996
1500
FracTracker Alliance
https://www.fractracker.org/a5ej20sjfwe/wp-content/uploads/2025/09/2025-Wordmark-Logo.png
FracTracker Alliance2025-08-22 11:22:272025-08-26 15:47:09FracTracker Launches Oil, Gas, and Petrochemical Data Portals
Photo by David Becker
https://www.fractracker.org/a5ej20sjfwe/wp-content/uploads/2025/08/david-becker-crs2vlkSe98-unsplash.jpg
996
1500
FracTracker Alliance
https://www.fractracker.org/a5ej20sjfwe/wp-content/uploads/2025/09/2025-Wordmark-Logo.png
FracTracker Alliance2025-08-22 11:22:272025-08-26 15:47:09FracTracker Launches Oil, Gas, and Petrochemical Data Portals https://www.fractracker.org/a5ej20sjfwe/wp-content/uploads/2013/12/Colorado.jpg
642
1144
FracTracker Alliance
https://www.fractracker.org/a5ej20sjfwe/wp-content/uploads/2025/09/2025-Wordmark-Logo.png
FracTracker Alliance2025-07-22 10:42:552025-07-23 11:06:23Colorado Operators Increase Chemical Disclosures After Public Pressure, but Major Gaps Remain
https://www.fractracker.org/a5ej20sjfwe/wp-content/uploads/2013/12/Colorado.jpg
642
1144
FracTracker Alliance
https://www.fractracker.org/a5ej20sjfwe/wp-content/uploads/2025/09/2025-Wordmark-Logo.png
FracTracker Alliance2025-07-22 10:42:552025-07-23 11:06:23Colorado Operators Increase Chemical Disclosures After Public Pressure, but Major Gaps Remain https://www.fractracker.org/a5ej20sjfwe/wp-content/uploads/2025/07/Missouri-Oil-and-Gas-Wells-2025.jpg
921
1500
Kyle Ferrar, MPH
https://www.fractracker.org/a5ej20sjfwe/wp-content/uploads/2025/09/2025-Wordmark-Logo.png
Kyle Ferrar, MPH2025-07-21 19:15:592025-07-22 10:08:23Evaluation of Federal Requirements for Plugging Orphaned Oil and Gas Wells: A Missouri Case Study
https://www.fractracker.org/a5ej20sjfwe/wp-content/uploads/2025/07/Missouri-Oil-and-Gas-Wells-2025.jpg
921
1500
Kyle Ferrar, MPH
https://www.fractracker.org/a5ej20sjfwe/wp-content/uploads/2025/09/2025-Wordmark-Logo.png
Kyle Ferrar, MPH2025-07-21 19:15:592025-07-22 10:08:23Evaluation of Federal Requirements for Plugging Orphaned Oil and Gas Wells: A Missouri Case Study https://www.fractracker.org/a5ej20sjfwe/wp-content/uploads/2019/03/IdleWellsHathaway_resize.jpg
400
900
FracTracker Alliance
https://www.fractracker.org/a5ej20sjfwe/wp-content/uploads/2025/09/2025-Wordmark-Logo.png
FracTracker Alliance2025-07-03 13:40:552025-07-03 15:42:15Methane Matters, but Make Polluters Pay: FracTracker’s Response to Carl Pope
https://www.fractracker.org/a5ej20sjfwe/wp-content/uploads/2019/03/IdleWellsHathaway_resize.jpg
400
900
FracTracker Alliance
https://www.fractracker.org/a5ej20sjfwe/wp-content/uploads/2025/09/2025-Wordmark-Logo.png
FracTracker Alliance2025-07-03 13:40:552025-07-03 15:42:15Methane Matters, but Make Polluters Pay: FracTracker’s Response to Carl Pope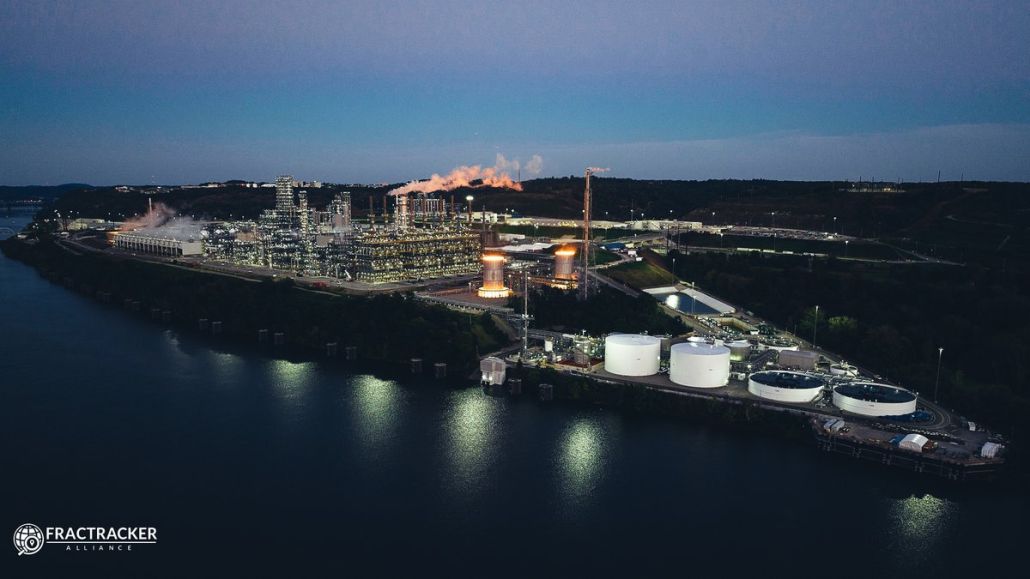 https://www.fractracker.org/a5ej20sjfwe/wp-content/uploads/2022/11/Fhn3YgeXkAI0QiX.jpg
675
1200
Katie Jones
https://www.fractracker.org/a5ej20sjfwe/wp-content/uploads/2025/09/2025-Wordmark-Logo.png
Katie Jones2025-07-03 13:22:502026-01-14 17:55:32Shell Polymers Monaca: 17.9 Billion Pounds of Emissions and Repeated Violations in Pennsylvania
https://www.fractracker.org/a5ej20sjfwe/wp-content/uploads/2022/11/Fhn3YgeXkAI0QiX.jpg
675
1200
Katie Jones
https://www.fractracker.org/a5ej20sjfwe/wp-content/uploads/2025/09/2025-Wordmark-Logo.png
Katie Jones2025-07-03 13:22:502026-01-14 17:55:32Shell Polymers Monaca: 17.9 Billion Pounds of Emissions and Repeated Violations in Pennsylvania https://www.fractracker.org/a5ej20sjfwe/wp-content/uploads/2016/07/DSC_0266_LowRes.jpg
3000
4496
FracTracker Alliance
https://www.fractracker.org/a5ej20sjfwe/wp-content/uploads/2025/09/2025-Wordmark-Logo.png
FracTracker Alliance2025-06-30 14:48:532025-07-03 13:47:59Plum Borough Rejects Fracking Waste Injection Well After Public Pushback
https://www.fractracker.org/a5ej20sjfwe/wp-content/uploads/2016/07/DSC_0266_LowRes.jpg
3000
4496
FracTracker Alliance
https://www.fractracker.org/a5ej20sjfwe/wp-content/uploads/2025/09/2025-Wordmark-Logo.png
FracTracker Alliance2025-06-30 14:48:532025-07-03 13:47:59Plum Borough Rejects Fracking Waste Injection Well After Public Pushback https://www.fractracker.org/a5ej20sjfwe/wp-content/uploads/2025/05/51382261216_f8af819a45_o.jpg
1125
1500
Guest Author
https://www.fractracker.org/a5ej20sjfwe/wp-content/uploads/2025/09/2025-Wordmark-Logo.png
Guest Author2025-05-31 12:00:592026-03-13 12:05:07Power Plant Locations and Unemployment Rates
https://www.fractracker.org/a5ej20sjfwe/wp-content/uploads/2025/05/51382261216_f8af819a45_o.jpg
1125
1500
Guest Author
https://www.fractracker.org/a5ej20sjfwe/wp-content/uploads/2025/09/2025-Wordmark-Logo.png
Guest Author2025-05-31 12:00:592026-03-13 12:05:07Power Plant Locations and Unemployment Rates https://www.fractracker.org/a5ej20sjfwe/wp-content/uploads/2021/04/49770601811_6cc7e18996_k.jpg
716
1500
Matt Kelso, BA
https://www.fractracker.org/a5ej20sjfwe/wp-content/uploads/2025/09/2025-Wordmark-Logo.png
Matt Kelso, BA2025-04-07 15:42:272025-04-07 15:42:27Pipeline Incidents Are a Daily Occurrence
https://www.fractracker.org/a5ej20sjfwe/wp-content/uploads/2021/04/49770601811_6cc7e18996_k.jpg
716
1500
Matt Kelso, BA
https://www.fractracker.org/a5ej20sjfwe/wp-content/uploads/2025/09/2025-Wordmark-Logo.png
Matt Kelso, BA2025-04-07 15:42:272025-04-07 15:42:27Pipeline Incidents Are a Daily Occurrence https://www.fractracker.org/a5ej20sjfwe/wp-content/uploads/2021/02/Los-Angeles-skyline-feature-scaled.jpg
667
1500
Kyle Ferrar, MPH
https://www.fractracker.org/a5ej20sjfwe/wp-content/uploads/2025/09/2025-Wordmark-Logo.png
Kyle Ferrar, MPH2025-03-27 15:37:102025-04-01 12:55:42Environmental Justice Analysis of Oil Extraction in Los Angeles Communities
https://www.fractracker.org/a5ej20sjfwe/wp-content/uploads/2021/02/Los-Angeles-skyline-feature-scaled.jpg
667
1500
Kyle Ferrar, MPH
https://www.fractracker.org/a5ej20sjfwe/wp-content/uploads/2025/09/2025-Wordmark-Logo.png
Kyle Ferrar, MPH2025-03-27 15:37:102025-04-01 12:55:42Environmental Justice Analysis of Oil Extraction in Los Angeles Communities https://www.fractracker.org/a5ej20sjfwe/wp-content/uploads/2025/03/3_TAuch_Infrastructure-FrackPad-SouthwestPA_April2019.jpg
830
1500
Katie Jones
https://www.fractracker.org/a5ej20sjfwe/wp-content/uploads/2025/09/2025-Wordmark-Logo.png
Katie Jones2025-03-26 14:05:222025-04-01 12:29:01How Increased Protective Buffer Zones Could Help Protect 3.6 million Pennsylvanians
https://www.fractracker.org/a5ej20sjfwe/wp-content/uploads/2025/03/3_TAuch_Infrastructure-FrackPad-SouthwestPA_April2019.jpg
830
1500
Katie Jones
https://www.fractracker.org/a5ej20sjfwe/wp-content/uploads/2025/09/2025-Wordmark-Logo.png
Katie Jones2025-03-26 14:05:222025-04-01 12:29:01How Increased Protective Buffer Zones Could Help Protect 3.6 million Pennsylvanians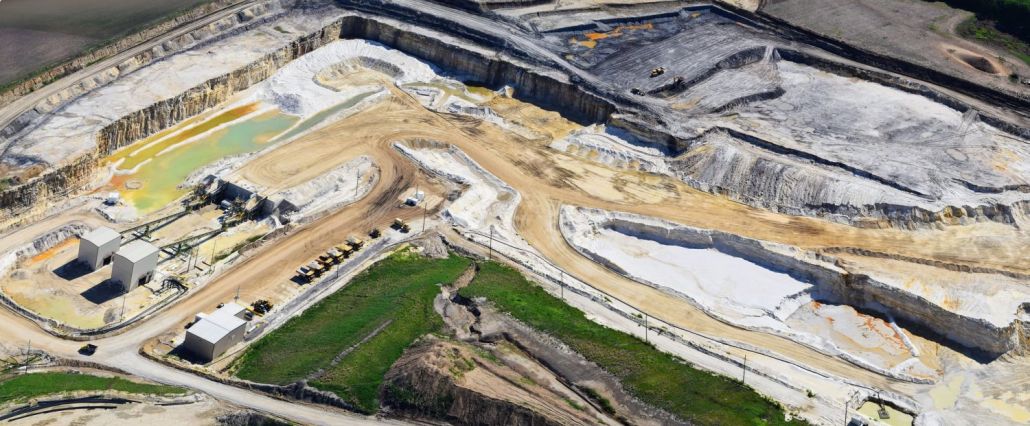 https://www.fractracker.org/a5ej20sjfwe/wp-content/uploads/2025/02/49727923413_5d7b7335a0_k.jpg
621
1500
Guest Author
https://www.fractracker.org/a5ej20sjfwe/wp-content/uploads/2025/09/2025-Wordmark-Logo.png
Guest Author2025-01-31 14:52:292025-02-03 15:59:13Regulatory Gaps and Resistance: The Battle Over Fracking in Southern Illinois
https://www.fractracker.org/a5ej20sjfwe/wp-content/uploads/2025/02/49727923413_5d7b7335a0_k.jpg
621
1500
Guest Author
https://www.fractracker.org/a5ej20sjfwe/wp-content/uploads/2025/09/2025-Wordmark-Logo.png
Guest Author2025-01-31 14:52:292025-02-03 15:59:13Regulatory Gaps and Resistance: The Battle Over Fracking in Southern Illinois https://www.fractracker.org/a5ej20sjfwe/wp-content/uploads/2025/02/1400669_062416-kabc-cuffe-erskine1-imgcrtr.jpg
720
1280
FracTracker Alliance
https://www.fractracker.org/a5ej20sjfwe/wp-content/uploads/2025/09/2025-Wordmark-Logo.png
FracTracker Alliance2025-01-31 12:07:132025-02-06 14:11:38Can California Energy Policy Move Past its Contradictions?
https://www.fractracker.org/a5ej20sjfwe/wp-content/uploads/2025/02/1400669_062416-kabc-cuffe-erskine1-imgcrtr.jpg
720
1280
FracTracker Alliance
https://www.fractracker.org/a5ej20sjfwe/wp-content/uploads/2025/09/2025-Wordmark-Logo.png
FracTracker Alliance2025-01-31 12:07:132025-02-06 14:11:38Can California Energy Policy Move Past its Contradictions?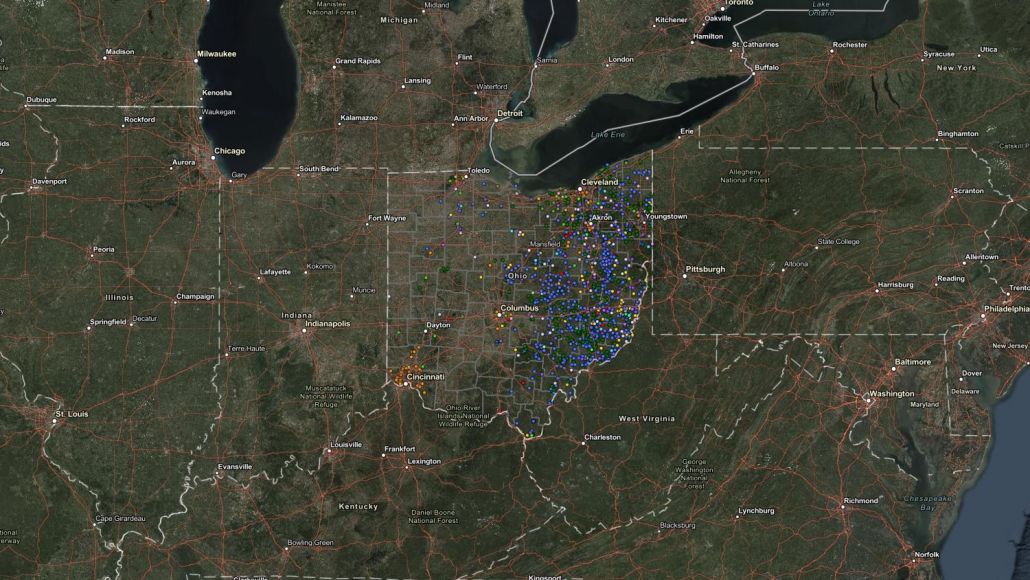 FracTracker Alliance, 2024
https://www.fractracker.org/a5ej20sjfwe/wp-content/uploads/2024/03/ODNR-Oil-and-Gas-Incidents-2018-2023.jpg
844
1500
Gwen Klenke
https://www.fractracker.org/a5ej20sjfwe/wp-content/uploads/2025/09/2025-Wordmark-Logo.png
Gwen Klenke2025-01-06 11:47:452025-01-06 14:49:36Data Gaps: A Critical Examination of Oil and Gas Well Incidents in Ohio
FracTracker Alliance, 2024
https://www.fractracker.org/a5ej20sjfwe/wp-content/uploads/2024/03/ODNR-Oil-and-Gas-Incidents-2018-2023.jpg
844
1500
Gwen Klenke
https://www.fractracker.org/a5ej20sjfwe/wp-content/uploads/2025/09/2025-Wordmark-Logo.png
Gwen Klenke2025-01-06 11:47:452025-01-06 14:49:36Data Gaps: A Critical Examination of Oil and Gas Well Incidents in Ohio Great Plains Action Society
https://www.fractracker.org/a5ej20sjfwe/wp-content/uploads/2024/10/No-CO2-Ppelines-Sioux-City.jpg
672
1012
Gwen Klenke
https://www.fractracker.org/a5ej20sjfwe/wp-content/uploads/2025/09/2025-Wordmark-Logo.png
Gwen Klenke2024-10-22 11:55:082024-10-25 12:10:00Indigenous Communities’ Fight Against CO2 Pipelines in the Great Plains
Great Plains Action Society
https://www.fractracker.org/a5ej20sjfwe/wp-content/uploads/2024/10/No-CO2-Ppelines-Sioux-City.jpg
672
1012
Gwen Klenke
https://www.fractracker.org/a5ej20sjfwe/wp-content/uploads/2025/09/2025-Wordmark-Logo.png
Gwen Klenke2024-10-22 11:55:082024-10-25 12:10:00Indigenous Communities’ Fight Against CO2 Pipelines in the Great Plains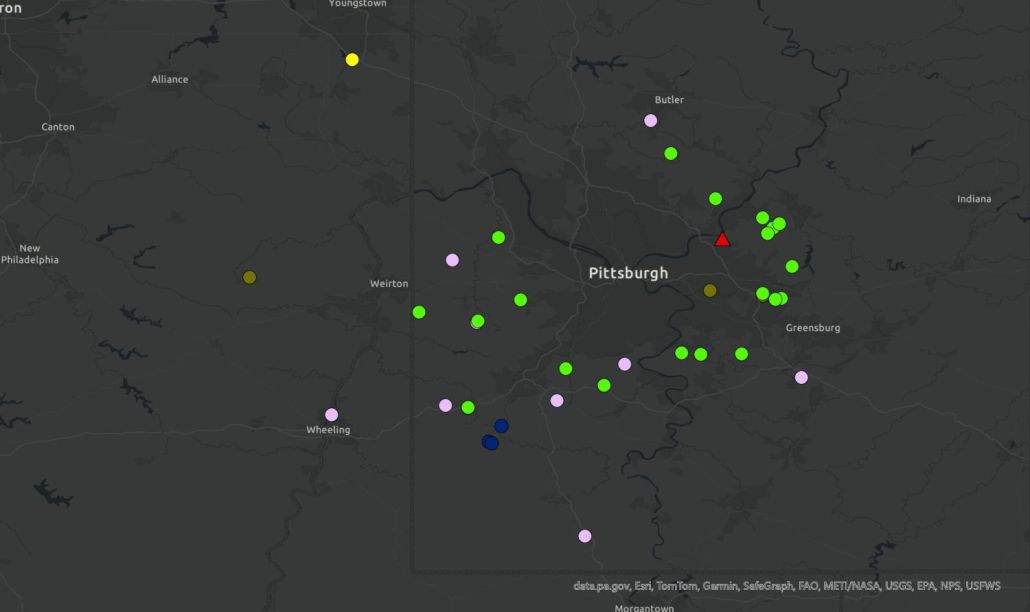 https://www.fractracker.org/a5ej20sjfwe/wp-content/uploads/2024/08/Midas6M_RecvFacil_042024_Header.jpg
891
1500
Matt Kelso, BA
https://www.fractracker.org/a5ej20sjfwe/wp-content/uploads/2025/09/2025-Wordmark-Logo.png
Matt Kelso, BA2024-08-01 20:41:312024-08-02 17:55:17Pennsylvania Oil and Gas Industry Trends: Drilled Wells, Violations, Production, and Waste
https://www.fractracker.org/a5ej20sjfwe/wp-content/uploads/2024/08/Midas6M_RecvFacil_042024_Header.jpg
891
1500
Matt Kelso, BA
https://www.fractracker.org/a5ej20sjfwe/wp-content/uploads/2025/09/2025-Wordmark-Logo.png
Matt Kelso, BA2024-08-01 20:41:312024-08-02 17:55:17Pennsylvania Oil and Gas Industry Trends: Drilled Wells, Violations, Production, and Waste https://www.fractracker.org/a5ej20sjfwe/wp-content/uploads/2024/06/Hydrogen-molecule-feature.jpg
844
1500
FracTracker Alliance
https://www.fractracker.org/a5ej20sjfwe/wp-content/uploads/2025/09/2025-Wordmark-Logo.png
FracTracker Alliance2024-06-05 17:41:582024-06-06 09:18:40A Closer Look at Risks of the Appalachian Hydrogen Hub
https://www.fractracker.org/a5ej20sjfwe/wp-content/uploads/2024/06/Hydrogen-molecule-feature.jpg
844
1500
FracTracker Alliance
https://www.fractracker.org/a5ej20sjfwe/wp-content/uploads/2025/09/2025-Wordmark-Logo.png
FracTracker Alliance2024-06-05 17:41:582024-06-06 09:18:40A Closer Look at Risks of the Appalachian Hydrogen Hub FracTracker Alliance, 2024
https://www.fractracker.org/a5ej20sjfwe/wp-content/uploads/2024/06/Falcon-Pipeline-Violations-2024.jpg
844
1500
Katie Jones
https://www.fractracker.org/a5ej20sjfwe/wp-content/uploads/2025/09/2025-Wordmark-Logo.png
Katie Jones2024-06-05 10:35:022024-06-05 11:36:30Falcon Pipeline Criminal Charges Explained
FracTracker Alliance, 2024
https://www.fractracker.org/a5ej20sjfwe/wp-content/uploads/2024/06/Falcon-Pipeline-Violations-2024.jpg
844
1500
Katie Jones
https://www.fractracker.org/a5ej20sjfwe/wp-content/uploads/2025/09/2025-Wordmark-Logo.png
Katie Jones2024-06-05 10:35:022024-06-05 11:36:30Falcon Pipeline Criminal Charges Explained https://www.fractracker.org/a5ej20sjfwe/wp-content/uploads/2016/10/Nix-Pix-050.jpg
3088
4629
FracTracker Alliance
https://www.fractracker.org/a5ej20sjfwe/wp-content/uploads/2025/09/2025-Wordmark-Logo.png
FracTracker Alliance2024-06-04 16:34:592025-05-02 14:53:36The Importance of Surveying Rural Landowners in North Dakota on Fracking
https://www.fractracker.org/a5ej20sjfwe/wp-content/uploads/2016/10/Nix-Pix-050.jpg
3088
4629
FracTracker Alliance
https://www.fractracker.org/a5ej20sjfwe/wp-content/uploads/2025/09/2025-Wordmark-Logo.png
FracTracker Alliance2024-06-04 16:34:592025-05-02 14:53:36The Importance of Surveying Rural Landowners in North Dakota on Fracking https://www.fractracker.org/a5ej20sjfwe/wp-content/uploads/2016/04/Mount-Carbon-WV-Large.jpg
1429
1888
Ted Auch, PhD
https://www.fractracker.org/a5ej20sjfwe/wp-content/uploads/2025/09/2025-Wordmark-Logo.png
Ted Auch, PhD2024-06-04 14:18:082024-06-04 16:39:12Exploring the Fallout of Precision Scheduled Rail: A Rail Worker’s Perspective on Precision Scheduled Rail
https://www.fractracker.org/a5ej20sjfwe/wp-content/uploads/2016/04/Mount-Carbon-WV-Large.jpg
1429
1888
Ted Auch, PhD
https://www.fractracker.org/a5ej20sjfwe/wp-content/uploads/2025/09/2025-Wordmark-Logo.png
Ted Auch, PhD2024-06-04 14:18:082024-06-04 16:39:12Exploring the Fallout of Precision Scheduled Rail: A Rail Worker’s Perspective on Precision Scheduled Rail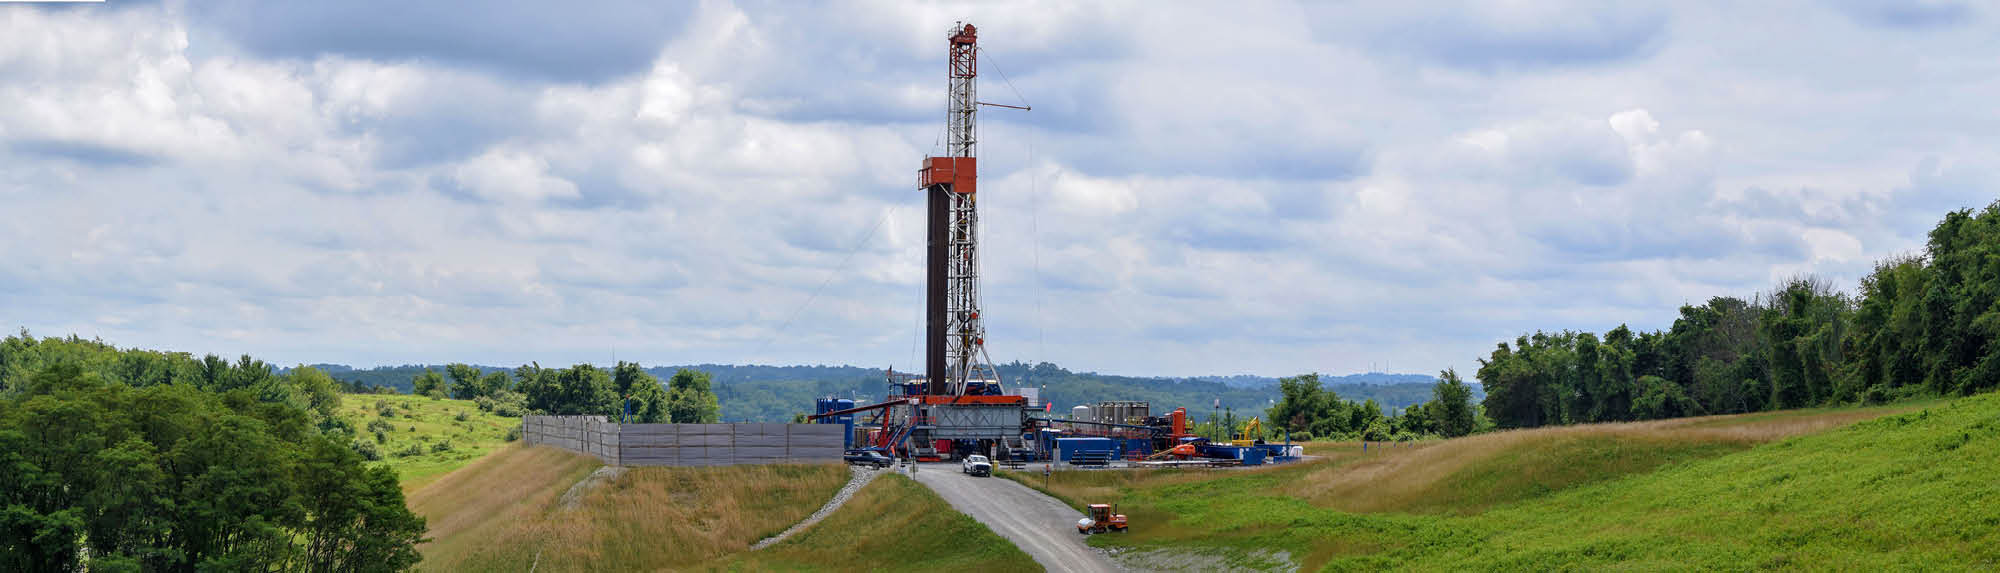 https://www.fractracker.org/a5ej20sjfwe/wp-content/uploads/2019/12/Drilling-rig-in-Washington-County-Pennsylvania.jpg
573
2000
Katie Jones
https://www.fractracker.org/a5ej20sjfwe/wp-content/uploads/2025/09/2025-Wordmark-Logo.png
Katie Jones2024-05-02 15:54:282025-05-21 12:33:41Not-So-Radical Transparency: An Ineffective and Unnecessary Partnership Between Pennsylvania Governor Shapiro and the Gas Company CNX
https://www.fractracker.org/a5ej20sjfwe/wp-content/uploads/2019/03/IdleWellsHathaway_resize.jpg
400
900
Kyle Ferrar, MPH
https://www.fractracker.org/a5ej20sjfwe/wp-content/uploads/2025/09/2025-Wordmark-Logo.png
Kyle Ferrar, MPH2024-05-02 10:32:552024-05-02 12:43:28California Must Improve Management of Idle Wells
https://www.fractracker.org/a5ej20sjfwe/wp-content/uploads/2019/12/Drilling-rig-in-Washington-County-Pennsylvania.jpg
573
2000
Katie Jones
https://www.fractracker.org/a5ej20sjfwe/wp-content/uploads/2025/09/2025-Wordmark-Logo.png
Katie Jones2024-05-02 15:54:282025-05-21 12:33:41Not-So-Radical Transparency: An Ineffective and Unnecessary Partnership Between Pennsylvania Governor Shapiro and the Gas Company CNX
https://www.fractracker.org/a5ej20sjfwe/wp-content/uploads/2019/03/IdleWellsHathaway_resize.jpg
400
900
Kyle Ferrar, MPH
https://www.fractracker.org/a5ej20sjfwe/wp-content/uploads/2025/09/2025-Wordmark-Logo.png
Kyle Ferrar, MPH2024-05-02 10:32:552024-05-02 12:43:28California Must Improve Management of Idle Wells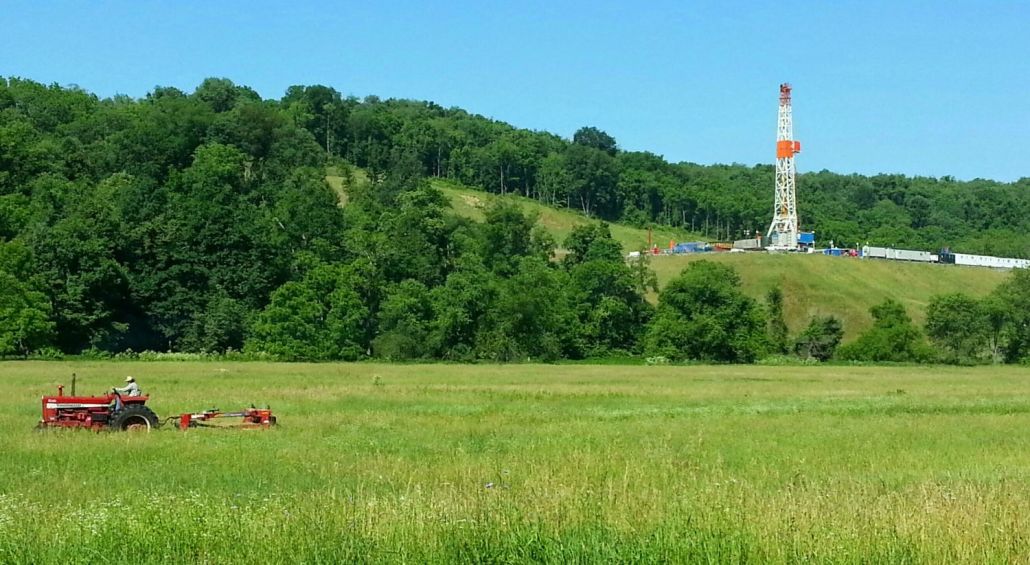 https://www.fractracker.org/a5ej20sjfwe/wp-content/uploads/2023/10/gilooly-farmer-pa-2013.jpg
823
1500
Guest Author
https://www.fractracker.org/a5ej20sjfwe/wp-content/uploads/2025/09/2025-Wordmark-Logo.png
Guest Author2024-04-26 11:34:082024-04-29 09:39:15Holes in FracFocus
https://www.fractracker.org/a5ej20sjfwe/wp-content/uploads/2023/10/gilooly-farmer-pa-2013.jpg
823
1500
Guest Author
https://www.fractracker.org/a5ej20sjfwe/wp-content/uploads/2025/09/2025-Wordmark-Logo.png
Guest Author2024-04-26 11:34:082024-04-29 09:39:15Holes in FracFocus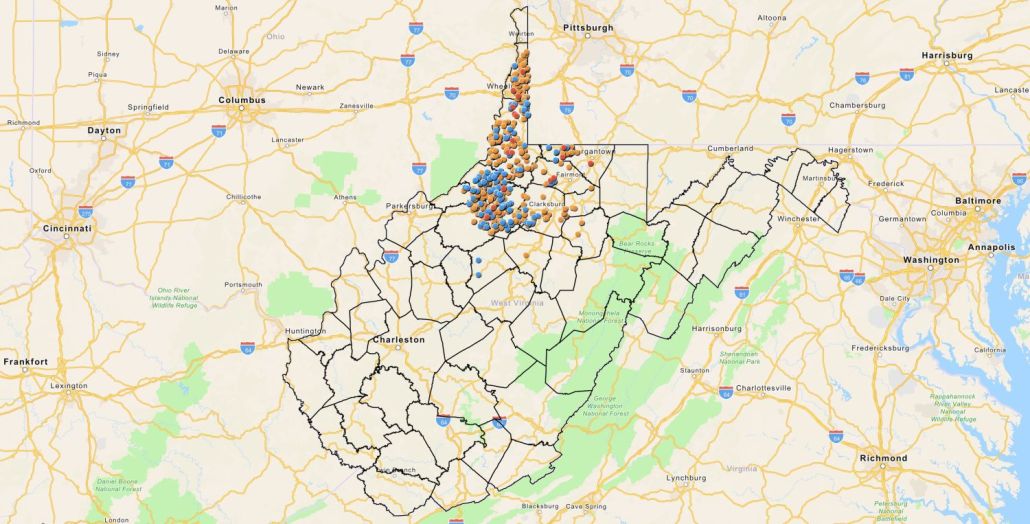 FracTracker Alliance, 2024
https://www.fractracker.org/a5ej20sjfwe/wp-content/uploads/2024/03/WV-PFAS-Map.jpeg
763
1500
Matt Kelso, BA
https://www.fractracker.org/a5ej20sjfwe/wp-content/uploads/2025/09/2025-Wordmark-Logo.png
Matt Kelso, BA2024-03-29 15:06:512024-03-29 15:42:29Mapping PFAS Chemicals Used in Fracking Operations in West Virginia
FracTracker Alliance, 2024
https://www.fractracker.org/a5ej20sjfwe/wp-content/uploads/2024/03/WV-PFAS-Map.jpeg
763
1500
Matt Kelso, BA
https://www.fractracker.org/a5ej20sjfwe/wp-content/uploads/2025/09/2025-Wordmark-Logo.png
Matt Kelso, BA2024-03-29 15:06:512024-03-29 15:42:29Mapping PFAS Chemicals Used in Fracking Operations in West Virginia https://www.fractracker.org/a5ej20sjfwe/wp-content/uploads/2020/04/California-well-pad.jpg
666
1500
FracTracker Alliance
https://www.fractracker.org/a5ej20sjfwe/wp-content/uploads/2025/09/2025-Wordmark-Logo.png
FracTracker Alliance2024-03-07 17:01:582024-03-12 09:55:39Chevron’s $2.3 Billion Asset Adjustment Raises Questions Amidst Regulatory Changes in California
https://www.fractracker.org/a5ej20sjfwe/wp-content/uploads/2020/04/California-well-pad.jpg
666
1500
FracTracker Alliance
https://www.fractracker.org/a5ej20sjfwe/wp-content/uploads/2025/09/2025-Wordmark-Logo.png
FracTracker Alliance2024-03-07 17:01:582024-03-12 09:55:39Chevron’s $2.3 Billion Asset Adjustment Raises Questions Amidst Regulatory Changes in California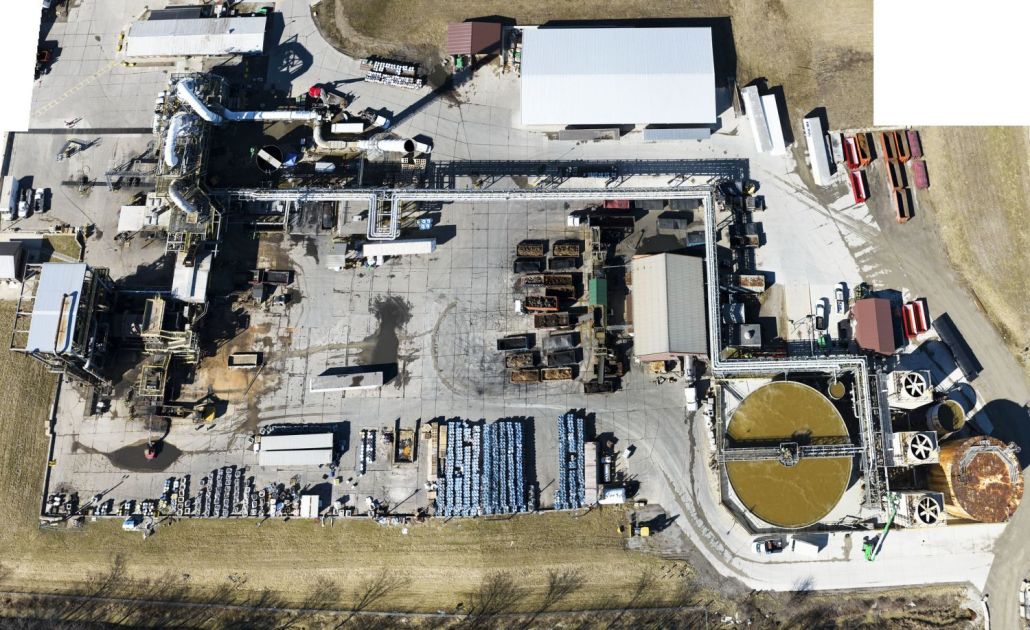 Ross incinerator in Eaton Township. Photo by Ted Auch, FracTracker Alliance, 2023
https://www.fractracker.org/a5ej20sjfwe/wp-content/uploads/2024/02/52748252528_19364d2943_k.jpg
918
1500
Guest Author
https://www.fractracker.org/a5ej20sjfwe/wp-content/uploads/2025/09/2025-Wordmark-Logo.png
Guest Author2024-02-07 21:56:582024-02-09 13:47:09Stop Toxic Threat: A Heavy Industrial Zoning Battle
Ross incinerator in Eaton Township. Photo by Ted Auch, FracTracker Alliance, 2023
https://www.fractracker.org/a5ej20sjfwe/wp-content/uploads/2024/02/52748252528_19364d2943_k.jpg
918
1500
Guest Author
https://www.fractracker.org/a5ej20sjfwe/wp-content/uploads/2025/09/2025-Wordmark-Logo.png
Guest Author2024-02-07 21:56:582024-02-09 13:47:09Stop Toxic Threat: A Heavy Industrial Zoning Battle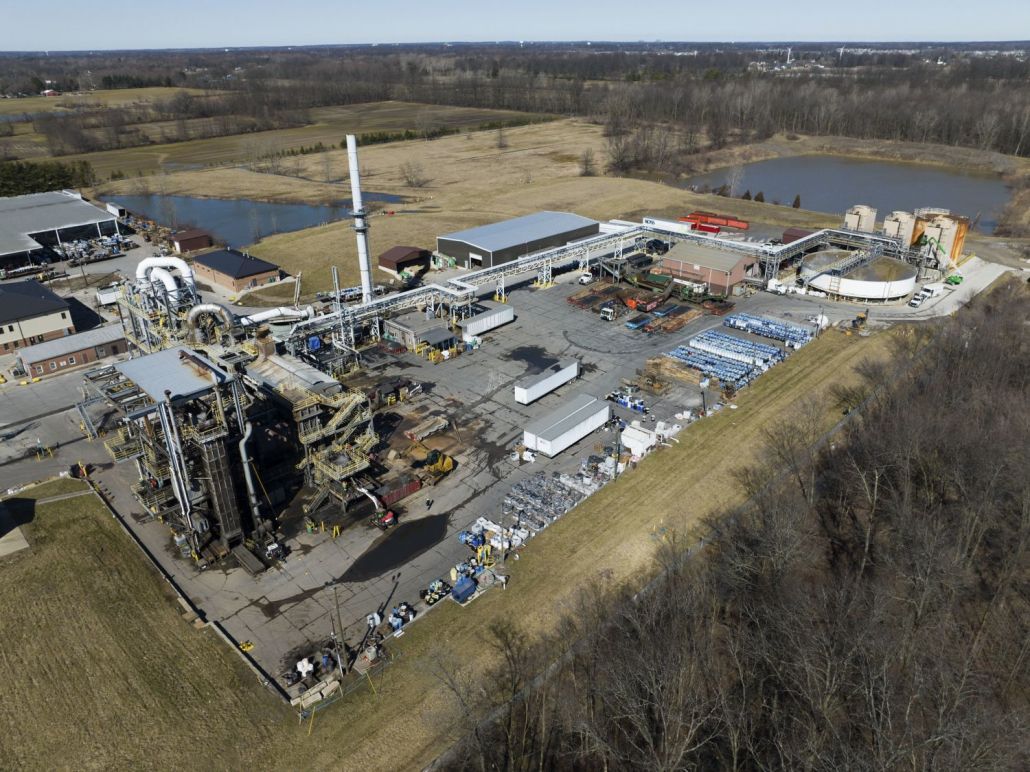 Ross Environmental Hazardous Waste Incinerator in Eaton Township, Ohio. Ted Auch, FracTracker Alliance, 2023
https://www.fractracker.org/a5ej20sjfwe/wp-content/uploads/2024/02/52747231757_2834f8bd30_k.jpg
1124
1500
Guest Author
https://www.fractracker.org/a5ej20sjfwe/wp-content/uploads/2025/09/2025-Wordmark-Logo.png
Guest Author2024-02-01 22:00:352024-02-09 13:45:10East Palestine Warning: The Growing Threat From Hazardous Waste Storage
Ross Environmental Hazardous Waste Incinerator in Eaton Township, Ohio. Ted Auch, FracTracker Alliance, 2023
https://www.fractracker.org/a5ej20sjfwe/wp-content/uploads/2024/02/52747231757_2834f8bd30_k.jpg
1124
1500
Guest Author
https://www.fractracker.org/a5ej20sjfwe/wp-content/uploads/2025/09/2025-Wordmark-Logo.png
Guest Author2024-02-01 22:00:352024-02-09 13:45:10East Palestine Warning: The Growing Threat From Hazardous Waste Storage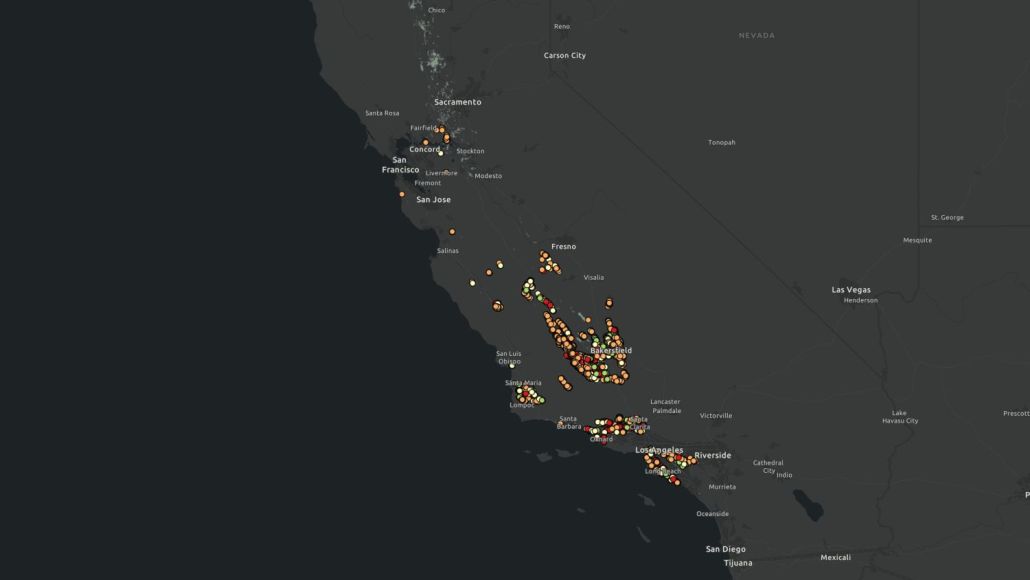 FracTracker Alliance, 2024
https://www.fractracker.org/a5ej20sjfwe/wp-content/uploads/2024/01/California-Daily-Oil-Production-2024.jpg
844
1500
Kyle Ferrar, MPH
https://www.fractracker.org/a5ej20sjfwe/wp-content/uploads/2025/09/2025-Wordmark-Logo.png
Kyle Ferrar, MPH2024-01-30 05:00:012024-02-05 13:46:42Index of Oil and Gas Operator Health in California Shows Risks to State Economy and Taxpayers
FracTracker Alliance, 2024
https://www.fractracker.org/a5ej20sjfwe/wp-content/uploads/2024/01/California-Daily-Oil-Production-2024.jpg
844
1500
Kyle Ferrar, MPH
https://www.fractracker.org/a5ej20sjfwe/wp-content/uploads/2025/09/2025-Wordmark-Logo.png
Kyle Ferrar, MPH2024-01-30 05:00:012024-02-05 13:46:42Index of Oil and Gas Operator Health in California Shows Risks to State Economy and Taxpayers The cottage along Slope Creek, months after being vacated due to health concerns caused by nearby oil and gas operations. Photo courtesy of Chloe Mankin
https://www.fractracker.org/a5ej20sjfwe/wp-content/uploads/2024/01/slopecreek2018.jpg
845
1500
Chloe Mankin
https://www.fractracker.org/a5ej20sjfwe/wp-content/uploads/2025/09/2025-Wordmark-Logo.png
Chloe Mankin2024-01-12 12:51:302024-01-12 16:32:21Calling for Change: Life on the Fracking Frontlines
The cottage along Slope Creek, months after being vacated due to health concerns caused by nearby oil and gas operations. Photo courtesy of Chloe Mankin
https://www.fractracker.org/a5ej20sjfwe/wp-content/uploads/2024/01/slopecreek2018.jpg
845
1500
Chloe Mankin
https://www.fractracker.org/a5ej20sjfwe/wp-content/uploads/2025/09/2025-Wordmark-Logo.png
Chloe Mankin2024-01-12 12:51:302024-01-12 16:32:21Calling for Change: Life on the Fracking Frontlines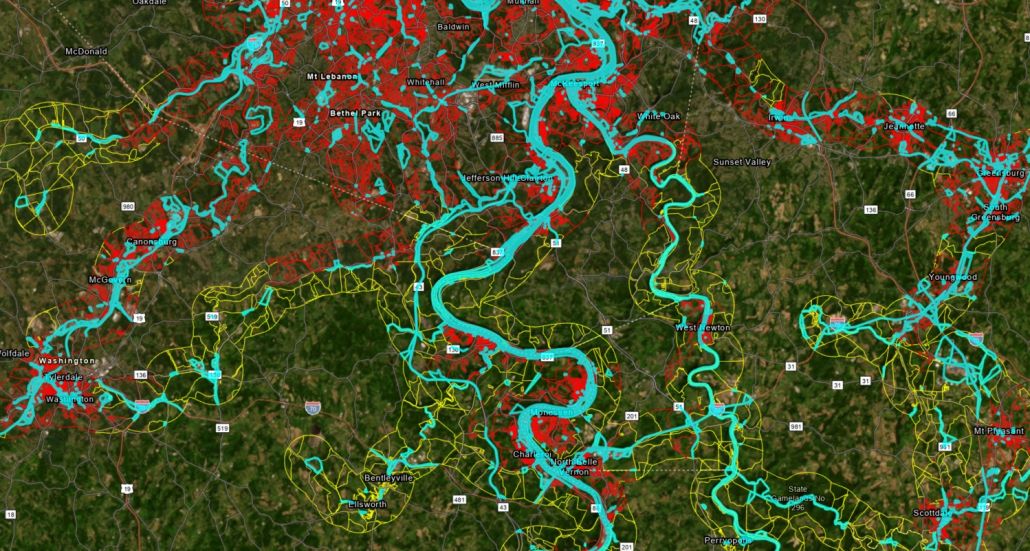 https://www.fractracker.org/a5ej20sjfwe/wp-content/uploads/2023/12/Figure-6-Rail-Population.jpg
801
1498
Matt Kelso, BA
https://www.fractracker.org/a5ej20sjfwe/wp-content/uploads/2025/09/2025-Wordmark-Logo.png
Matt Kelso, BA2023-12-14 16:26:372023-12-15 11:47:53On the Wrong Track: Risks to Residents of the Upper Ohio River Valley From Railroad Incidents
https://www.fractracker.org/a5ej20sjfwe/wp-content/uploads/2023/12/Figure-6-Rail-Population.jpg
801
1498
Matt Kelso, BA
https://www.fractracker.org/a5ej20sjfwe/wp-content/uploads/2025/09/2025-Wordmark-Logo.png
Matt Kelso, BA2023-12-14 16:26:372023-12-15 11:47:53On the Wrong Track: Risks to Residents of the Upper Ohio River Valley From Railroad Incidents Matt Kelso, FracTracker Alliance, 2023
https://www.fractracker.org/a5ej20sjfwe/wp-content/uploads/2023/11/DSCN1328.jpg
1125
1500
Matt Kelso, BA
https://www.fractracker.org/a5ej20sjfwe/wp-content/uploads/2025/09/2025-Wordmark-Logo.png
Matt Kelso, BA2023-11-16 13:25:082025-03-06 15:39:23Digital Atlas: Exploring Nature and Industry in the Raccoon Creek Watershed
Matt Kelso, FracTracker Alliance, 2023
https://www.fractracker.org/a5ej20sjfwe/wp-content/uploads/2023/11/DSCN1328.jpg
1125
1500
Matt Kelso, BA
https://www.fractracker.org/a5ej20sjfwe/wp-content/uploads/2025/09/2025-Wordmark-Logo.png
Matt Kelso, BA2023-11-16 13:25:082025-03-06 15:39:23Digital Atlas: Exploring Nature and Industry in the Raccoon Creek Watershed https://www.fractracker.org/a5ej20sjfwe/wp-content/uploads/2023/10/RusticRidge_102023.jpg
1119
1500
Matt Kelso, BA
https://www.fractracker.org/a5ej20sjfwe/wp-content/uploads/2025/09/2025-Wordmark-Logo.png
Matt Kelso, BA2023-11-09 19:01:252025-08-12 13:45:14Why Do Houses Keep Exploding in One Pennsylvania Suburb?
https://www.fractracker.org/a5ej20sjfwe/wp-content/uploads/2023/10/RusticRidge_102023.jpg
1119
1500
Matt Kelso, BA
https://www.fractracker.org/a5ej20sjfwe/wp-content/uploads/2025/09/2025-Wordmark-Logo.png
Matt Kelso, BA2023-11-09 19:01:252025-08-12 13:45:14Why Do Houses Keep Exploding in One Pennsylvania Suburb? https://www.fractracker.org/a5ej20sjfwe/wp-content/uploads/2023/10/Wells-Within-3200-Feet-of-Schools-Childcare-CA.jpg
595
1500
Kyle Ferrar, MPH
https://www.fractracker.org/a5ej20sjfwe/wp-content/uploads/2025/09/2025-Wordmark-Logo.png
Kyle Ferrar, MPH2023-10-04 16:38:472023-10-04 21:19:54Oil and Gas Activity Within California Public Health Protection Zones
https://www.fractracker.org/a5ej20sjfwe/wp-content/uploads/2023/10/Wells-Within-3200-Feet-of-Schools-Childcare-CA.jpg
595
1500
Kyle Ferrar, MPH
https://www.fractracker.org/a5ej20sjfwe/wp-content/uploads/2025/09/2025-Wordmark-Logo.png
Kyle Ferrar, MPH2023-10-04 16:38:472023-10-04 21:19:54Oil and Gas Activity Within California Public Health Protection Zones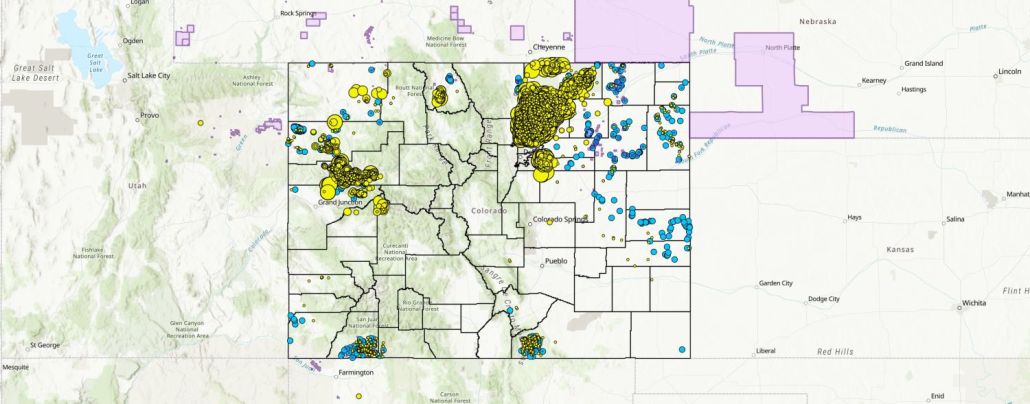 https://www.fractracker.org/a5ej20sjfwe/wp-content/uploads/2023/05/Colorado-Water-Use-5.2.23.jpg
589
1500
Kyle Ferrar, MPH
https://www.fractracker.org/a5ej20sjfwe/wp-content/uploads/2025/09/2025-Wordmark-Logo.png
Kyle Ferrar, MPH2023-05-02 12:33:532026-04-23 15:43:28Evaluation of the Capacity for Water Recycling for Colorado Oil and Gas Extraction Operations
https://www.fractracker.org/a5ej20sjfwe/wp-content/uploads/2023/05/Colorado-Water-Use-5.2.23.jpg
589
1500
Kyle Ferrar, MPH
https://www.fractracker.org/a5ej20sjfwe/wp-content/uploads/2025/09/2025-Wordmark-Logo.png
Kyle Ferrar, MPH2023-05-02 12:33:532026-04-23 15:43:28Evaluation of the Capacity for Water Recycling for Colorado Oil and Gas Extraction Operations Sarah Carballo, FracTracker Alliance, 2022
https://www.fractracker.org/a5ej20sjfwe/wp-content/uploads/2023/04/DSC_0855.jpg
1001
1500
FracTracker Alliance
https://www.fractracker.org/a5ej20sjfwe/wp-content/uploads/2025/09/2025-Wordmark-Logo.png
FracTracker Alliance2023-04-27 13:46:002023-04-27 14:18:17Evidence Shows Oil and Gas Companies Use PFAS in New Mexico Wells
Sarah Carballo, FracTracker Alliance, 2022
https://www.fractracker.org/a5ej20sjfwe/wp-content/uploads/2023/04/DSC_0855.jpg
1001
1500
FracTracker Alliance
https://www.fractracker.org/a5ej20sjfwe/wp-content/uploads/2025/09/2025-Wordmark-Logo.png
FracTracker Alliance2023-04-27 13:46:002023-04-27 14:18:17Evidence Shows Oil and Gas Companies Use PFAS in New Mexico Wells https://www.fractracker.org/a5ej20sjfwe/wp-content/uploads/2023/04/Rework-Permits-Feature-Image.png
506
1500
Kyle Ferrar, MPH
https://www.fractracker.org/a5ej20sjfwe/wp-content/uploads/2025/09/2025-Wordmark-Logo.png
Kyle Ferrar, MPH2023-04-14 11:36:392023-04-28 16:05:23CalGEM Permit Review Q1 2023: Well Rework Permits Increase by 76% in California
https://www.fractracker.org/a5ej20sjfwe/wp-content/uploads/2023/04/Rework-Permits-Feature-Image.png
506
1500
Kyle Ferrar, MPH
https://www.fractracker.org/a5ej20sjfwe/wp-content/uploads/2025/09/2025-Wordmark-Logo.png
Kyle Ferrar, MPH2023-04-14 11:36:392023-04-28 16:05:23CalGEM Permit Review Q1 2023: Well Rework Permits Increase by 76% in California Ted Auch, FracTracker Alliance, 2022
https://www.fractracker.org/a5ej20sjfwe/wp-content/uploads/2023/02/DSC_1026_LowRes.jpg
1000
1500
Matt Kelso, BA
https://www.fractracker.org/a5ej20sjfwe/wp-content/uploads/2025/09/2025-Wordmark-Logo.png
Matt Kelso, BA2023-02-01 15:36:182023-02-01 17:01:372022 Pipeline Incidents Update: Is Pipeline Safety Achievable?
Ted Auch, FracTracker Alliance, 2022
https://www.fractracker.org/a5ej20sjfwe/wp-content/uploads/2023/02/DSC_1026_LowRes.jpg
1000
1500
Matt Kelso, BA
https://www.fractracker.org/a5ej20sjfwe/wp-content/uploads/2025/09/2025-Wordmark-Logo.png
Matt Kelso, BA2023-02-01 15:36:182023-02-01 17:01:372022 Pipeline Incidents Update: Is Pipeline Safety Achievable?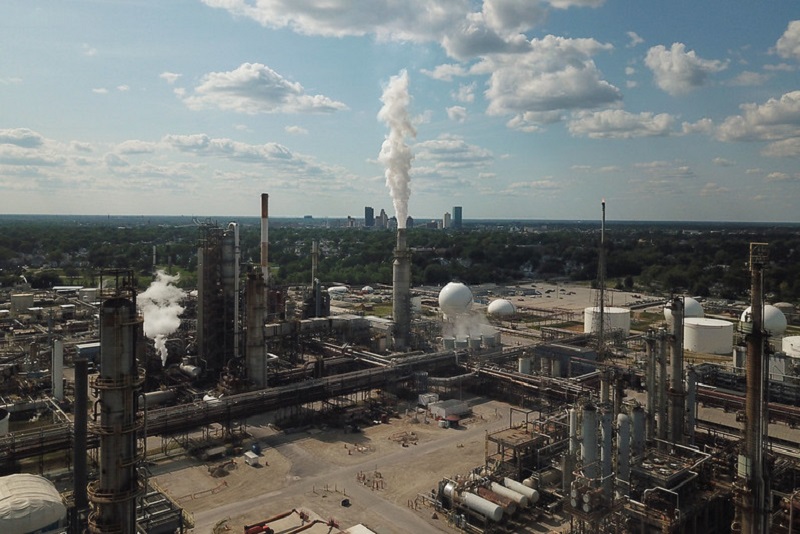 https://www.fractracker.org/a5ej20sjfwe/wp-content/uploads/2020/09/Methane_Air_WaterQualityConcerns-1.jpg
534
800
FracTracker Alliance
https://www.fractracker.org/a5ej20sjfwe/wp-content/uploads/2025/09/2025-Wordmark-Logo.png
FracTracker Alliance2023-01-31 15:01:342023-02-27 16:43:15Testimony On EPA’s Proposed Methane Pollution Standards for the Oil and Gas Industry
https://www.fractracker.org/a5ej20sjfwe/wp-content/uploads/2020/09/Methane_Air_WaterQualityConcerns-1.jpg
534
800
FracTracker Alliance
https://www.fractracker.org/a5ej20sjfwe/wp-content/uploads/2025/09/2025-Wordmark-Logo.png
FracTracker Alliance2023-01-31 15:01:342023-02-27 16:43:15Testimony On EPA’s Proposed Methane Pollution Standards for the Oil and Gas Industry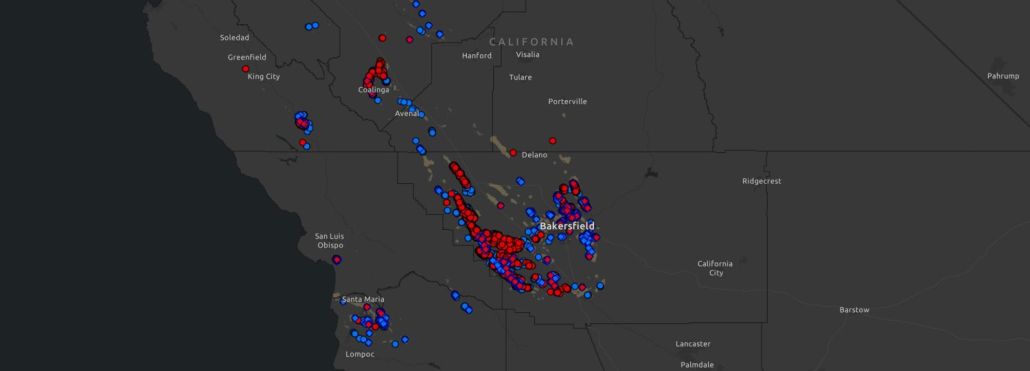 https://www.fractracker.org/a5ej20sjfwe/wp-content/uploads/2023/01/California-Rework-Permits-2023.jpg
541
1500
Kyle Ferrar, MPH
https://www.fractracker.org/a5ej20sjfwe/wp-content/uploads/2025/09/2025-Wordmark-Logo.png
Kyle Ferrar, MPH2023-01-24 09:01:352023-01-24 13:21:55Assessment of Rework Permits on Oil Production from Operational Wells Within the 3,200-Foot Public Health Protection Zone
https://www.fractracker.org/a5ej20sjfwe/wp-content/uploads/2023/01/California-Rework-Permits-2023.jpg
541
1500
Kyle Ferrar, MPH
https://www.fractracker.org/a5ej20sjfwe/wp-content/uploads/2025/09/2025-Wordmark-Logo.png
Kyle Ferrar, MPH2023-01-24 09:01:352023-01-24 13:21:55Assessment of Rework Permits on Oil Production from Operational Wells Within the 3,200-Foot Public Health Protection Zone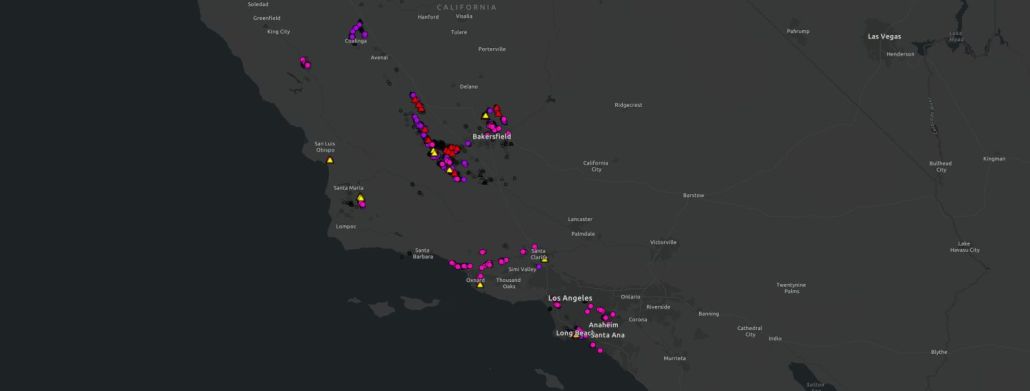 https://www.fractracker.org/a5ej20sjfwe/wp-content/uploads/2023/01/CalGEM-Q4-2022-Permit-Review.jpg
570
1500
Kyle Ferrar, MPH
https://www.fractracker.org/a5ej20sjfwe/wp-content/uploads/2025/09/2025-Wordmark-Logo.png
Kyle Ferrar, MPH2023-01-18 18:01:532023-01-18 18:03:23CalGEM Permit Review Q4 2022: Oil Permit Approvals Show Steep Rise Within Protective Buffer Zones
https://www.fractracker.org/a5ej20sjfwe/wp-content/uploads/2023/01/CalGEM-Q4-2022-Permit-Review.jpg
570
1500
Kyle Ferrar, MPH
https://www.fractracker.org/a5ej20sjfwe/wp-content/uploads/2025/09/2025-Wordmark-Logo.png
Kyle Ferrar, MPH2023-01-18 18:01:532023-01-18 18:03:23CalGEM Permit Review Q4 2022: Oil Permit Approvals Show Steep Rise Within Protective Buffer Zones https://www.fractracker.org/a5ej20sjfwe/wp-content/uploads/2021/03/TAuch_Transportation-RoverPipeline_Construction-EnergyTransferPartners-Woodsfield_OH_May2017.jpg
576
1500
Karen Edelstein
https://www.fractracker.org/a5ej20sjfwe/wp-content/uploads/2025/09/2025-Wordmark-Logo.png
Karen Edelstein2022-11-30 17:50:122024-01-22 16:03:23A Contentious Landscape of Pipeline Build-outs in the Eastern US
https://www.fractracker.org/a5ej20sjfwe/wp-content/uploads/2021/03/TAuch_Transportation-RoverPipeline_Construction-EnergyTransferPartners-Woodsfield_OH_May2017.jpg
576
1500
Karen Edelstein
https://www.fractracker.org/a5ej20sjfwe/wp-content/uploads/2025/09/2025-Wordmark-Logo.png
Karen Edelstein2022-11-30 17:50:122024-01-22 16:03:23A Contentious Landscape of Pipeline Build-outs in the Eastern US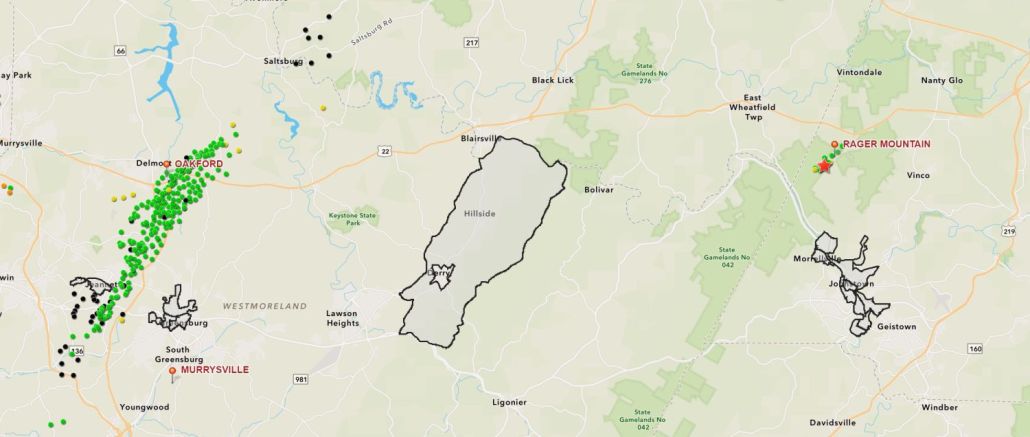 https://www.fractracker.org/a5ej20sjfwe/wp-content/uploads/2022/11/Rager-Mountain-Feature.jpg
636
1500
Erica Jackson
https://www.fractracker.org/a5ej20sjfwe/wp-content/uploads/2025/09/2025-Wordmark-Logo.png
Erica Jackson2022-11-30 14:12:222023-02-03 13:50:48Major Gas Leak Reveals Risks of Aging Gas Storage Wells in Pennsylvania
https://www.fractracker.org/a5ej20sjfwe/wp-content/uploads/2022/11/Rager-Mountain-Feature.jpg
636
1500
Erica Jackson
https://www.fractracker.org/a5ej20sjfwe/wp-content/uploads/2025/09/2025-Wordmark-Logo.png
Erica Jackson2022-11-30 14:12:222023-02-03 13:50:48Major Gas Leak Reveals Risks of Aging Gas Storage Wells in Pennsylvania https://www.fractracker.org/a5ej20sjfwe/wp-content/uploads/2022/11/DSC_1359_HighRes.jpg
1000
1500
FracTracker Alliance
https://www.fractracker.org/a5ej20sjfwe/wp-content/uploads/2025/09/2025-Wordmark-Logo.png
FracTracker Alliance2022-11-23 15:15:112025-03-06 15:40:10Coursing Through Gasland: A Digital Atlas Exploring Natural Gas Development in the Towanda Creek Watershed
https://www.fractracker.org/a5ej20sjfwe/wp-content/uploads/2022/11/Fhn3YgeXkAI0QiX.jpg
675
1200
Erica Jackson
https://www.fractracker.org/a5ej20sjfwe/wp-content/uploads/2025/09/2025-Wordmark-Logo.png
Erica Jackson2022-11-17 16:43:392022-11-18 13:41:39Falcon Pipeline Online, Begins Operations Following Violations of Clean Streams Law
https://www.fractracker.org/a5ej20sjfwe/wp-content/uploads/2022/11/DSC_1359_HighRes.jpg
1000
1500
FracTracker Alliance
https://www.fractracker.org/a5ej20sjfwe/wp-content/uploads/2025/09/2025-Wordmark-Logo.png
FracTracker Alliance2022-11-23 15:15:112025-03-06 15:40:10Coursing Through Gasland: A Digital Atlas Exploring Natural Gas Development in the Towanda Creek Watershed
https://www.fractracker.org/a5ej20sjfwe/wp-content/uploads/2022/11/Fhn3YgeXkAI0QiX.jpg
675
1200
Erica Jackson
https://www.fractracker.org/a5ej20sjfwe/wp-content/uploads/2025/09/2025-Wordmark-Logo.png
Erica Jackson2022-11-17 16:43:392022-11-18 13:41:39Falcon Pipeline Online, Begins Operations Following Violations of Clean Streams Law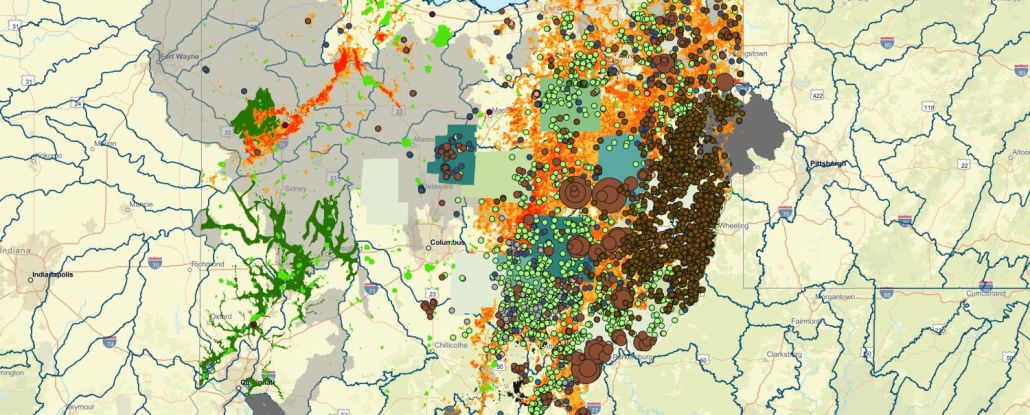 https://www.fractracker.org/a5ej20sjfwe/wp-content/uploads/2022/10/Columbus-Source-Water.jpg
605
1500
Guest Author
https://www.fractracker.org/a5ej20sjfwe/wp-content/uploads/2025/09/2025-Wordmark-Logo.png
Guest Author2022-10-31 21:39:022022-11-29 14:24:38Synopsis: Risks to the Greater Columbus Water Supply from Oil and Gas Production
https://www.fractracker.org/a5ej20sjfwe/wp-content/uploads/2022/10/Columbus-Source-Water.jpg
605
1500
Guest Author
https://www.fractracker.org/a5ej20sjfwe/wp-content/uploads/2025/09/2025-Wordmark-Logo.png
Guest Author2022-10-31 21:39:022022-11-29 14:24:38Synopsis: Risks to the Greater Columbus Water Supply from Oil and Gas Production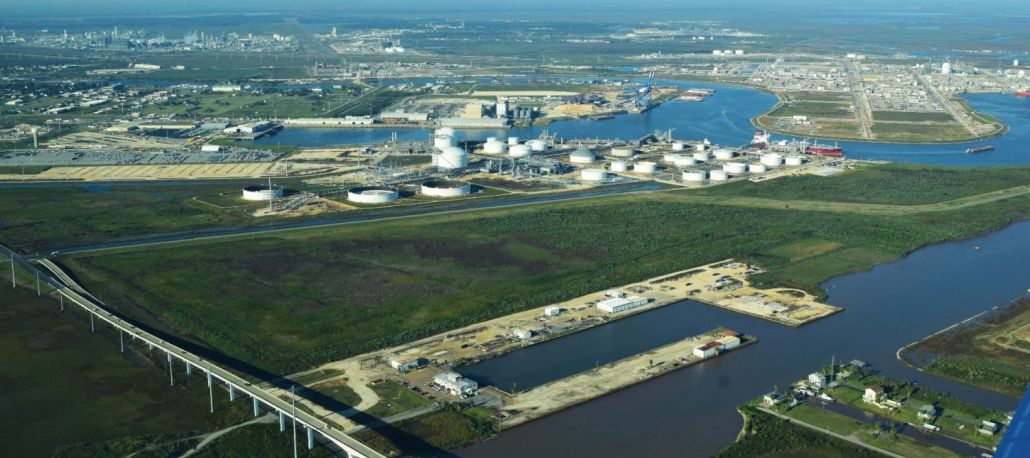 https://www.fractracker.org/a5ej20sjfwe/wp-content/uploads/2022/09/DSC_1021_LowRes__1607617394306__w1920-e1663613850641.jpg
667
1500
Ted Auch, PhD
https://www.fractracker.org/a5ej20sjfwe/wp-content/uploads/2025/09/2025-Wordmark-Logo.png
Ted Auch, PhD2022-09-19 15:08:172022-11-03 11:56:26Desalination: The Chemical Industry’s Demand for Water in Texas
https://www.fractracker.org/a5ej20sjfwe/wp-content/uploads/2022/09/DSC_1021_LowRes__1607617394306__w1920-e1663613850641.jpg
667
1500
Ted Auch, PhD
https://www.fractracker.org/a5ej20sjfwe/wp-content/uploads/2025/09/2025-Wordmark-Logo.png
Ted Auch, PhD2022-09-19 15:08:172022-11-03 11:56:26Desalination: The Chemical Industry’s Demand for Water in Texas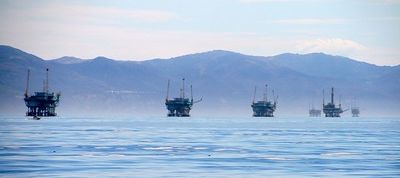 https://www.fractracker.org/a5ej20sjfwe/wp-content/uploads/2021/06/LKrop_infrastructure-offshoredrilling-drillrigs-SantaBarbara-CA_EnvrDefenseCtr_Aug20131-e1663254826557.jpg
178
400
Erica Jackson
https://www.fractracker.org/a5ej20sjfwe/wp-content/uploads/2025/09/2025-Wordmark-Logo.png
Erica Jackson2022-09-06 13:32:202022-09-15 11:14:03Take Action in Support of No New Leases
https://www.fractracker.org/a5ej20sjfwe/wp-content/uploads/2021/06/LKrop_infrastructure-offshoredrilling-drillrigs-SantaBarbara-CA_EnvrDefenseCtr_Aug20131-e1663254826557.jpg
178
400
Erica Jackson
https://www.fractracker.org/a5ej20sjfwe/wp-content/uploads/2025/09/2025-Wordmark-Logo.png
Erica Jackson2022-09-06 13:32:202022-09-15 11:14:03Take Action in Support of No New Leases https://www.fractracker.org/a5ej20sjfwe/wp-content/uploads/2022/08/51119572588_132e0366c1_k_1-e1663254774314.jpg
607
1364
Guest Author
https://www.fractracker.org/a5ej20sjfwe/wp-content/uploads/2025/09/2025-Wordmark-Logo.png
Guest Author2022-08-31 14:33:482022-09-15 16:29:45Carbon Capture and Storage: Developments in the Law of Pore Space in North Dakota
https://www.fractracker.org/a5ej20sjfwe/wp-content/uploads/2022/08/51119572588_132e0366c1_k_1-e1663254774314.jpg
607
1364
Guest Author
https://www.fractracker.org/a5ej20sjfwe/wp-content/uploads/2025/09/2025-Wordmark-Logo.png
Guest Author2022-08-31 14:33:482022-09-15 16:29:45Carbon Capture and Storage: Developments in the Law of Pore Space in North Dakota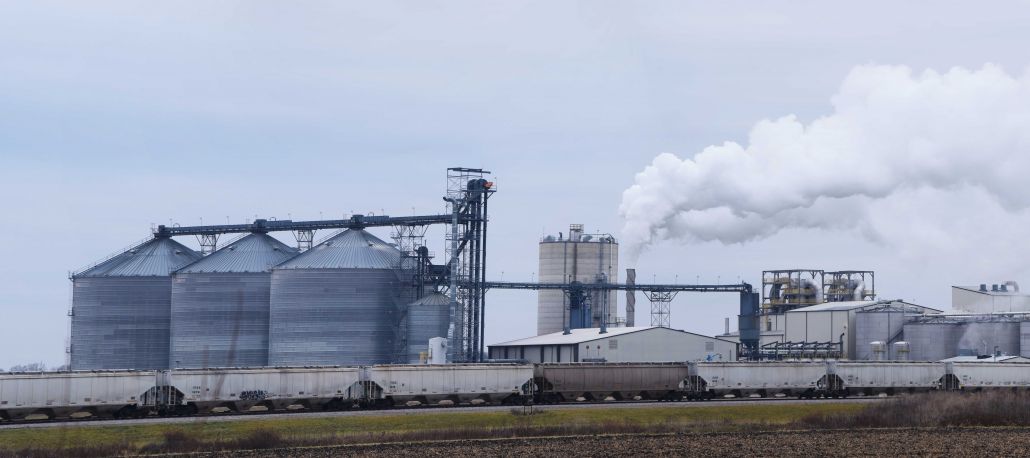 https://www.fractracker.org/a5ej20sjfwe/wp-content/uploads/2017/03/DSC_0341_to_0345_LowRes2-e1663254589691.jpg
667
1500
Ted Auch, PhD
https://www.fractracker.org/a5ej20sjfwe/wp-content/uploads/2025/09/2025-Wordmark-Logo.png
Ted Auch, PhD2022-08-31 12:54:012023-12-07 14:33:18Carbon Capture and Storage: Industry Connections and Community Impacts
https://www.fractracker.org/a5ej20sjfwe/wp-content/uploads/2017/03/DSC_0341_to_0345_LowRes2-e1663254589691.jpg
667
1500
Ted Auch, PhD
https://www.fractracker.org/a5ej20sjfwe/wp-content/uploads/2025/09/2025-Wordmark-Logo.png
Ted Auch, PhD2022-08-31 12:54:012023-12-07 14:33:18Carbon Capture and Storage: Industry Connections and Community Impacts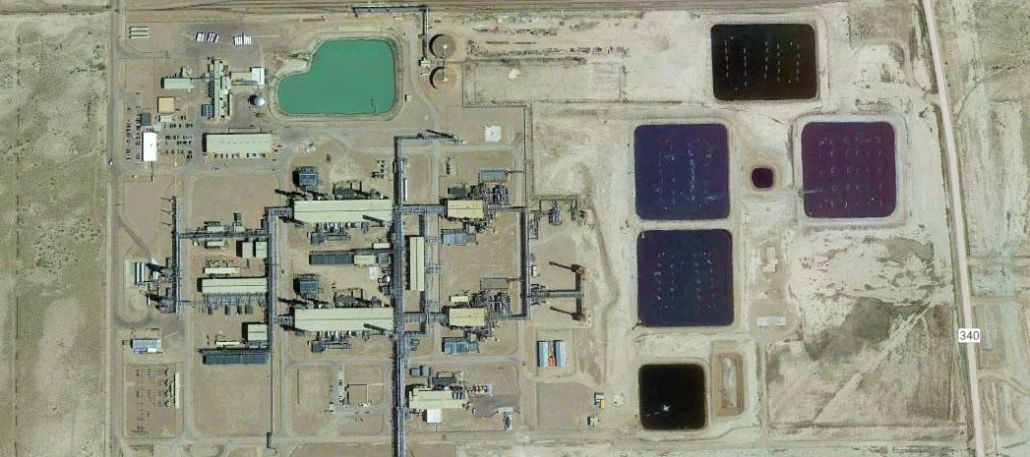 https://www.fractracker.org/a5ej20sjfwe/wp-content/uploads/2022/08/ExxonMobil-LaBarge-CCUS-e1663254477876.jpg
465
1047
Ted Auch, PhD
https://www.fractracker.org/a5ej20sjfwe/wp-content/uploads/2025/09/2025-Wordmark-Logo.png
Ted Auch, PhD2022-08-31 11:19:122022-09-15 11:08:15Carbon Capture and Storage: Fact or Fiction?
https://www.fractracker.org/a5ej20sjfwe/wp-content/uploads/2022/08/ExxonMobil-LaBarge-CCUS-e1663254477876.jpg
465
1047
Ted Auch, PhD
https://www.fractracker.org/a5ej20sjfwe/wp-content/uploads/2025/09/2025-Wordmark-Logo.png
Ted Auch, PhD2022-08-31 11:19:122022-09-15 11:08:15Carbon Capture and Storage: Fact or Fiction? https://www.fractracker.org/a5ej20sjfwe/wp-content/uploads/2022/08/MOV_8837_Moment-e1663254387862.jpg
284
640
Kyle Ferrar, MPH
https://www.fractracker.org/a5ej20sjfwe/wp-content/uploads/2025/09/2025-Wordmark-Logo.png
Kyle Ferrar, MPH2022-08-22 09:52:582026-04-28 14:45:28FracTracker Finds Widespread Hydrocarbon Emissions from Active & Idle Oil and Gas Wells and Infrastructure in California
https://www.fractracker.org/a5ej20sjfwe/wp-content/uploads/2022/08/MOV_8837_Moment-e1663254387862.jpg
284
640
Kyle Ferrar, MPH
https://www.fractracker.org/a5ej20sjfwe/wp-content/uploads/2025/09/2025-Wordmark-Logo.png
Kyle Ferrar, MPH2022-08-22 09:52:582026-04-28 14:45:28FracTracker Finds Widespread Hydrocarbon Emissions from Active & Idle Oil and Gas Wells and Infrastructure in California https://www.fractracker.org/a5ej20sjfwe/wp-content/uploads/2022/07/kyle-ferrar-e1663254307641.jpg
636
1430
Kyle Ferrar, MPH
https://www.fractracker.org/a5ej20sjfwe/wp-content/uploads/2025/09/2025-Wordmark-Logo.png
Kyle Ferrar, MPH2022-07-29 19:04:322022-09-15 11:05:17California Regulators Approve More Oil Well Permits Amid a Crisis of Leaking Oil Wells that Should be Plugged
https://www.fractracker.org/a5ej20sjfwe/wp-content/uploads/2022/07/kyle-ferrar-e1663254307641.jpg
636
1430
Kyle Ferrar, MPH
https://www.fractracker.org/a5ej20sjfwe/wp-content/uploads/2025/09/2025-Wordmark-Logo.png
Kyle Ferrar, MPH2022-07-29 19:04:322022-09-15 11:05:17California Regulators Approve More Oil Well Permits Amid a Crisis of Leaking Oil Wells that Should be Plugged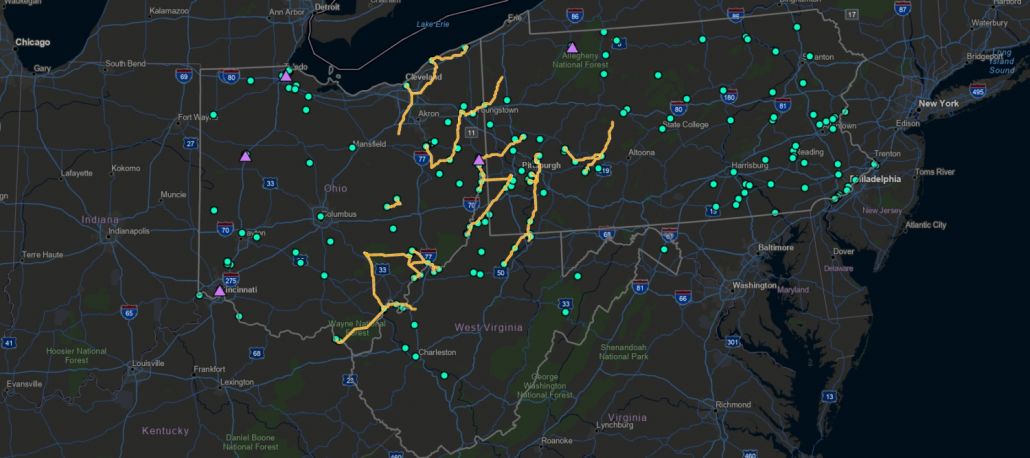 https://www.fractracker.org/a5ej20sjfwe/wp-content/uploads/2022/06/CCSHFeatureImage.jpg
667
1500
Guest Author
https://www.fractracker.org/a5ej20sjfwe/wp-content/uploads/2025/09/2025-Wordmark-Logo.png
Guest Author2022-06-23 15:29:312022-06-30 12:30:43An Insider Take on the Appalachian Hydrogen & CCUS Conference
https://www.fractracker.org/a5ej20sjfwe/wp-content/uploads/2022/06/CCSHFeatureImage.jpg
667
1500
Guest Author
https://www.fractracker.org/a5ej20sjfwe/wp-content/uploads/2025/09/2025-Wordmark-Logo.png
Guest Author2022-06-23 15:29:312022-06-30 12:30:43An Insider Take on the Appalachian Hydrogen & CCUS Conference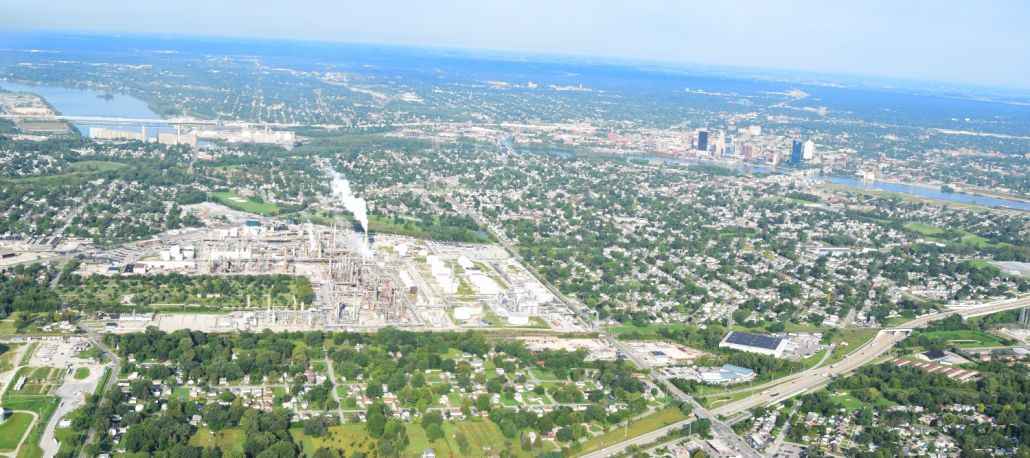 https://www.fractracker.org/a5ej20sjfwe/wp-content/uploads/2022/06/TAuch_Infrastructure-OilRefinery_DowntownToledo-ToledoOil-LucasCounty-OH_Lighthawk_Sept2021.jpg
667
1500
Matt Kelso, BA
https://www.fractracker.org/a5ej20sjfwe/wp-content/uploads/2025/09/2025-Wordmark-Logo.png
Matt Kelso, BA2022-06-21 15:46:522024-06-18 10:53:27Does Hydrogen Have a Role in our Energy Future?
https://www.fractracker.org/a5ej20sjfwe/wp-content/uploads/2022/06/TAuch_Infrastructure-OilRefinery_DowntownToledo-ToledoOil-LucasCounty-OH_Lighthawk_Sept2021.jpg
667
1500
Matt Kelso, BA
https://www.fractracker.org/a5ej20sjfwe/wp-content/uploads/2025/09/2025-Wordmark-Logo.png
Matt Kelso, BA2022-06-21 15:46:522024-06-18 10:53:27Does Hydrogen Have a Role in our Energy Future? https://www.fractracker.org/a5ej20sjfwe/wp-content/uploads/2022/05/Brine-spreading-map-feature-1.jpg
667
1500
Guest Author
https://www.fractracker.org/a5ej20sjfwe/wp-content/uploads/2025/09/2025-Wordmark-Logo.png
Guest Author2022-05-13 16:19:112022-08-10 15:43:05Oil and Gas Brine in Ohio
https://www.fractracker.org/a5ej20sjfwe/wp-content/uploads/2022/05/Brine-spreading-map-feature-1.jpg
667
1500
Guest Author
https://www.fractracker.org/a5ej20sjfwe/wp-content/uploads/2025/09/2025-Wordmark-Logo.png
Guest Author2022-05-13 16:19:112022-08-10 15:43:05Oil and Gas Brine in Ohio https://www.fractracker.org/a5ej20sjfwe/wp-content/uploads/2022/05/DustingHighVolDirtyFilter-feature.jpg
667
1500
Guest Author
https://www.fractracker.org/a5ej20sjfwe/wp-content/uploads/2025/09/2025-Wordmark-Logo.png
Guest Author2022-05-03 09:37:492022-05-03 09:37:49PA Environment Digest Blog: Conventional Oil & Gas Drillers Dispose Of Drill Cuttings By ‘Dusting’
https://www.fractracker.org/a5ej20sjfwe/wp-content/uploads/2022/05/DustingHighVolDirtyFilter-feature.jpg
667
1500
Guest Author
https://www.fractracker.org/a5ej20sjfwe/wp-content/uploads/2025/09/2025-Wordmark-Logo.png
Guest Author2022-05-03 09:37:492022-05-03 09:37:49PA Environment Digest Blog: Conventional Oil & Gas Drillers Dispose Of Drill Cuttings By ‘Dusting’ https://www.fractracker.org/a5ej20sjfwe/wp-content/uploads/2022/04/TAuch_Cultural-Harvey_FamilyFarm_NEXUS_Pipeline-DTEEnergy_Enbridge-ChippewaLake_MedinaCounty_OH_May20183-feature.jpg
667
1500
Ted Auch, PhD
https://www.fractracker.org/a5ej20sjfwe/wp-content/uploads/2025/09/2025-Wordmark-Logo.png
Ted Auch, PhD2022-04-28 14:12:552022-04-28 14:12:55Real Talk on Pipelines
https://www.fractracker.org/a5ej20sjfwe/wp-content/uploads/2022/04/TAuch_Cultural-Harvey_FamilyFarm_NEXUS_Pipeline-DTEEnergy_Enbridge-ChippewaLake_MedinaCounty_OH_May20183-feature.jpg
667
1500
Ted Auch, PhD
https://www.fractracker.org/a5ej20sjfwe/wp-content/uploads/2025/09/2025-Wordmark-Logo.png
Ted Auch, PhD2022-04-28 14:12:552022-04-28 14:12:55Real Talk on Pipelines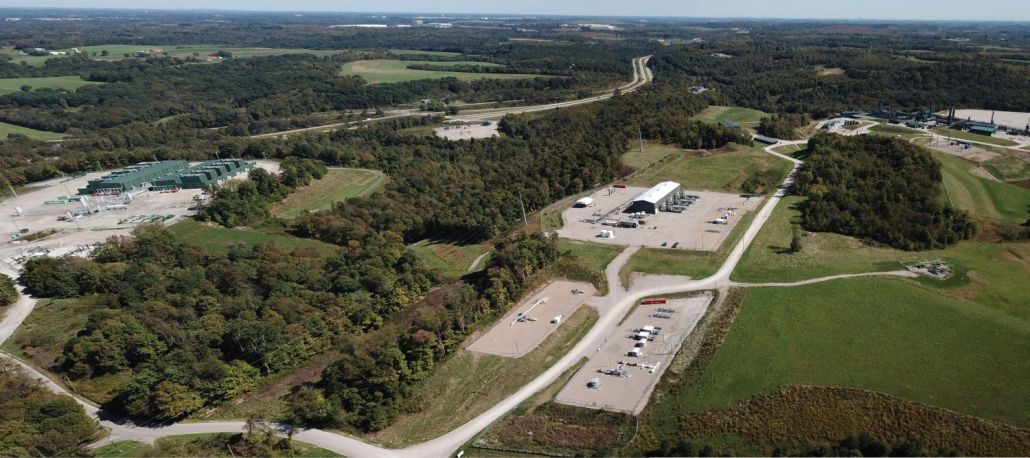 https://www.fractracker.org/a5ej20sjfwe/wp-content/uploads/2022/04/TAuch_Infrastructure-Compressor_Cryogenic_Complex-MarkWest_EnergyTransfer-WashingtonCounty-PA_Sept2021-feature.jpg
667
1500
Matt Kelso, BA
https://www.fractracker.org/a5ej20sjfwe/wp-content/uploads/2025/09/2025-Wordmark-Logo.png
Matt Kelso, BA2022-04-28 13:37:312023-03-09 14:03:402021 Production from Pennsylvania’s Oil and Gas Wells
https://www.fractracker.org/a5ej20sjfwe/wp-content/uploads/2022/04/TAuch_Infrastructure-Compressor_Cryogenic_Complex-MarkWest_EnergyTransfer-WashingtonCounty-PA_Sept2021-feature.jpg
667
1500
Matt Kelso, BA
https://www.fractracker.org/a5ej20sjfwe/wp-content/uploads/2025/09/2025-Wordmark-Logo.png
Matt Kelso, BA2022-04-28 13:37:312023-03-09 14:03:402021 Production from Pennsylvania’s Oil and Gas Wells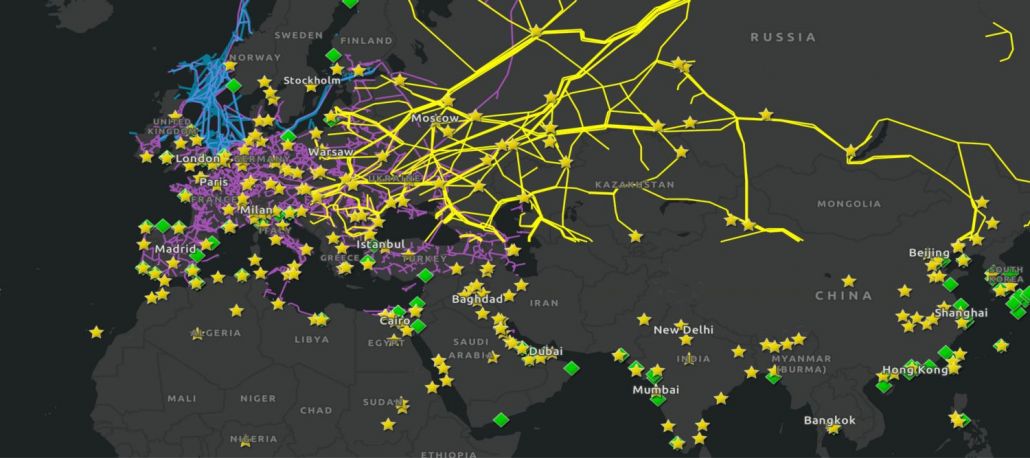 https://www.fractracker.org/a5ej20sjfwe/wp-content/uploads/2022/04/Russia-Ukraine-Energy-feature.jpg
667
1500
FracTracker Alliance
https://www.fractracker.org/a5ej20sjfwe/wp-content/uploads/2025/09/2025-Wordmark-Logo.png
FracTracker Alliance2022-04-20 13:25:452022-04-20 17:23:17Mapping Energy Systems Impacted by the Russia-Ukraine War
https://www.fractracker.org/a5ej20sjfwe/wp-content/uploads/2022/04/Russia-Ukraine-Energy-feature.jpg
667
1500
FracTracker Alliance
https://www.fractracker.org/a5ej20sjfwe/wp-content/uploads/2025/09/2025-Wordmark-Logo.png
FracTracker Alliance2022-04-20 13:25:452022-04-20 17:23:17Mapping Energy Systems Impacted by the Russia-Ukraine War https://www.fractracker.org/a5ej20sjfwe/wp-content/uploads/2022/04/IMG_5940-1.jpg
1125
1500
Erica Jackson
https://www.fractracker.org/a5ej20sjfwe/wp-content/uploads/2025/09/2025-Wordmark-Logo.png
Erica Jackson2022-04-11 16:48:092022-04-20 13:23:14Dimock residents working to protect water from a new threat: fracking waste
https://www.fractracker.org/a5ej20sjfwe/wp-content/uploads/2022/04/IMG_5940-1.jpg
1125
1500
Erica Jackson
https://www.fractracker.org/a5ej20sjfwe/wp-content/uploads/2025/09/2025-Wordmark-Logo.png
Erica Jackson2022-04-11 16:48:092022-04-20 13:23:14Dimock residents working to protect water from a new threat: fracking waste https://www.fractracker.org/a5ej20sjfwe/wp-content/uploads/2022/03/KFerrar-feature-CAsetbacks2022.jpg
878
1500
Kyle Ferrar, MPH
https://www.fractracker.org/a5ej20sjfwe/wp-content/uploads/2025/09/2025-Wordmark-Logo.png
Kyle Ferrar, MPH2022-04-06 12:01:332023-08-24 19:08:53Implications of a 3,200-foot Setback in California
https://www.fractracker.org/a5ej20sjfwe/wp-content/uploads/2022/03/KFerrar-feature-CAsetbacks2022.jpg
878
1500
Kyle Ferrar, MPH
https://www.fractracker.org/a5ej20sjfwe/wp-content/uploads/2025/09/2025-Wordmark-Logo.png
Kyle Ferrar, MPH2022-04-06 12:01:332023-08-24 19:08:53Implications of a 3,200-foot Setback in California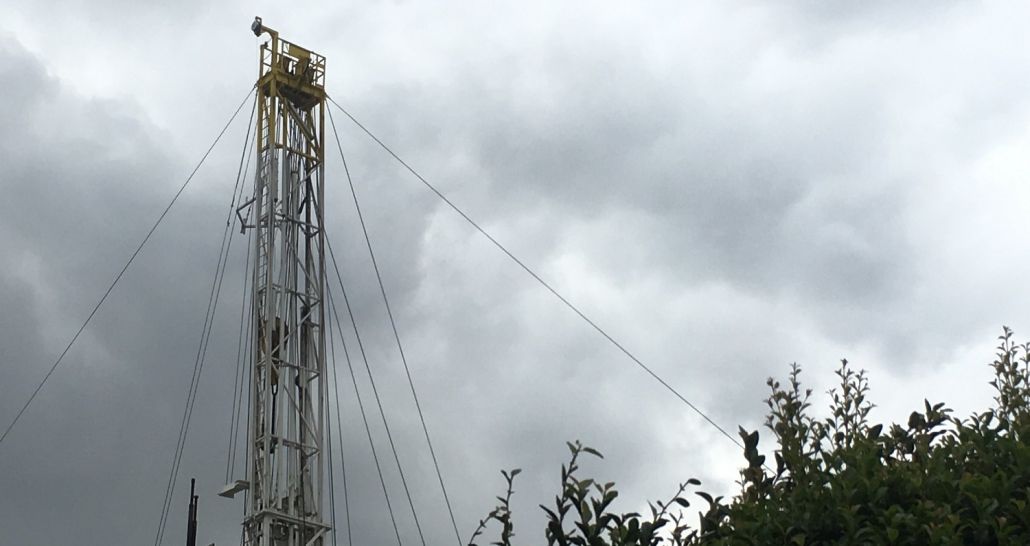 https://www.fractracker.org/a5ej20sjfwe/wp-content/uploads/2022/03/BLenker_infrastructure-oilrig-southLA-CA_Oct20173.jpg
795
1500
Kyle Ferrar, MPH
https://www.fractracker.org/a5ej20sjfwe/wp-content/uploads/2025/09/2025-Wordmark-Logo.png
Kyle Ferrar, MPH2022-03-15 16:32:032022-03-15 18:00:00New Trends in Drilling Permit Approvals Take Shape in CA
https://www.fractracker.org/a5ej20sjfwe/wp-content/uploads/2022/03/BLenker_infrastructure-oilrig-southLA-CA_Oct20173.jpg
795
1500
Kyle Ferrar, MPH
https://www.fractracker.org/a5ej20sjfwe/wp-content/uploads/2025/09/2025-Wordmark-Logo.png
Kyle Ferrar, MPH2022-03-15 16:32:032022-03-15 18:00:00New Trends in Drilling Permit Approvals Take Shape in CA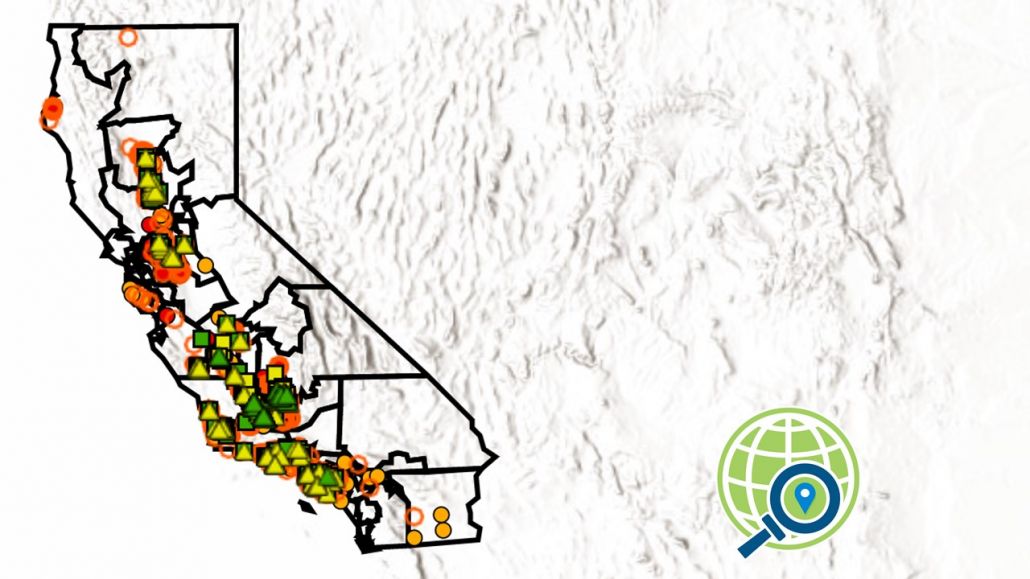 https://www.fractracker.org/a5ej20sjfwe/wp-content/uploads/2022/03/KFerrar-CAlegislative-analysis_March2022.jpg
720
1280
Kyle Ferrar, MPH
https://www.fractracker.org/a5ej20sjfwe/wp-content/uploads/2025/09/2025-Wordmark-Logo.png
Kyle Ferrar, MPH2022-03-14 15:18:402022-03-14 15:18:40Oil and Gas Drilling in California Legislative Districts
https://www.fractracker.org/a5ej20sjfwe/wp-content/uploads/2022/03/KFerrar-CAlegislative-analysis_March2022.jpg
720
1280
Kyle Ferrar, MPH
https://www.fractracker.org/a5ej20sjfwe/wp-content/uploads/2025/09/2025-Wordmark-Logo.png
Kyle Ferrar, MPH2022-03-14 15:18:402022-03-14 15:18:40Oil and Gas Drilling in California Legislative Districts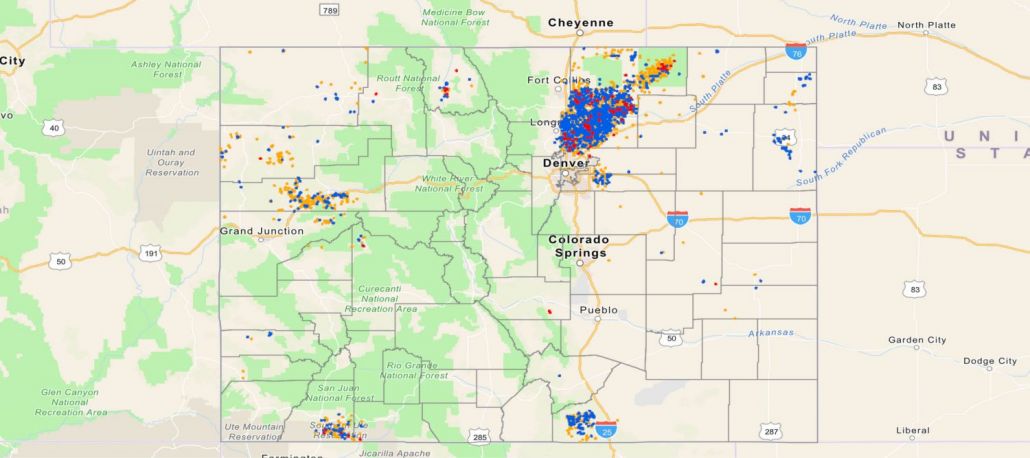 https://www.fractracker.org/a5ej20sjfwe/wp-content/uploads/2022/01/PFAS-wells-in-Colorado-Feature.jpg
667
1500
Matt Kelso, BA
https://www.fractracker.org/a5ej20sjfwe/wp-content/uploads/2025/09/2025-Wordmark-Logo.png
Matt Kelso, BA2022-01-31 16:36:332022-01-31 16:36:33New Report: Fracking with “Forever Chemicals” in Colorado
https://www.fractracker.org/a5ej20sjfwe/wp-content/uploads/2022/01/PFAS-wells-in-Colorado-Feature.jpg
667
1500
Matt Kelso, BA
https://www.fractracker.org/a5ej20sjfwe/wp-content/uploads/2025/09/2025-Wordmark-Logo.png
Matt Kelso, BA2022-01-31 16:36:332022-01-31 16:36:33New Report: Fracking with “Forever Chemicals” in Colorado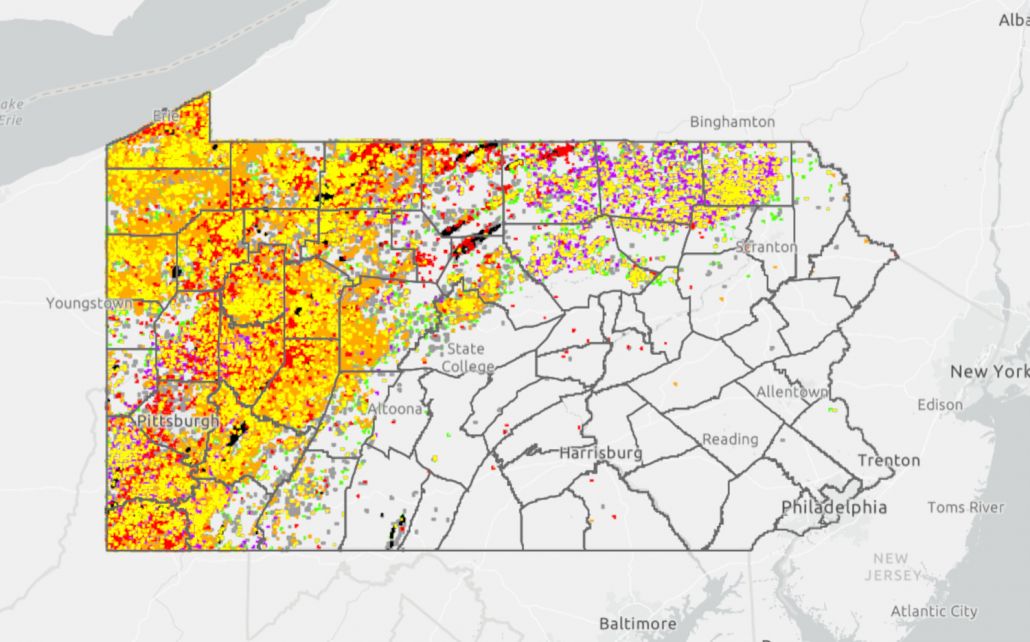 https://www.fractracker.org/a5ej20sjfwe/wp-content/uploads/2022/01/FeatImage_MK.jpg
935
1500
Matt Kelso, BA
https://www.fractracker.org/a5ej20sjfwe/wp-content/uploads/2025/09/2025-Wordmark-Logo.png
Matt Kelso, BA2022-01-20 15:32:142022-01-20 15:32:14Introducing: FracTracker’s comprehensive new Pennsylvania map!
https://www.fractracker.org/a5ej20sjfwe/wp-content/uploads/2022/01/FeatImage_MK.jpg
935
1500
Matt Kelso, BA
https://www.fractracker.org/a5ej20sjfwe/wp-content/uploads/2025/09/2025-Wordmark-Logo.png
Matt Kelso, BA2022-01-20 15:32:142022-01-20 15:32:14Introducing: FracTracker’s comprehensive new Pennsylvania map!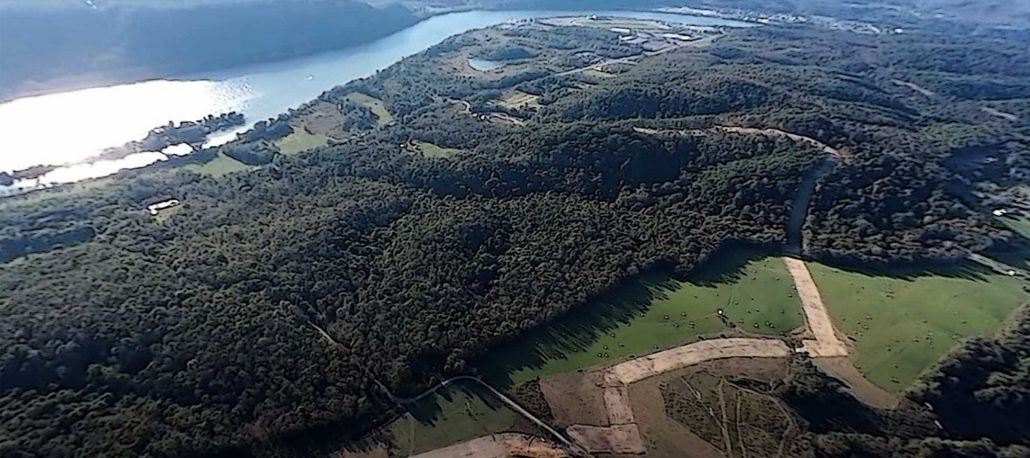 https://www.fractracker.org/a5ej20sjfwe/wp-content/uploads/2021/12/173695136_1422048161521006_7197500259062906334_n.jpg
667
1500
Erica Jackson
https://www.fractracker.org/a5ej20sjfwe/wp-content/uploads/2025/09/2025-Wordmark-Logo.png
Erica Jackson2021-12-01 15:27:402021-12-01 15:27:40New Letter from Federal Regulators Regarding how the Falcon has Been Investigated
https://www.fractracker.org/a5ej20sjfwe/wp-content/uploads/2021/12/173695136_1422048161521006_7197500259062906334_n.jpg
667
1500
Erica Jackson
https://www.fractracker.org/a5ej20sjfwe/wp-content/uploads/2025/09/2025-Wordmark-Logo.png
Erica Jackson2021-12-01 15:27:402021-12-01 15:27:40New Letter from Federal Regulators Regarding how the Falcon has Been Investigated https://www.fractracker.org/a5ej20sjfwe/wp-content/uploads/2021/11/TAuch_Infrastructure-naturalgas-powerplant-construction-Caithness-GuernseyCounty-OH_April2021.jpg
667
1500
Guest Author
https://www.fractracker.org/a5ej20sjfwe/wp-content/uploads/2025/09/2025-Wordmark-Logo.png
Guest Author2021-12-01 15:20:152022-01-04 17:53:55US Army Corps Muskingum Watershed Plan ignores local concerns of oil and gas effects
https://www.fractracker.org/a5ej20sjfwe/wp-content/uploads/2021/11/TAuch_Infrastructure-naturalgas-powerplant-construction-Caithness-GuernseyCounty-OH_April2021.jpg
667
1500
Guest Author
https://www.fractracker.org/a5ej20sjfwe/wp-content/uploads/2025/09/2025-Wordmark-Logo.png
Guest Author2021-12-01 15:20:152022-01-04 17:53:55US Army Corps Muskingum Watershed Plan ignores local concerns of oil and gas effects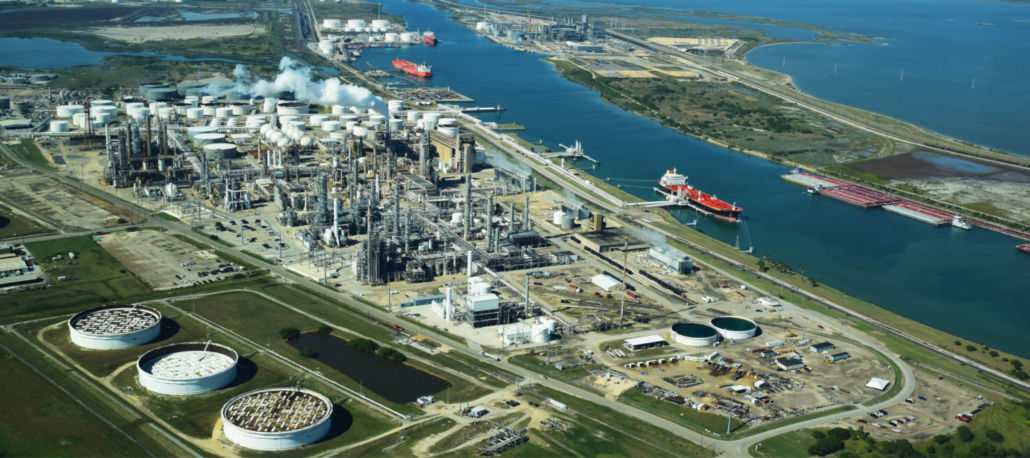 https://www.fractracker.org/a5ej20sjfwe/wp-content/uploads/2021/11/TAuch_Plastics_Refinery_TankFarm_Terminal-Trafigura_CorpusChristiPolymers_Valero_Citgo_FlintHillsResources-CorpusChristi_TX_LightHawk_Nov2019-feature.jpg
667
1500
Ted Auch, PhD
https://www.fractracker.org/a5ej20sjfwe/wp-content/uploads/2025/09/2025-Wordmark-Logo.png
Ted Auch, PhD2021-11-05 09:43:472021-11-05 09:47:30Southeastern Texas Petrochemical Industry Needs 318 Billion Gallons of Water, but the US EPA Says Not So Fast
https://www.fractracker.org/a5ej20sjfwe/wp-content/uploads/2021/11/TAuch_Plastics_Refinery_TankFarm_Terminal-Trafigura_CorpusChristiPolymers_Valero_Citgo_FlintHillsResources-CorpusChristi_TX_LightHawk_Nov2019-feature.jpg
667
1500
Ted Auch, PhD
https://www.fractracker.org/a5ej20sjfwe/wp-content/uploads/2025/09/2025-Wordmark-Logo.png
Ted Auch, PhD2021-11-05 09:43:472021-11-05 09:47:30Southeastern Texas Petrochemical Industry Needs 318 Billion Gallons of Water, but the US EPA Says Not So Fast https://www.fractracker.org/a5ej20sjfwe/wp-content/uploads/2021/10/Chickahominy-feature.jpg
667
1500
Karen Edelstein
https://www.fractracker.org/a5ej20sjfwe/wp-content/uploads/2025/09/2025-Wordmark-Logo.png
Karen Edelstein2021-11-01 13:29:122021-12-17 11:53:41Chickahominy Pipeline project tries to exploit an apparent regulatory loophole
https://www.fractracker.org/a5ej20sjfwe/wp-content/uploads/2021/10/Chickahominy-feature.jpg
667
1500
Karen Edelstein
https://www.fractracker.org/a5ej20sjfwe/wp-content/uploads/2025/09/2025-Wordmark-Logo.png
Karen Edelstein2021-11-01 13:29:122021-12-17 11:53:41Chickahominy Pipeline project tries to exploit an apparent regulatory loophole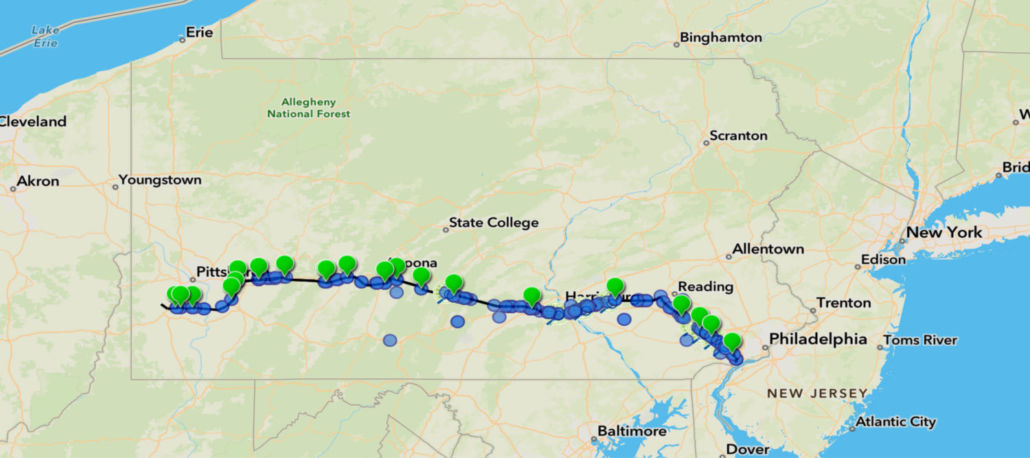 https://www.fractracker.org/a5ej20sjfwe/wp-content/uploads/2021/10/Mariner-East-2-feature.jpg
667
1500
Erica Jackson
https://www.fractracker.org/a5ej20sjfwe/wp-content/uploads/2025/09/2025-Wordmark-Logo.png
Erica Jackson2021-10-29 13:02:432021-11-01 12:17:20Map Update on Criminal Charges Facing Mariner East 2 Pipeline
https://www.fractracker.org/a5ej20sjfwe/wp-content/uploads/2021/10/Mariner-East-2-feature.jpg
667
1500
Erica Jackson
https://www.fractracker.org/a5ej20sjfwe/wp-content/uploads/2025/09/2025-Wordmark-Logo.png
Erica Jackson2021-10-29 13:02:432021-11-01 12:17:20Map Update on Criminal Charges Facing Mariner East 2 Pipeline https://www.fractracker.org/a5ej20sjfwe/wp-content/uploads/2021/09/NRDC-Urban-Drilling-feature.jpg
667
1500
Kyle Ferrar, MPH
https://www.fractracker.org/a5ej20sjfwe/wp-content/uploads/2025/09/2025-Wordmark-Logo.png
Kyle Ferrar, MPH2021-09-14 14:26:442026-04-28 14:29:26It’s Time to Stop Urban Oil Drilling in Los Angeles
https://www.fractracker.org/a5ej20sjfwe/wp-content/uploads/2021/09/NRDC-Urban-Drilling-feature.jpg
667
1500
Kyle Ferrar, MPH
https://www.fractracker.org/a5ej20sjfwe/wp-content/uploads/2025/09/2025-Wordmark-Logo.png
Kyle Ferrar, MPH2021-09-14 14:26:442026-04-28 14:29:26It’s Time to Stop Urban Oil Drilling in Los Angeles https://www.fractracker.org/a5ej20sjfwe/wp-content/uploads/2021/08/Texas-Infrastructure-Feature-.jpg
667
1500
Intern FracTracker
https://www.fractracker.org/a5ej20sjfwe/wp-content/uploads/2025/09/2025-Wordmark-Logo.png
Intern FracTracker2021-09-14 08:00:002022-01-24 17:49:20Infrastructure Networks in Texas
https://www.fractracker.org/a5ej20sjfwe/wp-content/uploads/2021/08/Texas-Infrastructure-Feature-.jpg
667
1500
Intern FracTracker
https://www.fractracker.org/a5ej20sjfwe/wp-content/uploads/2025/09/2025-Wordmark-Logo.png
Intern FracTracker2021-09-14 08:00:002022-01-24 17:49:20Infrastructure Networks in Texas https://www.fractracker.org/a5ej20sjfwe/wp-content/uploads/2021/09/National-Prison-Strike-poster-feature.jpg
667
1500
Kyle Ferrar, MPH
https://www.fractracker.org/a5ej20sjfwe/wp-content/uploads/2025/09/2025-Wordmark-Logo.png
Kyle Ferrar, MPH2021-09-09 08:00:082021-09-08 17:30:46California Prisons are Within 2,500’ of Oil and Gas Extraction
https://www.fractracker.org/a5ej20sjfwe/wp-content/uploads/2021/09/National-Prison-Strike-poster-feature.jpg
667
1500
Kyle Ferrar, MPH
https://www.fractracker.org/a5ej20sjfwe/wp-content/uploads/2025/09/2025-Wordmark-Logo.png
Kyle Ferrar, MPH2021-09-09 08:00:082021-09-08 17:30:46California Prisons are Within 2,500’ of Oil and Gas Extraction https://www.fractracker.org/a5ej20sjfwe/wp-content/uploads/2021/08/kemap.jpg
400
900
Karen Edelstein
https://www.fractracker.org/a5ej20sjfwe/wp-content/uploads/2025/09/2025-Wordmark-Logo.png
Karen Edelstein2021-08-26 11:19:442021-08-26 15:08:04New power plant proposal called senseless and wasteful by climate groups
https://www.fractracker.org/a5ej20sjfwe/wp-content/uploads/2021/08/kemap.jpg
400
900
Karen Edelstein
https://www.fractracker.org/a5ej20sjfwe/wp-content/uploads/2025/09/2025-Wordmark-Logo.png
Karen Edelstein2021-08-26 11:19:442021-08-26 15:08:04New power plant proposal called senseless and wasteful by climate groups https://www.fractracker.org/a5ej20sjfwe/wp-content/uploads/2021/03/Falcon-Ohio-River-Crossing-Feature-A.LauschkeLightHawk-scaled.jpg
667
1500
Erica Jackson
https://www.fractracker.org/a5ej20sjfwe/wp-content/uploads/2025/09/2025-Wordmark-Logo.png
Erica Jackson2021-08-24 07:15:232021-08-23 17:30:12Ongoing Safety Concerns over Shell’s Falcon Pipeline
https://www.fractracker.org/a5ej20sjfwe/wp-content/uploads/2021/03/Falcon-Ohio-River-Crossing-Feature-A.LauschkeLightHawk-scaled.jpg
667
1500
Erica Jackson
https://www.fractracker.org/a5ej20sjfwe/wp-content/uploads/2025/09/2025-Wordmark-Logo.png
Erica Jackson2021-08-24 07:15:232021-08-23 17:30:12Ongoing Safety Concerns over Shell’s Falcon Pipeline https://www.fractracker.org/a5ej20sjfwe/wp-content/uploads/2021/08/BLenker_infrastructure-oilrig-southLA-CA_Oct2017-feature.jpg
667
1500
Kyle Ferrar, MPH
https://www.fractracker.org/a5ej20sjfwe/wp-content/uploads/2025/09/2025-Wordmark-Logo.png
Kyle Ferrar, MPH2021-08-05 16:38:392021-08-05 16:38:39New Neighborhood Drilling Permits Issued While California Fails to Act on Public Health Rules
https://www.fractracker.org/a5ej20sjfwe/wp-content/uploads/2021/08/BLenker_infrastructure-oilrig-southLA-CA_Oct2017-feature.jpg
667
1500
Kyle Ferrar, MPH
https://www.fractracker.org/a5ej20sjfwe/wp-content/uploads/2025/09/2025-Wordmark-Logo.png
Kyle Ferrar, MPH2021-08-05 16:38:392021-08-05 16:38:39New Neighborhood Drilling Permits Issued While California Fails to Act on Public Health Rules https://www.fractracker.org/a5ej20sjfwe/wp-content/uploads/2021/08/Bitcoin-feature.jpg
667
1500
Karen Edelstein
https://www.fractracker.org/a5ej20sjfwe/wp-content/uploads/2025/09/2025-Wordmark-Logo.png
Karen Edelstein2021-08-02 17:05:372022-01-04 10:48:28The world is watching as bitcoin battle brews in the US
https://www.fractracker.org/a5ej20sjfwe/wp-content/uploads/2021/08/Bitcoin-feature.jpg
667
1500
Karen Edelstein
https://www.fractracker.org/a5ej20sjfwe/wp-content/uploads/2025/09/2025-Wordmark-Logo.png
Karen Edelstein2021-08-02 17:05:372022-01-04 10:48:28The world is watching as bitcoin battle brews in the US https://www.fractracker.org/a5ej20sjfwe/wp-content/uploads/2021/07/Lycoming-feature.jpg
667
1500
FracTracker Alliance
https://www.fractracker.org/a5ej20sjfwe/wp-content/uploads/2025/09/2025-Wordmark-Logo.png
FracTracker Alliance2021-07-27 09:58:142021-07-28 11:23:19Lycoming Watershed Digital Atlas
https://www.fractracker.org/a5ej20sjfwe/wp-content/uploads/2021/07/Lycoming-feature.jpg
667
1500
FracTracker Alliance
https://www.fractracker.org/a5ej20sjfwe/wp-content/uploads/2025/09/2025-Wordmark-Logo.png
FracTracker Alliance2021-07-27 09:58:142021-07-28 11:23:19Lycoming Watershed Digital Atlas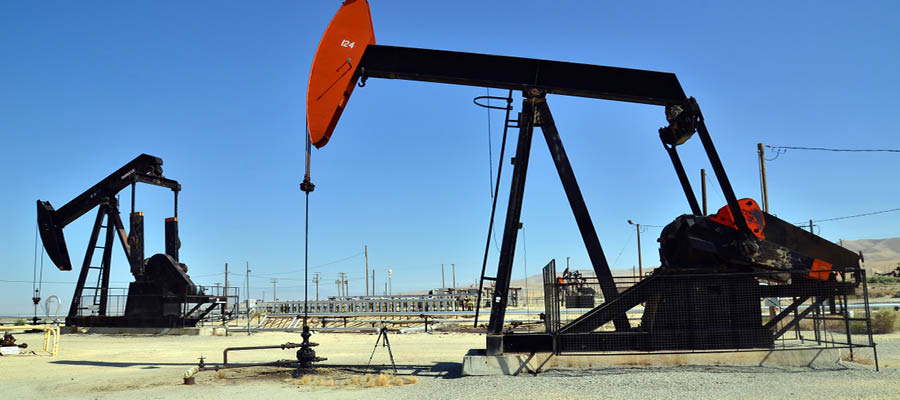 https://www.fractracker.org/a5ej20sjfwe/wp-content/uploads/2021/07/California-oil-drilling-feature.jpg
400
900
Kyle Ferrar, MPH
https://www.fractracker.org/a5ej20sjfwe/wp-content/uploads/2025/09/2025-Wordmark-Logo.png
Kyle Ferrar, MPH2021-07-26 13:56:312021-07-26 14:03:09California Oil & Gas Drilling Permits Drop in Response to Decreased Permit Applications to CalGEM
https://www.fractracker.org/a5ej20sjfwe/wp-content/uploads/2021/07/California-oil-fields-feature.jpg
667
1500
Kyle Ferrar, MPH
https://www.fractracker.org/a5ej20sjfwe/wp-content/uploads/2025/09/2025-Wordmark-Logo.png
Kyle Ferrar, MPH2021-07-20 16:32:222021-07-20 17:36:11California Denies Well Stimulation Permits
https://www.fractracker.org/a5ej20sjfwe/wp-content/uploads/2021/07/California-oil-drilling-feature.jpg
400
900
Kyle Ferrar, MPH
https://www.fractracker.org/a5ej20sjfwe/wp-content/uploads/2025/09/2025-Wordmark-Logo.png
Kyle Ferrar, MPH2021-07-26 13:56:312021-07-26 14:03:09California Oil & Gas Drilling Permits Drop in Response to Decreased Permit Applications to CalGEM
https://www.fractracker.org/a5ej20sjfwe/wp-content/uploads/2021/07/California-oil-fields-feature.jpg
667
1500
Kyle Ferrar, MPH
https://www.fractracker.org/a5ej20sjfwe/wp-content/uploads/2025/09/2025-Wordmark-Logo.png
Kyle Ferrar, MPH2021-07-20 16:32:222021-07-20 17:36:11California Denies Well Stimulation Permits https://www.fractracker.org/a5ej20sjfwe/wp-content/uploads/2021/07/PSR-PFAS-feature.jpg
667
1500
Matt Kelso, BA
https://www.fractracker.org/a5ej20sjfwe/wp-content/uploads/2025/09/2025-Wordmark-Logo.png
Matt Kelso, BA2021-07-15 07:55:282021-07-15 07:55:28Mapping PFAS “Forever Chemicals” in Oil & Gas Operations
https://www.fractracker.org/a5ej20sjfwe/wp-content/uploads/2021/07/PSR-PFAS-feature.jpg
667
1500
Matt Kelso, BA
https://www.fractracker.org/a5ej20sjfwe/wp-content/uploads/2025/09/2025-Wordmark-Logo.png
Matt Kelso, BA2021-07-15 07:55:282021-07-15 07:55:28Mapping PFAS “Forever Chemicals” in Oil & Gas Operations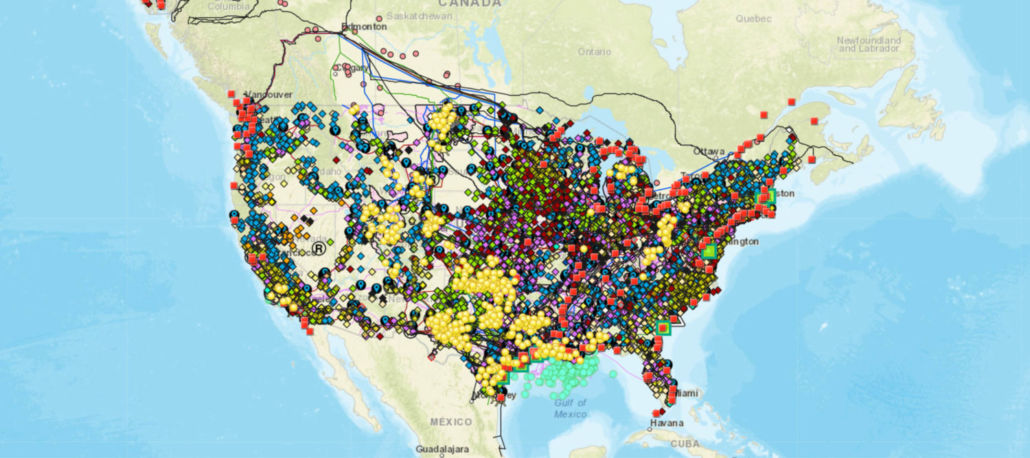 https://www.fractracker.org/a5ej20sjfwe/wp-content/uploads/2021/06/National-Map-2021-Feature.jpg
667
1500
Erica Jackson
https://www.fractracker.org/a5ej20sjfwe/wp-content/uploads/2025/09/2025-Wordmark-Logo.png
Erica Jackson2021-06-30 08:00:252022-05-02 15:24:21Updated National Energy and Petrochemical Map
https://www.fractracker.org/a5ej20sjfwe/wp-content/uploads/2021/06/National-Map-2021-Feature.jpg
667
1500
Erica Jackson
https://www.fractracker.org/a5ej20sjfwe/wp-content/uploads/2025/09/2025-Wordmark-Logo.png
Erica Jackson2021-06-30 08:00:252022-05-02 15:24:21Updated National Energy and Petrochemical Map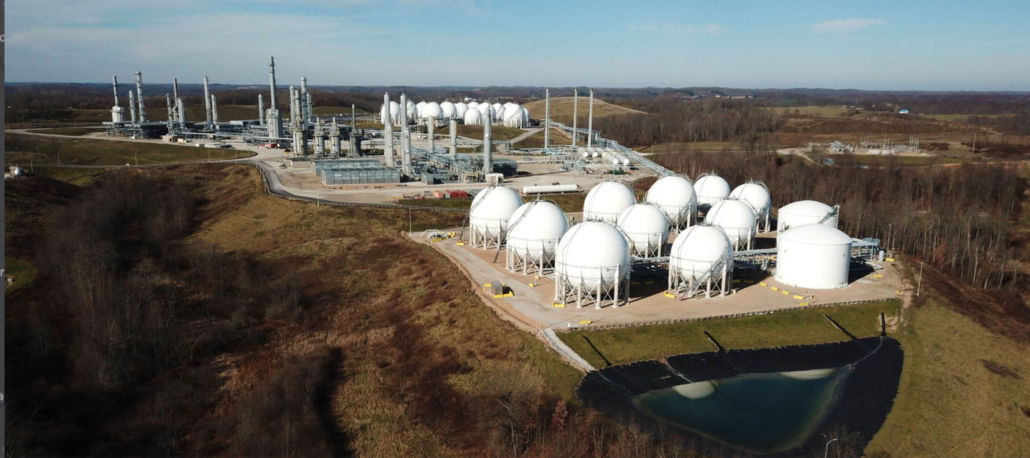 https://www.fractracker.org/a5ej20sjfwe/wp-content/uploads/2021/06/TAuch_Infrastructure-Hopedale_Cryogenic_Plant-MarkWest_Energy-HarrisonCounty-OH_Nov2020-Feature.jpg
667
1500
Ted Auch, PhD
https://www.fractracker.org/a5ej20sjfwe/wp-content/uploads/2025/09/2025-Wordmark-Logo.png
Ted Auch, PhD2021-06-11 12:26:292021-07-01 11:12:42Ohio, West Virginia, Pennsylvania Fracking Story Map
https://www.fractracker.org/a5ej20sjfwe/wp-content/uploads/2021/06/TAuch_Infrastructure-Hopedale_Cryogenic_Plant-MarkWest_Energy-HarrisonCounty-OH_Nov2020-Feature.jpg
667
1500
Ted Auch, PhD
https://www.fractracker.org/a5ej20sjfwe/wp-content/uploads/2025/09/2025-Wordmark-Logo.png
Ted Auch, PhD2021-06-11 12:26:292021-07-01 11:12:42Ohio, West Virginia, Pennsylvania Fracking Story Map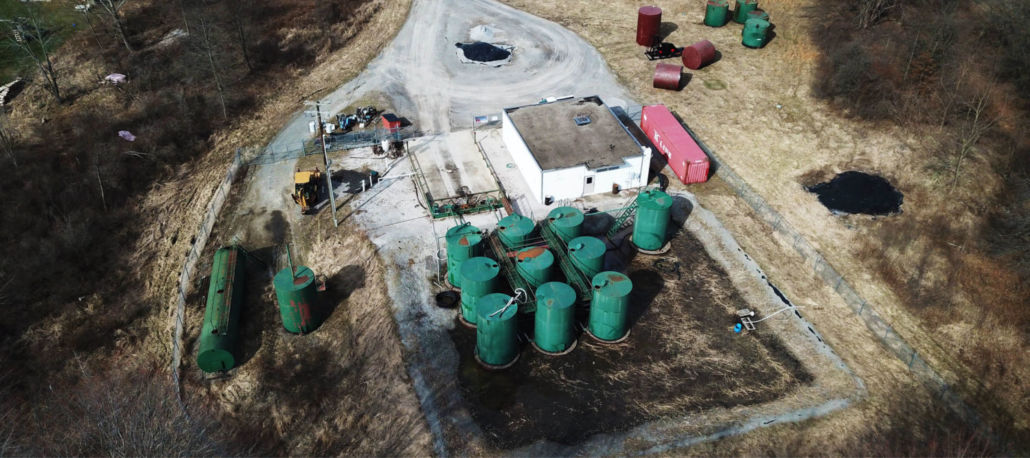 https://www.fractracker.org/a5ej20sjfwe/wp-content/uploads/2021/06/Myers-ClassII-InjectionWell-Stallion-SWD-VikingResources-PortageCounty-OH_March2021-feature.jpg
667
1500
Ted Auch, PhD
https://www.fractracker.org/a5ej20sjfwe/wp-content/uploads/2025/09/2025-Wordmark-Logo.png
Ted Auch, PhD2021-06-03 12:51:592021-06-11 14:02:03Ohio & Fracking Waste: The Case for Better Waste Management
https://www.fractracker.org/a5ej20sjfwe/wp-content/uploads/2021/06/Myers-ClassII-InjectionWell-Stallion-SWD-VikingResources-PortageCounty-OH_March2021-feature.jpg
667
1500
Ted Auch, PhD
https://www.fractracker.org/a5ej20sjfwe/wp-content/uploads/2025/09/2025-Wordmark-Logo.png
Ted Auch, PhD2021-06-03 12:51:592021-06-11 14:02:03Ohio & Fracking Waste: The Case for Better Waste Management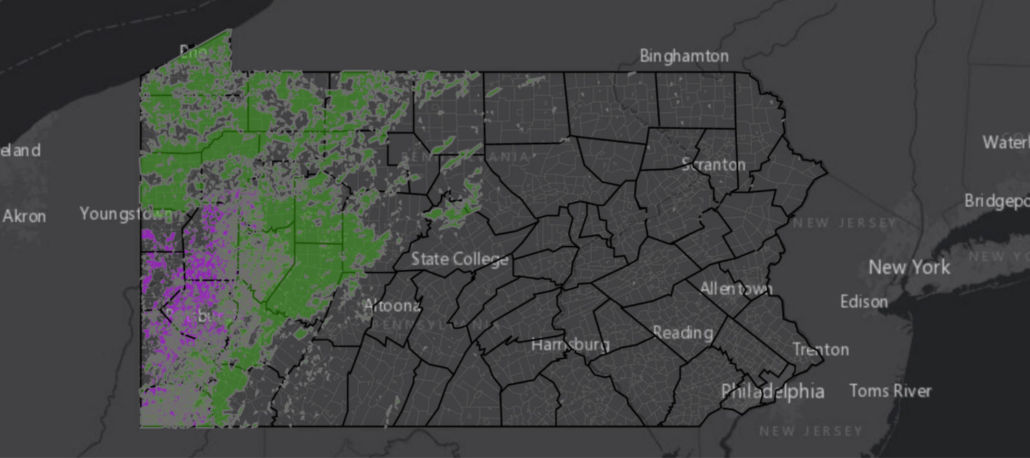 https://www.fractracker.org/a5ej20sjfwe/wp-content/uploads/2021/05/Pennsylvania-conventional-wells-feature.jpg
667
1500
Erica Jackson
https://www.fractracker.org/a5ej20sjfwe/wp-content/uploads/2025/09/2025-Wordmark-Logo.png
Erica Jackson2021-05-27 17:57:282025-04-11 17:29:29Pennsylvania Conventional Well Map Update
https://www.fractracker.org/a5ej20sjfwe/wp-content/uploads/2021/05/Pennsylvania-conventional-wells-feature.jpg
667
1500
Erica Jackson
https://www.fractracker.org/a5ej20sjfwe/wp-content/uploads/2025/09/2025-Wordmark-Logo.png
Erica Jackson2021-05-27 17:57:282025-04-11 17:29:29Pennsylvania Conventional Well Map Update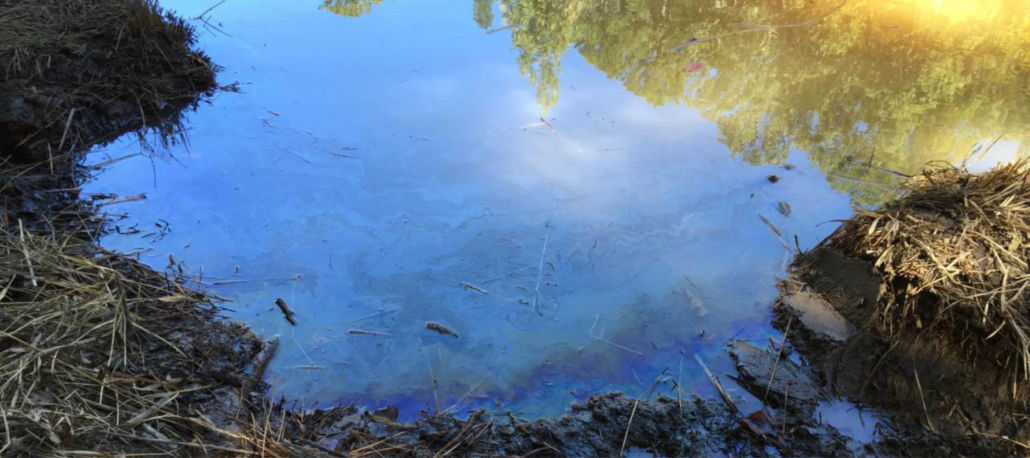 EPA
https://www.fractracker.org/a5ej20sjfwe/wp-content/uploads/2021/05/Colonial-pipeline-spill-feature.jpg
667
1500
Karen Edelstein
https://www.fractracker.org/a5ej20sjfwe/wp-content/uploads/2025/09/2025-Wordmark-Logo.png
Karen Edelstein2021-05-26 07:00:272023-07-18 10:31:34Impacts of 2020 Colonial Pipeline Rupture Continue to Grow
EPA
https://www.fractracker.org/a5ej20sjfwe/wp-content/uploads/2021/05/Colonial-pipeline-spill-feature.jpg
667
1500
Karen Edelstein
https://www.fractracker.org/a5ej20sjfwe/wp-content/uploads/2025/09/2025-Wordmark-Logo.png
Karen Edelstein2021-05-26 07:00:272023-07-18 10:31:34Impacts of 2020 Colonial Pipeline Rupture Continue to Grow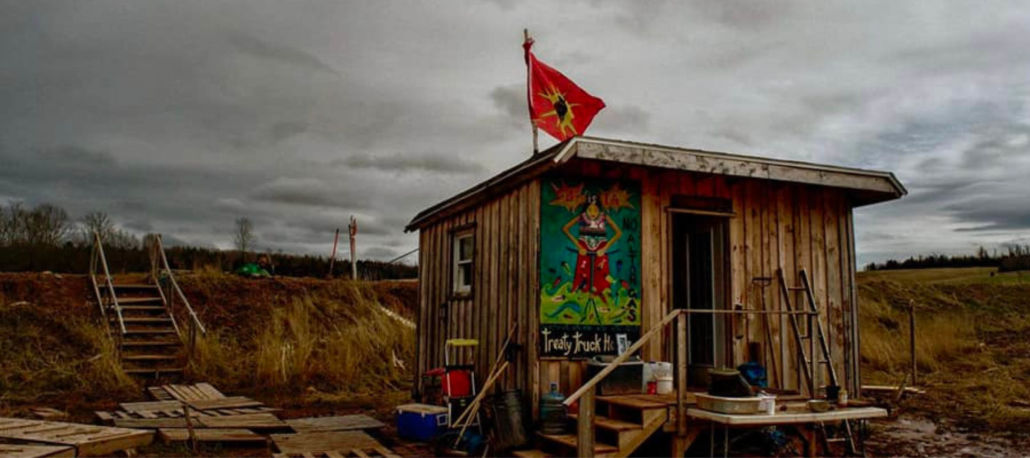 Jared Durelle
https://www.fractracker.org/a5ej20sjfwe/wp-content/uploads/2021/05/Stop-Alton-Gas-Treaty-Truckhouse-feature-photo-by-Jared-Durelle.jpg
667
1500
Karen Edelstein
https://www.fractracker.org/a5ej20sjfwe/wp-content/uploads/2025/09/2025-Wordmark-Logo.png
Karen Edelstein2021-05-20 14:50:522022-01-10 17:07:38Gas Storage Plan vs. Indigenous Rights in Nova Scotia
Jared Durelle
https://www.fractracker.org/a5ej20sjfwe/wp-content/uploads/2021/05/Stop-Alton-Gas-Treaty-Truckhouse-feature-photo-by-Jared-Durelle.jpg
667
1500
Karen Edelstein
https://www.fractracker.org/a5ej20sjfwe/wp-content/uploads/2025/09/2025-Wordmark-Logo.png
Karen Edelstein2021-05-20 14:50:522022-01-10 17:07:38Gas Storage Plan vs. Indigenous Rights in Nova Scotia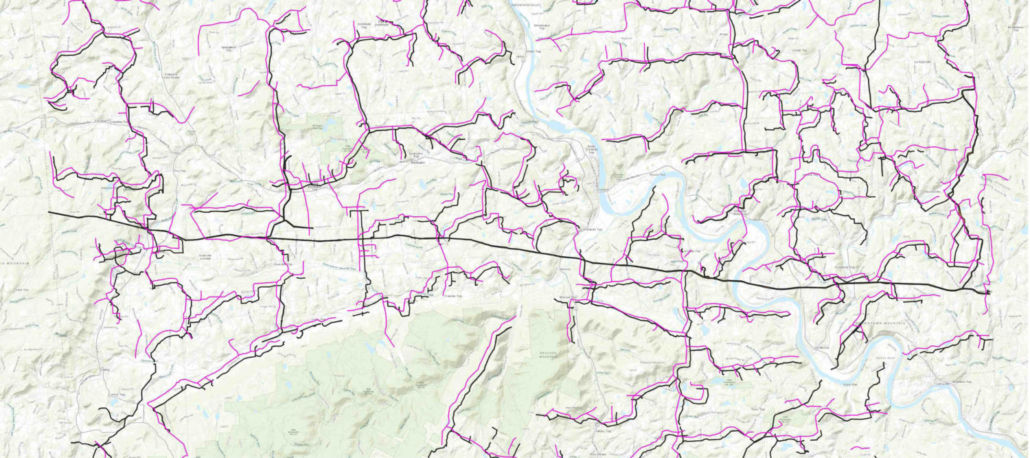 https://www.fractracker.org/a5ej20sjfwe/wp-content/uploads/2021/05/Bradford-County-PA-gathering-lines-feature.jpg
667
1500
Intern FracTracker
https://www.fractracker.org/a5ej20sjfwe/wp-content/uploads/2025/09/2025-Wordmark-Logo.png
Intern FracTracker2021-05-19 10:51:122021-05-20 14:41:22Mapping Gathering Lines in Bradford County, Pennsylvania
https://www.fractracker.org/a5ej20sjfwe/wp-content/uploads/2021/05/Bradford-County-PA-gathering-lines-feature.jpg
667
1500
Intern FracTracker
https://www.fractracker.org/a5ej20sjfwe/wp-content/uploads/2025/09/2025-Wordmark-Logo.png
Intern FracTracker2021-05-19 10:51:122021-05-20 14:41:22Mapping Gathering Lines in Bradford County, Pennsylvania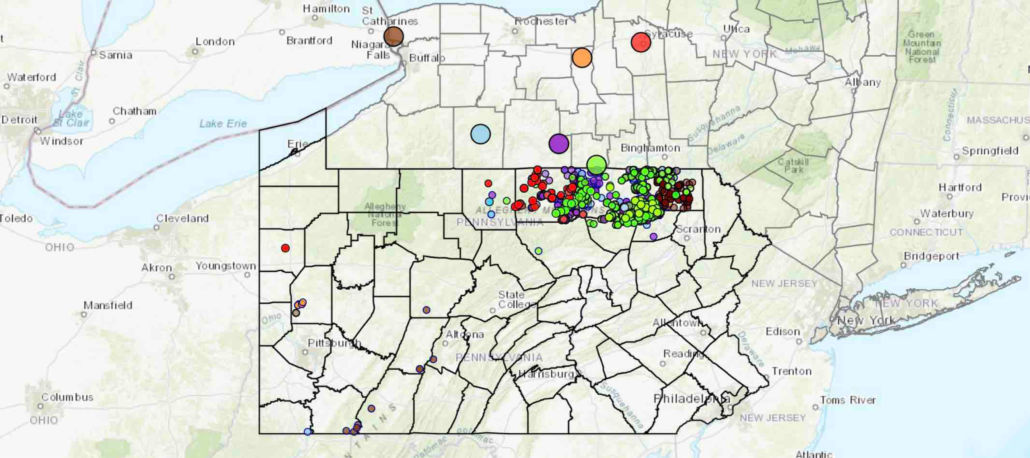 https://www.fractracker.org/a5ej20sjfwe/wp-content/uploads/2021/04/PA-Unconventional-Drilling-Waste-Disposal-in-NYS-2011-20-feature-scaled.jpg
667
1500
Karen Edelstein
https://www.fractracker.org/a5ej20sjfwe/wp-content/uploads/2025/09/2025-Wordmark-Logo.png
Karen Edelstein2021-04-20 14:05:162021-05-19 10:54:04Trends in fracking waste coming to New York State from Pennsylvania
https://www.fractracker.org/a5ej20sjfwe/wp-content/uploads/2021/04/49770601811_6cc7e18996_k.jpg
716
1500
Matt Kelso, BA
https://www.fractracker.org/a5ej20sjfwe/wp-content/uploads/2025/09/2025-Wordmark-Logo.png
Matt Kelso, BA2021-04-14 15:01:522021-04-26 17:02:402021 Pipeline Incidents Update: Safety Record Not Improving
https://www.fractracker.org/a5ej20sjfwe/wp-content/uploads/2021/04/PA-Unconventional-Drilling-Waste-Disposal-in-NYS-2011-20-feature-scaled.jpg
667
1500
Karen Edelstein
https://www.fractracker.org/a5ej20sjfwe/wp-content/uploads/2025/09/2025-Wordmark-Logo.png
Karen Edelstein2021-04-20 14:05:162021-05-19 10:54:04Trends in fracking waste coming to New York State from Pennsylvania
https://www.fractracker.org/a5ej20sjfwe/wp-content/uploads/2021/04/49770601811_6cc7e18996_k.jpg
716
1500
Matt Kelso, BA
https://www.fractracker.org/a5ej20sjfwe/wp-content/uploads/2025/09/2025-Wordmark-Logo.png
Matt Kelso, BA2021-04-14 15:01:522021-04-26 17:02:402021 Pipeline Incidents Update: Safety Record Not Improving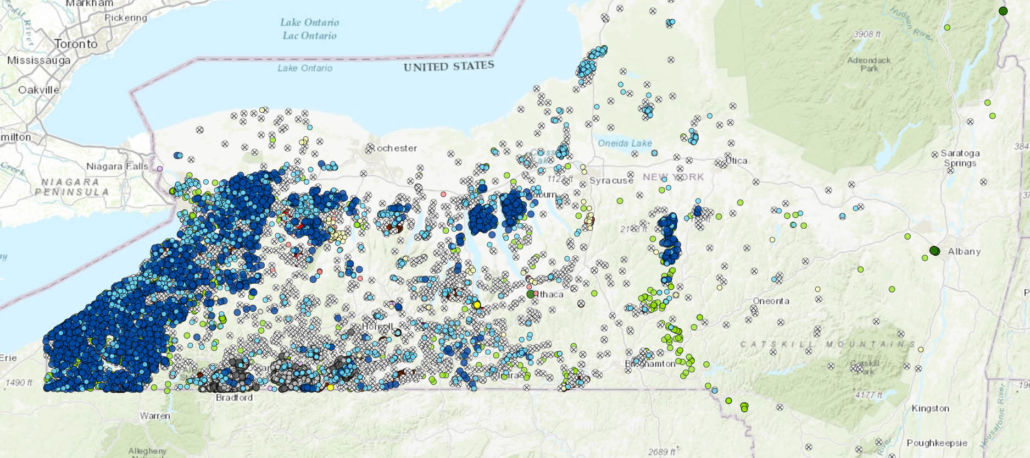 https://www.fractracker.org/a5ej20sjfwe/wp-content/uploads/2021/04/New-York-State-wells-feature.jpg
833
1875
Karen Edelstein
https://www.fractracker.org/a5ej20sjfwe/wp-content/uploads/2025/09/2025-Wordmark-Logo.png
Karen Edelstein2021-04-01 11:10:062021-04-15 14:08:35New York State Oil & Gas Well Drilling: Patterns Over Time
https://www.fractracker.org/a5ej20sjfwe/wp-content/uploads/2021/04/New-York-State-wells-feature.jpg
833
1875
Karen Edelstein
https://www.fractracker.org/a5ej20sjfwe/wp-content/uploads/2025/09/2025-Wordmark-Logo.png
Karen Edelstein2021-04-01 11:10:062021-04-15 14:08:35New York State Oil & Gas Well Drilling: Patterns Over Time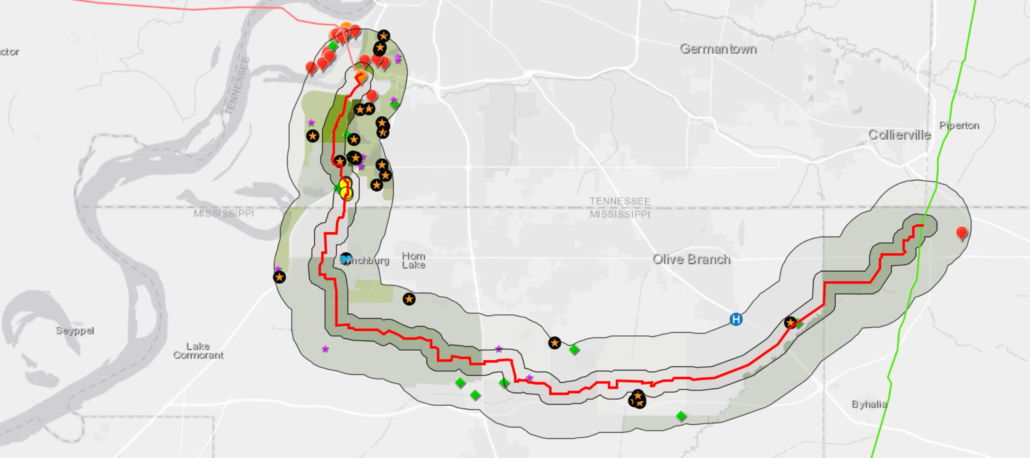 https://www.fractracker.org/a5ej20sjfwe/wp-content/uploads/2021/03/Byhalia-map-feature-2-scaled.jpg
667
1500
Karen Edelstein
https://www.fractracker.org/a5ej20sjfwe/wp-content/uploads/2025/09/2025-Wordmark-Logo.png
Karen Edelstein2021-03-17 17:06:302021-09-16 13:15:25Risky Byhalia Connection Pipeline Threatens Tennessee & Mississippi Health, Water Supply
https://www.fractracker.org/a5ej20sjfwe/wp-content/uploads/2021/03/Falcon-Ohio-River-Crossing-Feature-A.LauschkeLightHawk-scaled.jpg
667
1500
Erica Jackson
https://www.fractracker.org/a5ej20sjfwe/wp-content/uploads/2025/09/2025-Wordmark-Logo.png
Erica Jackson2021-03-17 08:48:432021-04-15 15:11:21Shell’s Falcon Pipeline Under Investigation for Serious Public Safety Threats
https://www.fractracker.org/a5ej20sjfwe/wp-content/uploads/2021/03/Byhalia-map-feature-2-scaled.jpg
667
1500
Karen Edelstein
https://www.fractracker.org/a5ej20sjfwe/wp-content/uploads/2025/09/2025-Wordmark-Logo.png
Karen Edelstein2021-03-17 17:06:302021-09-16 13:15:25Risky Byhalia Connection Pipeline Threatens Tennessee & Mississippi Health, Water Supply
https://www.fractracker.org/a5ej20sjfwe/wp-content/uploads/2021/03/Falcon-Ohio-River-Crossing-Feature-A.LauschkeLightHawk-scaled.jpg
667
1500
Erica Jackson
https://www.fractracker.org/a5ej20sjfwe/wp-content/uploads/2025/09/2025-Wordmark-Logo.png
Erica Jackson2021-03-17 08:48:432021-04-15 15:11:21Shell’s Falcon Pipeline Under Investigation for Serious Public Safety Threats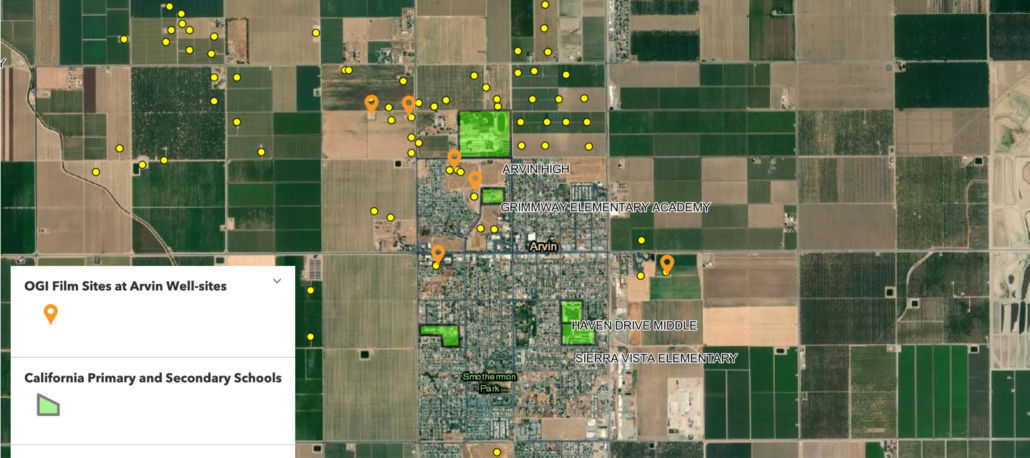 https://www.fractracker.org/a5ej20sjfwe/wp-content/uploads/2021/03/Arvin-CA-well-sites-and-schools-feature-scaled.jpg
667
1500
Kyle Ferrar, MPH
https://www.fractracker.org/a5ej20sjfwe/wp-content/uploads/2025/09/2025-Wordmark-Logo.png
Kyle Ferrar, MPH2021-03-04 15:29:422021-04-15 15:14:45Kern County’s Drafted EIR Will Increase the Burden for Frontline Communities
https://www.fractracker.org/a5ej20sjfwe/wp-content/uploads/2021/03/Arvin-CA-well-sites-and-schools-feature-scaled.jpg
667
1500
Kyle Ferrar, MPH
https://www.fractracker.org/a5ej20sjfwe/wp-content/uploads/2025/09/2025-Wordmark-Logo.png
Kyle Ferrar, MPH2021-03-04 15:29:422021-04-15 15:14:45Kern County’s Drafted EIR Will Increase the Burden for Frontline Communities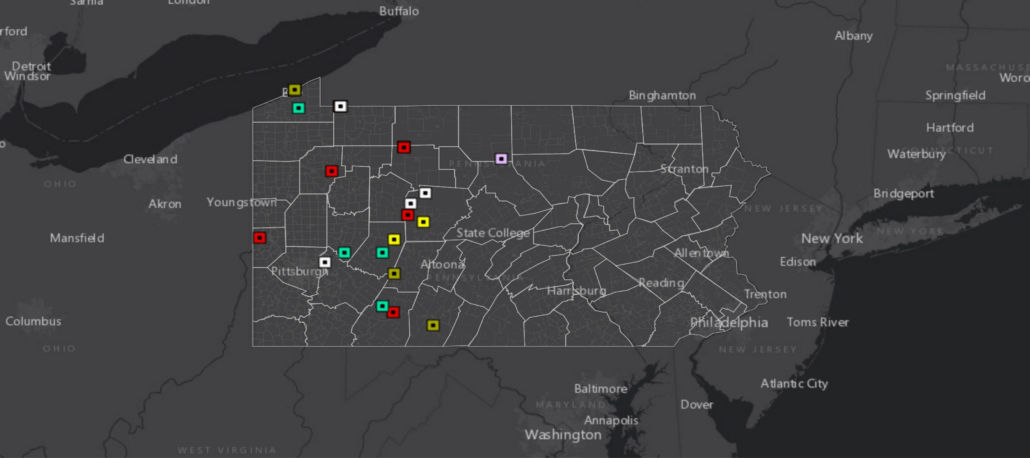 FracTracker Alliance, 2021
https://www.fractracker.org/a5ej20sjfwe/wp-content/uploads/2021/02/Waste-Disposal-Wells-in-Pennsylvania-feature-scaled.jpg
667
1500
Matt Kelso, BA
https://www.fractracker.org/a5ej20sjfwe/wp-content/uploads/2025/09/2025-Wordmark-Logo.png
Matt Kelso, BA2021-02-26 12:23:392021-04-15 14:08:41Pennsylvania’s Waste Disposal Wells – A Tale of Two Datasets
https://www.fractracker.org/a5ej20sjfwe/wp-content/uploads/2021/02/Los-Angeles-skyline-feature-scaled.jpg
667
1500
Kyle Ferrar, MPH
https://www.fractracker.org/a5ej20sjfwe/wp-content/uploads/2025/09/2025-Wordmark-Logo.png
Kyle Ferrar, MPH2021-02-23 14:42:162021-04-15 14:08:42California Oil & Gas Setbacks Recommendations Memo
FracTracker Alliance, 2021
https://www.fractracker.org/a5ej20sjfwe/wp-content/uploads/2021/02/Waste-Disposal-Wells-in-Pennsylvania-feature-scaled.jpg
667
1500
Matt Kelso, BA
https://www.fractracker.org/a5ej20sjfwe/wp-content/uploads/2025/09/2025-Wordmark-Logo.png
Matt Kelso, BA2021-02-26 12:23:392021-04-15 14:08:41Pennsylvania’s Waste Disposal Wells – A Tale of Two Datasets
https://www.fractracker.org/a5ej20sjfwe/wp-content/uploads/2021/02/Los-Angeles-skyline-feature-scaled.jpg
667
1500
Kyle Ferrar, MPH
https://www.fractracker.org/a5ej20sjfwe/wp-content/uploads/2025/09/2025-Wordmark-Logo.png
Kyle Ferrar, MPH2021-02-23 14:42:162021-04-15 14:08:42California Oil & Gas Setbacks Recommendations Memo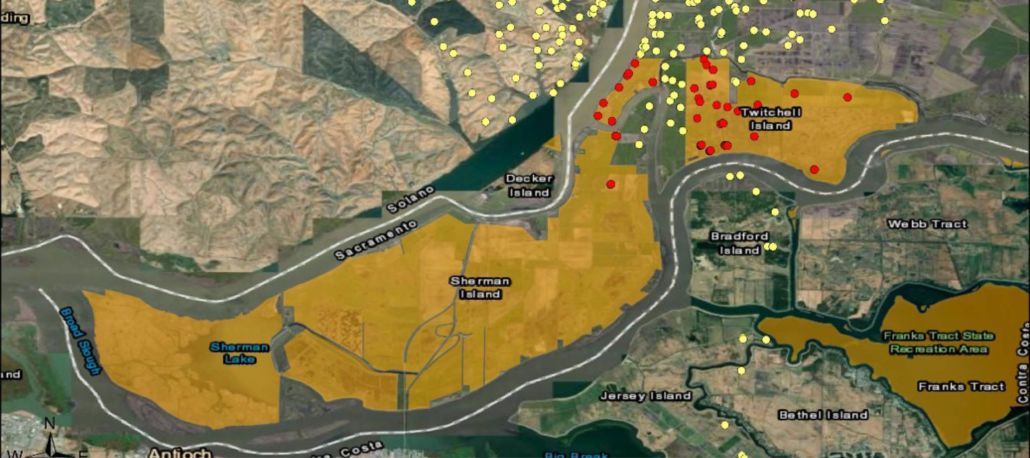 https://www.fractracker.org/a5ej20sjfwe/wp-content/uploads/2021/02/Figure-2.-There-are-50-operational-oil-and-gas-wells-permitted-on-California-state-lands-in-the-Sacramento-River-Delta-feature-scaled.jpg
667
1500
Kyle Ferrar, MPH
https://www.fractracker.org/a5ej20sjfwe/wp-content/uploads/2025/09/2025-Wordmark-Logo.png
Kyle Ferrar, MPH2021-02-12 17:42:002021-04-15 14:08:43Oil and Gas Wells on California State Lands
https://www.fractracker.org/a5ej20sjfwe/wp-content/uploads/2021/02/Figure-2.-There-are-50-operational-oil-and-gas-wells-permitted-on-California-state-lands-in-the-Sacramento-River-Delta-feature-scaled.jpg
667
1500
Kyle Ferrar, MPH
https://www.fractracker.org/a5ej20sjfwe/wp-content/uploads/2025/09/2025-Wordmark-Logo.png
Kyle Ferrar, MPH2021-02-12 17:42:002021-04-15 14:08:43Oil and Gas Wells on California State Lands https://www.fractracker.org/a5ej20sjfwe/wp-content/uploads/2021/03/Control-your-dust-frac-sand-feature-scaled.jpg
667
1500
Ted Auch, PhD
https://www.fractracker.org/a5ej20sjfwe/wp-content/uploads/2025/09/2025-Wordmark-Logo.png
Ted Auch, PhD2021-01-29 10:30:092026-04-14 11:55:22Industrial Impacts in Michigan: A Photo Essay & Story Map
https://www.fractracker.org/a5ej20sjfwe/wp-content/uploads/2021/03/Control-your-dust-frac-sand-feature-scaled.jpg
667
1500
Ted Auch, PhD
https://www.fractracker.org/a5ej20sjfwe/wp-content/uploads/2025/09/2025-Wordmark-Logo.png
Ted Auch, PhD2021-01-29 10:30:092026-04-14 11:55:22Industrial Impacts in Michigan: A Photo Essay & Story Map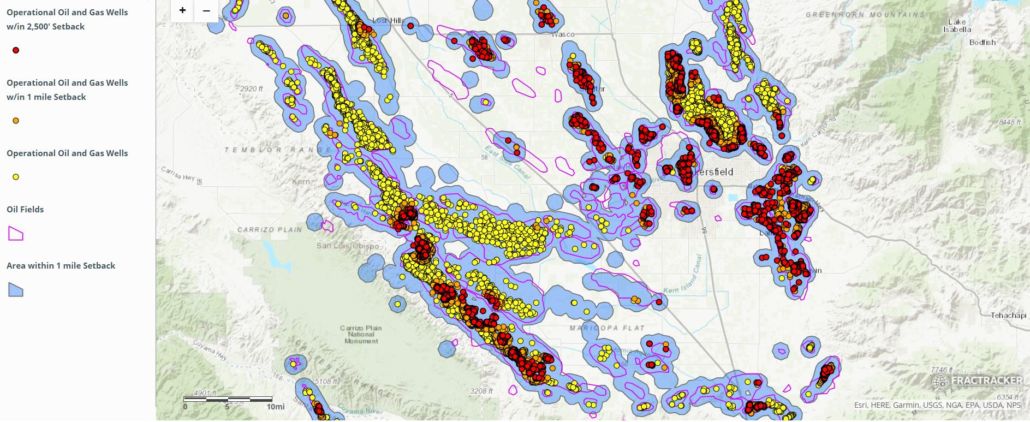 https://www.fractracker.org/a5ej20sjfwe/wp-content/uploads/2020/12/CASetbacksMappic.jpg
614
1500
Kyle Ferrar, MPH
https://www.fractracker.org/a5ej20sjfwe/wp-content/uploads/2025/09/2025-Wordmark-Logo.png
Kyle Ferrar, MPH2020-12-17 13:45:242021-04-15 14:16:02People and Production: Reducing Risk in California Extraction
https://www.fractracker.org/a5ej20sjfwe/wp-content/uploads/2020/12/CASetbacksMappic.jpg
614
1500
Kyle Ferrar, MPH
https://www.fractracker.org/a5ej20sjfwe/wp-content/uploads/2025/09/2025-Wordmark-Logo.png
Kyle Ferrar, MPH2020-12-17 13:45:242021-04-15 14:16:02People and Production: Reducing Risk in California Extraction https://www.fractracker.org/a5ej20sjfwe/wp-content/uploads/2019/08/EQT-Tioga-Wide-7.gif
300
800
Kyle Ferrar, MPH
https://www.fractracker.org/a5ej20sjfwe/wp-content/uploads/2025/09/2025-Wordmark-Logo.png
Kyle Ferrar, MPH2020-11-18 12:40:132021-04-15 14:16:04Documenting emissions from new oil and gas wells in California
https://www.fractracker.org/a5ej20sjfwe/wp-content/uploads/2019/08/EQT-Tioga-Wide-7.gif
300
800
Kyle Ferrar, MPH
https://www.fractracker.org/a5ej20sjfwe/wp-content/uploads/2025/09/2025-Wordmark-Logo.png
Kyle Ferrar, MPH2020-11-18 12:40:132021-04-15 14:16:04Documenting emissions from new oil and gas wells in California https://www.fractracker.org/a5ej20sjfwe/wp-content/uploads/2020/10/TAuch_infrastructure-wellpad-sandtruck-ChesapeakeAppalachia-RainSulWellpad-SullivanCounty-PA_July2020-feature-scaled.jpg
667
1500
Ted Auch, PhD
https://www.fractracker.org/a5ej20sjfwe/wp-content/uploads/2025/09/2025-Wordmark-Logo.png
Ted Auch, PhD2020-10-15 11:24:272021-04-15 14:16:07Energy Security, International Investment, and Democracy in the US Shale Oil & Gas Industry
https://www.fractracker.org/a5ej20sjfwe/wp-content/uploads/2020/10/TAuch_infrastructure-wellpad-sandtruck-ChesapeakeAppalachia-RainSulWellpad-SullivanCounty-PA_July2020-feature-scaled.jpg
667
1500
Ted Auch, PhD
https://www.fractracker.org/a5ej20sjfwe/wp-content/uploads/2025/09/2025-Wordmark-Logo.png
Ted Auch, PhD2020-10-15 11:24:272021-04-15 14:16:07Energy Security, International Investment, and Democracy in the US Shale Oil & Gas Industry https://www.fractracker.org/a5ej20sjfwe/wp-content/uploads/2020/08/Loyalsock-feature-scaled.jpg
667
1500
Shannon Smith
https://www.fractracker.org/a5ej20sjfwe/wp-content/uploads/2025/09/2025-Wordmark-Logo.png
Shannon Smith2020-08-04 18:44:392023-01-17 10:30:44The Loyalsock Watershed Project
https://www.fractracker.org/a5ej20sjfwe/wp-content/uploads/2020/08/Loyalsock-feature-scaled.jpg
667
1500
Shannon Smith
https://www.fractracker.org/a5ej20sjfwe/wp-content/uploads/2025/09/2025-Wordmark-Logo.png
Shannon Smith2020-08-04 18:44:392023-01-17 10:30:44The Loyalsock Watershed Project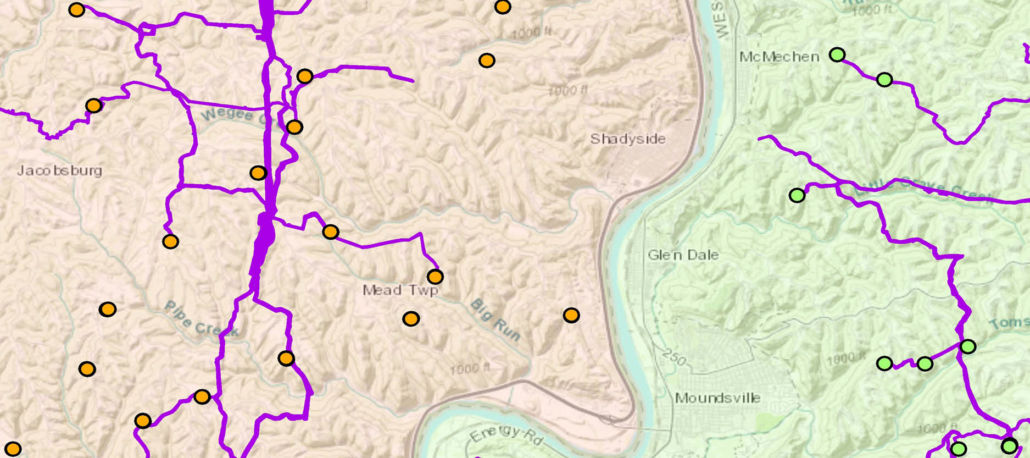 https://www.fractracker.org/a5ej20sjfwe/wp-content/uploads/2020/07/Mapping-gathering-lines-in-OH-and-WV-feature.jpg
833
1875
Intern FracTracker
https://www.fractracker.org/a5ej20sjfwe/wp-content/uploads/2025/09/2025-Wordmark-Logo.png
Intern FracTracker2020-07-02 12:09:192025-05-02 14:45:00Mapping Gathering Lines in Ohio and West Virginia
https://www.fractracker.org/a5ej20sjfwe/wp-content/uploads/2020/07/Mapping-gathering-lines-in-OH-and-WV-feature.jpg
833
1875
Intern FracTracker
https://www.fractracker.org/a5ej20sjfwe/wp-content/uploads/2025/09/2025-Wordmark-Logo.png
Intern FracTracker2020-07-02 12:09:192025-05-02 14:45:00Mapping Gathering Lines in Ohio and West Virginia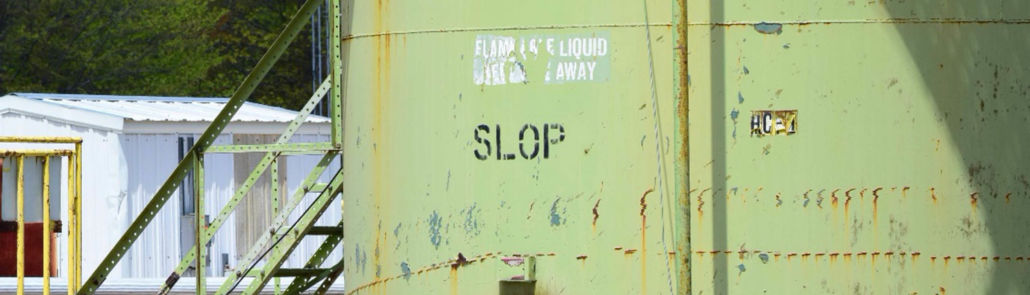 https://www.fractracker.org/a5ej20sjfwe/wp-content/uploads/2020/06/Oil-Gas-waste-tank-in-Michigan-feature-scaled.jpg
430
1500
Ted Auch, PhD
https://www.fractracker.org/a5ej20sjfwe/wp-content/uploads/2025/09/2025-Wordmark-Logo.png
Ted Auch, PhD2020-06-18 10:24:572021-04-15 14:16:44The North Dakota Shale Viewer Reimagined: Mapping the Water and Waste Impact
https://www.fractracker.org/a5ej20sjfwe/wp-content/uploads/2020/06/Oil-Gas-waste-tank-in-Michigan-feature-scaled.jpg
430
1500
Ted Auch, PhD
https://www.fractracker.org/a5ej20sjfwe/wp-content/uploads/2025/09/2025-Wordmark-Logo.png
Ted Auch, PhD2020-06-18 10:24:572021-04-15 14:16:44The North Dakota Shale Viewer Reimagined: Mapping the Water and Waste Impact https://www.fractracker.org/a5ej20sjfwe/wp-content/uploads/2020/06/FalconPipelineFrontPage-scaled.jpg
430
1500
Erica Jackson
https://www.fractracker.org/a5ej20sjfwe/wp-content/uploads/2025/09/2025-Wordmark-Logo.png
Erica Jackson2020-06-16 11:47:062021-04-15 14:16:44Falcon Pipeline Construction Releases over 250,000 Gallons of Drilling Fluid in Pennsylvania and Ohio
https://www.fractracker.org/a5ej20sjfwe/wp-content/uploads/2020/06/FalconPipelineFrontPage-scaled.jpg
430
1500
Erica Jackson
https://www.fractracker.org/a5ej20sjfwe/wp-content/uploads/2025/09/2025-Wordmark-Logo.png
Erica Jackson2020-06-16 11:47:062021-04-15 14:16:44Falcon Pipeline Construction Releases over 250,000 Gallons of Drilling Fluid in Pennsylvania and Ohio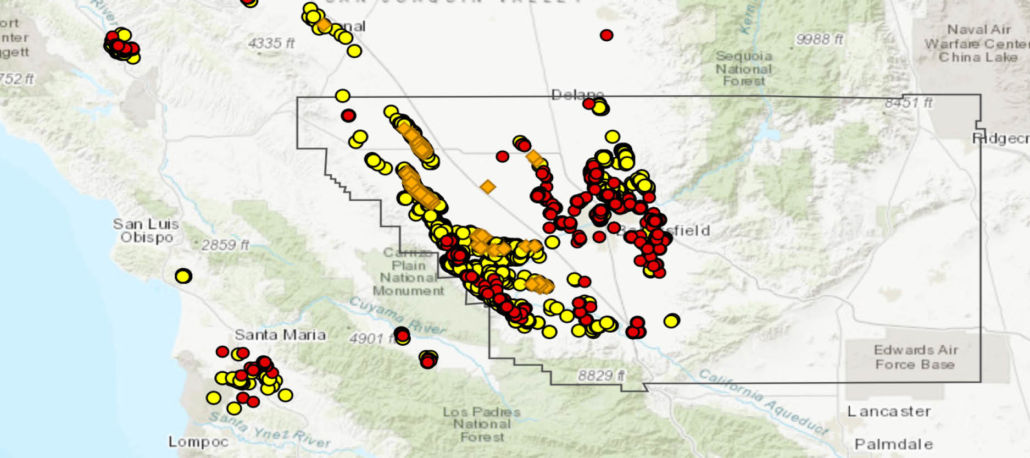 https://www.fractracker.org/a5ej20sjfwe/wp-content/uploads/2020/06/CalGEM-Drilling-and-Rework-Permits-2015-2020-feature.jpg
833
1875
Kyle Ferrar, MPH
https://www.fractracker.org/a5ej20sjfwe/wp-content/uploads/2025/09/2025-Wordmark-Logo.png
Kyle Ferrar, MPH2020-06-08 08:44:542021-04-15 14:16:46Systematic Racism in Kern County Oil and Gas Permitting Ordinance
https://www.fractracker.org/a5ej20sjfwe/wp-content/uploads/2020/06/CalGEM-Drilling-and-Rework-Permits-2015-2020-feature.jpg
833
1875
Kyle Ferrar, MPH
https://www.fractracker.org/a5ej20sjfwe/wp-content/uploads/2025/09/2025-Wordmark-Logo.png
Kyle Ferrar, MPH2020-06-08 08:44:542021-04-15 14:16:46Systematic Racism in Kern County Oil and Gas Permitting Ordinance https://www.fractracker.org/a5ej20sjfwe/wp-content/uploads/2020/05/waterfall-1806956_1920.jpg
724
1500
Matt Kelso, BA
https://www.fractracker.org/a5ej20sjfwe/wp-content/uploads/2025/09/2025-Wordmark-Logo.png
Matt Kelso, BA2020-05-29 16:22:102021-04-15 14:16:48Fracking Water Use in Pennsylvania Increases Dramatically
https://www.fractracker.org/a5ej20sjfwe/wp-content/uploads/2020/05/waterfall-1806956_1920.jpg
724
1500
Matt Kelso, BA
https://www.fractracker.org/a5ej20sjfwe/wp-content/uploads/2025/09/2025-Wordmark-Logo.png
Matt Kelso, BA2020-05-29 16:22:102021-04-15 14:16:48Fracking Water Use in Pennsylvania Increases Dramatically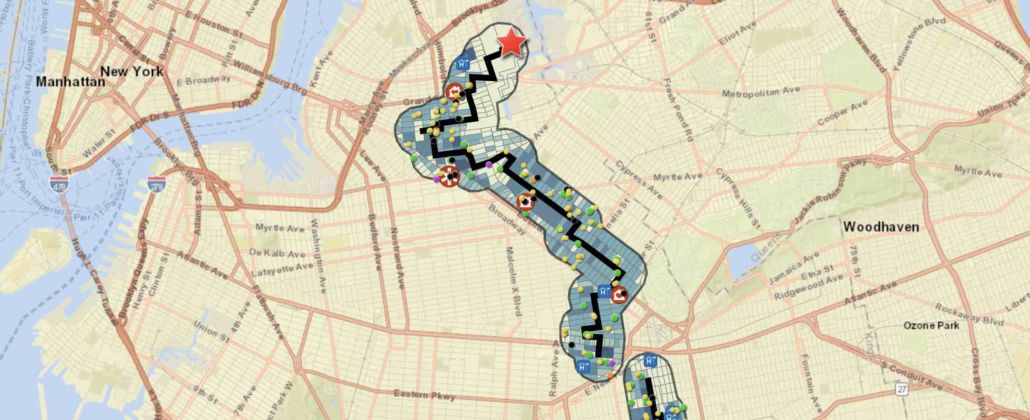 https://www.fractracker.org/a5ej20sjfwe/wp-content/uploads/2020/05/North-Brooklyn-Pipeline-demographics_1.jpg
914
2242
Guest Author
https://www.fractracker.org/a5ej20sjfwe/wp-content/uploads/2025/09/2025-Wordmark-Logo.png
Guest Author2020-05-18 09:00:212021-04-15 14:16:48New Yorkers mount resistance against North Brooklyn Pipeline
https://www.fractracker.org/a5ej20sjfwe/wp-content/uploads/2020/05/North-Brooklyn-Pipeline-demographics_1.jpg
914
2242
Guest Author
https://www.fractracker.org/a5ej20sjfwe/wp-content/uploads/2025/09/2025-Wordmark-Logo.png
Guest Author2020-05-18 09:00:212021-04-15 14:16:48New Yorkers mount resistance against North Brooklyn Pipeline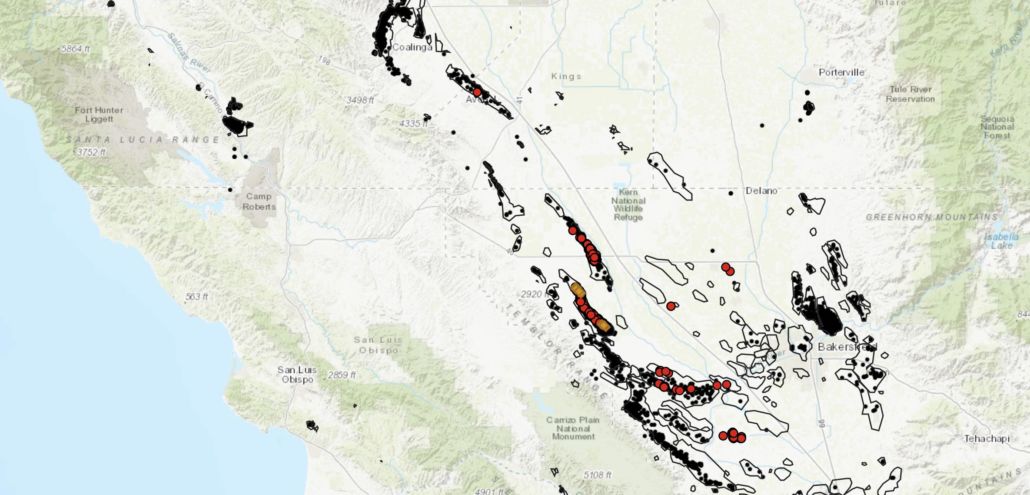 https://www.fractracker.org/a5ej20sjfwe/wp-content/uploads/2020/04/Map-of-New-2020-Fracking-Permits-in-California.jpg
720
1500
Kyle Ferrar, MPH
https://www.fractracker.org/a5ej20sjfwe/wp-content/uploads/2025/09/2025-Wordmark-Logo.png
Kyle Ferrar, MPH2020-05-07 12:48:132021-04-15 14:16:49California, Back in Frack
https://www.fractracker.org/a5ej20sjfwe/wp-content/uploads/2020/04/California-well-pad.jpg
666
1500
Kyle Ferrar, MPH
https://www.fractracker.org/a5ej20sjfwe/wp-content/uploads/2025/09/2025-Wordmark-Logo.png
Kyle Ferrar, MPH2020-04-02 10:20:422021-04-15 14:16:50California Setback Analyses Summary
https://www.fractracker.org/a5ej20sjfwe/wp-content/uploads/2020/04/Map-of-New-2020-Fracking-Permits-in-California.jpg
720
1500
Kyle Ferrar, MPH
https://www.fractracker.org/a5ej20sjfwe/wp-content/uploads/2025/09/2025-Wordmark-Logo.png
Kyle Ferrar, MPH2020-05-07 12:48:132021-04-15 14:16:49California, Back in Frack
https://www.fractracker.org/a5ej20sjfwe/wp-content/uploads/2020/04/California-well-pad.jpg
666
1500
Kyle Ferrar, MPH
https://www.fractracker.org/a5ej20sjfwe/wp-content/uploads/2025/09/2025-Wordmark-Logo.png
Kyle Ferrar, MPH2020-04-02 10:20:422021-04-15 14:16:50California Setback Analyses Summary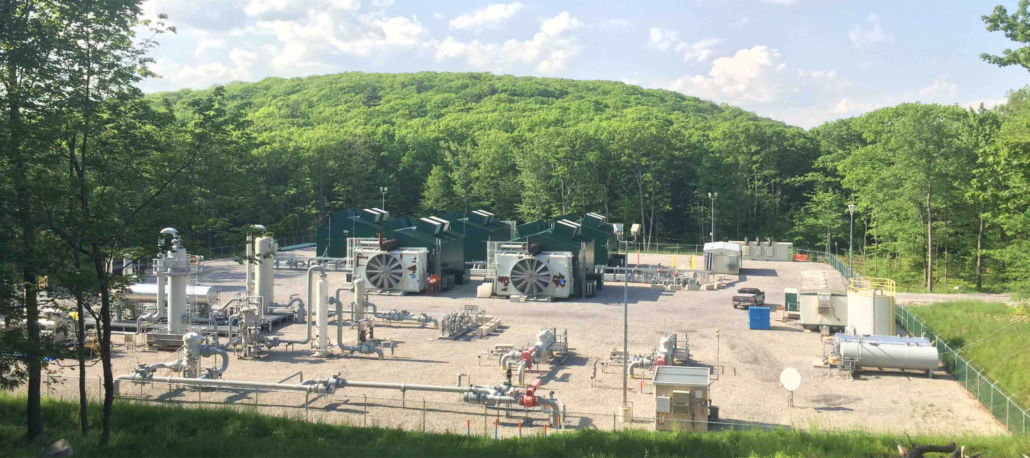 https://www.fractracker.org/a5ej20sjfwe/wp-content/uploads/2020/03/Compressor-station-within-Loyalsock-State-Forest-PA-scaled.jpg
667
1500
Guest Author
https://www.fractracker.org/a5ej20sjfwe/wp-content/uploads/2025/09/2025-Wordmark-Logo.png
Guest Author2020-03-19 13:16:212021-04-15 14:16:51Air Pollution from Pennsylvania Shale Gas Compressor Stations – REPORT
https://www.fractracker.org/a5ej20sjfwe/wp-content/uploads/2020/03/Compressor-station-within-Loyalsock-State-Forest-PA-scaled.jpg
667
1500
Guest Author
https://www.fractracker.org/a5ej20sjfwe/wp-content/uploads/2025/09/2025-Wordmark-Logo.png
Guest Author2020-03-19 13:16:212021-04-15 14:16:51Air Pollution from Pennsylvania Shale Gas Compressor Stations – REPORT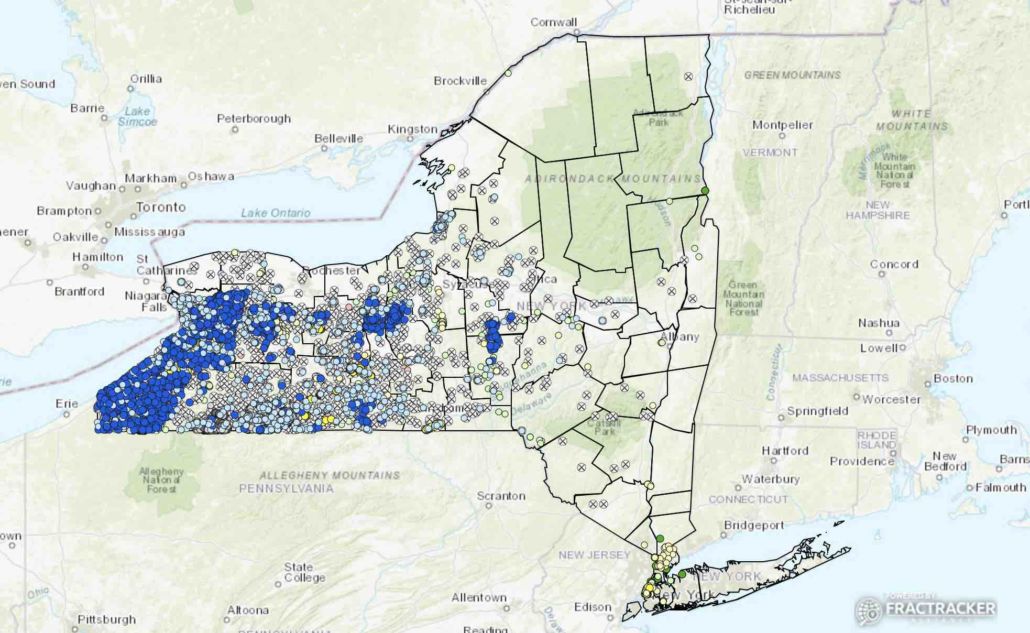 https://www.fractracker.org/a5ej20sjfwe/wp-content/uploads/2020/03/New-York-State-Oil-Gas-Well-Viewer-2020.jpg
1208
1966
Karen Edelstein
https://www.fractracker.org/a5ej20sjfwe/wp-content/uploads/2025/09/2025-Wordmark-Logo.png
Karen Edelstein2020-03-11 12:07:052021-04-15 14:16:54New York State Oil & Gas Wells – 2020 Update
https://www.fractracker.org/a5ej20sjfwe/wp-content/uploads/2020/03/New-York-State-Oil-Gas-Well-Viewer-2020.jpg
1208
1966
Karen Edelstein
https://www.fractracker.org/a5ej20sjfwe/wp-content/uploads/2025/09/2025-Wordmark-Logo.png
Karen Edelstein2020-03-11 12:07:052021-04-15 14:16:54New York State Oil & Gas Wells – 2020 Update https://www.fractracker.org/a5ej20sjfwe/wp-content/uploads/2020/02/National-map-feature-3.png
400
900
Erica Jackson
https://www.fractracker.org/a5ej20sjfwe/wp-content/uploads/2025/09/2025-Wordmark-Logo.png
Erica Jackson2020-02-28 17:35:142022-05-02 15:21:42National Energy and Petrochemical Map
https://www.fractracker.org/a5ej20sjfwe/wp-content/uploads/2020/02/National-map-feature-3.png
400
900
Erica Jackson
https://www.fractracker.org/a5ej20sjfwe/wp-content/uploads/2025/09/2025-Wordmark-Logo.png
Erica Jackson2020-02-28 17:35:142022-05-02 15:21:42National Energy and Petrochemical Map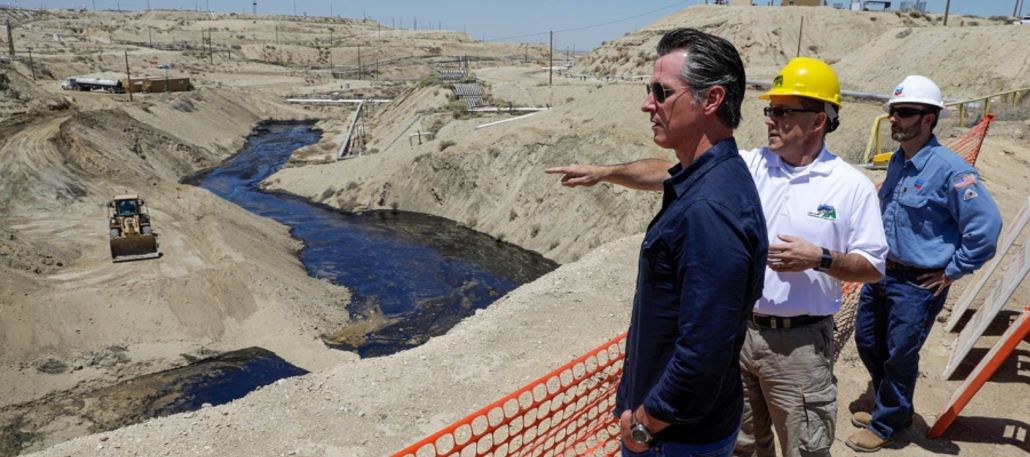 https://www.fractracker.org/a5ej20sjfwe/wp-content/uploads/2020/01/California-Governor-Gavin-Newsom--scaled.jpg
666
1500
Kyle Ferrar, MPH
https://www.fractracker.org/a5ej20sjfwe/wp-content/uploads/2025/09/2025-Wordmark-Logo.png
Kyle Ferrar, MPH2020-02-24 10:09:182021-04-15 14:55:29Governor Newsom Must Do More to Address the Cause of Oil Spill Surface Expressions
https://www.fractracker.org/a5ej20sjfwe/wp-content/uploads/2020/01/California-Governor-Gavin-Newsom--scaled.jpg
666
1500
Kyle Ferrar, MPH
https://www.fractracker.org/a5ej20sjfwe/wp-content/uploads/2025/09/2025-Wordmark-Logo.png
Kyle Ferrar, MPH2020-02-24 10:09:182021-04-15 14:55:29Governor Newsom Must Do More to Address the Cause of Oil Spill Surface Expressions https://www.fractracker.org/a5ej20sjfwe/wp-content/uploads/2020/02/Screen-Shot-2020-02-21-at-2.22.05-PM.png
674
1500
Kyle Ferrar, MPH
https://www.fractracker.org/a5ej20sjfwe/wp-content/uploads/2025/09/2025-Wordmark-Logo.png
Kyle Ferrar, MPH2020-02-22 13:29:222021-04-15 14:55:30Oil & Gas Well Permits Issued By Newsom Administration Rival Those Issued Under Gov. Jerry Brown
https://www.fractracker.org/a5ej20sjfwe/wp-content/uploads/2020/02/Screen-Shot-2020-02-21-at-2.22.05-PM.png
674
1500
Kyle Ferrar, MPH
https://www.fractracker.org/a5ej20sjfwe/wp-content/uploads/2025/09/2025-Wordmark-Logo.png
Kyle Ferrar, MPH2020-02-22 13:29:222021-04-15 14:55:30Oil & Gas Well Permits Issued By Newsom Administration Rival Those Issued Under Gov. Jerry Brown https://www.fractracker.org/a5ej20sjfwe/wp-content/uploads/2019/02/San-Bruno-Aftermath-feature-image.png
400
900
Matt Kelso, BA
https://www.fractracker.org/a5ej20sjfwe/wp-content/uploads/2025/09/2025-Wordmark-Logo.png
Matt Kelso, BA2020-02-21 16:13:542021-04-15 14:55:30Pipelines Continue to Catch Fire and Explode
https://www.fractracker.org/a5ej20sjfwe/wp-content/uploads/2019/02/San-Bruno-Aftermath-feature-image.png
400
900
Matt Kelso, BA
https://www.fractracker.org/a5ej20sjfwe/wp-content/uploads/2025/09/2025-Wordmark-Logo.png
Matt Kelso, BA2020-02-21 16:13:542021-04-15 14:55:30Pipelines Continue to Catch Fire and Explode https://www.fractracker.org/a5ej20sjfwe/wp-content/uploads/2020/01/Brookfield-scaled.jpg
667
1500
Ted Auch, PhD
https://www.fractracker.org/a5ej20sjfwe/wp-content/uploads/2025/09/2025-Wordmark-Logo.png
Ted Auch, PhD2020-01-13 17:51:102021-04-15 14:55:31The Hidden Inefficiencies and Environmental Costs of Fracking in Ohio
https://www.fractracker.org/a5ej20sjfwe/wp-content/uploads/2020/01/Brookfield-scaled.jpg
667
1500
Ted Auch, PhD
https://www.fractracker.org/a5ej20sjfwe/wp-content/uploads/2025/09/2025-Wordmark-Logo.png
Ted Auch, PhD2020-01-13 17:51:102021-04-15 14:55:31The Hidden Inefficiencies and Environmental Costs of Fracking in Ohio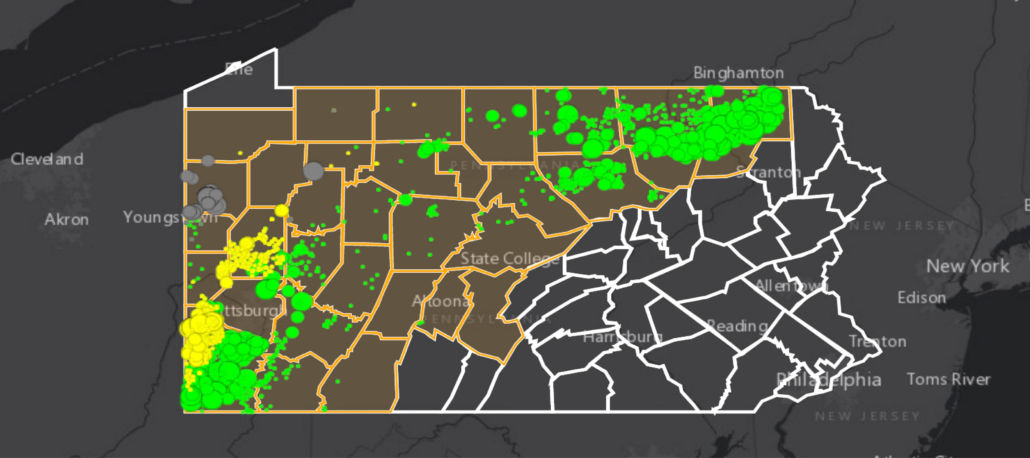 https://www.fractracker.org/a5ej20sjfwe/wp-content/uploads/2020/01/PA-2019-Fracked-Gas-Production-Feature-scaled.jpg
667
1500
Matt Kelso, BA
https://www.fractracker.org/a5ej20sjfwe/wp-content/uploads/2025/09/2025-Wordmark-Logo.png
Matt Kelso, BA2020-01-07 18:02:382021-04-15 14:55:32Fracking in Pennsylvania: Not Worth It
https://www.fractracker.org/a5ej20sjfwe/wp-content/uploads/2020/01/PA-2019-Fracked-Gas-Production-Feature-scaled.jpg
667
1500
Matt Kelso, BA
https://www.fractracker.org/a5ej20sjfwe/wp-content/uploads/2025/09/2025-Wordmark-Logo.png
Matt Kelso, BA2020-01-07 18:02:382021-04-15 14:55:32Fracking in Pennsylvania: Not Worth It Photo by Ted Auch, FracTracker Alliance
https://www.fractracker.org/a5ej20sjfwe/wp-content/uploads/2019/12/Captina-Creek-Watershed-Feature.jpg
533
1200
Ted Auch, PhD
https://www.fractracker.org/a5ej20sjfwe/wp-content/uploads/2025/09/2025-Wordmark-Logo.png
Ted Auch, PhD2019-12-20 09:49:212021-04-15 14:55:33Fracking Threatens Ohio’s Captina Creek Watershed
Photo by Ted Auch, FracTracker Alliance
https://www.fractracker.org/a5ej20sjfwe/wp-content/uploads/2019/12/Captina-Creek-Watershed-Feature.jpg
533
1200
Ted Auch, PhD
https://www.fractracker.org/a5ej20sjfwe/wp-content/uploads/2025/09/2025-Wordmark-Logo.png
Ted Auch, PhD2019-12-20 09:49:212021-04-15 14:55:33Fracking Threatens Ohio’s Captina Creek Watershed https://www.fractracker.org/a5ej20sjfwe/wp-content/uploads/2019/11/Newsom-Well-Watch-Feature-scaled.jpg
667
1500
Kyle Ferrar, MPH
https://www.fractracker.org/a5ej20sjfwe/wp-content/uploads/2025/09/2025-Wordmark-Logo.png
Kyle Ferrar, MPH2019-11-19 20:06:282021-04-15 14:55:36California is Frack Free, for the Moment
https://www.fractracker.org/a5ej20sjfwe/wp-content/uploads/2019/11/Newsom-Well-Watch-Feature-scaled.jpg
667
1500
Kyle Ferrar, MPH
https://www.fractracker.org/a5ej20sjfwe/wp-content/uploads/2025/09/2025-Wordmark-Logo.png
Kyle Ferrar, MPH2019-11-19 20:06:282021-04-15 14:55:36California is Frack Free, for the Moment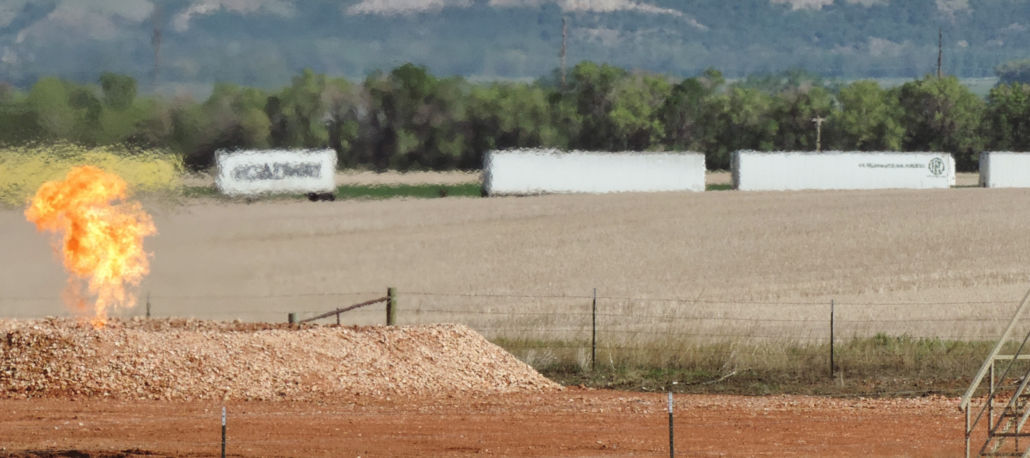 https://www.fractracker.org/a5ej20sjfwe/wp-content/uploads/2019/10/Oil-and-gas-drilling-in-ND.-Photo-by-Nick-Lund-NPCA-2014-feature-scaled.jpg
667
1500
Intern FracTracker
https://www.fractracker.org/a5ej20sjfwe/wp-content/uploads/2025/09/2025-Wordmark-Logo.png
Intern FracTracker2019-10-10 11:50:142021-04-28 11:55:45How State Regulations Hold Us back and What Other Countries are doing about Fracking
https://www.fractracker.org/a5ej20sjfwe/wp-content/uploads/2019/10/Oil-and-gas-drilling-in-ND.-Photo-by-Nick-Lund-NPCA-2014-feature-scaled.jpg
667
1500
Intern FracTracker
https://www.fractracker.org/a5ej20sjfwe/wp-content/uploads/2025/09/2025-Wordmark-Logo.png
Intern FracTracker2019-10-10 11:50:142021-04-28 11:55:45How State Regulations Hold Us back and What Other Countries are doing about Fracking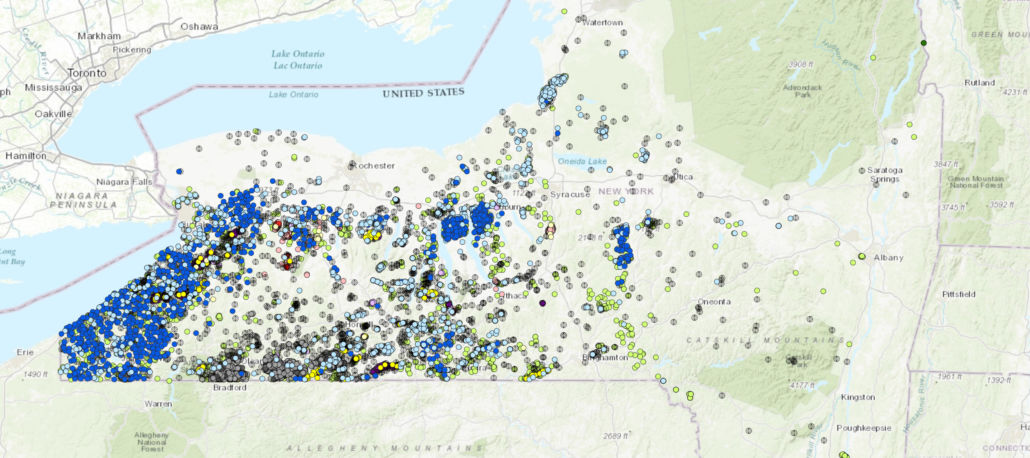 https://www.fractracker.org/a5ej20sjfwe/wp-content/uploads/2019/09/2018-NYS-Oil-and-Gas-Wells-feature-image-2-scaled.jpg
667
1500
Guest Author
https://www.fractracker.org/a5ej20sjfwe/wp-content/uploads/2025/09/2025-Wordmark-Logo.png
Guest Author2019-09-17 09:00:492021-04-15 14:56:25New Method for Locating Abandoned Oil and Gas Wells is Tested in New York State
https://www.fractracker.org/a5ej20sjfwe/wp-content/uploads/2019/09/2018-NYS-Oil-and-Gas-Wells-feature-image-2-scaled.jpg
667
1500
Guest Author
https://www.fractracker.org/a5ej20sjfwe/wp-content/uploads/2025/09/2025-Wordmark-Logo.png
Guest Author2019-09-17 09:00:492021-04-15 14:56:25New Method for Locating Abandoned Oil and Gas Wells is Tested in New York State https://www.fractracker.org/a5ej20sjfwe/wp-content/uploads/2019/11/OHSecretChem.png
1421
1100
Shannon Smith
https://www.fractracker.org/a5ej20sjfwe/wp-content/uploads/2025/09/2025-Wordmark-Logo.png
Shannon Smith2019-09-12 15:42:582021-06-11 15:00:22Ohio’s Secret Fracking Chemicals
https://www.fractracker.org/a5ej20sjfwe/wp-content/uploads/2019/11/OHSecretChem.png
1421
1100
Shannon Smith
https://www.fractracker.org/a5ej20sjfwe/wp-content/uploads/2025/09/2025-Wordmark-Logo.png
Shannon Smith2019-09-12 15:42:582021-06-11 15:00:22Ohio’s Secret Fracking Chemicals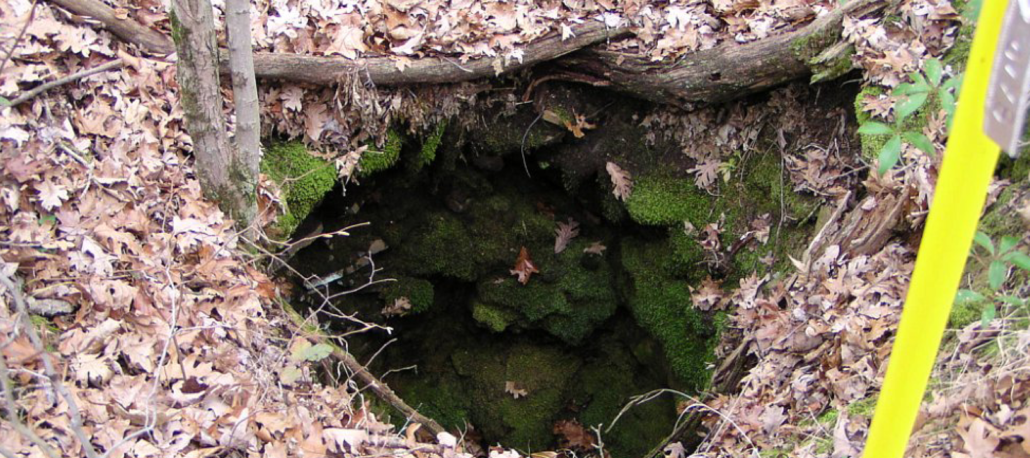 https://www.fractracker.org/a5ej20sjfwe/wp-content/uploads/2019/08/Abandoned-wells-PA-feature.png
667
1500
Intern FracTracker
https://www.fractracker.org/a5ej20sjfwe/wp-content/uploads/2025/09/2025-Wordmark-Logo.png
Intern FracTracker2019-08-08 14:17:382025-05-02 14:45:21Abandoned Wells in Pennsylvania: We’re Not Doing Enough
https://www.fractracker.org/a5ej20sjfwe/wp-content/uploads/2019/08/Abandoned-wells-PA-feature.png
667
1500
Intern FracTracker
https://www.fractracker.org/a5ej20sjfwe/wp-content/uploads/2025/09/2025-Wordmark-Logo.png
Intern FracTracker2019-08-08 14:17:382025-05-02 14:45:21Abandoned Wells in Pennsylvania: We’re Not Doing Enough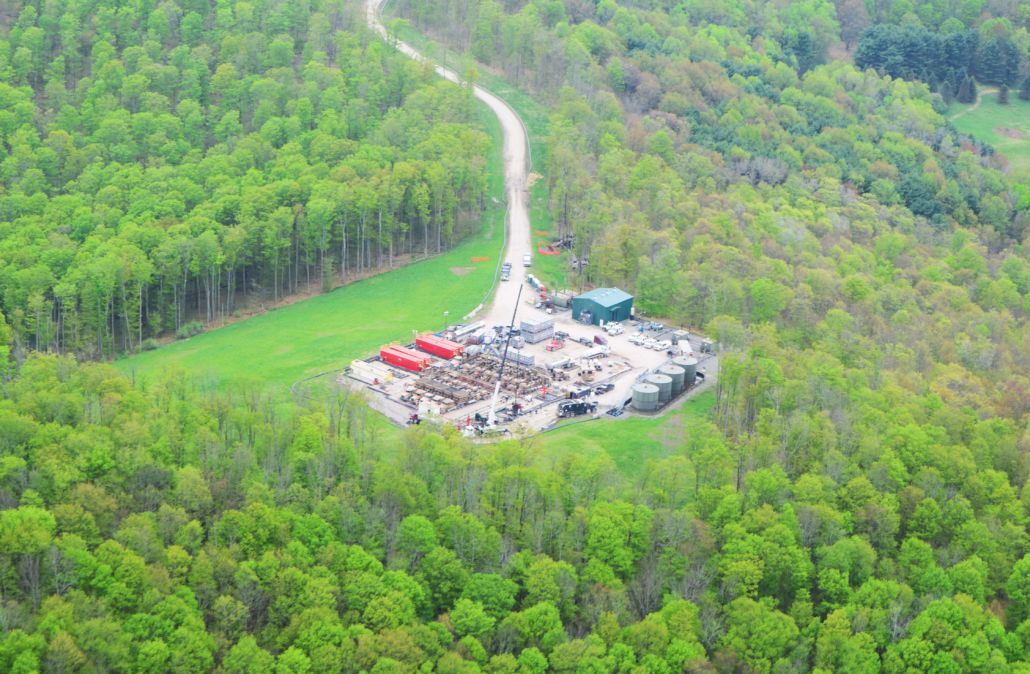 https://www.fractracker.org/a5ej20sjfwe/wp-content/uploads/2019/07/DSC_0624_LowRes-scaled.jpg
982
1500
Shannon Smith
https://www.fractracker.org/a5ej20sjfwe/wp-content/uploads/2025/09/2025-Wordmark-Logo.png
Shannon Smith2019-08-07 09:36:032026-04-28 15:34:37Wildness Lost – Pine Creek
https://www.fractracker.org/a5ej20sjfwe/wp-content/uploads/2019/07/DSC_0624_LowRes-scaled.jpg
982
1500
Shannon Smith
https://www.fractracker.org/a5ej20sjfwe/wp-content/uploads/2025/09/2025-Wordmark-Logo.png
Shannon Smith2019-08-07 09:36:032026-04-28 15:34:37Wildness Lost – Pine Creek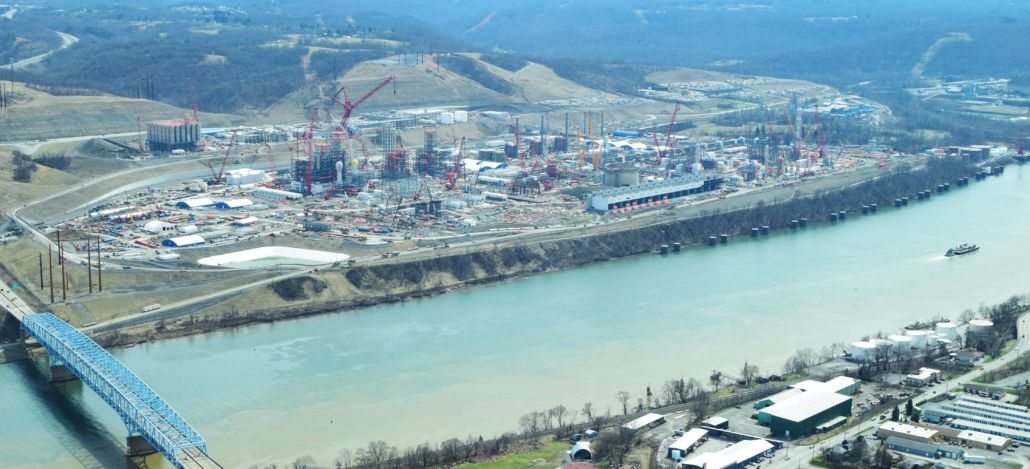 https://www.fractracker.org/a5ej20sjfwe/wp-content/uploads/2019/07/Cracker-Plant-2-scaled.jpg
683
1500
Ted Auch, PhD
https://www.fractracker.org/a5ej20sjfwe/wp-content/uploads/2025/09/2025-Wordmark-Logo.png
Ted Auch, PhD2019-07-23 14:37:052021-04-15 14:56:27The Underlying Politics and Unconventional Well Fundamentals of an Appalachian Storage Hub
https://www.fractracker.org/a5ej20sjfwe/wp-content/uploads/2019/07/Cracker-Plant-2-scaled.jpg
683
1500
Ted Auch, PhD
https://www.fractracker.org/a5ej20sjfwe/wp-content/uploads/2025/09/2025-Wordmark-Logo.png
Ted Auch, PhD2019-07-23 14:37:052021-04-15 14:56:27The Underlying Politics and Unconventional Well Fundamentals of an Appalachian Storage Hub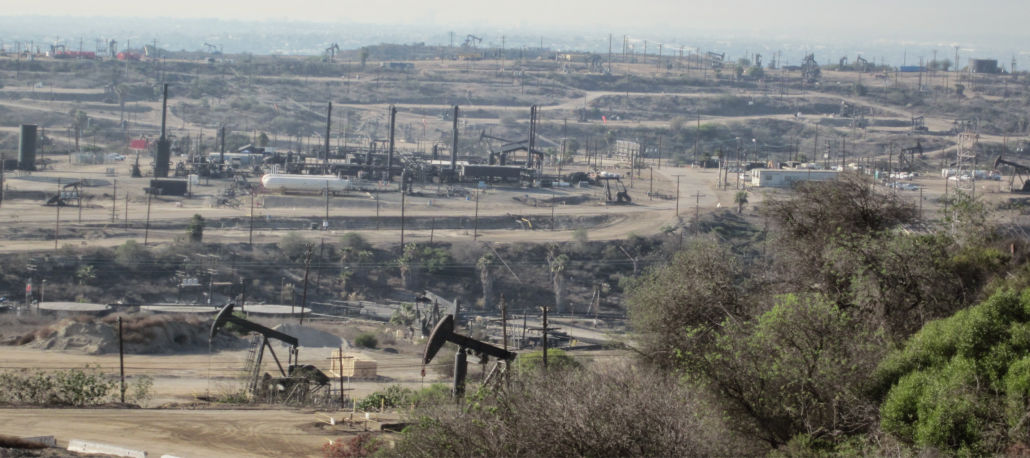 https://www.fractracker.org/a5ej20sjfwe/wp-content/uploads/2019/07/inglewood-field-ca-feature-1-scaled.jpg
667
1500
Kyle Ferrar, MPH
https://www.fractracker.org/a5ej20sjfwe/wp-content/uploads/2025/09/2025-Wordmark-Logo.png
Kyle Ferrar, MPH2019-07-11 14:48:462021-04-15 14:56:28Permitting New Oil and Gas Wells Under the Newsom Administration
https://www.fractracker.org/a5ej20sjfwe/wp-content/uploads/2019/07/inglewood-field-ca-feature-1-scaled.jpg
667
1500
Kyle Ferrar, MPH
https://www.fractracker.org/a5ej20sjfwe/wp-content/uploads/2025/09/2025-Wordmark-Logo.png
Kyle Ferrar, MPH2019-07-11 14:48:462021-04-15 14:56:28Permitting New Oil and Gas Wells Under the Newsom Administration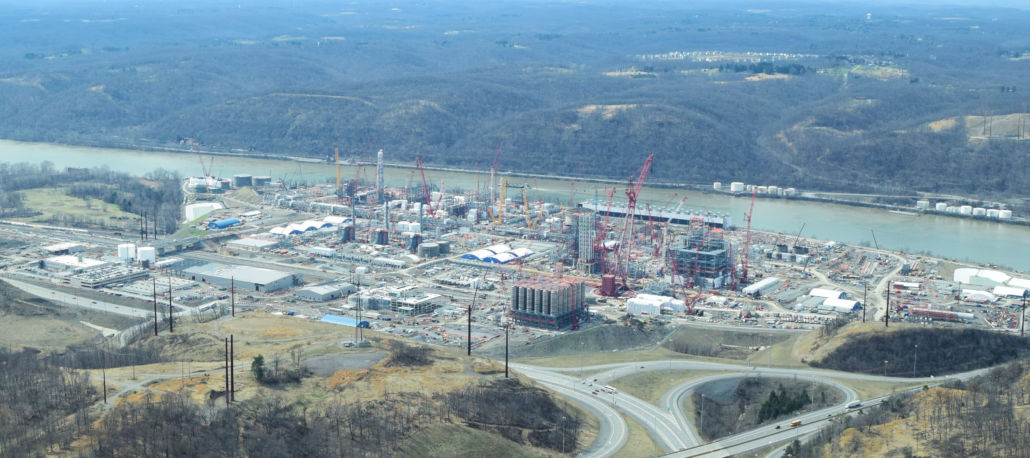 https://www.fractracker.org/a5ej20sjfwe/wp-content/uploads/2019/07/Beaver-Cracker-Plant-Feature-scaled.jpg
667
1500
Erica Jackson
https://www.fractracker.org/a5ej20sjfwe/wp-content/uploads/2025/09/2025-Wordmark-Logo.png
Erica Jackson2019-07-10 09:33:552022-02-15 10:54:51Mapping the Petrochemical Build-Out Along the Ohio River
https://www.fractracker.org/a5ej20sjfwe/wp-content/uploads/2019/07/Beaver-Cracker-Plant-Feature-scaled.jpg
667
1500
Erica Jackson
https://www.fractracker.org/a5ej20sjfwe/wp-content/uploads/2025/09/2025-Wordmark-Logo.png
Erica Jackson2019-07-10 09:33:552022-02-15 10:54:51Mapping the Petrochemical Build-Out Along the Ohio River https://www.fractracker.org/a5ej20sjfwe/wp-content/uploads/2019/06/SignalHill_DavidMcNew_GettyImages_edit.jpg
400
900
Kyle Ferrar, MPH
https://www.fractracker.org/a5ej20sjfwe/wp-content/uploads/2025/09/2025-Wordmark-Logo.png
Kyle Ferrar, MPH2019-07-02 12:03:382021-04-15 14:56:29Impact of a 2,500′ Oil and Gas Well Setback in California
https://www.fractracker.org/a5ej20sjfwe/wp-content/uploads/2019/06/SignalHill_DavidMcNew_GettyImages_edit.jpg
400
900
Kyle Ferrar, MPH
https://www.fractracker.org/a5ej20sjfwe/wp-content/uploads/2025/09/2025-Wordmark-Logo.png
Kyle Ferrar, MPH2019-07-02 12:03:382021-04-15 14:56:29Impact of a 2,500′ Oil and Gas Well Setback in California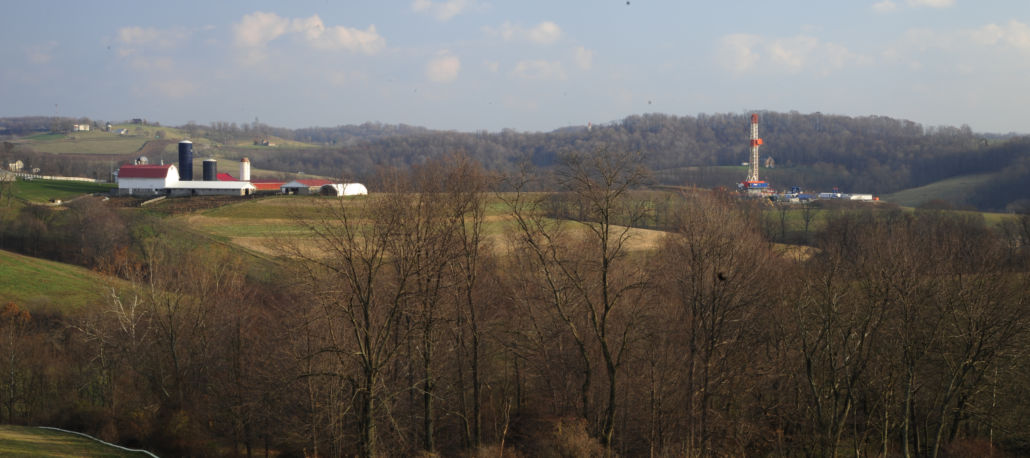 https://www.fractracker.org/a5ej20sjfwe/wp-content/uploads/2019/06/Washington-County-Rig-2-scaled.jpg
667
1500
Matt Kelso, BA
https://www.fractracker.org/a5ej20sjfwe/wp-content/uploads/2025/09/2025-Wordmark-Logo.png
Matt Kelso, BA2019-06-10 12:07:422021-04-15 14:56:30Production and Location Trends in PA: A Moving Target
https://www.fractracker.org/a5ej20sjfwe/wp-content/uploads/2019/06/Washington-County-Rig-2-scaled.jpg
667
1500
Matt Kelso, BA
https://www.fractracker.org/a5ej20sjfwe/wp-content/uploads/2025/09/2025-Wordmark-Logo.png
Matt Kelso, BA2019-06-10 12:07:422021-04-15 14:56:30Production and Location Trends in PA: A Moving Target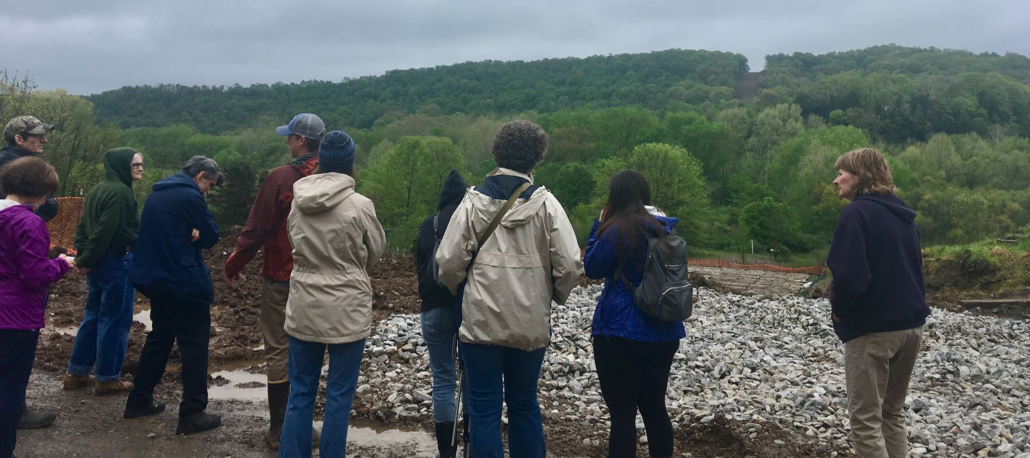 https://www.fractracker.org/a5ej20sjfwe/wp-content/uploads/2019/05/PipelineConstructionFeature.png
667
1500
Erica Jackson
https://www.fractracker.org/a5ej20sjfwe/wp-content/uploads/2025/09/2025-Wordmark-Logo.png
Erica Jackson2019-05-08 08:27:302021-04-15 14:56:31The Falcon Public Monitoring Project
https://www.fractracker.org/a5ej20sjfwe/wp-content/uploads/2019/05/PipelineConstructionFeature.png
667
1500
Erica Jackson
https://www.fractracker.org/a5ej20sjfwe/wp-content/uploads/2025/09/2025-Wordmark-Logo.png
Erica Jackson2019-05-08 08:27:302021-04-15 14:56:31The Falcon Public Monitoring Project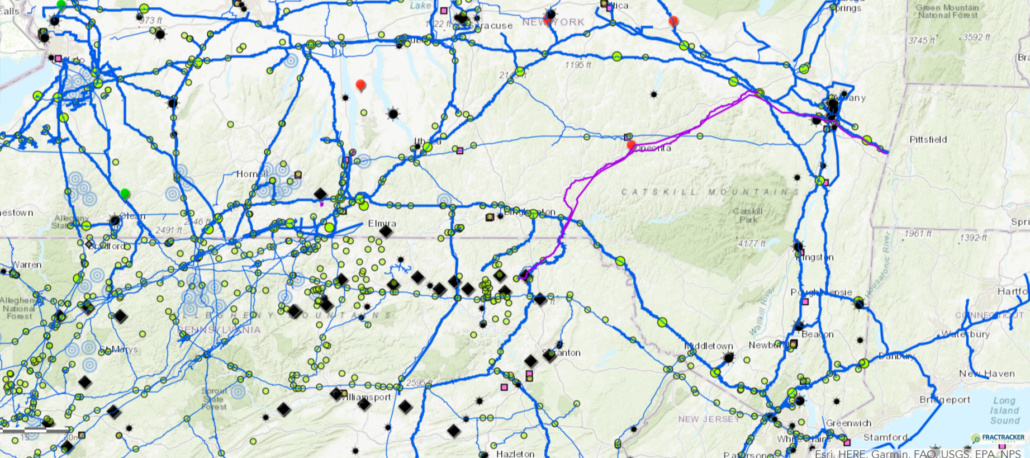 https://www.fractracker.org/a5ej20sjfwe/wp-content/uploads/2019/04/YouAreHereMap2.png
667
1500
Guest Author
https://www.fractracker.org/a5ej20sjfwe/wp-content/uploads/2025/09/2025-Wordmark-Logo.png
Guest Author2019-04-24 15:49:052021-04-15 14:56:34Release: The 2019 You Are Here map launches, showing New York’s hurdles to climate leadership
https://www.fractracker.org/a5ej20sjfwe/wp-content/uploads/2019/03/IdleWellsHathaway_resize.jpg
400
900
Kyle Ferrar, MPH
https://www.fractracker.org/a5ej20sjfwe/wp-content/uploads/2025/09/2025-Wordmark-Logo.png
Kyle Ferrar, MPH2019-04-03 11:30:582021-04-15 14:56:34Idle Wells are a Major Risk
https://www.fractracker.org/a5ej20sjfwe/wp-content/uploads/2019/04/YouAreHereMap2.png
667
1500
Guest Author
https://www.fractracker.org/a5ej20sjfwe/wp-content/uploads/2025/09/2025-Wordmark-Logo.png
Guest Author2019-04-24 15:49:052021-04-15 14:56:34Release: The 2019 You Are Here map launches, showing New York’s hurdles to climate leadership
https://www.fractracker.org/a5ej20sjfwe/wp-content/uploads/2019/03/IdleWellsHathaway_resize.jpg
400
900
Kyle Ferrar, MPH
https://www.fractracker.org/a5ej20sjfwe/wp-content/uploads/2025/09/2025-Wordmark-Logo.png
Kyle Ferrar, MPH2019-04-03 11:30:582021-04-15 14:56:34Idle Wells are a Major Risk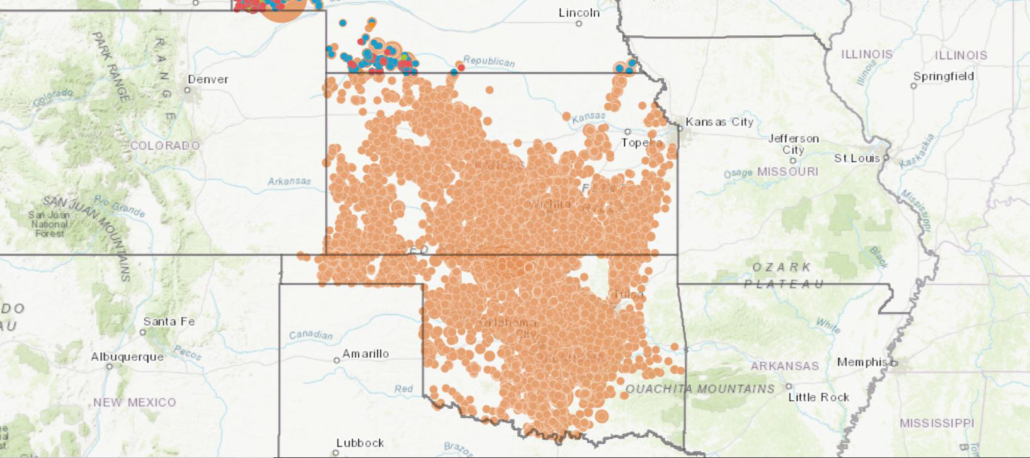 https://www.fractracker.org/a5ej20sjfwe/wp-content/uploads/2019/03/KSOKNE-Injection-Wells.png
667
1500
Ted Auch, PhD
https://www.fractracker.org/a5ej20sjfwe/wp-content/uploads/2025/09/2025-Wordmark-Logo.png
Ted Auch, PhD2019-03-07 14:32:242021-04-15 14:56:54Wicked Witch of the Waste
https://www.fractracker.org/a5ej20sjfwe/wp-content/uploads/2019/03/KSOKNE-Injection-Wells.png
667
1500
Ted Auch, PhD
https://www.fractracker.org/a5ej20sjfwe/wp-content/uploads/2025/09/2025-Wordmark-Logo.png
Ted Auch, PhD2019-03-07 14:32:242021-04-15 14:56:54Wicked Witch of the Waste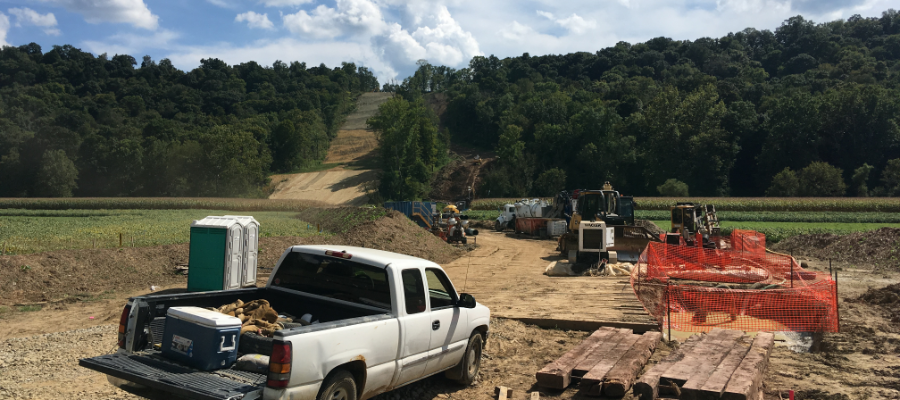 https://www.fractracker.org/a5ej20sjfwe/wp-content/uploads/2019/02/PipelineConstructionPA.png
400
900
Karen Edelstein
https://www.fractracker.org/a5ej20sjfwe/wp-content/uploads/2025/09/2025-Wordmark-Logo.png
Karen Edelstein2019-02-28 19:24:532021-04-15 14:56:54The Growing Web of Oil and Gas Pipelines
https://www.fractracker.org/a5ej20sjfwe/wp-content/uploads/2019/02/San-Bruno-Aftermath-feature-image.png
400
900
Guest Author
https://www.fractracker.org/a5ej20sjfwe/wp-content/uploads/2025/09/2025-Wordmark-Logo.png
Guest Author2019-02-08 19:21:012021-04-15 14:56:55Unnatural Disasters
https://www.fractracker.org/a5ej20sjfwe/wp-content/uploads/2019/02/PipelineConstructionPA.png
400
900
Karen Edelstein
https://www.fractracker.org/a5ej20sjfwe/wp-content/uploads/2025/09/2025-Wordmark-Logo.png
Karen Edelstein2019-02-28 19:24:532021-04-15 14:56:54The Growing Web of Oil and Gas Pipelines
https://www.fractracker.org/a5ej20sjfwe/wp-content/uploads/2019/02/San-Bruno-Aftermath-feature-image.png
400
900
Guest Author
https://www.fractracker.org/a5ej20sjfwe/wp-content/uploads/2025/09/2025-Wordmark-Logo.png
Guest Author2019-02-08 19:21:012021-04-15 14:56:55Unnatural Disasters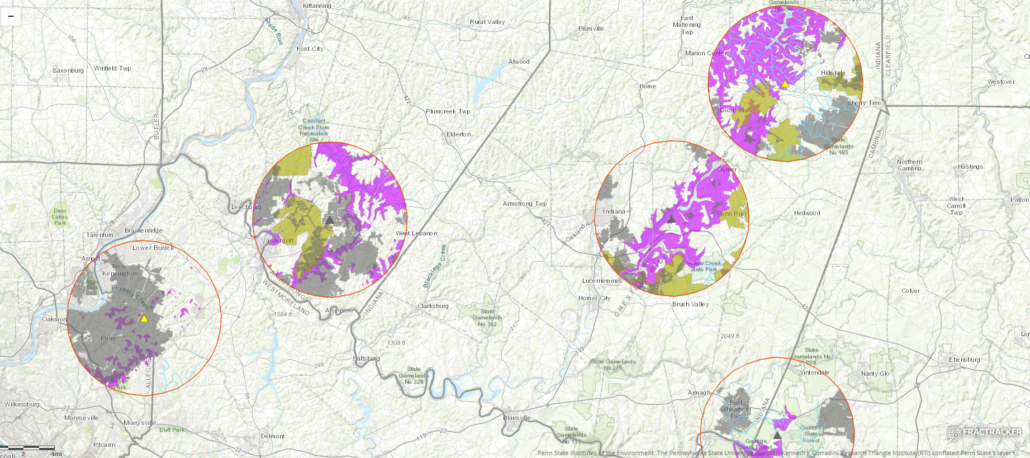 https://www.fractracker.org/a5ej20sjfwe/wp-content/uploads/2019/01/SWD_PA2.png
667
1500
Matt Kelso, BA
https://www.fractracker.org/a5ej20sjfwe/wp-content/uploads/2025/09/2025-Wordmark-Logo.png
Matt Kelso, BA2019-01-31 10:54:552021-04-15 14:56:56Getting Rid of All of that Waste – Increasing Use of Oil and Gas Injection Wells in Pennsylvania
https://www.fractracker.org/a5ej20sjfwe/wp-content/uploads/2019/01/SWD_PA2.png
667
1500
Matt Kelso, BA
https://www.fractracker.org/a5ej20sjfwe/wp-content/uploads/2025/09/2025-Wordmark-Logo.png
Matt Kelso, BA2019-01-31 10:54:552021-04-15 14:56:56Getting Rid of All of that Waste – Increasing Use of Oil and Gas Injection Wells in Pennsylvania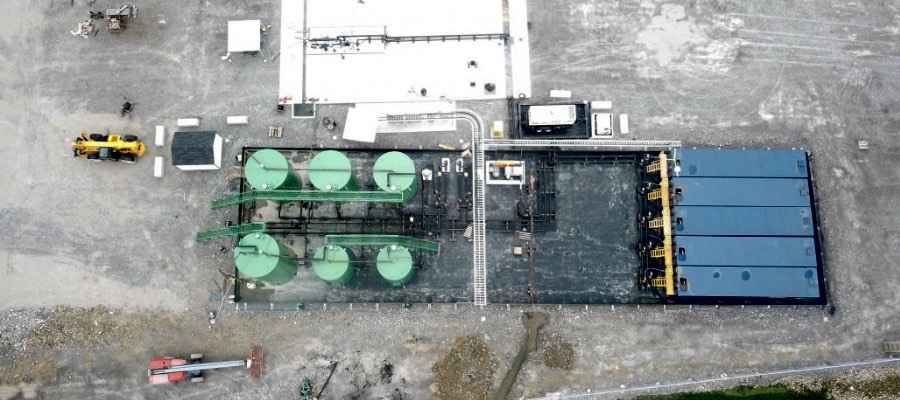 https://www.fractracker.org/a5ej20sjfwe/wp-content/uploads/2019/01/InjectionWell-Sky-Feature.jpg
400
900
Ted Auch, PhD
https://www.fractracker.org/a5ej20sjfwe/wp-content/uploads/2025/09/2025-Wordmark-Logo.png
Ted Auch, PhD2019-01-09 14:37:272021-04-15 14:56:57A Disturbing Tale of Diminishing Returns in Ohio
https://www.fractracker.org/a5ej20sjfwe/wp-content/uploads/2019/01/InjectionWell-Sky-Feature.jpg
400
900
Ted Auch, PhD
https://www.fractracker.org/a5ej20sjfwe/wp-content/uploads/2025/09/2025-Wordmark-Logo.png
Ted Auch, PhD2019-01-09 14:37:272021-04-15 14:56:57A Disturbing Tale of Diminishing Returns in Ohio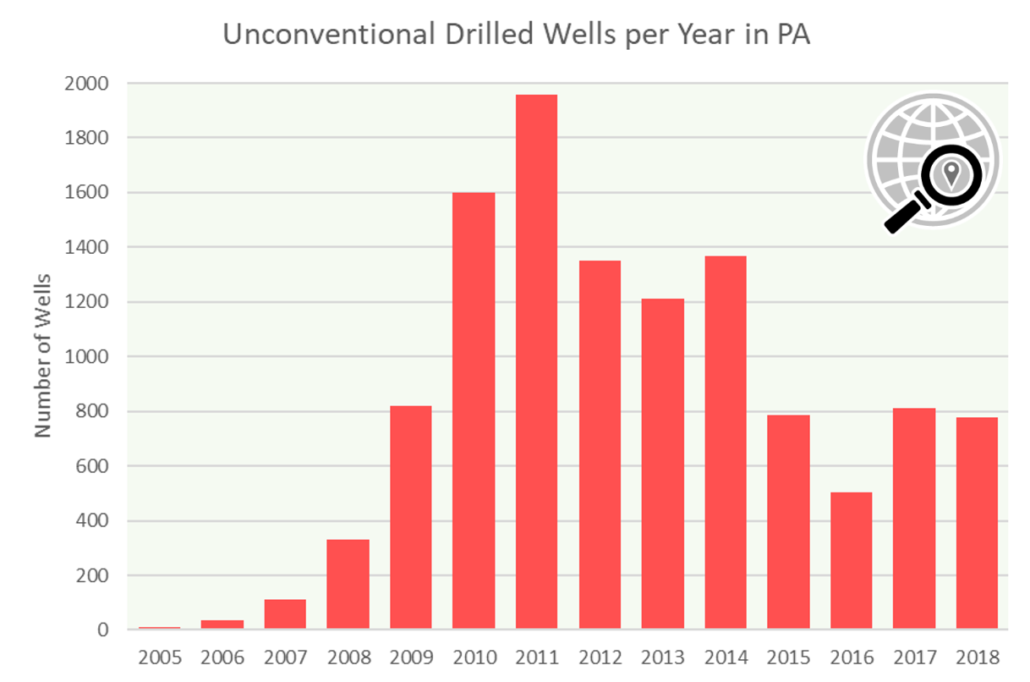 https://www.fractracker.org/a5ej20sjfwe/wp-content/uploads/2019/01/UncWellsPerYear_2005_2018.png
806
1218
Matt Kelso, BA
https://www.fractracker.org/a5ej20sjfwe/wp-content/uploads/2025/09/2025-Wordmark-Logo.png
Matt Kelso, BA2019-01-08 14:14:382021-04-15 14:57:01Pennsylvania Drilling Trends in 2018
https://www.fractracker.org/a5ej20sjfwe/wp-content/uploads/2019/01/UncWellsPerYear_2005_2018.png
806
1218
Matt Kelso, BA
https://www.fractracker.org/a5ej20sjfwe/wp-content/uploads/2025/09/2025-Wordmark-Logo.png
Matt Kelso, BA2019-01-08 14:14:382021-04-15 14:57:01Pennsylvania Drilling Trends in 2018![]()
216 Franklin St, Suite 400, Johnstown, PA 15901
Phone: +1 (717) 303-0403 | info@fractracker.org
FracTracker Alliance is a 501(c)3 non-profit: Tax identification number: 80-0844297